
Abstract
Background
Cardiovascular diseases are a group of disorders of the heart and blood vessels. Globally an estimated 17.9 million people died from cardiovascular diseases, which covers 31% of all global deaths, and the three quarters taking place in developing countries. Hypertension is the major cause of cardiovascular diseases. Its influence is high with other risk factors. This study aimed to determine the major risk factors of cardiovascular disease among hypertensive patients at Jimma University Medical Center.
Methods
Using December to January 2017 hypertension-related report of Jimma University Medical Center (JUMC), a retrospective cohort study type was conducted on purposively selected 343 patients. Three nurses from JUMC participated in the data collection, and the data were fitted using the Cox-Proportional Hazard (Cox-PH) model.
Results
About 138 (40.23%) patients were experienced cardiovascular disease at 28 months median time. From the Cox-PH model, the hazard ratio and 95% CI of age (HR = 1.0495, 95% CI: 1.0250-1.0747), urban (HR = 2.1225, 95% CI: 1.3813-3.2613), diabetes mellitus (HR = 1.702, 95% CI: 1.0082-2.8731), proteinuria (HR = 1.8749, 95% CI: 1.2675-2.7734), two drug users (HR = 0.2533, 95% CI: 0.1376-0.4662), systolic blood pressure (HR = 1.0343, 95% CI: 1.0147-1.0542) and pulse rate (HR = 1.0111, 95% CI: 0.9933-1.0293).
Conclusion
The presence of proteinuria, diabetes mellitus, and being an urban resident had a great impact on the cardiovascular diseases of hypertensive patients.
Introduction
Cardiovascular disease complications (CVD) are complications raised, due to disorders of the heart and the circulatory system. It includes coronary heart disease, stroke, heart attack, aortic, cerebrovascular, rheumatic heart disease, and congenital heart disease. 1 Globally about 17.9 million people are died from CVD each year, representing 31% of all global deaths, and over three-quarters of this taking place in low- and middle-income countries. CVD is a unique double burden challenge for the whole of Africa. 2 Traditionally, in Africa, communicable diseases like HIV-AIDS account for the greatest burden of mortality. 3 This burden is now fast shifting towards chronic non-communicable diseases, which the majority of is CVD. 4
CVD complications also are growing and becoming a double burden in Ethiopia. 5 In the country, representative surveys on NCD and their risk factors are not available. 6 However, some hospital-based studies in the country such as in Addis Ababa on investigating a cause of death using verbal autopsy showed 24% of deaths due to CVD. 7 As a result, the impact of CVD and associated risk factors, especially hypertension (HTN) is the current issue.
Many risk factors are contributed to the development of CVD. Among all the risk factors for CVD, the major cause of leading CVD is hypertension. 8 Hypertension can independently contribute to the risk of cardiovascular events, but its impact is high with associated risk factors. From Framingham Heart Study displays, about 17% of women and 19% of men with hypertension had this as their only CVD risk factor, while 32% of women and 30% of men with this hypertension had 3 or more additional risk factors. 9 Therefore, the main goal of this study was to identify those risk factors that lead hypertensive patients to CVD at Jimma University Medical Center (JUMC).
Methods
The Study Area, Design, and Target Population
A retrospective cohort study type was conducted at JUMC, which is one of the oldest hospitals located in Jimma city, Ethiopia. JUMC provides services for 15 million populations. The target population of this study was hypertensive patients who were admitted from January to December of 2017 at JUMC.
Inclusion and Exclusion Criteria
In 2017, all patients who visited JUMC at least two times and those whose charts were available, clearly written, and who had a chart that contains a complete history of the disease were included in this study. Patients who visited the hospital only one time, those whose charts were not available, who have the chart with unclear and incomplete disease history were excluded from this study. Also, pregnant women were excluded, because they may not have common risk factors with others.
Sampling Technique and Sample Size Determination
Using December to January 2017 hypertension-related report of JUMC, the total number of new patients admitted in the given year is about 918 patients. Out of these, 343 patients were purposively selected based on the inclusion and exclusion criteria stated above.
The Study Variables
The response variable of this study is time (months) to CVD of hypertensive patients. The time of the study is from December 2017 to January 2019, for 36 months of follow-up time. From the adopted literature the considered independent variables were age, sex, residence place, diabetes mellitus, proteinuria, number of drugs, baseline CVD, hyperlipidemia, smoking status, baseline systolic blood pressure (SBP), diastolic blood pressure (DBP), and pulse rate (PR).
Method of Data Collection
The time, status of the patients, and different independent variables were obtained from the patient's chart, which contains a complete recorded clinical and medical history of the patient. For each patient, time is the length (months) from the admission of patients to the status of the disease. The occurrence of an event was recorded when patients developed at least one of the different types of CVD. Whereas the censored observation was recorded when patients died, dropouts in their follow-up, went to other hospitals, or at the end of the study, when they did not develop any CVD. After they trained on the objectives of the study and the way to record the value for each variable, three nurses from JUMC were participated to review and record the information from the patient's chart. The investigators were supervised, follow-up and daily checked the completeness and consistency of the data.
The Statistical Method
The data contains survival time, censored observation, and different independent variables. For this, the appropriate statistical model is the survival model, which is the statistical model that focuses on questions related to timing and duration until the occurrence of an event. The model examines the hazard rate, which is the conditional probability that the disease occurs at a particular time interval (t). The survival models applied in this study were Kaplan-Meier (KM) to estimate the survival function, log-rank test to make a comparison between two or more groups of patients, and the Cox-Proportional Hazard (Cox-PH) model. The Cox-PH model describes the relationship between the CVD event, as expressed by the hazard function and a set of independent variables. It needs the assumption of PH and linearity between covariates and log-hazards. The regression coefficients in the Cox-PH model are estimated through the partial likelihood method. The model is given as:

Data Analysis Procedure
The checked and coded data in Epi Info version 7 were exported to IBM SPSS Version 25 and then imported to R statistical software for analysis. Then, the statistical method like mean, standard deviation, KM, log-rank test, and Cox-PH model was applied for analysis. Finally, for testing the violation of PH assumption in the Cox-PH model, the test for each variable and global test for the entire model was computed based on scaled Schoenfeld residuals. Including the test of all variables applied in the model, the global test (Chisq = 11.53333, P = .566) was not statistically significant at .05 level of significance, which showed that PH assumption met for all variables indicating the Schoenfeld residuals for those variables were not related to the survival time.
Results
Out of the total 343 hypertensive patients, 138 (40.23%) were experienced CVD with a median time of 28 months. The mean ± standard deviation age of patients is 54.7 ± 12.7 years. Of 194 (56.6%) males in the study, 103 (74.6%) of were experienced CVD with a shorter median time (19 months) than females. With about a half shorter median time, 96 (69.6%) patients from urban communities were experienced CVD. The majority of patients 232 (67.6%) had no DM, and 102 (73.9%) were experienced CVD. About 168 (49.0%), 96 (28.0%), 98 (28.6%) and 193 (56.3%) patients had proteinuria, had baseline CVD, were smokers and had hyperlipidemia respectively. A relatively similar number of one drug users 121 (35.3%), two drug users 120 (35%), and more than two drug users 102 (29.7%) were involved, of which 47 (34.1%), 24 (17.4%), and 67 (48.6%) were experienced CVD respectively. More than two drug user patients have the shortest median experienced time (16 months). The mean ± standard deviation of DBP, SBP, and PR was 103.7 ± 11.1 mmHg, 159.4 ± 13.9 mmHg, and 83.5 ± 15.4 BPM respectively (Table 1).
Appropriate Summary (Mean ± SD or Frequency and per cent) for all Variables.

Source: Jimma University Medical Center 2017. CVD = Cardiovascular disease, SBP = Systolic Blood Pressure, DBP = Diastolic Blood Pressure, PR = Pulse rate, SD = Standard Deviation.
Cumulative Hazard Plot for Cardiovascular Disease Risks
The cumulative hazard was plotted to show the pattern of estimated hazard probability on experiencing CVD over time (Figure 1). From the plot, the slope of the cumulative hazard function is increasing over time. This indicates that, as the time for the patients after they being hypertensive patient progresses, the hazard of experiencing CVD becomes too high.
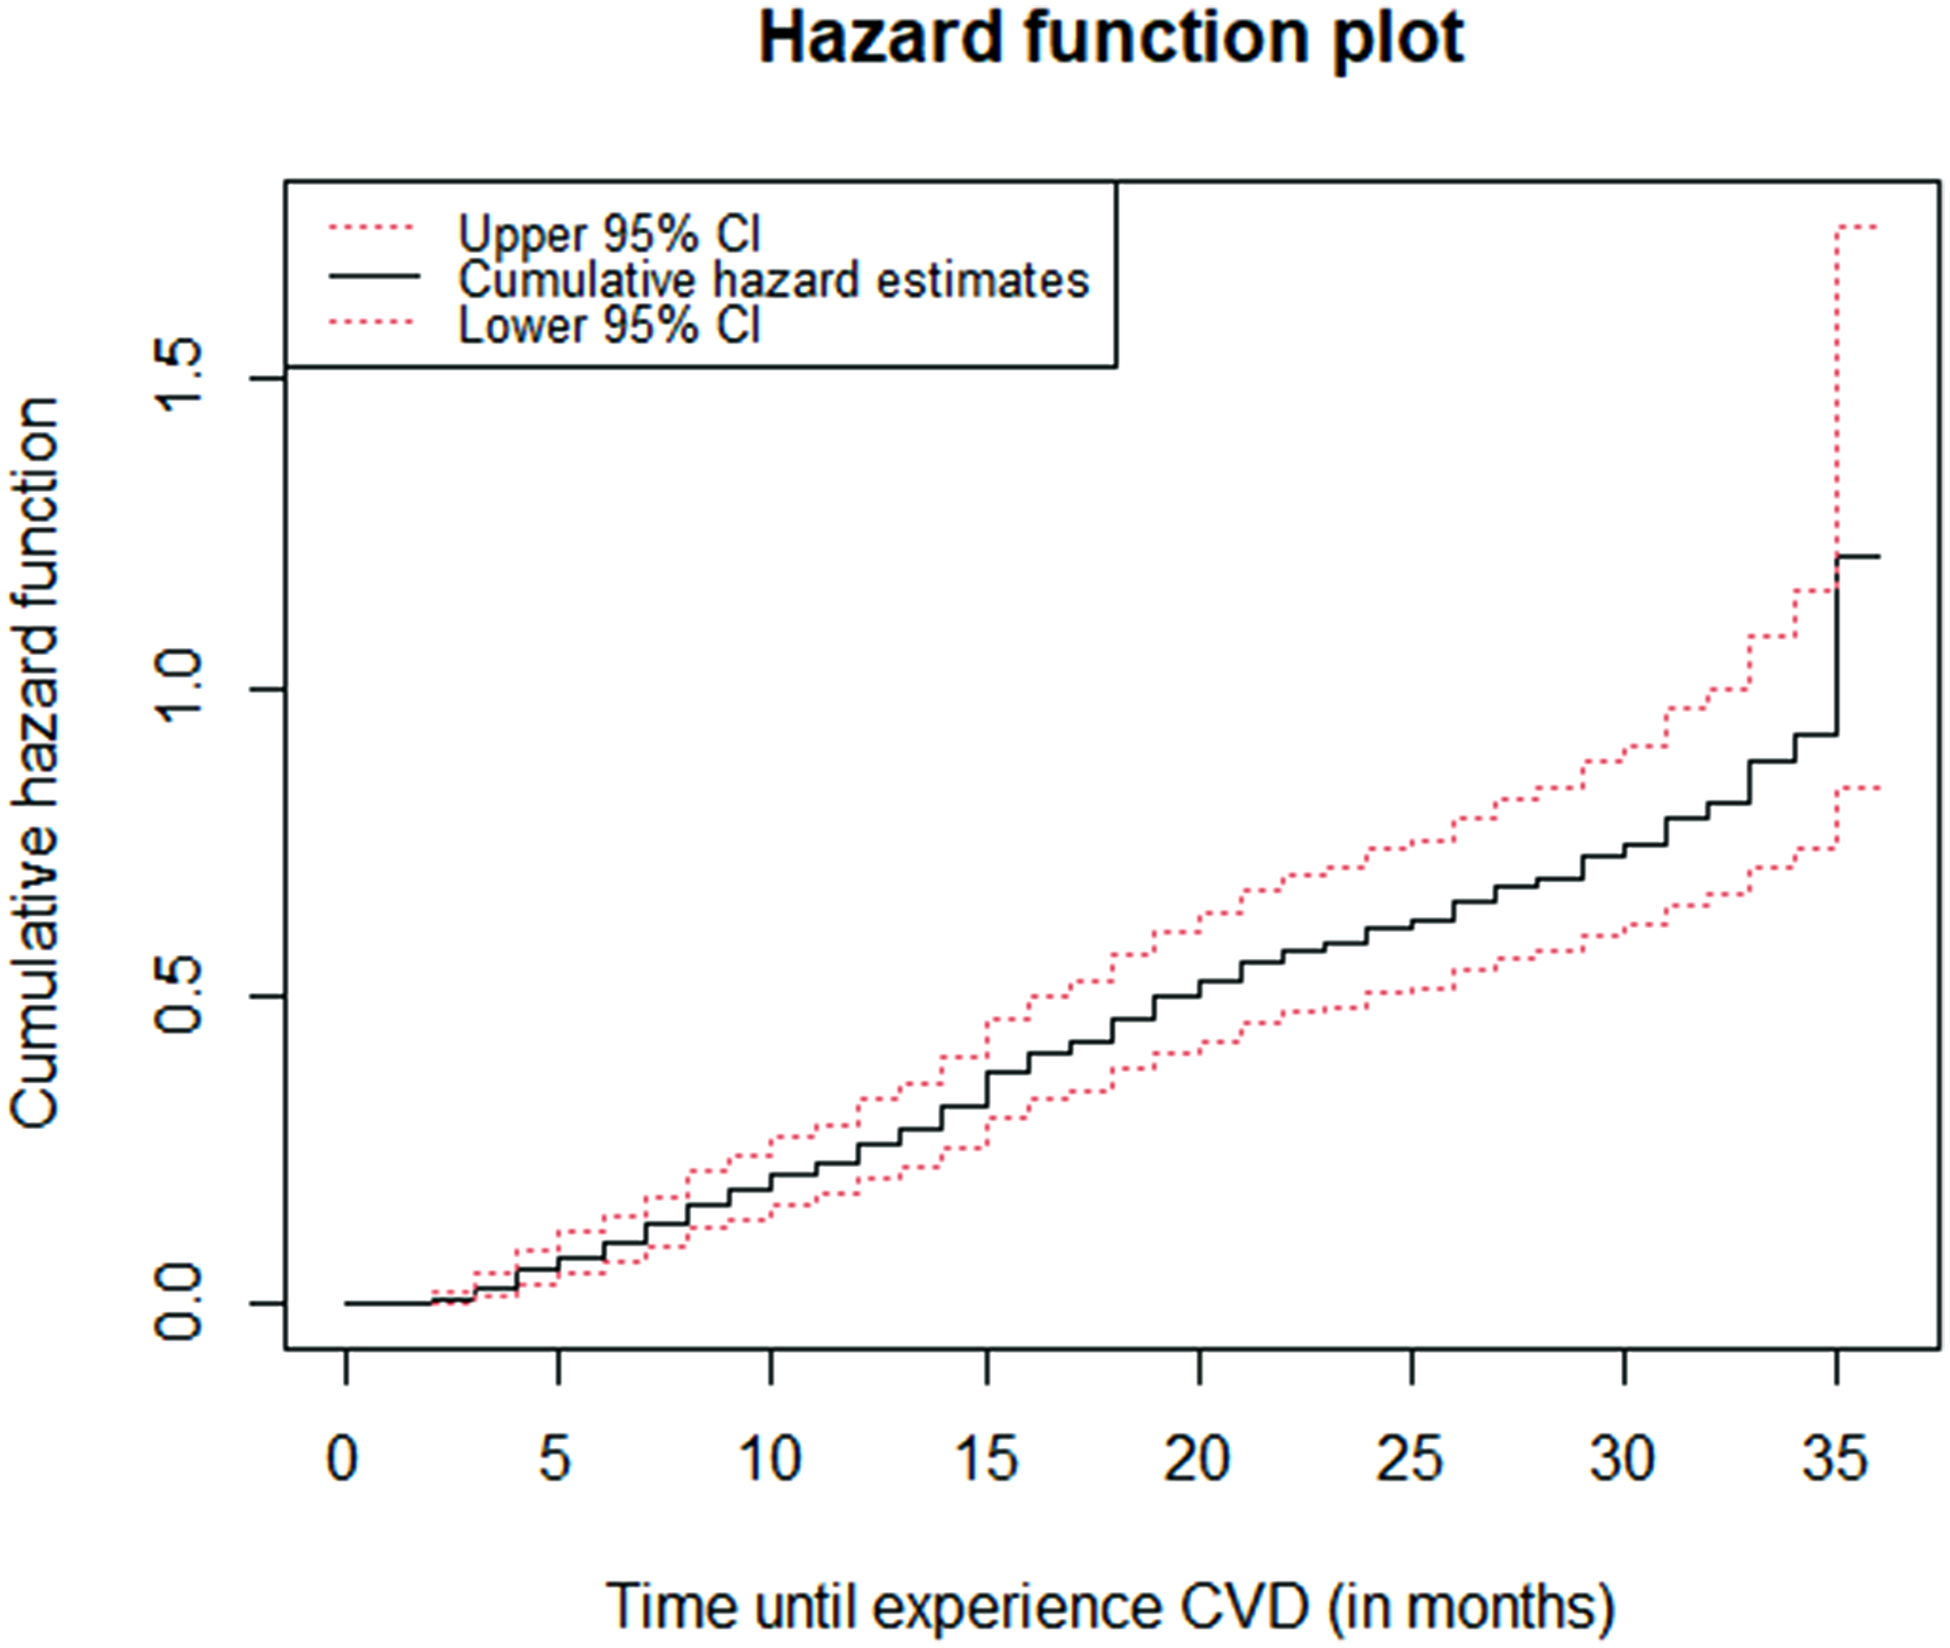
The cumulative hazard plot of cardiovascular disease risk over time.
Survival Function Comparison of Patients Using Kaplan-Meier and log-Rank Test
Except for proteinuria and smoking status, there is a statistically significant difference among patients grouped based on sex, residence place, diabetes mellitus, baseline CVD, and hyperlipidemia status (Table 2).
Log-Rank Test for Comparison of a Group of Patients.
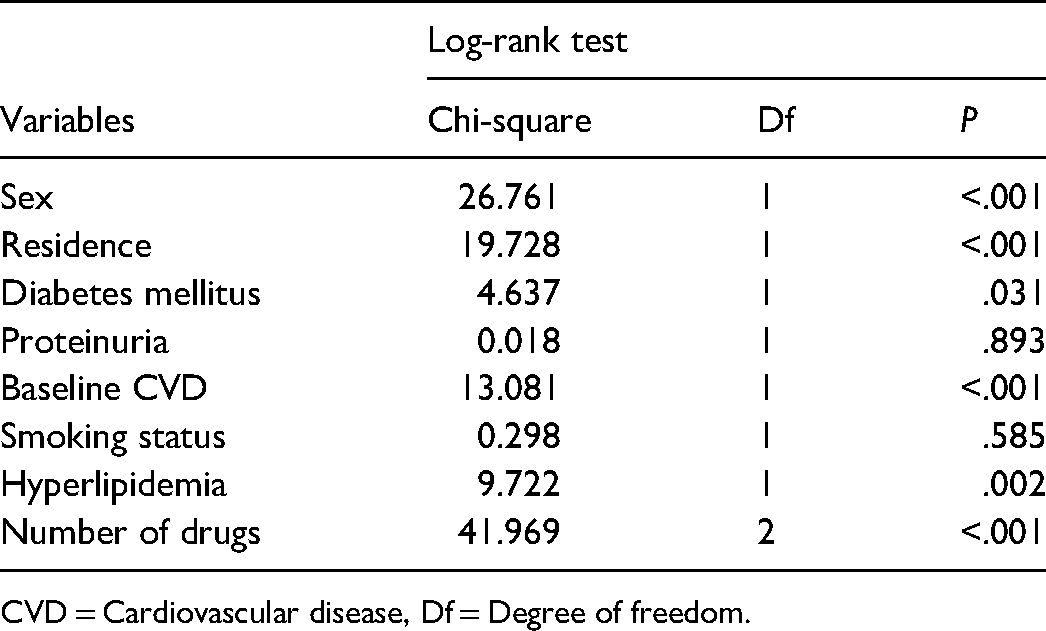
CVD = Cardiovascular disease, Df = Degree of freedom.
Graphically, the Kaplan Meier curve was plotted for comparison of survival time among a group of patients (Figure 2). The line for female, rural residents, DM (absent), two drug users, no baseline CVD, and hyperlipidemia (absent) lies above the opposing group(s) line(s). This indicated that they are survived longer from experiencing the disease. Similar to the log-rank test result, no clear differences were observed among patients categorized based on proteinuria and smoking status.

Survival function of a different group of patients plots.
Cox-Proportional Hazard Model Analysis
Holding other variables constant, a one-year increment of the age of patients increases the hazard of experiencing CVD by a factor of 1.0495 or 5% (HR = 1.0495, 95% CI: 1.0250-1.0747). Being from urban communities increases the hazard of experiencing CVD by more than double, as compared to those who were from the rural community (HR = 2.1225, 95% CI: 1.3813-3.2613), considering other variables constant. Controlling others, the hazard of experiencing CVD is about 1.792 higher in patients with diabetes mellitus as compared to those patients without DM (HR = 1.702, 95% CI: 1.0082-2.8731). Compared to patients without proteinuria by considering other variables constant, the hazard of experiencing CVD in patients with proteinuria is about 1.8749 higher (HR = 1.8749, 95% CI: 1.2675-2.7734). Holding others constant, using two drugs combination reduces the hazard of experiencing CVD by a factor of 0.2533 in comparison to using one drug (HR = 0.2533, 95% CI: 0.1376-0.4662). Controlling other variables, for every 1 mmHg increase in SBP, the hazard of experiencing CVD of patients rises by an estimated 3.43% (HR = 1.0343, 95% CI: 1.0147-1.0542). Each additional beat per minute (BPM) of PR rises the hazard of experiencing CVD by a factor of 1.0111 (HR = 1.0111, 95% CI: 0.9933-1.0293), by considering others constant (Table 3).
Cox-Proportional Hazard Model Results for Variables Considered in the Study.

Source: Jimma University Medical Center 2017. CVD = Cardiovascular disease, SBP = Systolic Blood Pressure, DBP = Diastolic Blood Pressure, HR = Hazard ratio, CI = Confidence interval, Se = Standard error, coef = coefficients of variables, Ref = reference category.
Discussion
Hypertension can itself independently contribute to CVD. However, the influence is high with additional risk factors. Therefore, this study was targeted to identify these risk factors that are statistically significant to CVD. Among all variables considered in this study: age, residence place, diabetes mellitus, proteinuria, number of drugs, SBP, and pulse rate were significantly associated with CVD. An increase in the age of patients increases the hazard of experiencing CVD by 5%. This is in line with Framingham Heart Study 11 in which participants were pooled according to the age: <60 years, 60 to 79 years, or ≥80 years, and showed that the absolute risks for CVD associated with increasing BP were increased markedly with increasing age. Another study conducted in China to examine the associations of hypertension onset age with CVD and mortality concluded that the risk for CVD was stronger in a younger age of onset (HR = 2.59, 95% CI: 1.32-5.07). 12
Residence place is also a significant factor for CVD among hypertensive patients. Urban lived patients had about 2 greater chances of experiencing CVD as compared to rural lived patients. This is following the study of Reddy & K Srinath, 2004. 13 This risk of experiencing CVD for urban lived patients maybe, due to the poor quality of city living standards such as availability of safe space for exercise or recreation, increasing pressures from mass marketing, and the availability of unhealthy and cheap food options in urban. 14 However, a study by Anand and Yusuf 15 suggested that the higher income and infrastructures in urban could help to reduce the risk of CVD.
With the existence of HTN, patients who have diabetes mellitus had about 1.7020 greater chance to experience CVD. This is following the HONEST study conducted by Kushiro et al., 16 which concluded as patients with uncontrolled HTN and DM were approximately about 2.8 times higher risk for CVD. It is also in line with findings of Alderman et al. and Kokubo et al.,17,18 which concluded that the CVD rate for hypertensive patients with a history of diabetes was more than double to those without diabetes respectively.
Proteinuria is another important significant factor for CVD among hypertensive patients. The hazard of experiencing CVD in patients with proteinuria is higher about 1.8749 as compared to those who have no proteinuria. The studies of Maione et al.19,20 have a similar conclusion to this finding. This may be when filters in kidneys (glomeruli), which allow only small amounts of protein found in the blood into urine are damaged in some way and release too much protein into the urine. This excess amount of protein released can be a cause for the insufficiency of absorption or impaired filtration when serum proteins are reabsorbed from urine, which may increase the risks for CVD.
The number of drugs given to patients to achieve effective blood pressure control or for controlling one or more comorbidities of the diseases were significantly associated with experiencing CVD. In two drug user patients the hazard of experiencing CVD is less as compared to one drug user. This is in line with different studies conducted across the world. For example, findings of Mancia et al. Whelton et al. Oparil et al. and Pimenta and Oparil21–24 showed that hypertension was not adequately controlled with one drug, and on average it needs three drugs to be controlled effectively the risks of hypertension. However, due to poor understanding of patients on their complex regimens given them and difficulty organization of their schedules to accommodate the regimens, sometimes the risk of experiencing CVD among more than two drug users may be increased. 25
An increase in 1 mmHg of SBP of patients increases the hazard of experiencing CVD by a factor of 1.0343. This is in line with a study conducted on HTN patients by categorizing SBP as elevated (≥140 mmHg), standard (120-139 mmHg), and low (<120 mmHg), and revealed that the incident of CVD was higher in elevated SBP than those in low BP group with (HR = 1.46, 95% CI: 1.26-1.69). 26 However, after adjusting for CVD risk factors, the finding of Ji et al. 27 suggested that baseline SBP levels of 100–129 mmHg were not statistically significant to the risk of CVD. Each additional BPM of the pulse rate increases the hazard of experiencing CVD by a factor of 1.0446. This is similar to the finding of Zhong et al., 28 in which the hazard of developing CVD for hypertensive patients who have a pulse rate of ≥80 BPM is high about 3.19 as compared to patients who have no hypertension and <80 BPM pulse rate.
Conclusion
Among the various risk factors considered in this study, the presence of proteinuria, diabetes mellitus, and being an urban resident had a great impact on the CVD for hypertensive patients. The overall median time of the hypertensive patients to experience CVD is about 28 months with minimum and maximum time of 2 months and 35 months, respectively.
Limitations of the Study
This study used the data recorded for the purposes of the hospital. Due to this, there was a lack of getting the relevant information for this study, and there was a limitation to include more risk factors. For the reason that this study used only the baseline value of age, SBP, and DBP, it did not address the effect of change in age, SBP, and DBP over time. The purposive sampling approach used in this study minimized the sample of participants by excluding more patients from this study, which may have its limitation on estimating the true prevalence of CVD.
Footnotes
Acknowledgments
We acknowledge Jimma University Medical Center for allowing us to use the data, and Madda Walabu University for the financial support.
Declaration of Conflicting Interests
The author(s) declared no potential conflicts of interest with respect to the research, authorship, and/or publication of this article.
Funding
The authors disclosed receipt of the following financial support for the research, authorship, and publication of this article: This study was financially supported by Madda Walabu University.
Availability of Data and Materials
The original data supporting this finding are available from the corresponding author on reasonable request.