
Abstract
Objective:
To examine the quality of provider communication over time considering the increasing emphasis on patient-centered care (PCC). Patient-centered care has been shown to have a positive impact on health outcomes, care experiences, quality-of-life, as well as decreased costs. Given this emphasis, we expect that provider–patient communication has improved over time.
Data Source:
We collected primary data by self-report surveys between summer 2017 and fall 2018.
Study Design:
We use a quantitative retrospective cohort study of a national sample of 353 patients who had an ostomy surgery.
Data Extraction Method:
We measure provider communication from open-ended self-reports from patients of the number of stated inadequacies in their care.
Principal Findings:
Results show that the time since patients had their surgery is related to higher quality provider communication. That is, patients who had their surgery further back in time reported higher quality provider communication compared with patients who had their surgery performed more recently.
Conclusion:
Results suggest that the quality of provider communication has not improved even with an emphasis on PCC.
Introduction
Interactions between providers and patients are an important component of the delivery of health care. Provider–patient interactions are related to patient health outcomes, such as impacting patient activation and feelings of control in the encounter, 1 as well as patient satisfaction, 2 and patient understanding of medical information. 3 Effective provider–patient interactions can result in patients feeling respected and understood 4 and higher satisfaction. 5 Deficient provider–patient interactions can lead to microaggressions 6 and impact adherence rates. 7
A large body of research suggests that provider communication impacts patient outcomes, but it is less clear whether the quality of provider communication has become better or worse over time. A fairly new focus on patient-centered care (PCC) suggests that the quality of communication between providers and patients has likely improved. 3,8 The current study examines this phenomenon by quantitatively assessing the quality of provider communication over time, especially before and after the emphasis on PCC endorsed in 2001 by the Institute of Medicine (IOM; note 1).
Patient-Centered Care
Patient-centered care, by definition, is medical care that respects patients’ “preferences, needs, and values” 9(p3) while ensuring that medical decisions are informed by patient values. While PCC has been conceptualized and labeled in various ways, such as collaborative or participatory, the general consensus is that PCC consists of communication aimed to include the patient’s perspectives and involve the patient in decision-making. 7
In 2001, the IOM formally recommended that health care be delivered using a patient-centered approach. The attention on PCC came into sharp focus following a series of concerns in the late-1990s regarding patient safety describing an alarming number of patient deaths due to preventable medical errors. 10,11 After a series of congressional hearings, a subsequent report was released, Crossing the Quality Chasm, which focused on improving health-care quality. 9 Chasm outlined 6 aims with 1 aim specifically emphasizing that health care should be patient-centered. After these reports were released, hospitals throughout the United States implemented new patient safety and care measures; 12 considerable efforts have been made to provide PCC throughout the nation since that time. 10
Research Questions
Patient-centered care has since been widely recognized as an important component in considering patients’ needs and preferences when making treatment decisions. 13,14 The benefits of PCC have been examined in various medical contexts, such as during primary care and specialists’ office visits, as well as during hospital stays, which is the context we focus on in the current study, specifically testing whether PCC is present for hospital ostomy patients (note 2).
In particular, we examine whether the trend of providing PCC has positively influenced provider communication and whether the IOM PCC initiative contributed to the change in provider communication. We answer the following research questions: (1) Has the quality of provider communication changed over time? (2) If so, did provider communication change as a result of the PCC initiative? We expect the focus on PCC has resulted in improved provider communication over time. Further, we expect even more improvement in provider communication after the 2001 The IOM initiative considering the extensive focus on PCC and efforts by policy-makers, administrators, and providers.
Method
Sample and Data Collection
Using a nonprobability method, we recruited participants from ostomy support groups throughout the United States who were affiliated with the United Ostomy Associations of America (UOAA). We sent e-mails to 60 ostomy support groups affiliated with the UOAA. In addition, participants were recruited through Facebook, Twitter, and Reddit, and we posted the questionnaire link on UOAA’s discussion board. Hard copy questionnaires were mailed as requested.
Respondents were eligible to participate if they had an ostomy, were aged 18 years or older, and could read and write English well enough to complete the questionnaire. Respondents signed online informed consent forms prior to accessing the questionnaire. The questionnaire was self-administered and comprised of closed-ended and open-ended questions. The questionnaire was pretested by a University faculty member with an ostomy and advanced doctoral students trained in the methodology. The study and methods were approved by The University of Oklahoma Institutional Review Board. IRB# 8040. A total of 359 patients are included in the overall study. Of the 359 respondents, there are 353 patients included in the current analyses; the 6 excluded respondents had missing data on one or more of the variables used in the analyses.
Variables
Dependent variable
To measure the quality of provider communication, we examined the following open-ended question, “Was there anything that the medical staff could have done to make you feel better prepared to take care of your ostomy at home?” Open-coding was used to create general categories that reflected explicit responses. By definition, open-coding is the initial classification of concepts where “data are broken down into discrete parts, closely examined, and compared for similarities and differences.” 16 (p625) Two researchers with advanced methodology training and experience coding open-ended responses reviewed each response separately. Upon reviewing responses separately, each researcher coded the responses into specified categories using a coding sheet with definitions for each category that reflected provider communication.
The final coding scheme consisted of 16 categories; 3 categories reflected adequate communication (adequate high response, adequate low response, and no comment); 13 categories reflected inadequate communication. Adequate provider communication reflects a satisfactory or sufficient provider–patient interaction. For example, respondents wrote, “I received excellent instruction both times…the nurses were professional, kind, and very helpful. I can’t say enough good things about them.” Or “No. Everything was explained while I was still in hospital on a daily basis…” If a respondent did not leave an answer to the question, we coded the nonresponse as adequate (n = 137 nonresponses, 36%).
We coded responses as inadequate if respondents wrote a statement about some type of deficiency in the care received. For example, one respondent said “…The medical staff was rushed, had little positive to say, put emphasis on the horrendous binder of everything I ‘cannot ever’ eat or do. (Which I have found out is a load of crap).”Another example is, “I would have liked to have been given more information about what products were available.”Also, “Yes, the surgeon did a different procedure than I expected. I thought it would be an end colostomy…It had a big effect on irrigation. So…I could have been told that it was a loop colostomy.”
We summed the number of categories each respondent identified in the open-ended response. The resulting count variable ranged from zero categories of inadequacies stated by respondents to a total of 6 categories of inadequacies stated by respondents. The variable is a count of the categories or types of inadequacies listed by the respondent, not the actual number of inadequacies. For example, a respondent could have listed 2 deficiencies in the same category.
Independent variables
To measure the quality of provider communication over time for the first research question, we used a variable representing the number of years prior to 2018 that the patient had his or her ostomy surgery. That is, the year the surgery was performed was subtracted from the year 2018, resulting in a variable that ranged from 1 to 65 years ago (surgery performed in 2017 to 1953).
To examine the second research question, we created a year of surgery variable centered at the year of the IOM patient-centered are initiative. We used 2002, rather than the actual year of the IOM initiative—2001, to account for a lag between an official recommendation from IOM and implementation of PCC. To create the 2002-centered variable, we subtracted 2002 from the year of surgery. The variable ranges from −49 (year 1953), 0 (0 for year 2002), to 15 (year 2017). The centered variable results in a meaningful interpretation of the intercepts from the piecewise regression models (described below). When not using a centered variable, the intercept represents the predicted value of the dependent variable (number of inadequacies) when the predictor variable (year of surgery) is zero. Using the centered variable, the intercept is the predicted value of the number inadequacies when the year of surgery is 2002 (the lagged year of the IOM initiative).
Control variables
A number of self-reported control variables were used: patient gender, race, education, and age. Gender was coded male or female (only 1% of respondents recorded other genders). Race was coded as white or non-white. Educational attainment categories included completed some high school or less, high school graduate, completed some college, bachelor’s degree, or postgraduate degree. Age was a continuous variable, which ranged from age 18 to 89 years.
Analyses
We start by presenting descriptive statistics of the study sample and descriptive statistics for the dependent variable, number of reported inadequacies of care. To examine research question 1, we estimate a series of nested regression models analyzing the number of inadequacies: a bivariate model examining inadequacies using year of ostomy surgery and a full model that includes relevant control variables. For research question 2, we use piecewise regression analysis to compare the trajectory of change in the number of reported inadequacies from before and after the IOM initiative on PCC. 17
The dependent variable is a non-negative integer—a count. As such, we use regression models for count data. 18 Specifically, we present results from negative binomial regression models. We assessed other count models, such as Poisson and zero-inflated models. Likelihood-ratio tests for overdispersion suggest that negative binomial models are a better fit than Poisson regression models. 18 The dependent variable has a substantial number of zeroes. We compared negative binomial models with zero-inflated models using the Vuong test. 19 The results suggest that standard negative binomial regression is the best fitting model. STATA 13.1 was used to conduct all of the analyses.
Results
Characteristics of the Study Sample
Table 1 presents descriptive characteristics of the study sample. There are 353 patients included in this study. The sample is largely female (79.9%), white (88.1%) with some college, or higher (83.3%). Over half of the sample (59.3%) are aged 51 years or older. A majority of the sample (77.0%) had their surgery within the last 10 years and 84.7% of patients had surgery after the patient-centered initiative issued by the IOM. The mean years since surgery were 8.7 years.
Descriptive Characteristics of the Patient Sample by Date of Ostomy Surgery.

Abbreviations: HS, high school; PCC, patient-centered care.
Table 1 also shows the descriptive characteristics of the study sample by timing of surgery (before and after the PCC initiative). The 2 groups are very similar in terms of gender, race, and education level. To determine whether there are cohort differences between the pre- and post-PCC cohorts, we conducted χ2 analyses for the categorical variables and t tests for the continuous variables; χ2 tests of independence show that none of the differences are statistically significant. The only differences between the 2 groups are the time-related variables: age and years since surgery. These group differences are expected by definition. t tests confirm the differences between the groups in terms of age (t = 3.8, df = 351, P < .001) and years since surgery (t = 33.3, df = 351, P < .001).
Reported Inadequacies of Communication
Table 2 presents descriptive statistics for the dependent variable and number of reported inadequacies. The table shows the statistics for the total sample and by timing of surgery. The upper panel of the table presents percentages, the lower panel shows general descriptive statistics. For the total sample, a majority (53.0%) reported no (0) inadequacies in communication. The number of reported inadequacies ranged from 0 to 6, with a mean just under 1 (0.93) and median of 0.
Descriptive Statistics of Dependent Variable by Date of Ostomy Surgery.
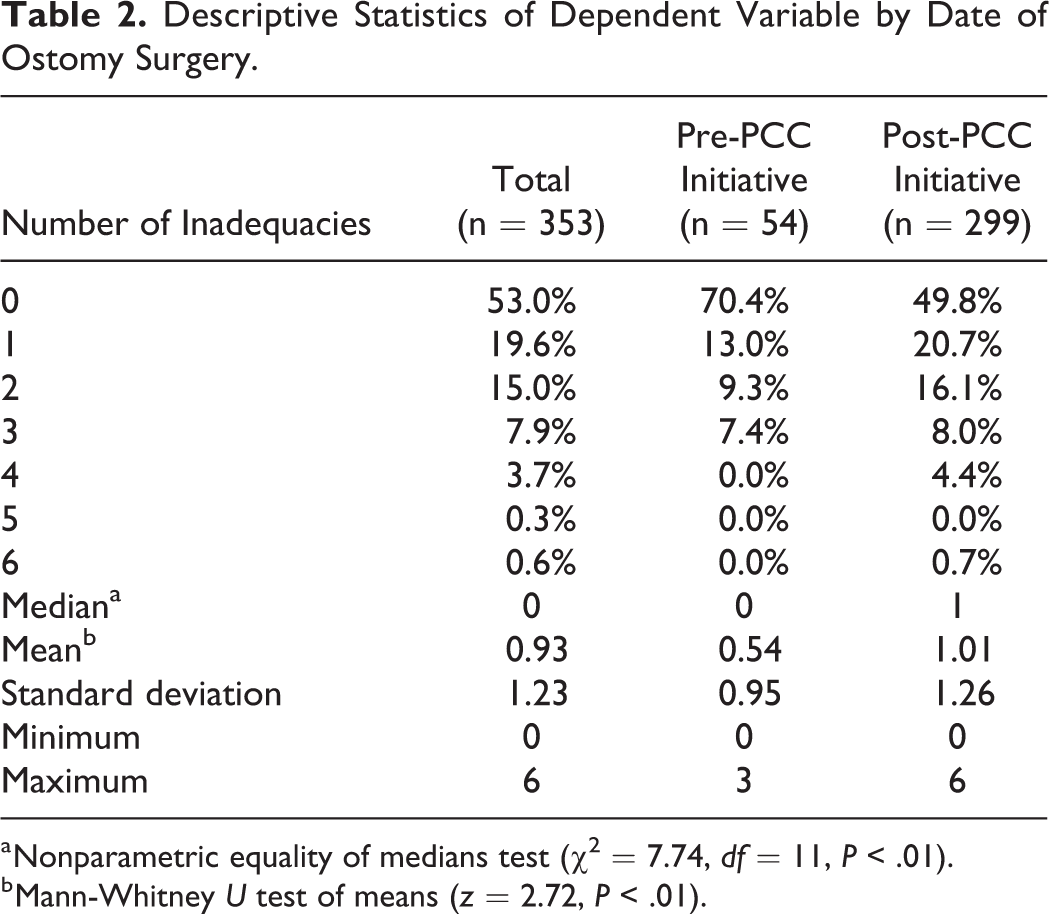
a Nonparametric equality of medians test (χ 2 = 7.74, df = 11, P < .01).
b Mann-Whitney U test of means (z = 2.72, P < .01).
The descriptive statistics suggest differences in the number of reported inadequacies between those who had surgery before and after the PCC initiative. For example, over two-thirds (70.4%) of the patients who had surgery before the PCC initiative reported no (0) inadequacies, compared with about half (49.8%) of the patients who had surgery postinitiative. None of the preinitiative patients reported more than 3 inadequacies. By contrast, 5.1% of the postinitiative patients reported more than 3 inadequacies. Formal statistical tests confirm these differences by timing of surgery. The median and mean differences between the 2 groups were statistically significant at the .01 level.
Quality of Provider Communication Over Time
To answer research question 1 of whether the quality of provider communication changed over time, we present a series of nested negative binomial regression analyses (Table 3). The bivariate model (model 1) examines the unadjusted relationship between the number of years since surgery and the number of reported inadequacies. The results are consistent with the descriptive results presented earlier. Patients reported higher quality provider communication the further back in years the patient had surgery. Specifically, the results show that for each increase in the year toward the present (2018), the expected log count of the number of inadequacies increases by 0.02 (P ≤ .01). The incident rate ratio (IRR = e b = e 0.02) for the model (data not shown in Table 3) is 1.02. The IRR shows that inadequacy counts increase by 2% for every 1 year increase. Thus, for each 10-year increase, the count of inadequacies increases by 20%.
Negative Binomial Regression Analyses on the Number of Reported Inadequacies in Provider Communication Over Time.a

a Numbers are negative binominal regression coefficients.
b P < .01.
c P < .10.
d P < .05.
Model 2 suggests that the finding is robust. The multivariate model controlling for the patient variables gender (female), race (white), education, and age shows the effect of years since the surgery is not attenuated. After controlling for the patient variables, the expected log count of the number of inadequacies increases by 0.02 (P ≤ .01) for each year increase. Of the control variables, only gender (female) and age are related to the number of inadequacies. Females are more likely to report inadequacies (b = 0.36, P ≤ .10). Likewise, as age increases so does the number of inadequacies (b = 0.01, P ≤ .10). For every 10 years of age, the expected log count for the number of inadequacies increases by 0.10.
The findings from both models do not support our expectations. Given the increased focus on PCC over time, we anticipated the quality of communication would improve. The models suggest the number of inadequacies reported by patients has increased over time. Despite the contrary findings related to the first research question, we examine whether the trajectory of reported inadequacies changed as a result of the increased focus on PCC as outlined in the IOM initiative.
To address research question 2 of whether the IOM initiative on PCC impacted the trajectory in the number of reported inadequacies, we present findings from piecewise negative binomial regressions. The effect of the IOM initiative could occur in 2 ways. First, there could be an abrupt shift in the number of reported inadequacies, either upward or downward, at the transition point. This abrupt shift would be indicated by a difference in the intercept of a regression line among patients who had surgery before the initiative and the intercept of the regression line for those who had surgery after the initiative. Second, there could be a difference in the rate of increase or decrease in the number of inadequacies for the pre- and postpatient-centered initiative. This difference in the rate of change would be indicated by a difference in the slopes of the regression lines for patients who had surgery before and after the IOM initiative. The piecewise regression analysis allows us to test for one or both of these possible effects. In simplest terms, the analytic approach assesses whether the intercepts and slopes are different for those who had surgery before and after the patient-centered initiative.
Figure 1 shows the scatterplot of the observed number of reported inadequacies by year of surgery with prediction lines for patients who had surgery before and after the PCC initiative. The transition point—2002—is indicated with a vertical line. The prediction line for patients who had surgery before or during 2002 are to the left (dashed line) of the transition point, the prediction line for patients who had surgery after 2002 is to the right (solid line) of the transition point.

Scatter plot of the number of inadequacies by surgery year with pre- and post-PCC predicted lines. PCC indicates patient-centered care.
The predicted number of reported inadequacies increased over time for patients who had surgery before the PCC initiative. The predicted number of reported inadequacies leveled off (and slightly decreased) after the patient-centered initiative. For example, patients who had surgery in 1955 have a predicted value of 0.29. That is, the expected number of inadequacies for someone who had surgery in 1955 is 0.29. In fact, the predicted value is not statistically significant (z = 1.23, P = .22), indicating the value is not distinguishable from zero in the population. Patients who had surgery in 1975 have a predicted value of 0.42 (z = 2.52, P = .01). Patients who had surgery in 2000 have a predicted value of 0.68 (z = 2.54, P = .01). The prediction lines indicate a discontinuity at the transition point. The predicted value for someone having surgery in 2002 is 0.71 (z = 2.32, P = .02). For someone having surgery in 2003, the predicted value jumps to 1.10 (z = 3.85, P = .000). From 2003 onward, the predicted values begin to decline. For example, patients who had surgery in 2005 have a predicted value of 1.08 (z = 4.66, P = .000). By 2010, the predicted value drops to 1.03 (z = 8.92, P = .000). In 2015, the predicted number of reported inadequacies in communication and information drops to 0.99 (z = 11.65, P = .000).
Discussion
There is strong evidence suggesting that medical encounters that espouse PCC generate quality interactions and improve health outcomes. 13 The current study quantitatively examined the quality of provider communication over time, especially before and after the emphasis on PCC, which was formally recommended in 2001 by the IOM. Results show that patients reported higher quality provider communication the further back in years the ostomy surgery was performed. The trend, however, changed after the IOM initiative.
There are several plausible ways to interpret these findings. First, it may be the case that the emphasis on PCC in health care has not resulted in higher quality provider communication. That is, perhaps provider communication was of a higher quality in the past. In addition to the increasing emphasis on PCC, health-care delivery was changing in other ways that might have negatively impacted the quality of communication and information, namely the increasing influence of managed care organizations (MCOs). Managed care organizations generally lower health-care delivery costs but do so by placing constraints on providers and patients. Managed care organizations often employ utilization review to monitor how providers practice medicine and the treatment decisions they make, reporting requirements for providers, 20 and incentives for providers who meet budgetary goals. 21 Once the number of MCOs began to increase, concerns arose from consumers, health-care practitioners, and professional organizations about participating physicians being constrained from offering certain services and medications, 20,22 and whether physicians were upholding the fiduciary nature of the provider–patient relationship considering MCOs financial incentives to provide care in a less costly way. 4 Physicians perceived that because of managed care constraints, quality of care was compromised. 23 Furthermore, physicians complained about their lack of control over medical decisions and not being able to spend enough time on patient care due to what they perceived as an increase in administrative tasks that managed care required. 20 Thus, perhaps our findings speak to a more systemic issue in health care that places constraints on medical providers and makes it increasingly more difficult to provide PCC.
A second, alternative interpretation of the findings of the current study revolves around patient expectations. Recent studies have documented increasing expectations of patients, 24 and a growing demand for quality health care from patients. 25 It may be the case that the quality of provider communication and information today is the same (or perhaps better) as in the past, but our findings reflect that increase in patients’ expectations.
Either way, patients who had surgery in the past reported provider communication as more favorable compared with patients who had surgery more recently. It is not clear whether the quality of care has changed or whether patient perceptions of the quality of care has changed. Future studies should investigate these possibilities, perhaps with a longitudinal approach of investigating systemic constraints on providers and patient expectations and demand. A prospective examination would help us elucidate whether provider communication has changed in more recent years or is it a change with patient expectations or a combination of the 2.
The findings must be interpreted with several limitations in mind. First, we did not examine global or overall provider communication from each encounter. Rather, we examined one component of provider communication: how prepared the patient felt to leave the hospital with his/her ostomy. Second, the data are from a nonprobability sample. The sample consists mostly of white, females, drawn from ostomy support groups. As such, the findings may not be generalizable to other patients’ hospital care experiences. Third, it is hard to know whether the sample of patients in the current study compares to the population of ostomy patients. Patient characteristics for the population of ostomy patients are largely unknown. 26,27 However, one large national study examining the prevalence of inflammatory bowel disease (IBD, a major reason for ostomy surgery) showed patient characteristics similar to our sample. That is, the study found that more females had IBD than males, more common as people age, and more common in whites than non-whites. 28 Finally, we rely on retrospective data. A retrospective study design has the potential to introduce recall bias. That is, participants may remember “their former state as better or worse than it actually was,” 29(p112) although people tend to recall events that are emotionally significant more vividly than other everyday experiences. 30
Overall, the findings in this study suggest that the quality of provider communication with patients has diminished over time, even with the widely endorsed focus on PCC. Future research is needed to understand whether organizational constraints are stifling hospital providers’ care and impacting patient-centered initiatives, or whether expectations are changing, or whether something else is impacting the care that patients receive at the hospital. Ideally, longitudinal and prospective study designs would provide more information on PCC within hospital settings.
Footnotes
Declaration of Conflicting Interests
The author(s) declared no potential conflicts of interest with respect to the research, authorship, and/or publication of this article.
Funding
The author(s) disclosed receipt of the following financial support for the research, authorship, and/or publication of this article: The research was funded by a “Graduate College Foundation Fellowship from the Department of Sociology and the Graduate College at the University of Oklahoma” to Leslie Miller. The funding does not impact the study in any way.