
Abstract
In 2006, Massachusetts passed a reform that required individuals to purchase health insurance and provided subsidized health insurance to low-income individuals. The US Patient Protection and Affordable Care Act (ACA) was modeled after this reform, making Massachusetts an ideal place to look at potential outcomes from the ACA. Postreform, the proportion of the health-insured population in Massachusetts greatly increased, which potentially changed physician reimbursement for procedures as usage of care, particularly preventative care for children increased. We find that reimbursement for well-infant visits rose temporarily by approximately 4% the year after the reform but that the effective price increase did not persist. It is likely that this lack of persistence is due to an increase in the supply of physicians. This has important implications for the ACA, as expanding physician capacity is more difficult on a national level.
The Massachusetts health insurance reform served as the model for the Patient Protection and Affordable Care Act (ACA) and provides evidence in the United States of the impact of the implementation of a health insurance mandate. In terms of the population’s enrollment in health insurance, the Massachusetts health insurance reform can be considered a success. After the reform was fully implemented, close to the entirety of the Massachusetts population was enrolled in health insurance. Approximately 600 000 consumers were enrolled in health insurance when the mandate took effect, far ahead of the state-projected 400 000.
Because of the reform, estimates range between a 5 and 10 percentage point increase in the total number of individuals covered in Massachusetts. 1 The changes in health insurance coverage in Massachusetts are plotted in Figure 1 by payer type. The data show an increase in overall insurance coverage at the time of the reform and that the changes stem from an increase in public insurance, with the percentage of the population holding private health insurance holding steady over time.

Insurance coverage in Massachusetts by payer type 2003 to 2010. Source: Current Population Survey, March Supplement.
The surge of newly insured individuals into the health insurance market likely affected the price of health-care services. Generally, consumers become less sensitive to the price of medical care when they are not responsible for its full payment (as is the case when an individual gains health insurance) and this price insensitivity leads to increased utilization of care. 2,3 Such increases in utilization after insurance expansions have been well documented, especially for children’s health care. 4,5 Even though a large proportion of children’s health-care visits are covered by Medicaid, there still is strong evidence that the Massachusetts reform increased the likelihood that children received care. 6,7 If an increase in the utilization of care occurred, then it is possible that the price of that care increased along with it. There are several mechanisms by which changes in insurance could affect the price of a procedure, all of them requiring the utilization of the procedure to be responsive to insurance status.
In this study, we assess the reform’s impact on the price paid to physicians for well-infant visits by private insurance (note 1) Quantity of child health care has been documented to react strongly to insurance expansions: uninsured children receive on average fewer than half of the recommended well-care visits in the first year of life, and insurance expansions to low-income populations have been shown to increase utilization of child preventative care. 8,9 Thus, if there is going to be a growth in prices paid by private insurance from increased utilization postreform, it would be very likely to occur in child preventative care such as well visits. We also study a control procedure that should be completely unresponsive to insurance status: appendectomies on an already burst appendix. Failure to undergo this critical procedure results in severe complications and often death, making it a procedure that should not be quantity or price sensitive based on insurance status. If we find any changes in the price of appendectomies, it would cast serious doubt on any results found for well visits.
The simplest way to think about prices increasing due to an insurance expansion is within a supply and demand framework. If the demand for services increases due to greater or more generous insurance coverage, then all else equal, there will be upward pressure on the price. However, a price increase could occur other ways. For example, as the expansion was concentrated within public insurance for the poor, utilization of low-cost providers may have disproportionately increased, creating congestion relative to other options. To escape the congestion, holders of private insurance may have substituted toward higher cost providers, thus increasing the average price paid by private insurance but not necessarily the overall average price paid in the health-care system (note 2). The exact mechanism does not undermine the importance of a price change in the private market: this is the largest segment of the insured population, and any price spillovers from insurance mandates would thus be salient to a large portion of the population.
The above mechanisms will increase the price of care if the physician capacity remained static (note 3). There are reasons to believe that physicians may have relocated to Massachusetts due to the reform, increasing capacity and preventing large-scale price increases. The first is that physicians have been shown to locate based on the number of patients per physician (ie, based on per capita demand). 10 The number of patients per physician increased after the reform as the number of patients grew, making relocation likely. Second, physician capacity may not have remained constant, because the 2008 Massachusetts reforms expanded existing financial incentives for doctors to treat underserved populations and geographic areas under the Massachusetts State Loan Repayment Program. Before the expansion, loan repayment funds were only available for doctors working in federally designated health professional shortage areas (HPSAs). Under the expanded criteria, funds became available for primary care doctors at a wide variety of locations, including but not limited to private group practices, nonfederal public health facilities, and practices at a rural hospitals, regardless of federal HPSA status. 11 An expansion in provider capacity could have curbed growth in prices either by increasing supply or by alleviating congestion among low-cost providers. Increased capacity could serve as an explanation for any observed lack of growth in prices postreform.
Study Data and Methods
We use a difference-in-differences design that compares prices in Massachusetts before and after the reform to changes in other northeastern states. By subtracting the change in control states from the change in Massachusetts, we remove the portion of the change in prices that is unrelated to the reform. This assumes that the control states are a good approximation of what would have happened in Massachusetts if the reform had not occurred. This approach is similar to those used in other studies of state reforms, including previous studies of the Massachusetts health insurance reform. 1,12,13
We push the analysis further by allowing for 2 separate postreform periods. We separately look at the effect of an “implementation” period of the year immediately following the reform and then the effect of the postreform period made up off all the subsequent years. This is done because though the reform came into effect in 2007 (the start of our implementation period), the loan forgiveness incentives did not begin until 2008. We include state, year, and procedure fixed effects to control for any state, year, or procedure characteristic that could bias our result. We also control for state demographics, which are described below.
Prices From Claims Data
Our analysis uses physician reimbursement by private insurer data from the Medical/Surgical module of the FAIR Health database between 2005 and 2009. FAIR Health is a nonprofit organization which collects claims data from private insurance companies and uses them to create products useful for determining pricing for out-of-network reimbursement. The FAIR Health data are collected on a voluntary basis, largely from insurers who wish to purchase FAIR Health products. 14 Data from the Medical/Surgical module have been shown to be comparable to other nationally representative samples of insurance claims for well visits. 15 As the data cover only private insurance, it is not necessarily representative of payments made by public insurance, although private insurance payments have been shown to be strongly related to public insurance payment amounts. 16
We use data corresponding to well-infant visits and appendectomies on a burst appendix performed in Massachusetts and in other northeastern states (Maine, Vermont, New Hampshire, Connecticut, Rhode Island, New York, Pennsylvania, New Jersey, Maryland, and Delaware). We are able to identify individual procedure types within each claim by line item via the American Medical Association’s Current Procedure Terminology (CPT) codes. Each line item’s date is known and is designated with the 3-digit zip code in which the service was provided.
For each line item, we are also able to observe a provider’s charge to the insurance company, known as the list price, and the reimbursement amount made to the provider by the insurance company, known as the allowed amount. The list price comes from a provider’s chargemaster (a list of prices for all procedures for that provider) and as a general rule is only paid by uninsured individuals. The allowed amount is the product of a reimbursement rate negotiated between the provider and the insurer for the given procedure and is the final price paid for a procedure. Because the allowed amount is a better measure of the market price of care due to the much higher proportion of insured individuals to uninsured individuals, we use the line item allowed amount as our outcome variable instead of the list price.
We analyze 2 types of well-infant visits and 1 type of appendectomy. We use CPT codes for visits for patients under 1 year of age (1 code for new patients and 1 code for returning patients). Table 1 gives descriptive statistics for the different procedures analyzed.
Summary Statistics for Well-Infant Visits.a

Abbreviations: CPT, Current Procedure Terminology; Std Dev, standard deviation.
aSource: FAIR Health Medical/Surgical module.
Demographic Information
We control for state demographic information that could drive changes in the demand for care. These data are taken from Zip-codes.com and from the American Community Survey. Zip-codes.com consolidates demographic, economic, and geographic information about each postal zip code in the United States using data from US Postal Service and the US Census Bureau. From the Zip-codes.com data, we use measures of population density (population, housing units per zip code, and persons per housing unit) and measures of the general price level (median household income and average price of a home) to control for population differences that could influence the price of health care. Zip-codes.com data are aggregated to the state level to avoid dummy oversaturation.
The American Community Survey provides individual-level demographic data, which we weighted by population and aggregated to the state-year level. The variables include age, marital status, number of children per household, the percentage of the population that is black, the percentage of the population with Hispanic origin, employment status, family income, gender, and educational attainment. Table 2 provides summary statistics for the control variables both for Massachusetts and for all northeastern states.
Summary Statistics for Control Variables.

Abbreviation: Std Dev, standard deviation.
aSource: American Community Survey and Zip-codes.com.
Analysis
We estimate our models using ordinary least squares. Standard errors are corrected for heteroskedasticity and clustered at the state level. We also include state time trends to control for general inflation in prices over time. Since we use the natural logarithm of the dependent variable, the reported coefficients can be interpreted as the approximate percentage change in the average reimbursement from private insurers due to the reform. We estimate several versions of the model, with varying mixes of control variables and fixed effects (to account for differing levels of time-invariant unobservable variables).
Limitations
For our results to be valid, the assumption that the control states make up an accurate picture of what would have happened in Massachusetts should the reform not have been enacted must hold. This assumption is problematic if the expansion in physician loan forgiveness in Massachusetts attracted doctors from nearby states, then those states would have seen a decrease in capacity, whereas Massachusetts saw an increase in capacity. A shift in physician supply would bias our estimates toward finding a price decrease in Massachusetts all else equal. However, any effects on price from physician migration due to the reform are part of the policy effect, so this source of bias can be seen as appropriate to be included in the estimate. To help ensure that the control states look like Massachusetts in other dimensions, we include the array of control variables described above. We also estimate our model using several different fixed-effects specifications and find our results to be robust.
Additionally, for difference-in-difference models, it is common to test preintervention data to make sure that the treatment and control groups are following parallel trends. Unfortunately, the FAIR Health data do not extend far enough back into the prereform period to conduct such a test, and we must assume that Massachusetts and other northeastern states had similar price trends prior to the reform. Finally, it is possible that the results found are due to some other unobservable factor that occurred at the same time at the reform. This is a weakness of all difference-in-differences and cannot be avoided.
Study Results
A Temporary Increase in Prices
We estimate that the insurance reform increased the price of well-infant visits during the implementation period by approximately 4% in Massachusetts compared to the control states (Table 3). The estimated price increase did not persist, and there is no consistent discernable difference in prices between Massachusetts and the control states starting in 2008, when the physician loan forgiveness was fully implemented. This result is robust to the inclusion of a wide variety of controls. Additionally, we find no statistically significant changes in the price paid for appendectomies after the reform or during the implementation period.
Difference-in-Difference Results.a
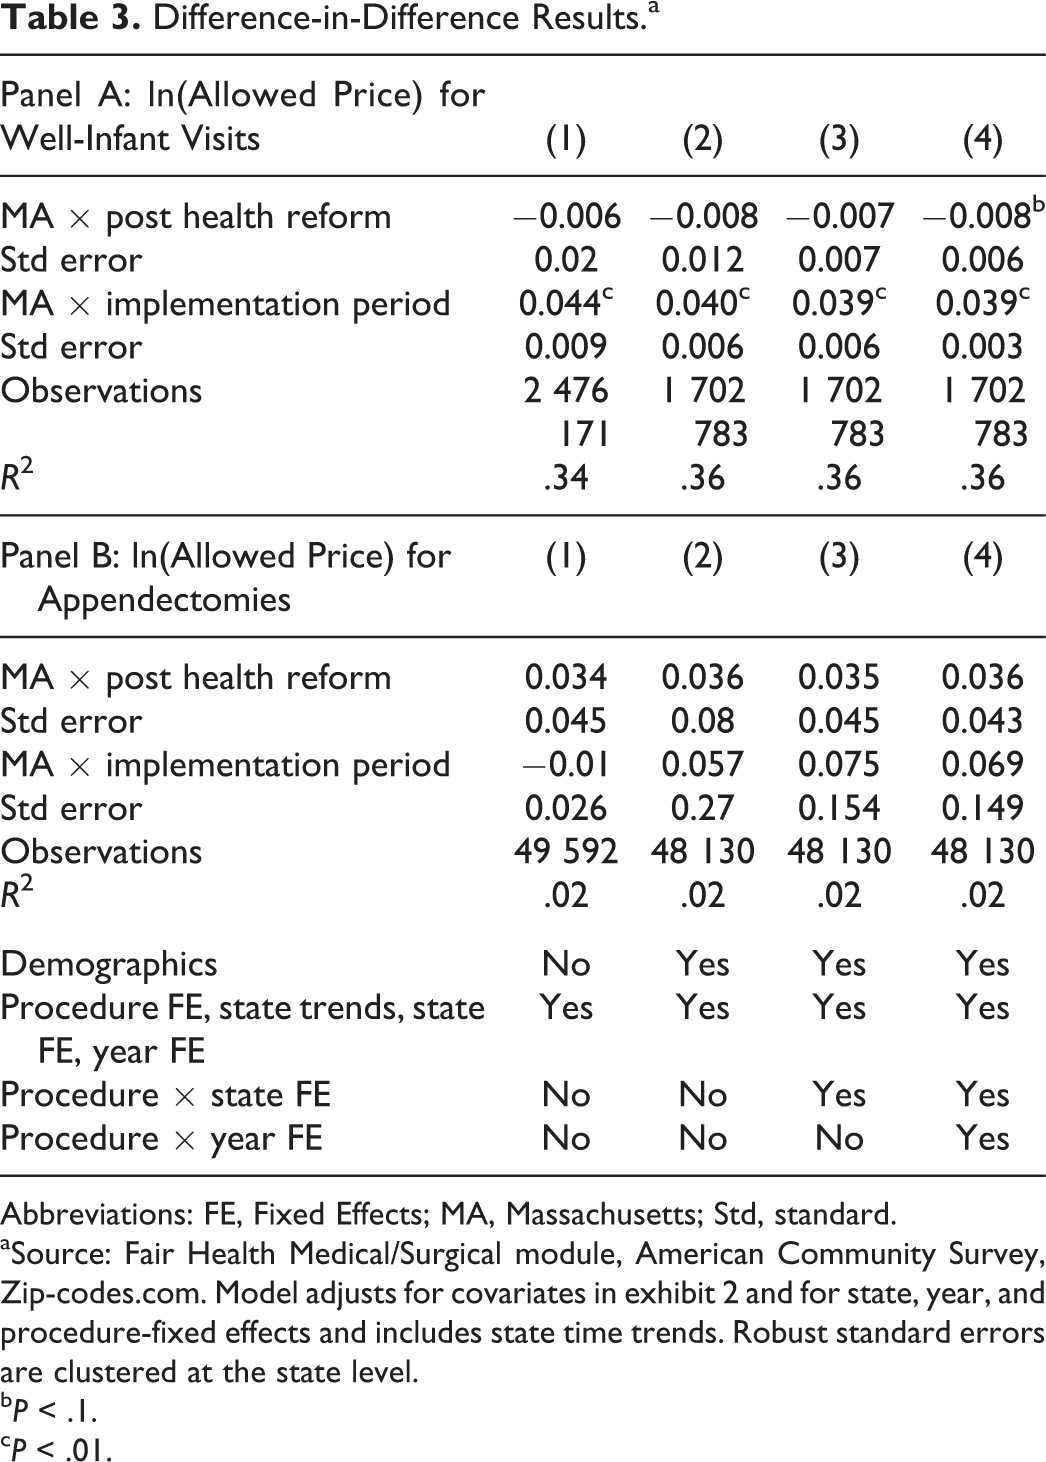
Abbreviations: FE, Fixed Effects; MA, Massachusetts; Std, standard.
aSource: Fair Health Medical/Surgical module, American Community Survey, Zip-codes.com. Model adjusts for covariates in exhibit 2 and for state, year, and procedure-fixed effects and includes state time trends. Robust standard errors are clustered at the state level.
b P < .1.
c P < .01.
Physician Migration
Figure 2 shows the number of pediatricians in Massachusetts, using data from the Bureau of Labor Statistics Current Employment Survey. Immediately obvious in the employment numbers is that there was a period of growth in pediatrics in Massachusetts relative to the control states beginning as early as 2006. Additionally, the number of pediatricians in the control states dropped in 2007. This suggests that doctors migrated in response to the policy change, which expanded capacity and provided price relief. These moves could have been in response to the increase in patient population or in anticipation of the loan forgiveness expansion. Physicians have been shown to migrate in anticipation of policy changes that influence their overall profitability. 17
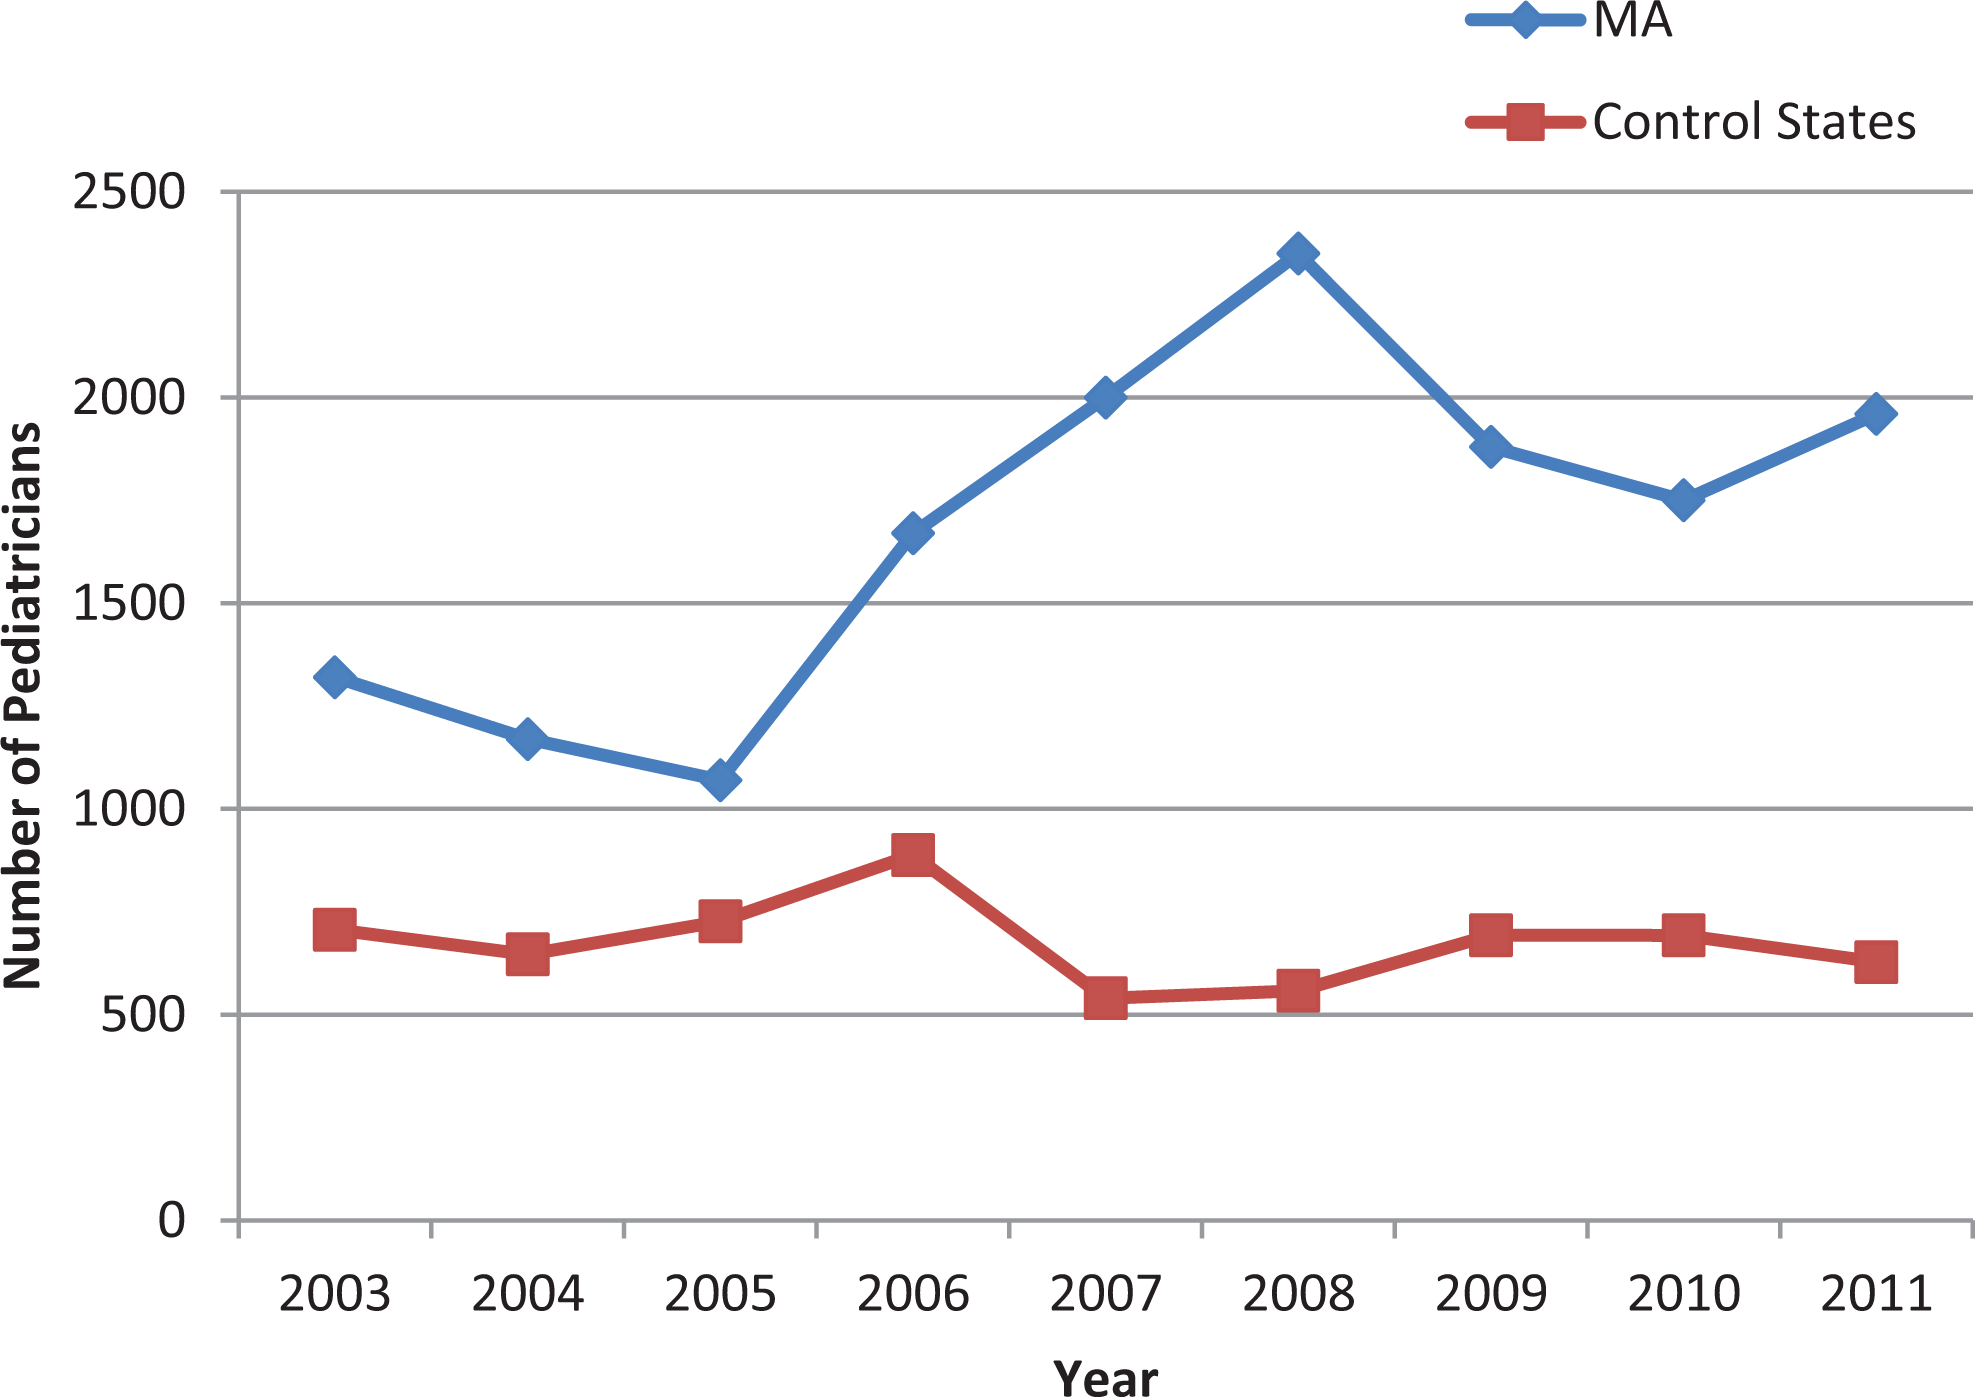
Pediatrician population 2003 to 2011.
The disparity between Massachusetts and the control states peaks in 2008, when the loan forgiveness program came into effect and the large amount of pediatrics in Massachusetts persists. A similar pattern can be seen in Figure 3, which shows the number of surgeons, another group of practitioners who would have been incentivized to move. The pattern does not exist for practitioners whose services are not typically covered by insurance, such as chiropractors (shown in Figure 4). This provides a possible explanation for why the price growth in well-infant visits did not persist: the increased provider capacity was able to absorb the initial shock of increased health-care usage.

Surgeon population 2003 to 2011.

Chiropractor population 2003 to 2011.
Discussion
The Massachusetts reform was a practical precursor to the ACA; as such, the Massachusetts reform is often used to predict ACA outcomes (note 2). If interpreted as an ACA prediction, our findings suggest that any price increases for child health care resulting from ACA enaction would be short lived. Like the Massachusetts reform, the ACA expanded health insurance and will result in an increase in infant well-care visits. Also like the Massachusetts reform, the ACA took steps to increase provider capacity: as part of the ACA, the National Health Service Corps is given increased funding of US$1.5 billion over 5 years in an attempt to assist an additional 15 000 primary care providers (both physician and nonphysician). 18
We cannot generalize state programs to the national level. A state may expand provider capacity by acquiring new doctors from other states, other countries, or through expanded physician training (which carries a considerable time lag). However, the United States, as a whole, is incapable of similarly attracting doctors en masse from other nations to increase capacity.
Footnotes
Acknowledgments
The authors are indebted to Deb Freund, Wael Moussa, Dan Rees, anonymous referees, and participants at the iHEA World Congress and the American Society of Health Economists Conference for their insightful comments and to Mark Miller for excellent data management. Research for this article used health-care charge data resources compiled and maintained by FAIR Health, Inc. The authors are solely responsible for the research and conclusions reflected in this article. FAIR Health, Inc is not responsible for the research conducted nor for the opinions expressed in this article.
Declaration of Conflicting Interests
The author(s) declared no potential conflicts of interest with respect to the research, authorship, and/or publication of this article.
Funding
The author(s) received no financial support for the research, authorship, and/or publication of this article.