
Abstract
Early childhood educators in the United States earn considerably less than their K–12 counterparts, and, among early educators, teachers of color earn less than their White peers. However, the drivers of these wage gaps are not well understood. Using data from a unique, large sample of early educators (N = 18,383) working in sites that receive public funds in Virginia, we document significant racial and ethnic pay gaps. These wage gaps persist across models that account for a more comprehensive set of relevant variables than previous research, including sector and geographic region as well as teachers’ role, education, and experience. We found that, on average, White teachers earned $19.51 per hour, $1.43 more than Black teachers and $1.15 more than Hispanic teachers. While sector, region, and teachers’ roles, education, and experience were all correlated with racial and ethnic wage differences, differences persisted not only across models that accounted for these factors but also in models comparing educators working in the same site.
Keywords
Most children aged 0 to 5 in the United States attend some kind of regular, non-parental and non-relative care prior to starting kindergarten (Cui & Natzke, 2021). The teachers providing this early care and education (ECE) can significantly impact children’s well-being and their parents’ employment (IOM & NRC, 2015; National Academies of Sciences Engineering and Medicine, 2018; Phillips et al., 2016; Whitebook et al., 2014). Yet in the United States, early educators earn far less than K–12 teachers and are much more likely to be poor (McLean et al., 2021).
Early educators work across a variety of settings. This paper focuses on early educators working in center-based settings (in which a large number of children receive care in classrooms) across three primary sectors: private child care centers, federally-funded Head Start, and state and local public pre-kindergarten (pre-k). Across these sectors, early educators are almost universally women, and many are women of color (McLean et al., 2021). In 2019, 38% of early educators working in center-based sectors were people of color (i.e., 18% identified as Black, 14% Hispanic, and 6% identified as another, non-White race or ethnicity; Paschall et al., 2020). In contrast, teachers in the K–12 sector are just 20% non-White (NCES, 2020). Some researchers argue that the low pay early educators receive reflects the long-standing undervaluing of care work, women’s labor generally, and women of color’s labor particularly (Lloyd et al., 2021; Schieder & Gould, 2016; Wilson & Darity, Jr., 2022).
Further, several studies show that even within the ECE context, women of color earn less than their White counterparts (Austin et al., 2019; Kim et al., 2024). For example, 2019 data from the National Study of Early Care and Education (NSECE) shows that across all center-based sites Black and Hispanic educators earn, respectively, $3.51 and $2.19 per hour less than their White peers, a gap that has increased since 2012 (Coffey, 2022; Ullrich et al., 2016). Such racial and ethnic wage gaps are insufficiently understood and exploring their many possible drivers is a critical first step for efforts to address them (Kim et al., 2024). For instance, if Black and Hispanic teachers are more likely to live and work in regions with lower pay, this could affect racial and ethnic wage gaps. Similarly, if Black and Hispanic teachers are less likely to work in the sectors that pay better (e.g., Head Start and pre-k as compared to center-based child care, Isaacs et al., 2018; Markowitz & Bassok, 2024; Ullrich et al., 2016), this could also contribute to racial and ethnic wage gaps. Underrepresentation in the lead teacher role (Kim et al., 2024), as well as differences in education or experience, could also contribute.
To date, however, we have little evidence as to the extent to which racial and ethnic wage gaps exist among teachers in the same region or sector, and limited data on whether wage gaps exist among teachers in the same roles, or with the same levels of education or experience. There have also been no large-scale studies examining whether there are racial and ethnic wage gaps within sites. This study begins to address these questions using data from a large sample of early educators working in center-based sites that receive public funds in Virginia, including child care sites that accept public subsidies, Head Start, and state pre-k. We first describe compensation for Black, Hispanic, and White ECE teachers, and present uncontrolled wage gaps (e.g., identifying disparities in compensation); we then examine whether racial and ethnic gaps persist when comparing teachers who work in the same region, sector, and role, and have similar education and experience levels. This study can thus help identify potentially effective policy levers for reducing racial and ethnic wage gaps, as well as clarify how policy initiatives designed to affect quality or compensation may affect such gaps.
Racial and Gender Wage Gaps in the United States
Racial and ethnic wage gaps are common in the United States, and are observed at every level of education, experience, and occupational category (Gould & deCourcy, 2023; Patten, 2016; Wilson & Darity Jr., 2022). In 2019, the median Black worker earned 76% of what a White worker earned, and a Hispanic worker earned 73% (Department of Labor, 2020). Nationwide racial and ethnic wage gaps persist even after accounting for a variety of factors such as region, job sector, education, and age (factors which themselves are influenced by past and current racist policies in the United States, including Jim Crow laws, and those related to redlining, access to educational settings, and others; Chetty et al., 2020; Grodsky & Pager, 2001; Rothstein, 2017; Stewart et al., 2021). In 2019 data, for example, after accounting for education, experience, and geography, a 15% wage gap was left unexplained for Black men, and a 9% gap for Black women, relative to their White peers.
The purpose of examining the extent to which racial and ethnic pay gaps exist within region, education level, or experience level is not to “explain away” the potential role of racism in driving pay gaps. In fact, if factors like geography, sector, role, or education level reduce racial and ethnic wage gaps mathematically, this reduction likely occurs, at least in part, through racism (e.g., community segregation, inequitable access to higher education, etc., Chetty et al., 2020; Espinosa et al., 2019; Hanushek & Rivkin, 2006). Rather, the goal is to better understand at what levels policies should be directed to address these gaps.
Understanding racial and ethnic wage gaps is important in ECE because the workforce is more than 98% women and very diverse, with about 40% of early educators working in centers identifying as women of color, an intersectional identity that faces both gender and racial and ethnic wage gaps across job types (McLean et al., 2024). For example, in the United States in 2022, while White women earned 82% of what their male counterparts earned, Black women earned just 70% of what White men earned, and Hispanic women earned 64% (Gould & deCourcy, 2023). These gaps remained after accounting for age, education, and geographic region. Furthermore, while research on the gender wage gap reports that women are paid less due to their segregation into low earning fields, it is also the case that once a field becomes typed as women’s work, the relative pay of that field decreases (Gould & deCourcy, 2023; Schieder & Gould, 2016), which some recent research has argued may be driven, at least in part, by discrimination (e.g., Grissom et al., 2021). Exploring the varied relationships between wage gaps and observable factors, as well as gaps within sites, will contribute new information to this debate (Lang & Spitzer, 2020).
The ECE workforce and racial and ethnic wage gaps
In ECE, most studies on racial and ethnic wage gaps have found that White educators are paid more than their non-White counterparts (Austin et al., 2019; Coffey, 2022; Isaacs et al., 2018; Kim et al., 2024; Liu et al., 2025; Ullrich et al., 2016), with the most recent, nationally representative data finding gaps of $2.00 or more per hour (Coffey, 2022). These uncontrolled or “raw” disparities may be due, in part, to regional variation in both pay and racial composition. They may also reflect differences across racial and ethnic groups in sector, role, education level, and experience—differences that may themselves be linked to systemic inequalities. We discuss each of these factors, and their correlation with teacher race and wage, below.
Region
There are systematic differences across regions in both the racial and ethnic composition of the population and in wages (Isaacs et al., 2018). The history of slavery in the United States, the Great Migration, and redlining policies have all resulted in ongoing racial and ethnic segregation in the United States at the levels of region, states, cities, and neighborhoods (e.g., Farrell, 2016; Grigoryeva & Ruef, 2015; Intrator et al., 2016; Massey & Tannen, 2018; Rothstein, 2017), which may be correlated with wages (e.g., Mueller et al., 2022; Taylor & Fowler, 2006). In Virginia for example, the context for the current study, 92% of early educators working in the Southwest region are White, compared to just 23% in the Capital region. The Capital region includes the District of Columbia metropolitan area, and is far more expensive, and, on average pays higher wages than the Southwest region (Isaacs et al., 2018). These regional differences in both racial and ethnic composition and pay highlight how analyses that fail to take region into consideration may under or overstate racial and ethnic wage gaps (e.g., Lee et al., 2023). For instance, if most teachers of color live in areas with higher average pay, we might assume that wage gaps favor this group.
Sector
ECE sector may also be related to both race/ethnicity and compensation. Unlike older children, who primarily attend public schools, children aged 0–5 receive ECE across a variety of home- and center-based spaces. Center-based sectors which receive public dollars are the focus of this study and include: (1) private, child care centers (which may be funded in part public dollars through federal and/or state child care subsidies); (2) federal Head Start centers, and; (3) state and local pre-k. Nationally, these settings employ about 1.82 million teachers and enroll about 7.15 million children under 5 (Datta et al., 2021).
These sectors have historically varied with respect to funding, regulation, and explicit child development goals (Markowitz & Bassok, 2024). In turn, there are large differences in both pay and the demographic characteristics of teachers across sectors. The private child care sector is by far the largest provider of center-based care for children under 5 (Friedman-Krauss et al., 2021). Historically, the private child care sector was intended to ensure children’s safety while their parents worked, rather than to support their cognitive and social development (Whitebook et al., 2014). As such, centers typically faced relatively few rules with respect to educator training or compensation. This persists today: For example, as of 2020, eight states had no minimum education requirement for child care educators, and none required a Bachelor’s degree (McLean et al., 2021). Educators working in child care centers also face the lowest wages among center-based sites, with a 2022 national median wage of $13.71 per hour, and Virginia median wage of $14.50 per hour.
In contrast, the federal Head Start and state and local public pre-k sectors were established as sites for promoting child development (Barnett et al., 2016; Zigler & Muenchow, 1992; Zigler & Styfco, 2010). Each year, about 130,000 Head Start educators provide education and care for about 1,000,000 children under 5, and face regulations related to curriculum, assessment, and whole child development (Administration for Children and Families, n.d.). Commensurately, Head Start policy requires that at least 50% of teachers have at least a Bachelor’s degree, and as of 2015, 75% of teachers met this benchmark (Moiduddin et al., 2017). In turn, these educators earn more, on average, than their child care counterparts (Early Educator Investment Collaborative, 2020; Isaacs et al., 2018; Markowitz & Bassok, 2024).
The public pre-k sector is the most academically focused, with the explicit aim of promoting school readiness. In 2020, public pre-k provided services for about 252,000 3-year-olds and 1.37 million 4-year-olds (Friedman-Krauss et al., 2021). Across the 62 U.S. public pre-k programs, 37 required lead teachers to have Bachelor’s degrees. Although compensation varies across public pre-k programs, and may vary within a program depending on auspice (e.g., whether education and care are provided in school or community-based sites), on average, educators working in public pre-k earn more than their peers in both child care and Head Start (Markowitz & Bassok, 2024). In many states, including Virginia, state pre-k programs are primarily operated through public schools and pay teachers on the same salary scale as their K–12 peers, resulting in substantially higher compensation than in the child care or Head Start sectors. Nonetheless, the BLS reports that the median annual wage for teachers of preschool-aged children nationally in 2022 was $35,330.
Alongside these cross-sector wage differences, there are also differences in the racial and ethnic composition of their workforces, such that Head Start and public pre-k employ a higher share of White teachers than child care (Bassok et al., 2019; Isaacs et al., 2018; Markowitz & Bassok, 2024). National data from 2019 showed that while 83% of preschool and kindergarten educators were White, just 77% of child care educators were (BLS, 2021a, 2021b). In Virginia, teachers of color are overrepresented in child care and underrepresented in school-based sites: for example, 53% of Black educators worked in child care as compared to 44% of White educators, in school based public pre-k these figures were 19% and 40%, respectively (Table 1).
Descriptive Statistics
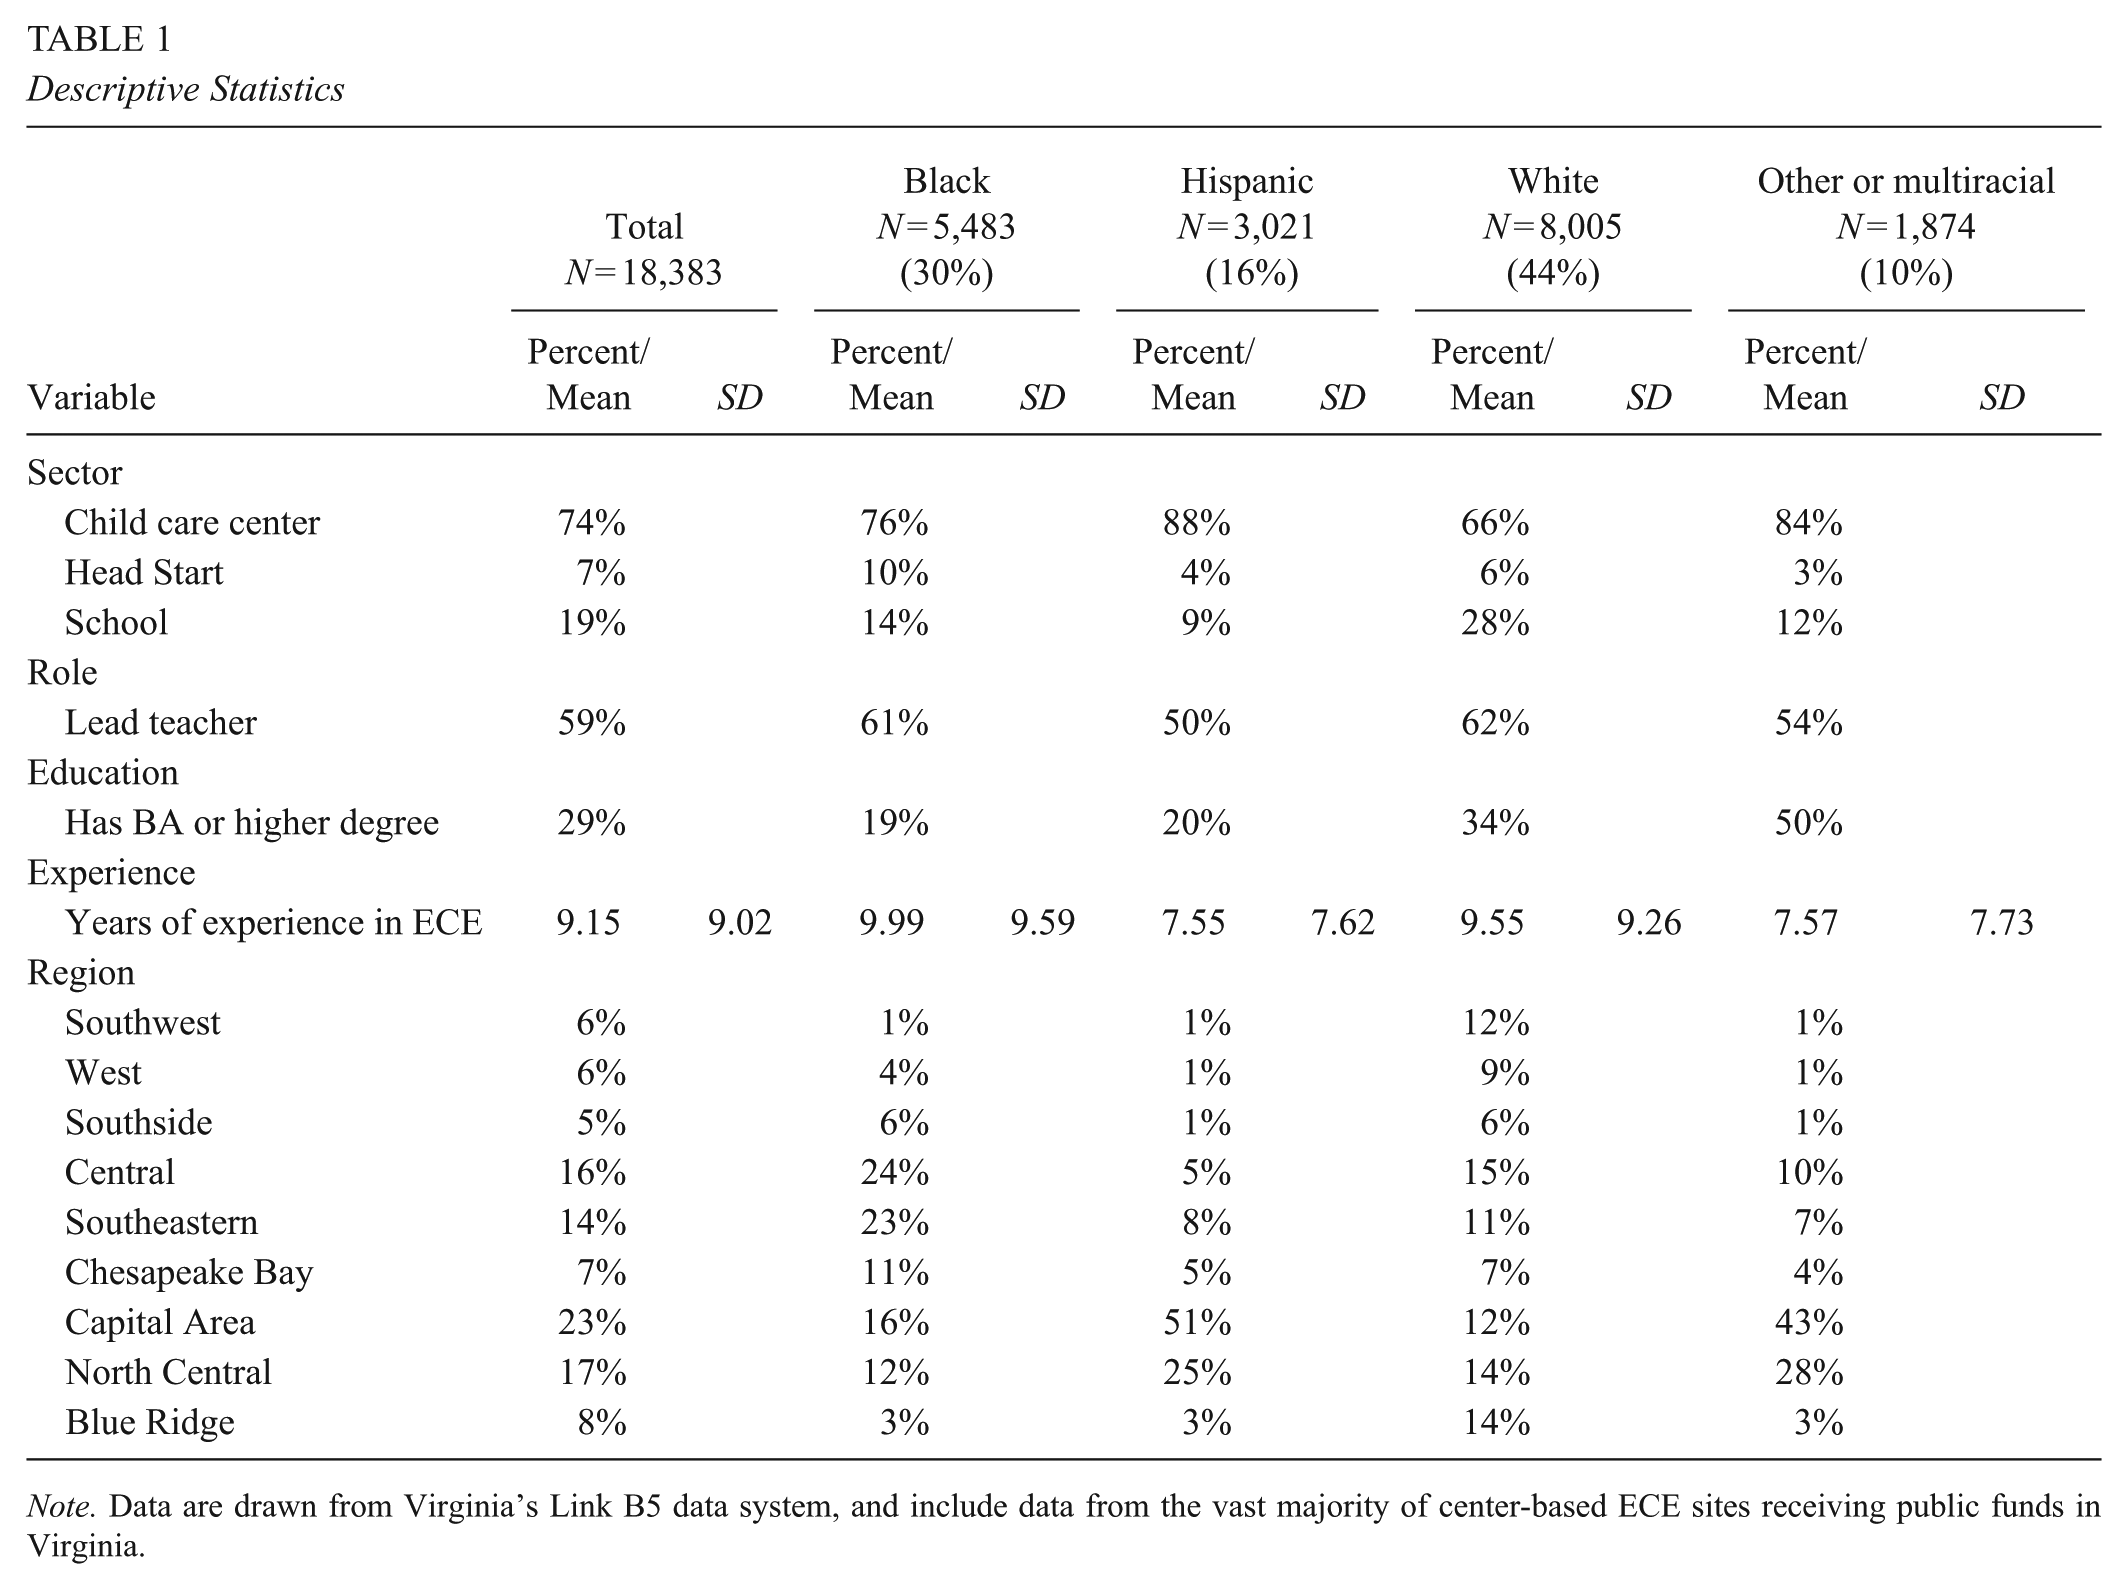
Note. Data are drawn from Virginia’s Link B5 data system, and include data from the vast majority of center-based ECE sites receiving public funds in Virginia.
Teacher role
Teacher compensation varies by teacher role (i.e., whether an educator is a lead or an assistant teacher), and these roles may also vary systematically by educator race and ethnicity. Lead teachers typically hold more responsibilities and are compensated at a higher rate than assistant teachers (Bassok et al., 2019; Lee et al., 2023; Liu et al., 2025), and National Survey of Early Care and Education (NSECE) data shows that White educators are more likely to hold lead teacher roles than their Black and Latina peers (Ullrich et al., 2016). Recent data from California also shows that White educators are disproportionately likely to hold lead teacher positions (Kim et al., 2024).
Teacher education
Similarly, ECE teachers’ levels of education have been linked to their compensation, such that teachers who have Bachelor’s degrees earn more than their counterparts without one, even within sectors (Isaacs et al., 2018; Lee et al., 2023; Liu et al., 2025; Ullrich et al., 2016). In the 2019 NSECE data, for example, teachers with an Associate’s degree on average earned $1.56 more per hour than their peers without a high school degree, and teachers with a Bachelor’s degree earned $2.72 more per hour. Similar patterns were observed in 2012 NSECE data, and in other study contexts (Austin et al., 2019; Lee et al., 2023; Liu et al., 2025). Women of color in the United States are less likely to hold a Bachelor of Arts (BA) degree than their White peers due, at least in part, to inequities in access to high-quality schooling, neighborhoods, and family wealth (Chetty et al., 2020). This pattern is replicated among early educators. National data from 2019, for example, shows that White early educators were about 10 percentage points more likely to hold a BA degree or higher than their Black and Hispanic peers (Paschall et al., 2020).
Teacher experience
In most jobs, compensation increases alongside experience, and in turn most studies exploring wage gaps account for experience as a factor. Previous research has not documented differences in experience by race and ethnicity, although evidence does show that educators of color experience less of a “pay bump” than their White peers for other professional characteristics (e.g., Austin et al., 2019), which may also be true for years of experience.
Wage gaps and teacher characteristics
A relatively small literature explores how observable characteristics relate to wage gaps. Using data from the 2019 wave of the nationally-representative NSECE, Liu et al. (2025) found that Asian, Black, Hispanic/Latino, and educators of other races and ethnicities earned lower hourly wages than White educators. Then, in models that accounted for teacher characteristics (e.g., role, education, experience, language spoken, ECE training, and union membership), Black teachers still earned $1.14 less per hour than their White counterparts, and Hispanic/Latino educators earned $1.58 less. This finding echoes a similar study using the same data, which also found that Black educators made less than their White counterparts in models that accounted for a broad set of teacher and site characteristics (e.g., region defined as West, Midwest, South, and Northeast), urbanicity, local poverty, education, credentials, experience, child age, role, and whether the site was located in a public school (Coffey, 2022).
Key limitations of existing research
While these studies establish the wage gap, they also leave many questions about the role of institutional and interpersonal factors (Boyd-Swan & Herbst, 2019; Wingfield & Chavez, 2020). This is likely due, in part, to what is termed the early childhood “data deficit” (Whitebook et al., 2018a), or because consistent, cross-sector data collection is rare. Moreover, data that do exist often do not include the kind of information needed to estimate wage gaps or identify levers for reducing them.
There are three main limitations to prior work. First, studies may not adequately account for geographic region, which may underestimate gaps by ignoring racial and ethnic sorting. For instance, a recent paper using data from one state found that, after controlling for teachers’ age, immigrant status, English language, additional job, experience, site type, and education, Black educators earned $1.52 more per hour than their White counterparts. This study did not, however, account for geographic region or urbanicity, and this omission may explain the results if Black educators lived in higher paying regions of the state (Lee et al., 2023).
Second, the existing literature struggles to account for sector. The NSECE data, for example, which provides the only large-scale, nationally representative sample of early educators, does not cleanly identify ECE sector, which makes it difficult to estimate cross-sectors differences or to assess the extent to which racial differences in the workforces of these sectors contribute to observed wage gaps.
Finally, studies have not looked at racial and ethnic wage gaps within a site. Most datasets do not include many teachers within a site, precluding the kind of estimates that can shed light on whether, even within sites, White teachers are paid more than similar teachers of color. Such data would provide insights about the role of both institutional and interpersonal factors in such gaps.
Present Study
We improve on the existing literature by using data from a large sample of over 18,000 center-based early educators working in sites that receive public funds in Virginia. The data includes information on teachers’ professional background and compensation, for all teachers within sites. This allows us to estimate both drivers of racial and ethnic gaps and, for the first time, the extent to which these gaps persist within sites. We address three questions: first, to what extent are there racial and ethnic differences in ECE teacher wages in Virginia; second to what extent do geographic region, sector, and teachers’ role, education level, and experience each relate to racial and ethnic differences in ECE teacher wages; and third, are there racial and ethnic wage differences among ECE teachers working in the same site after accounting for the above factors. Based on existing national data, we expected that teachers from historically marginalized racial and ethnic minorities were paid less than their White counterparts. We use White teachers as the comparison group given the consistent finding that these educators receive the highest wages among early educators, and in the workforce more broadly. We hypothesized that accounting for geographic, site, and individual characteristics would help explain these differences, but that differences would remain even after accounting for these factors and within sites. Findings from this study may illuminate the largest structural drivers of wage inequality in ways that could inform policies and draw attention to the role of both institutionalized and interpersonal discrimination in ECE compensation.
Method
We used data from LinkB5, the data system that supports Virginia’s Quality Rating and Improvement System, Virginia Quality Birth to Five (VQB5). Since 2023, publicly funded early childhood programs operating full time and serving at least three children 0 to 5 in Virginia 1 —including child care centers and family day homes that accept subsidies, Head Start programs, and state-funded pre-k programs—have been required to enter data in LinkB5. The dataset includes all Head Start/Early Head Start and pre-k programs in public schools, along with approximately 87% of the child care centers that receive public funds through participation in the Child Care Subsidy Program (CCSP). Note that participation in CCSP is optional, and in Virginia, 67% of licensed centers elected to participate. In total, LinkB5 had information for 25,618 teachers working in 2,519 center-based sites in 2024.
LinkB5 collects information on administrator-reported site-level characteristics and teachers’ self-reported demographic characteristics, hourly salary, hours worked, and experience. The dataset is owned and collected by the Virginia Department of Education (VDOE) in compliance with applicable federal and state laws. The University of Virginia accessed the data under an interinstitutional data-sharing agreement, and study procedures, including data management and analysis, were approved by the University’s Institutional Review Board.
For this study, we used data collected at the beginning of the 2024 school year from teachers working in center-based sites that receive public funds (e.g., child care centers, Head Start, and school-based state pre-k programs). We excluded home-based programs and teachers.
We dropped teachers from our analysis if they lacked information on wages, race and ethnicity, or any of our study covariates, resulting in the exclusion of 7,235 teachers from the original 25,618 (among the excluded teachers 61% lacked wage information our key outcome variable, 60% lacked race and ethnicity information, and 43% lacked professional experience). We made these restrictions to ensure fixed samples and comparability across regression models. We did not use multiple imputation because missing data came primarily from the outcome (wages) and the main predictor variables (race and ethnicity). Imputation quality relies heavily on model specification and our data likely do not satisfy a missing-at-random assumption after controlling for the limited teacher-level covariates available in LinkB5 (Woods et al., 2023).
Our analytic sample differs in some ways from the full LinkB5 dataset. Relative to the initial 25,618, the 18,383 educators in our analytic sample reported higher salaries, were more likely to have a lead teacher role, and were more likely to work for a child care center or Head Start than for a public pre-k. They were also less likely to hold a degree higher than a BA degree. These differences may affect our results, a point we return to in the discussion. Our final analytic sample of 18,383 teachers worked at 2,388 sites, representing 72% of LinkB5 center-based teachers and 95% of the centers registered in LinkB5.
Measures
Hourly wage
Teachers reported their hourly pay by adjusting a slider ranging from $0 to $40 or higher. Values under $12 (minimum wage in Virginia in 2024) were coded as missing. Only 3.88% of teachers reported they earned $40 or higher.
Race and ethnicity
Teachers indicated the best description of their race and ethnicity. Teachers could select all that applied from a list that included “American Indian or Alaskan Native,” “Asian,” “Black or African American,” “Native Hawaiian or other Pacific Islander,” and “White.” A separate item asked teachers for their Hispanic ethnicity; the two options presented in a dropdown menu were “Hispanic or Latino” and “Not Hispanic or Latino.” We created a categorical variable indicating that the teacher reported they were White (only); Black (only); Hispanic, regardless of race categories marked; or multiracial or other race (which included all teachers who marked multiple race categories or races not included in the other three categories). As noted above, White teachers are the omitted category in regressions because previous literature demonstrates that White teachers consistently earn more than their counterparts.
Job and teacher characteristics
To account for regional differences in ECE teacher compensation, we included regional fixed effects. Virginia is divided into nine geographic areas called “Ready Regions” charged with coordinating early childhood systems, and we included fixed effects for each region.
Our analysis also considers several site and teacher characteristics. We defined sector using a set of dummy variables indicating whether teachers worked in child care centers, Head Start programs, or public pre-k sites (with child care centers as the omitted category).
At the teacher level, covariates include a dichotomous variable indicating teacher’s role (1 = lead teacher, 0 = assistant teachers, filled out by site leaders, confirmed by teachers); a dichotomous variable indicating whether a teacher has a BA or more (1 = BA or higher, 0 = less than a BA, teacher reported); and years of teaching experience in ECE (teacher reported, we included both the linear and quadratic term of the continuous variable in our estimates). We dichotomized role and education to reflect the distribution present in our data (see Table 1), the distinct responsibilities of lead and assistant teachers in the classroom, and to align with the recommendations of the Institute of Medicine and National Research Council (IOM & NRC, 2015), which advises including a BA degree as part of educators’ required qualifications.
Analytic Approach
Our first question was: To what extent are there racial and ethnic differences in ECE teacher wages in publicly funded sites in Virginia? To address this question, we compared the mean hourly wage for teachers who self-identified as Black, Hispanic, White, or other/multiracial, and ran a linear regression model (Model 1) to formally test whether racial and ethnic differences in pay were statistically significant. In this model, hourly wage was regressed on dichotomous variables indicating the teacher’s race and ethnicity. Because White is the omitted category, the coefficient of each race and ethnicity shows the difference between reported hourly wages for this group relative to their White peers.
Our second question was: To what extent do geographic region, sector, and teacher’s role, education level, and experience each relate to racial and ethnic differences in wages? To address this question, we ran three additional linear regression models. In Model 2, we added geographic region fixed effects to estimate within-region racial and ethnic wage differences. In Model 3 we added sector, and in Model 4 we added role, education level, and experience.
The last question of our study was: Are there racial and ethnic wage differences among ECE teachers working in the same site after accounting for the above factors? To address this question, we estimated two additional linear regression models. In Model 5, we added site fixed effects to the baseline model and in Model 6, we also accounted for teacher’s role, education, and experience, which allows us to test whether racial and ethnic wage differences persist within the same center even after accounting for teachers’ characteristics.
Models 5 and 6 leveraged within-site variation in teacher wages and teacher race and ethnicity to generate regression estimates. On average, our data included eight teachers per site, although 201 sites had only one teacher. Among sites with multiple teachers, many sites were racially homogenous. In our sample, only 1,558 of 2,388 sites have teachers of two or more races/ethnicities represented. Within these 1,558 sites, not all sites contributed to every estimate (e.g., a site may have a White and a Hispanic teacher, but no Black teacher). Given the extent of our sample reduction, we interpreted these within-site results with caution.
Results
Descriptive statistics are presented overall and by racial/ethnic group in Table 1. In our sample, 30% of teachers identified as Black, 16% Hispanic, 44% White, and 10% multiracial or another race. A total of 74% worked in child care centers, 7% in Head Start, and 19% in school-based public pre-k classrooms. About 60% of respondents were lead teachers, and about 30% of the sample held a BA or more. On average, educators reported 9.15 years of teaching experience.
Table 1 also shows considerable racial and ethnic differences across sector, role, education level, and experience. For example, while 28% of White teachers worked in school-based pre-k sites, just 14%, 9%, and 12% of Black, Hispanic, and other/multiracial teachers, respectively, did so. Similarly, while White and Black teachers were roughly equally likely to be lead teachers (60%), Hispanic and other/multiracial teachers were somewhat less represented in this role (50% and 54%). White and other/multiracial teachers were more likely to hold a BA (34%) than Black and Hispanic teachers (20%); and, Black teachers had the highest number of years of experience (9.99 years), followed by White (9.55 years), other/multiracial (7.57 years), and Hispanic teachers (7.55 years).
There were also considerable racial and ethnic differences in the geographic distribution of teachers. Hispanic (51%) and other/multiracial teachers (43%) were more likely to work in the Capital Area (near the District of Columbia), compared to 12% of White teachers. Similarly, Black teachers were more represented in the Central and Southeastern regions (24% and 23%, respectively) than White teachers (15% and 11%). These differences are notable due to differences in cost of living across these regions. For example, in the Capitol Area, the living wage for a single adult with no children is approximately $30.24 per hour. The Central and Southeastern regions include Richmond (living wage of ~$25.21 per hour), Norfolk, and Newport News (living wage of ~$24.61), which are large cities with longstanding Black populations (U.S. Census Bureau, n.d.; MIT Living Wage Calculator, Glasmeier, 2025). In contrast, the cost of living is significantly lower in the Southwestern region. This means that in Virginia, Hispanic, Black, and other/multiracial teachers are more likely to be living in urban cities with higher costs of living, and likely higher pay, whereas White teachers were overrepresented in the rural areas with lower cost of living, and lower pay.
Differences in Hourly Wages by Race and Ethnicity
Our first question was: To what extent are there racial and ethnic differences in ECE teacher wages? The first row of Table 2 presents the means and standard deviations of hourly wages overall and highlights large racial differences. On average, White teachers reported higher hourly wages than teachers from any other race and ethnicity. They reported earning $19.51 per hour, $1.43 more than Black teachers, $1.15 more than Hispanic teachers, and $0.46 more than other/multiracial teachers. These differences represent between 7.17% and 22.74% of a standard deviation of the overall sample distribution.
Average Wages by Professional Characteristics, Overall and by Teacher Race/Ethnicity
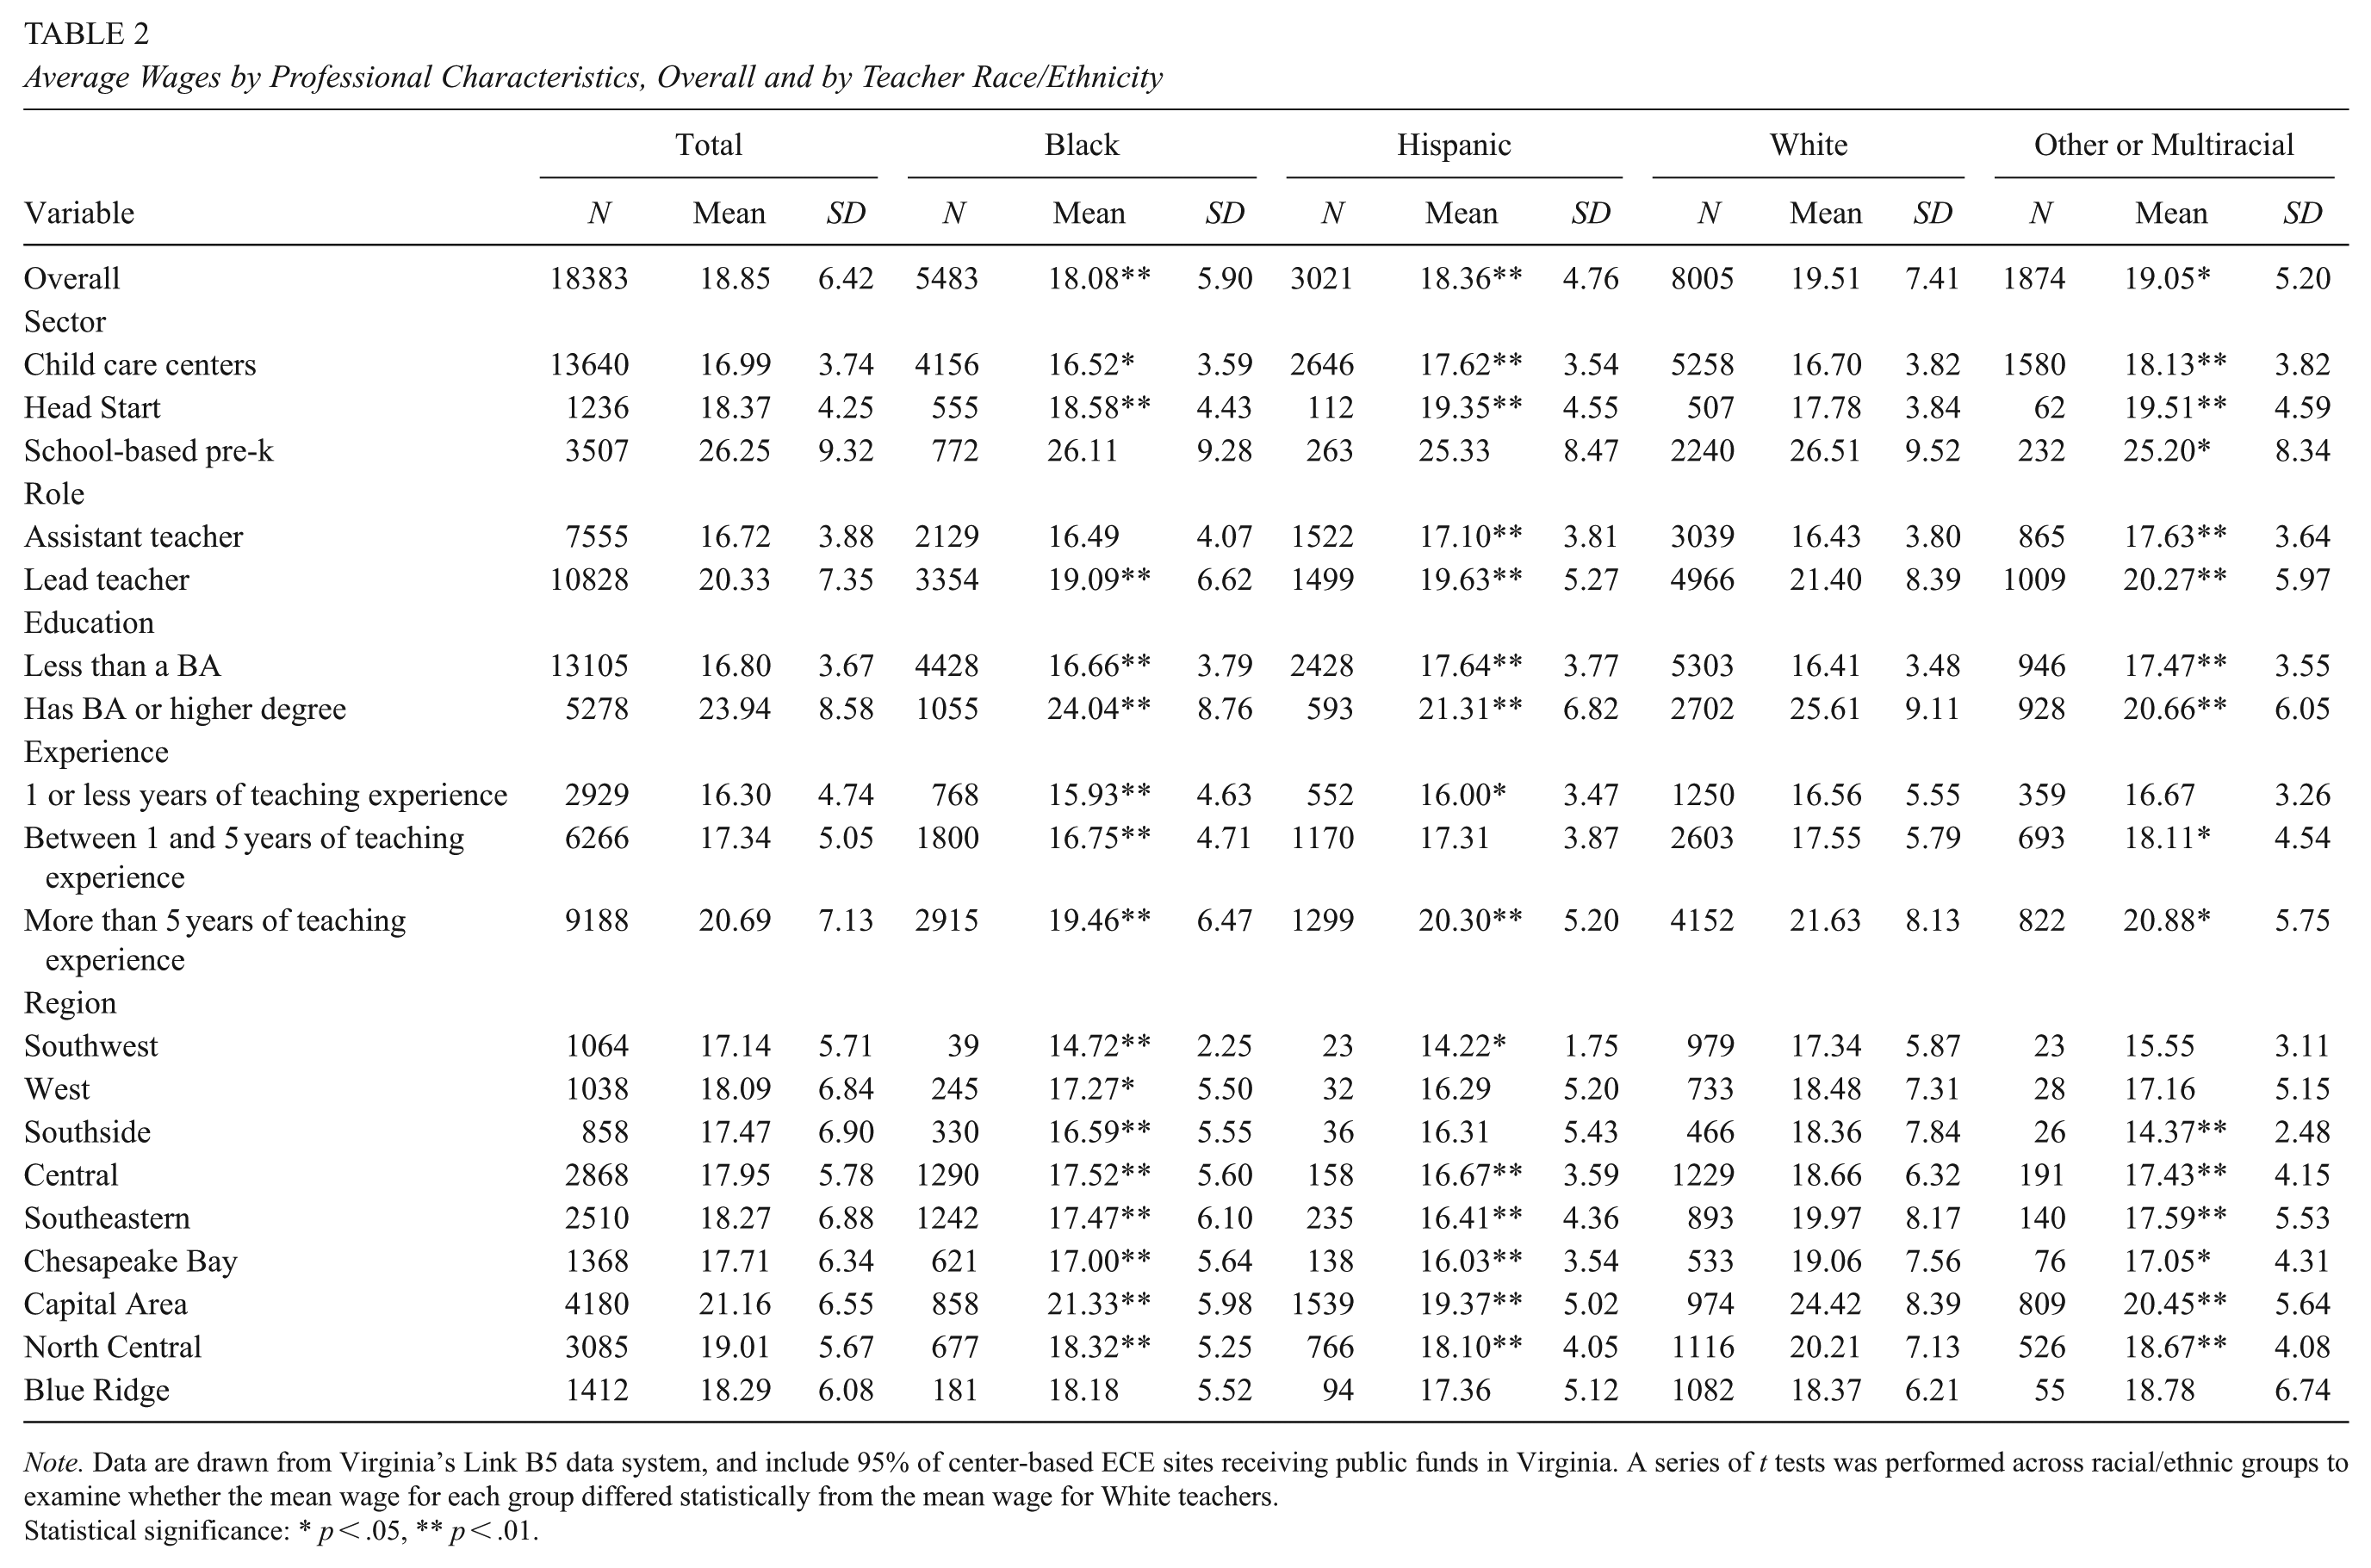
Note. Data are drawn from Virginia’s Link B5 data system, and include 95% of center-based ECE sites receiving public funds in Virginia. A series of t tests was performed across racial/ethnic groups to examine whether the mean wage for each group differed statistically from the mean wage for White teachers.
Statistical significance: * p < .05, ** p < .01.
Racial and Ethnic Wage Differences by Region, Sector, and Professional Characteristics
Our second research question was: To what extent do geographic region, sector, and teachers’ role, education level, and experience each relate to racial and ethnic differences in ECE teacher wages? Table 2 answers this question descriptively by showing that sector, role, education, experience, and region are all related to teacher compensation (Table 2, Column 2), consistent with previous literature. For example, teachers working in school-based pre-k sites reported considerably higher hourly wages ($26.25) relative to those at Head Start ($18.37) and child care centers ($16.99). On average, lead teachers reported pay nearly $3.61 per hour higher than assistant teachers. Teachers with a BA earned $7.14 more per hour than those without a BA; teachers with 5 years of experience or more received $4.39 more than teachers in their first year.
Table 2 also presents racial/ethnic differences in pay while holding specific profession characteristics constant. For instance, in the row labeled “schools” we show that White teachers working in school-based pre-k sites reported higher pay ($26.51) than Black teachers ($26.11) and Hispanic teachers ($25.33) who also work in these site types. In contrast, in both child care centers and Head Start programs, Hispanic and other/multiracial teachers reported the highest hourly earnings compared to all other racial/ethnic groups.
We see sizable racial and ethnic differences among teachers with equivalent professional characteristics across all categories. For instance, White lead teachers and White teachers with a BA earned considerably higher wages than Black, Hispanic, and other teachers with those same characteristics. Similarly, at every level of experience, White teachers earned more than Black and Hispanic teachers.
Notably, we do not see White teachers out-earning others in every group. For instance, among assistant teachers and teachers without a BA, White teachers reported lower wages than teachers in any other group. In most geographic regions, however, White teachers earned higher wages than teachers from any other racial and ethnic group.
Table 3 formalizes these comparisons and allows us to account for correlations among professional characteristics by presenting results from linear regression models that add professional characteristics in a stepwise manner. This strategy allows us to assess how pay gaps change once we account for region, sector, role, education, and experience. Model 1 replicates the uncontrolled results shown in Table 2, and demonstrates that, on average, Black, Hispanic, or other/multiracial teachers all earned lower wages than White teachers (Model 1, p < .01). Model 2 adds region fixed effects, and shows that among teachers working within the same region, racial gaps were larger than those observed in Model 1. For example, the wage gap between White and Black teachers increased from $1.44 per hour to $1.86, and the White-Hispanic gap increased from $1.16 per hour to $3.17 (p < .01). These results show that the unadjusted racial and ethnic wage difference is driven in part by regional variation in racial composition and pay, and that accounting for geographic region helps us better understand these gaps.
Coefficients From Linear Regression Models Predicting Teacher Wages
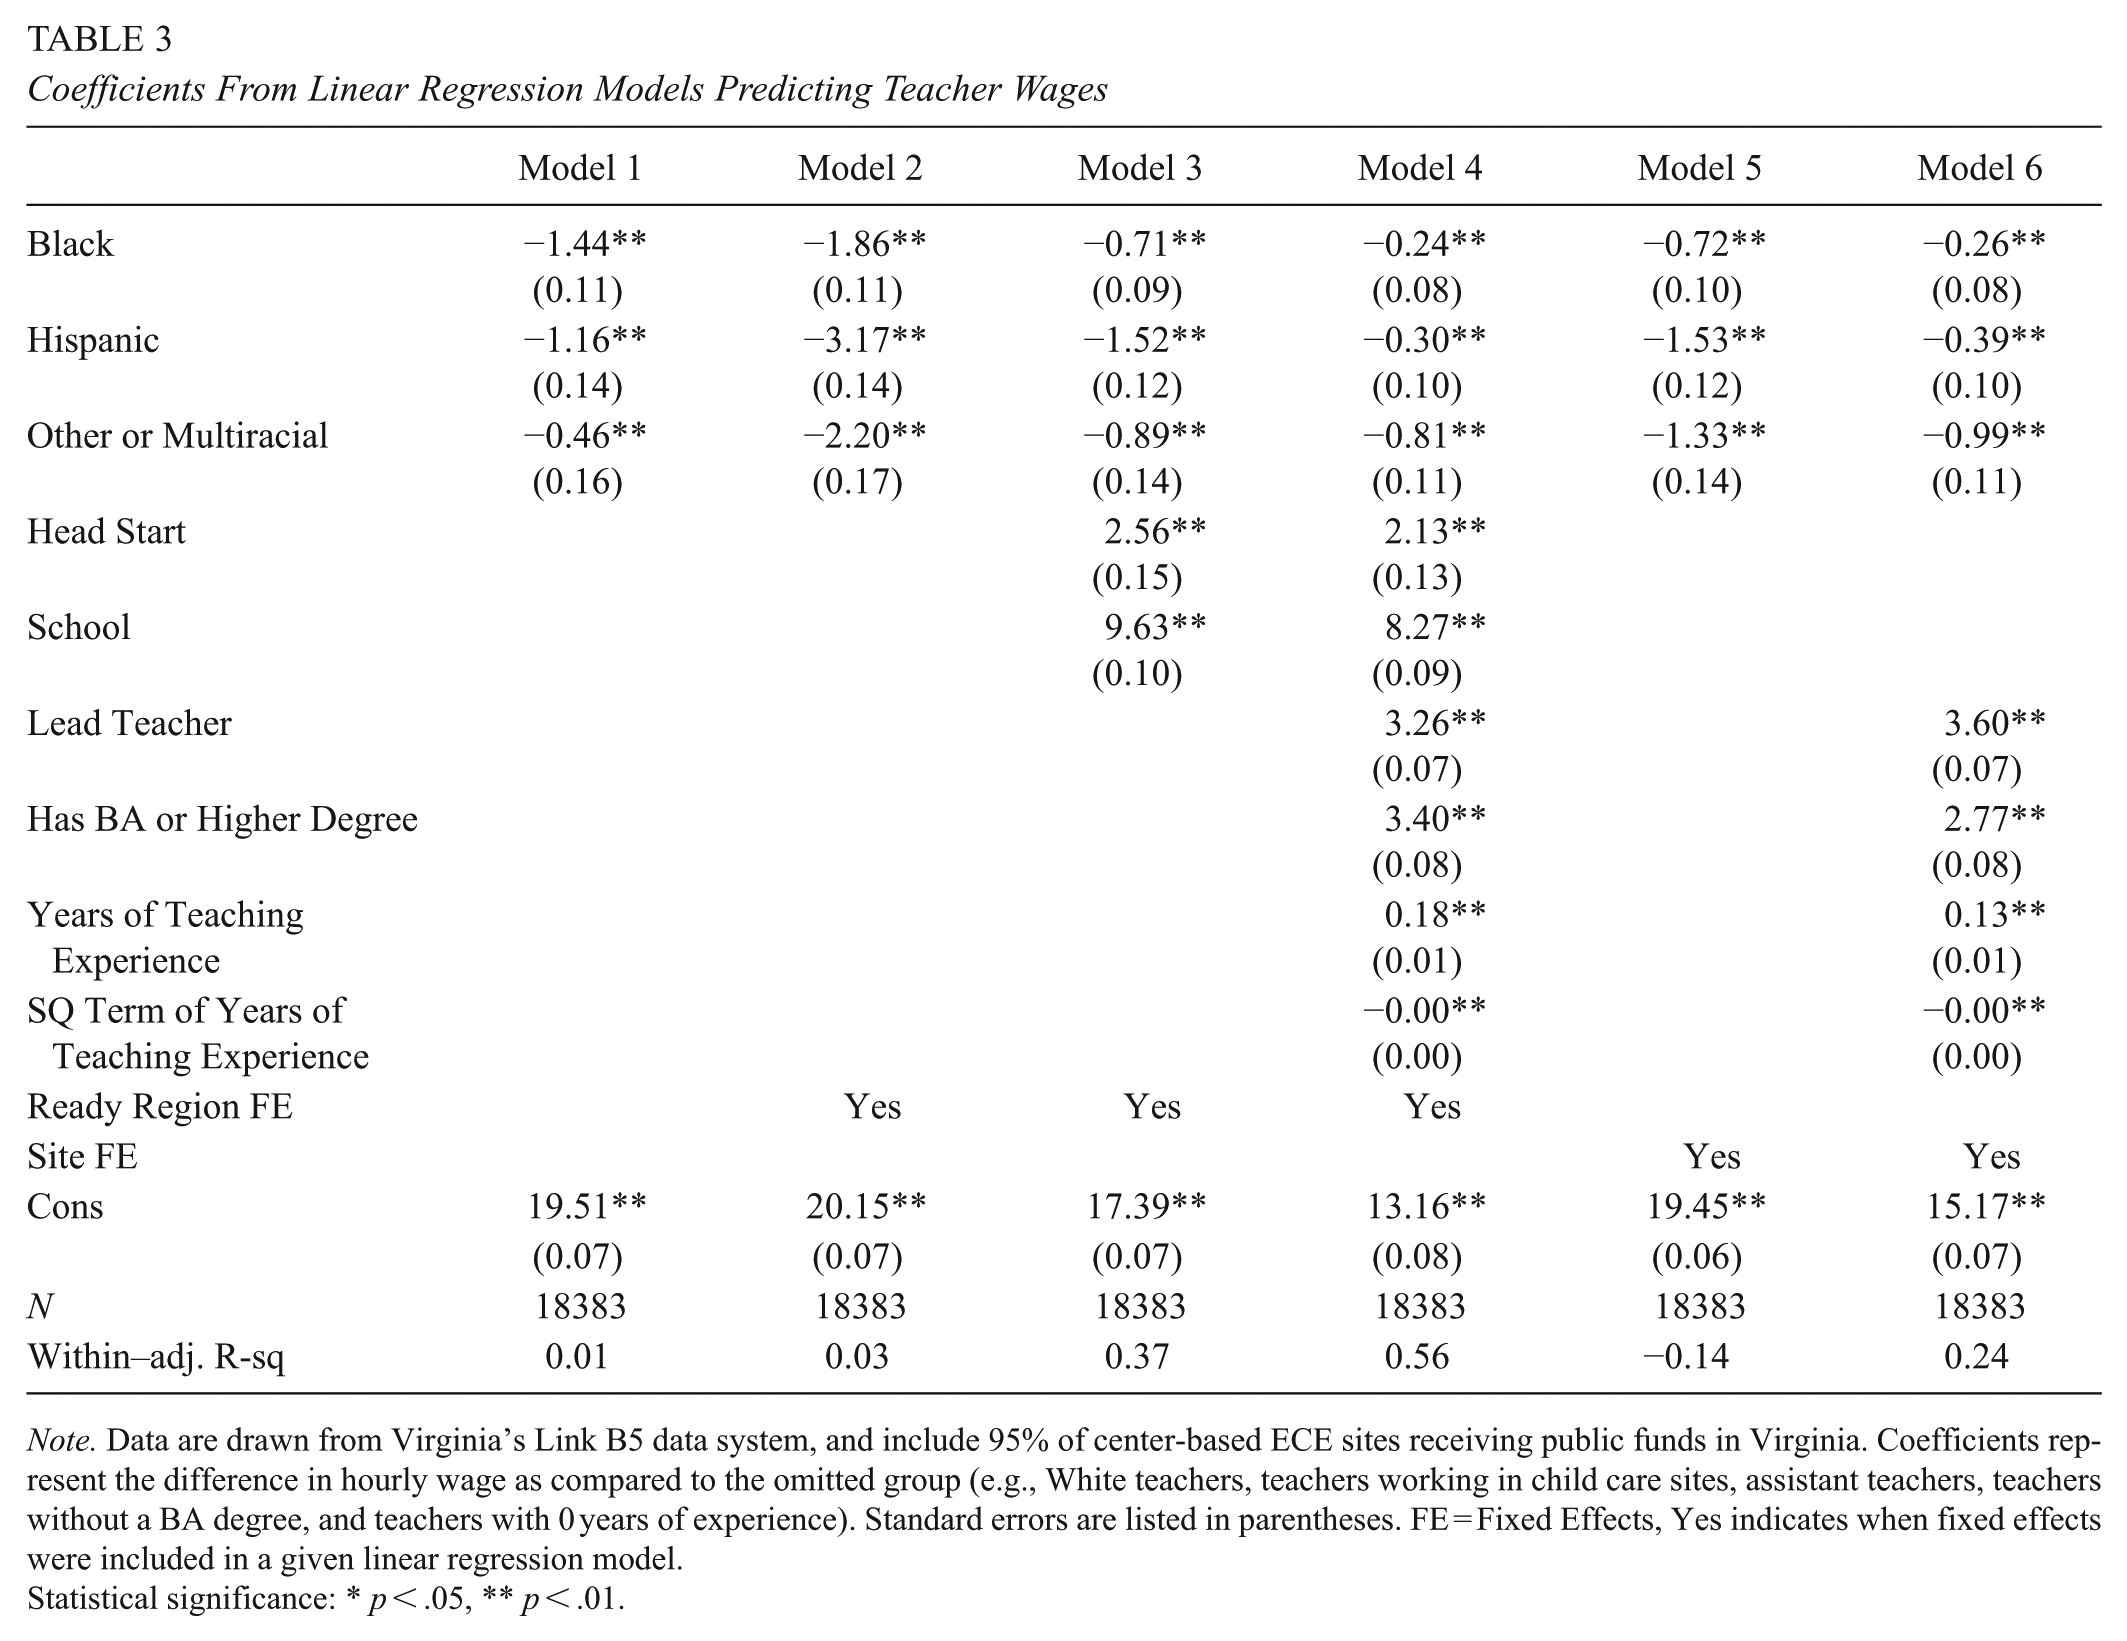
Note. Data are drawn from Virginia’s Link B5 data system, and include 95% of center-based ECE sites receiving public funds in Virginia. Coefficients represent the difference in hourly wage as compared to the omitted group (e.g., White teachers, teachers working in child care sites, assistant teachers, teachers without a BA degree, and teachers with 0 years of experience). Standard errors are listed in parentheses. FE = Fixed Effects, Yes indicates when fixed effects were included in a given linear regression model.
Statistical significance: * p < .05, ** p < .01.
Model 3 adjusts for sector and shows that teachers working in Head Start and school-based public pre-k sites earned higher wages (p < .01) than those in child care centers. Consistent with the racial/ethnic distribution of teachers across sectors, we found that adding sector to the model decreased the wage gap between White and Black teachers from $1.86 per hour to $0.71. The gap also decreased by $1.50 per hour for both Hispanic and other/multiracial race teachers.
Model 4 added teachers’ professional characteristics. In this Model, wage gaps were reduced to roughly 20-30% of their original size, suggesting that differences in professional characteristics are an important to consider. Nonetheless, large wage gaps remained: When we compared teachers working in the same region and sector, and accounted for role, education level, and experience, White teachers still earned $0.24 more per hour than their Black peers. Racial wage gaps also persisted between White and Hispanic teachers (β = −$0.30, p < .01) and White and other/multiracial teachers (β = −$0.81, p < .01).
Racial and Ethnic Pay Differences for Teachers Working in the Same Site
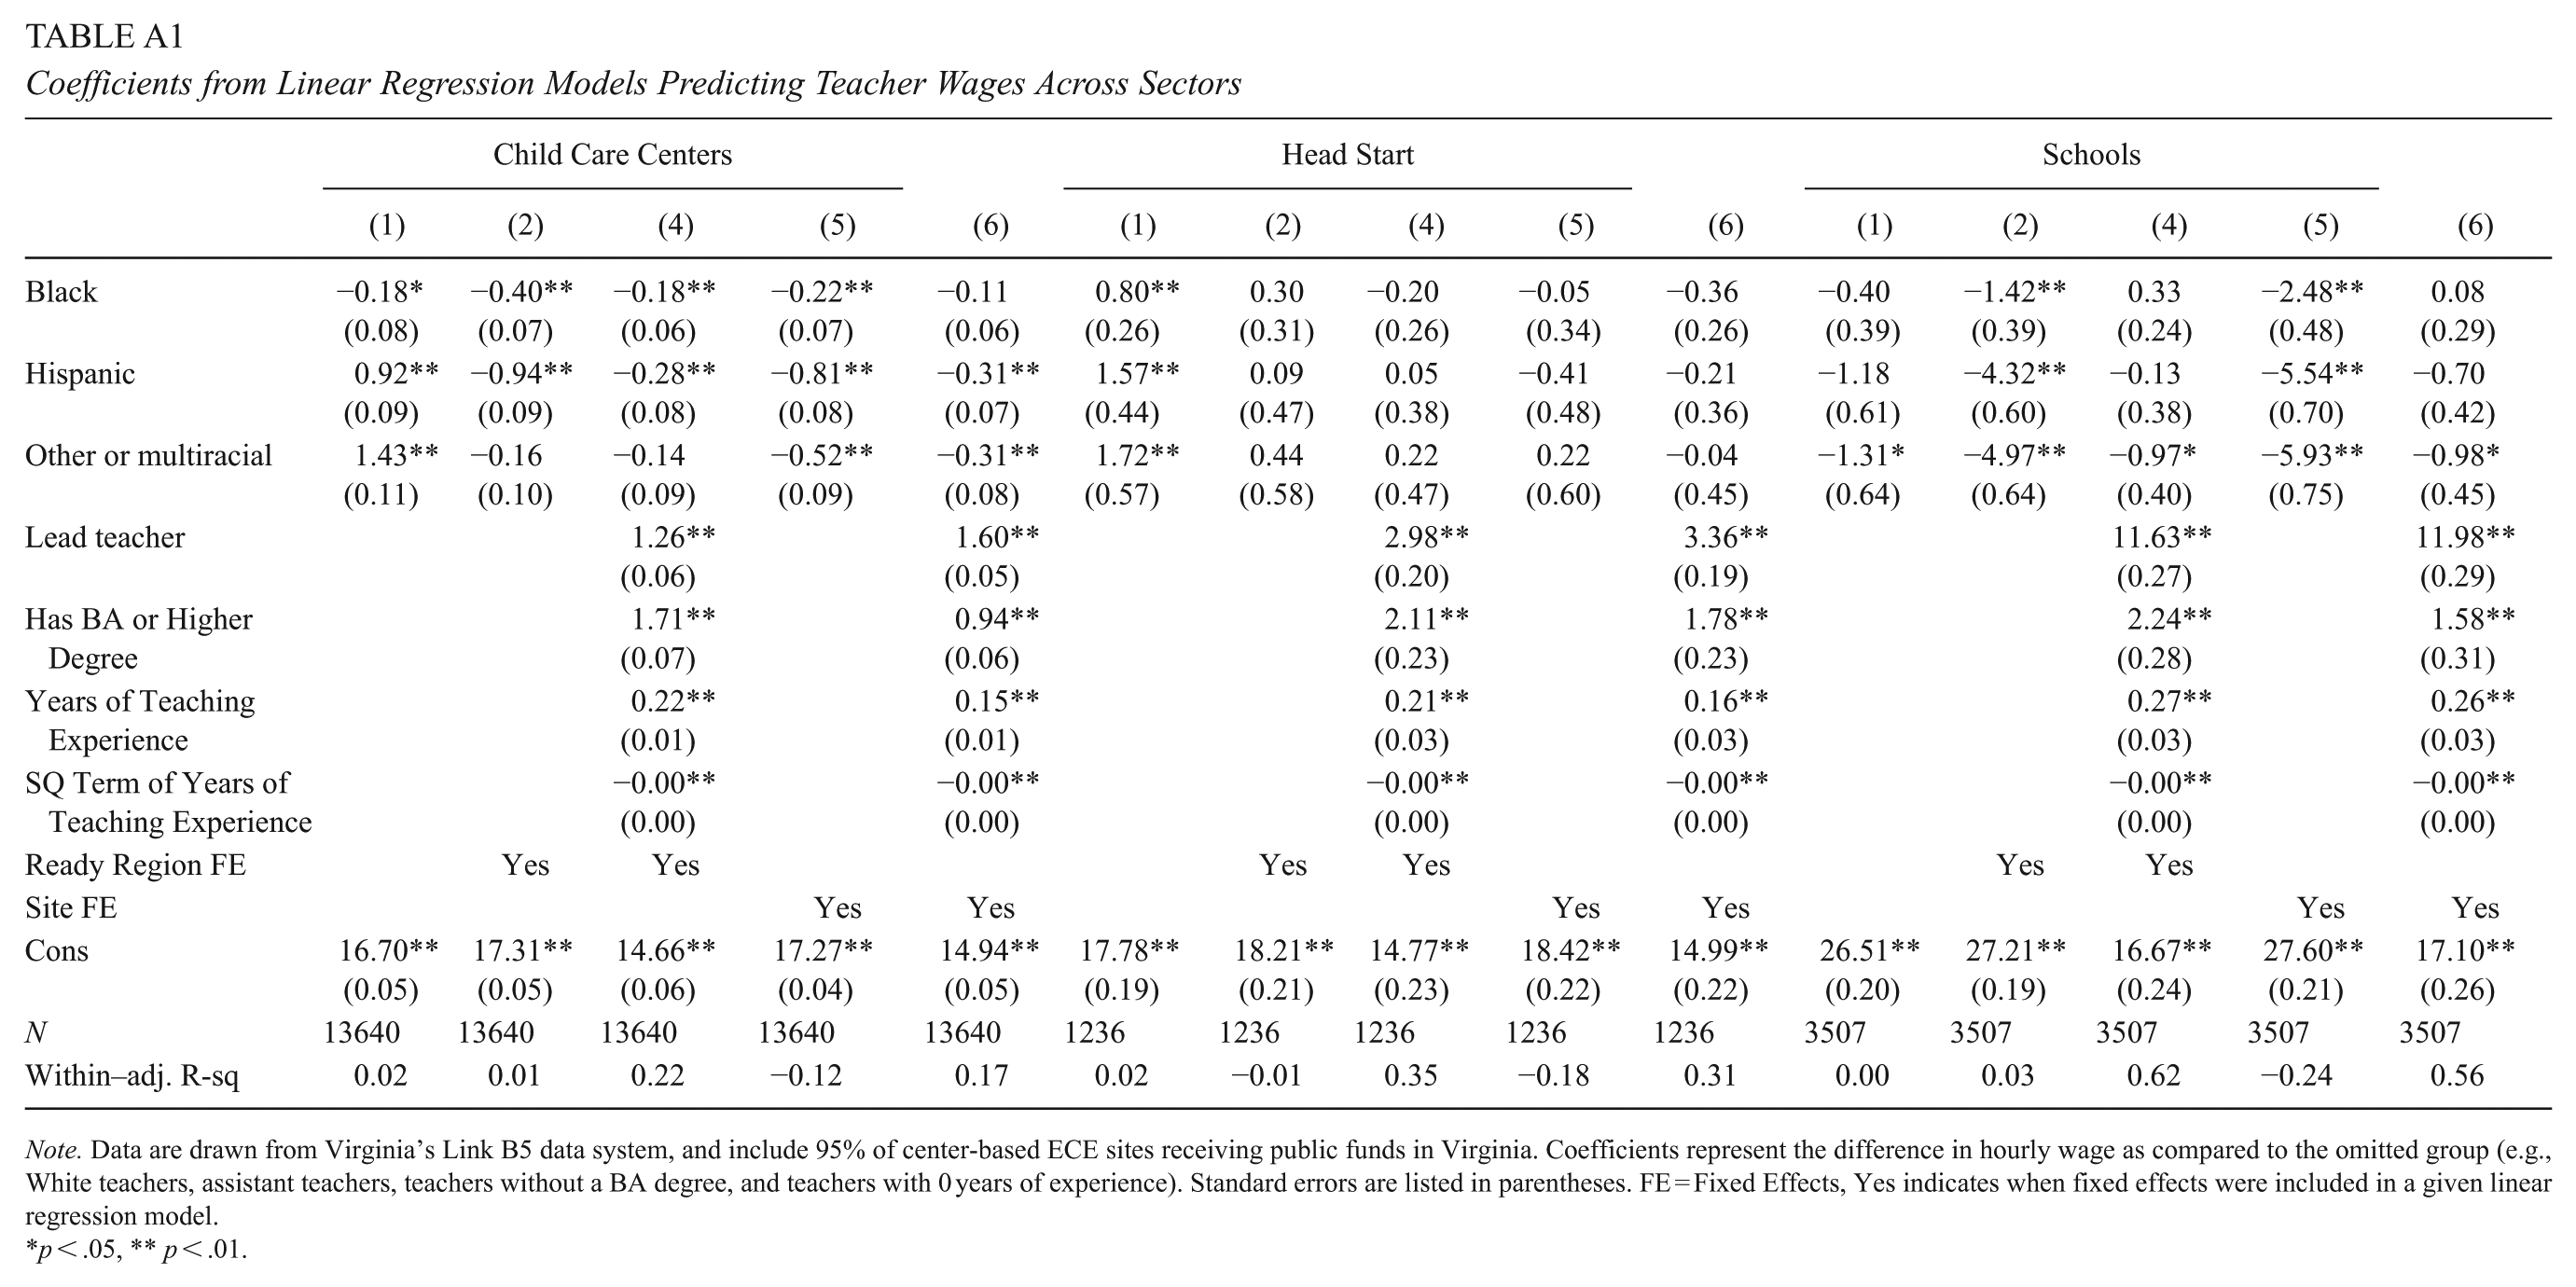
Finally, Models 5 and 6 in Table 3 present results from models that include site fixed effects and therefore allow within-site comparisons. Model 5 indicates that Hispanic and multiracial teachers employed at the same site experienced larger racial and ethnic wage gaps than the gaps observed in the baseline model. In Model 6, which accounts for teachers’ roles, education, and experience within sites, we still saw meaningful and statistically significant racial and ethnic wage differences: Black, Hispanic, and other/multiracial teachers experienced a wage gap between $0.26 and $0.99 (p < .01) per hour compared to White teachers. We also conducted a specification check in which we ran Model 6 separately by sector. Results (shown in Appendix 1) indicate that the within site differences only remain for child care centers. In Head Start and school-based pre-k, we do not find evidence of racial pay gaps within sites.
Discussion
The teachers and caregivers who work with children under 5 years of age in the United States earn wages that in most states put their annual earnings near or below the federal poverty line (McLean et al., 2019, 2021; Whitebook et al., 2014). Moreover, they face racial and ethnic wage disparities (Department of Labor, 2020; Hegewisch & Hartmann, 2019; Kim et al., 2024). Although studies have estimated wage gaps between White early educators and their counterparts from other racial or ethnic backgrounds (Coffey, 2022; Kim et al., 2024; Lee et al., 2023), data limitations have prevented previous studies from documenting the extent to which regional and professional differences, which themselves may reflect systematic inequality, drive racial and ethnic wage gaps. This study used data from a large sample including most of the early educators working in publicly funded sites in Virginia to provide new evidence on racial and ethnic wage gaps and explore how region, sector, and teachers’ professional characteristics relate to racial and ethnic wage gaps across and within center-based early childhood sites.
Evidence for Racial and Ethnic Wage Gaps
The average hourly wage of teachers in our sample was $18.85. Like prior national (Amadon et al., 2023; Coffey, 2022) and state level studies (Kim et al., 2024; Isaacs et al., 2018), we found statistically significant racial and ethnic differences, such that White teachers reported higher hourly wages ($19.51) than teachers from any other race or ethnicity. The gap is largest for Black teachers ($1.43), followed by Hispanic ($1.15) and other/multiracial teachers ($0.46).
Racial and Ethnic Wage Differences and Region, Sector, and Teacher Professional Characteristics
A key contribution of this study was the ability to account for a variety of structural factors that may contribute to wage gaps, and findings highlighted the particular importance of accounting for region. In our sample, there was substantial by-region variation in racial and ethnic teacher representation, and accounting for these differences altered our interpretation of wage gaps. For example, in the uncontrolled Model, the wage advantage for White teachers as compared to and Hispanic teachers was relatively small. Within Virginia Ready Regions, however, the White-Hispanic gap was nearly three times larger. This is because wages are higher in the Capitol Area, where more Hispanic teachers live. Thus, we observed that, conditional on cost of living, White teachers earned more than their Hispanic counterparts. Beyond the Capitol Area, urban areas tended to offer higher wages to account for increased costs—and tended to be more diverse because of White flight, redlining, and other racist policies. In prior analysis, failing to account for region may have considerably underestimated the magnitude of racial gaps. Our finding also highlights the importance of localized solutions, which may look different across urban and rural communities.
Our findings also highlight the importance of attending to sector. White teachers were more likely to work in public pre-k sites than teachers from any other race and ethnicity, and teachers in this sector also earned higher hourly wages than those in child care centers by $9.26 (p < .01). In other words, a considerable portion of the initial wage gaps observed reflects a racialized sorting of teachers into lower and higher paying sectors. Our findings suggest that efforts to increase compensation in child care sites specifically, and making them more comparable to Head Start and school-based pre-k (e.g., parity efforts), would considerably improve racial gaps. In contrast, policies that create across-the-board compensation increases, or focus on sectors already receiving significant public investments, may exacerbate existing gaps.
Teacher professional characteristics, including role, education, and experience, also help to explain teachers’ hourly wages in anticipated ways. For example, teachers with a BA were more likely to be White and earned more money than assistant teachers. This raises questions about how policies can address the structural sorting of educators into roles in the near term, while also considering longer-term strategies to address inequitable access to higher education across racial and ethnic groups.
Taken together, our results highlight that significant portions of the racial and ethnic wage gaps are explained by region, sector, and professional characteristics. At the same time, wage gaps persisted even after accounting for key drivers of teacher pay, such as role, education, and experience, with White teachers outearning Black, Hispanic, and Other/multiracial teachers by $0.71, $1.53, and $1.33 per hour, respectively. Notably, the Black-White wage gap we estimated is in the opposite direction as Lee and colleagues’ (2023) recent estimate; however, our study was able to account for key factors such as region and sector, which may drive this difference.
Racial and Ethnic Wage Differences in the Same Site
Finally, to our knowledge, this is the first study that documented racial and ethnic wage gaps between White teachers and teachers of color within sites, even in models that account for professional characteristics (gap magnitude between $0.26 and $0.99 per hour, p < .01). This finding suggests that there are other unobservable factors contributing to the gap, including organizational features (Wingfield & Chavez, 2020) and potentially interpersonal racism, a finding consistent with research conducted using resume studies (Boyd-Swan & Herbst, 2019). Although analyses could only leverage the relatively small subsample of sites that were not racially homogenous, future research should continue to investigate these within-site pathways.
Implications
Our results confirmed that ECE teachers’ pay in Virginia is low. Our estimated mean hourly wage of $18.85 is $6.80 lower than the estimated living wage for a single person with no children living in Virginia (MIT Living Wage Calculator, Glasmeier, 2025). Such low wages are likely to have implications for early educators, in the form of financial and emotional stress (McLean et al., 2021; Whitebook et al., 2014), and increased likelihood of seeking alternative employment (Bassok & Weisner, 2022; Totenhagen et al., 2016). In turn, child care staffing challenges may impact parents’ opportunities to seek employment or pursue higher levels of education. In addition, the low wages may affect teachers’ ability to effectively support children’s development (Markowitz et al., 2024).
To address this issue, both federal and state level policymakers have recently proposed and implemented strategies to improve teacher compensation. For example, the Office of Head Start (OHS) recently proposed a 7-year plan to achieve pay parity for Head Start education staff with K–3 teachers. At the state level, Alabama and Georgia have implemented pay parity policies that focus on programs that serve 4-year-olds and apply to both lead and assistant teachers working in all center-based sites. Other initiatives, such as the Early Childhood Educator Pay Equity Fund in the District of Columbia, exclude most public schools while encouraging participation from all other licensed childcare facilities.
More common than pay equity efforts are pay supplements, which have been used in Tennessee, North Carolina, and Minnesota to improve teachers’ financial well-being (e.g., Child Care WAGE$; The Saul Zaentz Early Education Initiative, 2023). Such funds typically offer relatively low award amounts (Whitebook et al., 2018b), however.
Across these examples, however, wage support for teachers varies by education, experience, and responsibilities (i.e., roles)—highlighting ways in which policymaking without sustained attention to inequality may not reduce racial and ethnic wage gaps. Our findings demonstrate the important role of structural sorting in creating these gaps; that is, although we found persistent gaps across specifications, much of the difference was explained by three structural factors (sector, education, and role), each of which is linked to past racist policies in the United States.
As such, our findings suggest that rather than implementing one-size-fits-all policies, attention to inequality via structural sorting should be baked into compensation policy solutions. For example, one strategy to address both low wages and racial and ethnic wage gaps is to target supports towards sectors and roles in which teachers of color are overrepresented, such as teachers working in private, center-based child care, assistant teachers, and new teachers. For instance, in 2019, Virginia implemented a financial recognition program (known as RecognizeB5) for teachers working in child care programs—the lowest-paying sector, and the sector where there are more Black and Hispanic teachers. Besides increasing teacher retention, the payments offered by the program helped teachers feel more valued and excited about their jobs and meet their basic needs like food and housing (Bassok et al., 2021a).
Another key strategy may be including investments in educational opportunities specifically for educators of color. These educators carry higher student loan debts than their White counterparts (Addo et al., 2016), thus policies that reward education may increase inequality without this supplemental support (Castro, 2022). While evidence on the effectiveness of loan forgiveness and alternative teacher preparation programs currently focuses on all teachers and not specifically teachers of color, reducing barriers for these teachers in particular may yield benefits in terms of reducing inequality (Castro, 2022). For example, results from the Teacher Education and Compensation Helps (T.E.A.C.H.) Early Childhood Project, which provides scholarships with comprehensive supports for the ECE workforce, suggest that such strategies may increase both education and compensation. A key challenge currently facing the program, however, is the high withdrawal rate of participants during the first year of the contract (around 40%, Miller & Bogatova, 2009), suggesting that the promise of future wages without immediate financial assistance may continue to pose a challenge (Bassok et al., 2021b).
States may also consider pathways for supporting teachers’ movement from assistant to lead teacher roles, and mentorship models that may support teachers of color in becoming leaders of their own classrooms. Leaders may consider the particular assets teachers of color bring to classroom spaces and sort teachers in sites based, in part, on the value of teachers with diverse backgrounds in leadership roles.
Fourth, states may consider broad investments in child care, and take steps to reduce ECE fragmentation. As Head Start centers seek pay parity with school-based pre-k (Administration for Children and Families, Office of Head Start, 2022), and school-based pre-k seeks parity with K–12 educators (Barnett & Kasmin, 2017; Garver, 2020), federal and state governments can recognize ECE as a public good and allocate funds so as to avoid substantial differences in compensation—and likely quality—across ECE sectors and sites (McLean et al., 2021). Some states, including New Mexico, Virginia, and the District of Columbia, are making substantial investments in educators and in child care subsidy systems to move compensation towards parity with other educators, but the efficacy of these programs is not yet well understood.
Lastly, we observed that racial and ethnic wage differences persisted within regions and within sites after controlling for professional characteristics. This suggests that unobservable, potentially implicit, racial bias may play a role. One way to counter such an influence could be a salary scale, as used in the K–12 sector, which sets specific wage bands based on teacher role, education, and experience. A scale could reduce racial/ethnic wage gaps by reducing the role of individuals’ stereotypes or biases in decision-making. However, as professional characteristics are also a product of historical systemic racism, any pay-scale policy that rewards education, specific training, or experience requirements cannot operate in isolation, as discussed above.
Limitations and Future Directions
This study used a dataset including key variables for understanding teacher wages, and comprising most early educators employed in publicly funded sites in Virginia. It addresses, in part, a data deficit that has impacted previous studies. Our measures of geographic area, sector, and professional characteristics provided a clearer look at correlates of wage gaps than previously available, and our ability to look within sites is novel. Nonetheless, there are limitations. First, we could not account for all factors that may explain wages and wage gaps. For example, previous studies have documented that union membership (Liu et al., 2025) and age of children cared for (Austin et al., 2019; Whitebook et al., 2018b) are related to disparities in teacher wages, but we did not account for those. Similarly, we did not account for degree area (e.g., focused on child development or another field) when assessing teacher education level. Further, our analytical sample was limited to teachers with full information on all covariates, resulting in a sample that was less likely to include teachers working at schools and holding a BA or higher degree, and more likely to include those earning higher salaries and serving in lead teacher roles, compared to the broader population of Virginia early educators in publicly funded ECE sites. These differences may lead to an underestimation of racial gaps, given that these characteristics are more common among White educators.
Second, while our sample includes 95% of all publicly funded ECE center-based sites in Virginia, our results do not reflect the experiences of ECE teachers working in sites that do not accept public dollars. In Virginia, about a third of licensed centers do not participate in the CCSP, and teachers working in these sites earn higher hourly wages than their counterparts in sites that do participate (Bassok & Weisner, 2023). Thus results cannot be clearly extrapolated to other states. Analysis of racial compensation differences among home-based providers—both owners and teachers—is also needed, as Black and Hispanic educators are overrepresented in home-based contexts, which often offer the lowest remuneration in the ECE field.
Finally, researchers should continue to explore how to best assess racial and ethnic identity in surveys (Viano & Baker, 2020). Broadly, survey items asking individuals to self-identify race and ethnicity likely do not capture teachers’ lived experiences with race, nor phenotypic variability that may meaningfully impact educators’ experiences. Beyond the overarching concern around accurately identifying racial and ethnic categories, there is also significantly more racial and ethnic diversity among ECE teachers than captured in our data. We have a limited number of racial and ethnic groups (e.g., only Black, Hispanic, and White teachers) and a limited understanding of racial and ethnic subgroups (e.g., immigrant Hispanic vs. non-immigrant Hispanic teachers). Policies that aim to reduce racial and ethnic wage gaps or other injustices will require a deep understanding of the barriers that each group faces.
Conclusion
This paper finds that ECE teachers from historically marginalized racial and ethnic groups were paid less than their White peers in Virginia. Although geographic region, sector, and teacher characteristics explained some of the difference, meaningful wage gaps remained even among teachers working in the same site. Researchers should continue to explore the drivers of pay gaps and identify effective policy levers. Policymakers interested in addressing racial and ethnic inequities could aim to reduce ECE fragmentation and implement strategies that increase compensation in the sectors and groups that receive the lowest pay.
Footnotes
Appendix
Coefficients from Linear Regression Models Predicting Teacher Wages Across Sectors
| Child Care Centers | Head Start | Schools | |||||||||||||
|---|---|---|---|---|---|---|---|---|---|---|---|---|---|---|---|
| (1) | (2) | (4) | (5) | (6) | (1) | (2) | (4) | (5) | (6) | (1) | (2) | (4) | (5) | (6) | |
| Black | −0.18*
(0.08) |
−0.40**
(0.07) |
−0.18**
(0.06) |
−0.22**
(0.07) |
−0.11 (0.06) |
0.80**
(0.26) |
0.30 (0.31) |
−0.20 (0.26) |
−0.05 (0.34) |
−0.36 (0.26) |
−0.40 (0.39) |
−1.42**
(0.39) |
0.33 (0.24) |
−2.48**
(0.48) |
0.08 (0.29) |
| Hispanic | 0.92**
(0.09) |
−0.94**
(0.09) |
−0.28**
(0.08) |
−0.81**
(0.08) |
−0.31**
(0.07) |
1.57**
(0.44) |
0.09 (0.47) |
0.05 (0.38) |
−0.41 (0.48) |
−0.21 (0.36) |
−1.18 (0.61) |
−4.32**
(0.60) |
−0.13 (0.38) |
−5.54**
(0.70) |
−0.70 (0.42) |
| Other or multiracial | 1.43**
(0.11) |
−0.16 (0.10) |
−0.14 (0.09) |
−0.52**
(0.09) |
−0.31**
(0.08) |
1.72**
(0.57) |
0.44 (0.58) |
0.22 (0.47) |
0.22 (0.60) |
−0.04 (0.45) |
−1.31*
(0.64) |
−4.97**
(0.64) |
−0.97*
(0.40) |
−5.93**
(0.75) |
−0.98*
(0.45) |
| Lead teacher | 1.26**
|
1.60**
|
2.98**
|
3.36**
|
11.63**
|
11.98**
|
|||||||||
| Has BA or Higher Degree | 1.71**
|
0.94**
|
2.11**
|
1.78**
|
2.24**
|
1.58**
|
|||||||||
| Years of Teaching Experience | 0.22**
|
0.15**
|
0.21**
|
0.16**
|
0.27**
|
0.26**
|
|||||||||
| SQ Term of Years of Teaching Experience | −0.00**
|
−0.00**
|
−0.00**
|
−0.00**
|
−0.00**
|
−0.00**
|
|||||||||
| Ready Region FE | Yes | Yes | Yes | Yes | Yes | Yes | |||||||||
| Site FE | Yes | Yes | Yes | Yes | Yes | Yes | |||||||||
| Cons | 16.70**
|
17.31**
|
14.66**
|
17.27**
|
14.94**
|
17.78**
|
18.21**
|
14.77**
|
18.42**
|
14.99**
|
26.51**
|
27.21**
|
16.67**
|
27.60**
|
17.10**
|
| N | 13640 | 13640 | 13640 | 13640 | 13640 | 1236 | 1236 | 1236 | 1236 | 1236 | 3507 | 3507 | 3507 | 3507 | 3507 |
| Within–adj. R-sq | 0.02 | 0.01 | 0.22 | −0.12 | 0.17 | 0.02 | −0.01 | 0.35 | −0.18 | 0.31 | 0.00 | 0.03 | 0.62 | −0.24 | 0.56 |
Note. Data are drawn from Virginia’s Link B5 data system, and include 95% of center-based ECE sites receiving public funds in Virginia. Coefficients represent the difference in hourly wage as compared to the omitted group (e.g., White teachers, assistant teachers, teachers without a BA degree, and teachers with 0 years of experience). Standard errors are listed in parentheses. FE = Fixed Effects, Yes indicates when fixed effects were included in a given linear regression model.
p < .05, ** p < .01.
Acknowledgements
The authors received no financial support for the research, authorship, and/or publication of this article. The authors are grateful for partnership with the Virginia Department of Education.
Declaration of Conflicting Interests
The authors declared no potential conflicts of interest with respect to the research, authorship, and/or publication of this article.
Funding
The authors received no financial support for the research, authorship, and/or publication of this article.
Notes
Authors
DAPHNA BASSOK is the Batten Bicentennial Professor of Early Childhood Education and Policy at the University of Virginia. Her research focuses on early childhood education policy and particularly the early childhood teacher workforce.
ANNA J. MARKOWITZ is an associate professor at the UCLA School of Education and Information Studies. Her research focuses on child development and policy for children and families, with a particular emphasis on early care and education settings.
DEIBY MAYARIS CUBIDES MATEUS is a senior research specialist at the University of Virginia. She studies early childhood education and the effects of parenting on young children’s cognitive and socioemotional development.