
Abstract
Students who experience foster care (SEFC) remain some of the most educationally marginalized youth in the United States. However, rates of secondary and postsecondary outcomes vary widely across studies, limiting the ability to inform policy. At present, there is no definitive publication that reports secondary and postsecondary education rates based on best available evidence. The goal of this study is to fill this gap by reviewing methodologically sound studies with SEFC. We conducted a systematic review of publications between 2000 and 2023. A total of 17 publications met our six inclusion criteria. Most findings came from regional rather than national studies. The high school/General Educational Development (GED) completion rate ranged from 69% to 85%, the postsecondary enrollment rate ranged from 29% to 64%, and the postsecondary degree completion rate ranged from 8% to 12%. Only three publications reported differences by race, which is an area in need of attention in future studies.
Keywords
Introduction
Students who experience foster care (SEFC) remain some of the most educationally marginalized youth in the United States. In the current study, SEFC include young people in foster care on or after their 13th birthday, which is the age limit set forth in the Free Application for Federal Student Aid (FAFSA) that allows students to file as an independent student when determining their financial aid needs. Three commonly reported statistics are that less than half of SEFC graduate from high school, about 20% enroll in college, and just 3% earn a college degree (Pecora et al., 2005; Wolanin, 2005). These statistics can be found on the websites of government agencies, college programs, and community-based organizations, as well as in many peer-reviewed articles. A problem is that these statistics come from regional studies that are more than 2 decades old and that have formidable methodological limitations (discussed below). Moreover, both studies include SEFC from a bygone era of child welfare policy. Since the late 1990s, several foundational policy changes have occurred, including the Fostering Connections to Success and Increasing Adoptions Act, a 2008 federal law that allowed states to raise the foster care age limit from 18 to 21. Moreover, an increasing number of states offer college tuition and fee waivers to SEFC. These and other policy changes have likely influenced factors that could lead to increased postsecondary access and completion rates for SEFC (Okpych et al., 2023).
Despite the limitations of the early studies, the abovementioned statistics have had staying power when reporting the educational outcomes for SEFC. This is partly because findings from more recent, well-designed studies are scattered and not always easy to find. In addition to outdated statistics, another problem for the field is that very few studies disaggregate secondary and postsecondary educational outcomes of SEFC by race. This is important because Black and Native American youth are overrepresented in foster care (U.S. Department of Health and Human Services [DHHS], 2023), and it is not known if educational disparities based on race observed in the general population of young people are similar for SEFC.
At present there is no definitive publication that reports secondary and postsecondary education rates for SEFC based on best available evidence. The purpose of this systematic review is to address this gap. To put things in context, we also compare outcomes for SEFC with those of the general population of young people in the United States. This comparison is needed to accurately gauge disparities and, in turn, to develop equity-minded policies and practices that seek to improve SEFC’s secondary and postsecondary outcomes. Most studies have narrowly focused on 4-year college degree completion among SEFC; we examine completion of both 2- and 4-year degrees. Many SEFC enroll in 2-year colleges (Havlicek et al., 2021; Okpych et al., 2022), and not counting these credentials would miss legitimate higher education degrees that have value in today’s economy (Carnevale et al., 2020; National Center for Education Statistics, 2024). As discussed later, structural barriers encountered by SEFC delay their postsecondary education (PSE) enrollment and completion, and thus it is important to measure completion at an older age than is traditionally measured. In this review, we examine PSE degree completion by age 25, which is about 6 years after SEFC first enroll in college on average (Okpych, 2021).
Access to a college education is vital for the upward mobility of under-represented students, leading to higher employment and earnings (Ma & Pender, 2023). The benefits of a college education reach beyond the workplace, as adults with higher levels of education are more involved in their families’ lives, are more civically engaged, volunteer more, and report better quality of life (Ma & Pender, 2023). Thus, having clearer data on the educational outcomes of SEFC is important to understand and close educational gaps for this student population. Our study is guided by three aims: (1) to estimate rates of secondary completion, PSE enrollment, and PSE completion for SEFC; (2) to compare secondary and postsecondary completion rates of SEFC to young adults in the general U.S. population, and (3) to examine differences in educational outcomes among SEFC by race/ethnicity.
At the behest of addressing the above research aims, we anticipate findings would help inform practice and policy for education and child welfare professionals, particularly helping to make the case for increased and sustained resources for SEFC across the K-16 education pipeline. These supports include professional development of educators and funding for programs housed within secondary and postsecondary campuses. As well, we anticipate findings to encourage policymakers to integrate data systems to track educational outcomes of SEFC.
Literature Review
The following sections summarize relevant areas of literature that frame our study. First, we provide an overview of foster care and the young people in the foster care system. Next, we summarize barriers to educational attainment that are unique to SEFC. We then provide an overview of federal child welfare and education policies aimed at improving educational outcomes of SEFC. Finally, we critically appraise early studies that measured educational outcomes of SEFC and provide a high-level overview of more recent studies investigating secondary and PSE outcomes for SEFC.
General Overview of Foster Care and Racial Disproportionality
Children can be placed in foster care for a variety of reasons, but the most common reasons are cases of maltreatment (e.g., neglect, physical abuse, or sexual abuse). After being removed from the custody of their biological/legal family, children may be placed in the care of relatives, non-relatives, or professionally staffed congregate care settings (Children Welfare Information Gateway [CWIG], n.d.). Although foster care is intended to be a temporary arrangement, some young people remain in foster care for several years or more. Most children in foster care are reunited with their families or are adopted. However, this is less common for adolescents in foster care (Rosenberg & Abbott, 2019). At the extreme, if a young person reaches their state’s foster care age limit, which ranges from 18 to 21 years old in most states, services provided through the child welfare system are discontinued and youth “age out” of care (Youth.gov, n.d.). A few states allow youth to remain in care past age 21 under certain circumstances (e.g., youth can remain in care up to age 23 in Connecticut if they are enrolled in higher education). Moreover, some benefits remain available beyond a youth’s 21st birthday, such as independent living services (up to age 23), Medicaid (up to age 26), and Education and Training Vouchers for postsecondary education (up to age 26). On September 30, 2022, there were 368,530 children and youth in the United States foster care system, including about 88,000 who were age 13 or older (DHHS, 2023). In the same year, nearly 19,000 youth aged out of the foster care system (DHHS, 2023).
Children and youth of color are overrepresented in foster care (Watt & Kim, 2019). A review of the national child welfare data and Census data underscores the disproportionate representation of racially minoritized children in the foster care system (Kids Count, 2023a, 2023b). Compared to their representation in the U.S. population, three racial groups were overrepresented in foster care: Black/African American children (14% vs. 22%), American Indian/Alaska Native children (1% vs. 2%), and children with two or more races (5% vs. 8%). In contrast, White children (49% vs. 43%), Hispanic children (26% vs. 22%), and Asian children (5% vs. 1%) were underrepresented in foster care. Decisions made by professionals in and adjacent to the foster care system contribute to the racial disparities for youth of color in foster care, which can negatively impact their interpersonal, physical, and economic well-being over the lifespan, compounding the disadvantages they face due to structural racism (Dettlaff & Boyd, 2020). This “racialized poverty” is associated with a disproportionate number of racially minoritized children entering the foster care system for neglect (Dettlaff, 2023, p. 6).
These racial disparities in foster care involvement are important because they track disparities in secondary and postsecondary educational outcomes in the general student body (U.S. Department of the Treasury, 2023). Structural and systematic inequalities, such as lack of financial aid, school readiness, and racism, continue to create a gap in racial and ethnic representation in the U.S. secondary and postsecondary education system (Espinosa & Mitchell, 2020; Espinosa et al., 2019; Liu, 2022). Despite institutional efforts to promote equity at different educational levels, minoritized students continue to be underrepresented (Jordan et al., 2021; Monarrez & Washington, 2020).
Although studies report disparity in racial representation in the U.S. secondary and postsecondary education system, little is known about such representation among in-college SEFC and their outcomes. Only a couple of studies have recently addressed SEFC educational and well-being outcomes with a race-based approach (see Dworsky et al., 2010; Watt & Kim, 2019). It is important to document the presence and magnitude of racial disparities in educational outcomes among SEFC. For example, it may be that involvement in foster care amplifies or lessens disparities in the general population of students.
Barriers to Educational Outcomes Unique to SEFC
A body of qualitative and quantitative studies have identified barriers that may hinder secondary and PSE outcomes for SEFC (for summaries see Geiger & Beltran, 2017; Johnson, 2021; Okpych, 2021; Piel, 2018). Many of the factors discussed below are exacerbated by child welfare and schooling systems that are ill-equipped to meet the emotional, relational, and educational needs of SEFC. Relationships with family members are often severed when SEFC are placed into foster care (Fawley-King et al., 2017; Hegar & Rosenthal, 2011; Hindt & Leon, 2022). Multiple placement changes are also common among SEFC (Clemens et al., 2018), and each change is a disruption in students’ caregivers and living environment (Hindt & Leon, 2022). Some SEFC also change schools multiple times while in foster care, which causes missed days of school, misaligned curriculum, and learning gaps (Fawley-King et al., 2017).
Peer networks and relationships to key school staff (e.g., teachers, counselors, administrators) are also disrupted with each school change. Trauma stemming from past maltreatment and residential and relational instability in care also takes a toll on the mental health of SEFC, which disrupts attention, information processing, and retention (Bronsard et al., 2016; Dye, 2018; Zlotnick et al., 2012). Based on past experiences of abrupt losses of important relationships, some SEFC also take on a self-protective stance toward new relationships, which can limit the number of people to turn to for guidance and support (Okpych & Courtney, 2018; Samuels & Pryce, 2008; Somers et al., 2020). SEFC also report facing stigma from educators and peers arising from their foster care status (Batsche et al., 2014; Clemens et al., 2016).
SEFC are often the first in their families to attend higher education, come from economically marginalized families and communities, and attend under-resourced schools (Gross et al., 2020). While in college, SEFC are at greater risk than their peers of becoming homeless or food insecure (Fowler et al., 2017; Goldrick-Rab et al., 2019; Park et al., 2024), and economic hardships have been found to decrease the odds of graduating (Okpych & Courtney, 2020). Many of the services and resources offered by the child welfare department are time- or age-limited. For example, in most states, young people must leave care on their 21st birthday. This means that many SEFC in college will abruptly lose funding for housing from SEFC in the middle of their college career. Moreover, several sources of financial aid that help SEFC pay for college (e.g., Pell grants, remaining in foster care past age 18, state tuition waivers, Education and Training Vouchers) require SEFC to maintain certain enrollment intensities and grade point averages (GPAs). This can be challenging for SEFC who have not been well prepared for higher education, and the sudden loss of financial resources could trigger a cascade of challenges leading to dropout (Okpych, 2021). SEFC often occupy one or more marginalized identities, including being from low SES backgrounds (Zilberstein, 2016) and from families of color (Dettlaff & Boyd, 2020), whereby they encounter additional barriers to academic resources that further impede their educational success due to systemic racism and classism. Many of the outcome disparities for those with foster care backgrounds stem from unjust legal and systems-level processes and procedures (Stewart, 2022).
Scholars have also drawn attention to the ways in which college campuses are structured around the assumption that students have a traditional nuclear family, such as the assumption that students have family to help on move-in day, co-sign a lease for their college apartment, attend Family Weekend events, celebrate holidays, and stay with during academic breaks (Gamez & Lopez, 2021; Whitman & Lopez, 2025).
Some of the factors discussed above are unique to SEFC (e.g., grappling with aging out of care) while others are faced by other college students but are more pervasive or extreme in SEFC (e.g., secondary school mobility, basic needs insecurity in college). It is also important to recognize that not all SEFC face the same constellation of barriers. Also, there are SEFC who succeed in high school and college in spite of the barriers. Several studies have documented academically successful SEFC who draw on support from others, advocate for their needs when child welfare and educational systems fall short, and draw on their personal fortitude to achieve their educational goals (e.g., Avant et al., 2021; Kinarsky, 2017; Salazar et al., 2016). Studies have also shown that connecting youth with key relationships and material support can improve their educational outcomes. For example, receiving a federally-funded educational voucher to pay for college expenses has been associated with improved retention and graduation (Okpych et al., 2020; Hanson et al., 2022) and some campus-based support programs for SEFC achieve retention rates that approach or best rates of the general student population (e.g., Lenz-Rashid et al., 2018). Thus, more equitable educational attainment for SEFC is possible so long as strong policies and practices are in place.
Overview of Federal Child Welfare and Education Laws for SEFC
Since the late 1990s, federal policymakers have passed laws aiming to promote the educational attainment and wellbeing of SEFC as they transition from adolescence to adulthood. In the 1980s young people who aged out of care were largely left to fend for themselves when they reached their 18th birthday, and foundational reports found that many experienced a troubling transition to adulthood (e.g., Festinger, 1983). First, following a few smaller laws enacted in the 1980s and mid-1990s, the Foster Care Independence Act of 1999 (FCIA; renamed Chafee Foster Care Program for Successful Transition to Adulthood in 2017) set aside $140 million annually to fund programs and services that would help foster youth achieve self-sufficiency. Importantly, three of the 13 types of services focused on education, specifically academic support with secondary education (e.g., General Educational Development [GED] preparation, tutoring), educational expenses (e.g., money for books, computers, test fees), and postsecondary education support (e.g., SAT prep, assistance with applying for college and financial aid).
Second, in 2001 the FCIA was amended to create the Education and Training Vouchers (ETV) Program. Youth who were in foster care at or after a certain age (typically age 14 or 16 in most states) can apply for an ETV each year for up to $5,000, which can be used to pay for postsecondary education expenses such as tuition and fees, books and supplies, and transportation. Third, the 2008 Fostering Connections to Success and Increasing Adoptions Act (Fostering Connections) was a substantial change to child welfare policy. It gave states the option to extend the foster care age limit from 18 to 21.
Youth who participate in extended foster care receive housing, food, other basic needs resources, and continued monitoring and support from their foster care caseworker for an additional 3 years. Fostering Connections provides material support during a time when many SEFC are finishing high school and aspire to enter postsecondary education. In fact, two of the five ways youth remain eligible to participate in extended foster care is by working toward their secondary and/or postsecondary school credentials. Fourth, the Family First Prevention Services Act of 2018 included provisions that extended the age limit of FCIA services from 21 to 23 and the age limit of the ETV program from 23 to 26 (with a maximum of 5 years).
In addition to child welfare legislation, several education laws have been enacted in the past 2 decades that target SEFC. The 2007 College Cost Reduction and Access Act allows SEFC who were in care at age 13 or later to file as an independent student on their FAFSA, which makes them more likely to be eligible for need-based grants that do not need to be repaid. A 2008 reauthorization of the Higher Education Opportunity Act designates SEFC as automatically eligible for federally funded programs for low-income and underrepresented students, such as Upward Bound and Student Success Services. To promote the educational stability of SEFC, the 2013 Uninterrupted Scholars Act created a Family Educational Rights and Privacy Act (FERPA) exception for child welfare agencies that need to obtain school records for SEFC when they are changing schools. This law enables child welfare agencies to quickly access past school records needed to enroll SEFC in a new school. Finally, the Every Student Succeeds Act (ESSA) of 2015 stipulates that SEFC should remain in their school of origin unless a school change is necessary and beneficial (U.S. Department of Education, n. d.). When a school change is warranted, the receiving school must enroll the SEFC immediately and promptly request school records to avoid enrollment gaps. ESSA is meant to reduce the deleterious effect of school changes on SEFC, for whom multiple school changes are not uncommon (Clemens et al., 2016; Courtney et al., 2014).
Beyond federal legislation, the past few decades have witnessed a surge in state policy and local initiatives to support the educational success of SEFC. For example, more than half of U.S. states have laws that make SEFC eligible for a full or partial tuition waiver for an in-state public college or university (Bustillos et al., 2022). Several hundred colleges and universities across the country house programs that are specifically designed to support SEFC financially, socially, and logistically (i.e., navigating campus offices, resources, and processes) as they pursue their degree (Geiger et al., 2018; John Burton Advocates for Youth, 2022a; Whitman et al., 2023). Despite the tapestry of federal laws and state and local initiatives, the available support for SEFC varies widely from state-to-state and not all SEFC receive services that are due to them. For example, less than half of eligible SEFC receive independent living services funded by the FCIA law (Okpych, 2012) and only about a third (37%) of SEFC eligible for an ETV receive one (Hanson et al., 2022), notwithstanding ETVs attempt to be a policy response to address systemic inequities. Despite ESSA’s potential of reducing school mobility, SEFC recount stories of multiple school changes and the toll these take on their learning and wellbeing (Johnson, 2024). As described above, the structural barriers, life circumstances, and service gaps contribute to educational disparities between SEFC and their peers.
Critical Appraisal of Early Influential Studies on Educational Outcomes for SEFC
One of the germinal studies reporting rates of secondary and PSE outcomes for SEFC is Wolanin’s (2005) report titled Higher Education Opportunities for Foster Youth: A Primer for Policymakers. This publication continues to be widely referenced by policymakers, scholars, and administrators when reporting how SEFC fare in high school completion and college enrollment (Okpych, 2023). The report states that 50% of SEFC graduate from high school and only 20% of SEFC who completed secondary school go on to enroll in PSE. These statistics are based on a compilation of findings from five research studies based on data gathered before the turn of the century. While the two statistics appear to provide a degree of clarity and precision, in reality they are likely inaccurate. The five studies varied in terms of geographic region, how SEFC were defined for the sample, the rigor of study design (e.g., some studies did not have a representative sample, some studies had low response rates), and the age or range of ages outcomes were measured (e.g., one study had SEFC as young as 16, another study had a very broad age range of 20–33 years old). Given the differences in the studies’ designs and rigor, it is not surprising that the individual studies yielded outcome estimates that varied widely. For example, the PSE enrollment rates were 1%, 9%, 24%, 24%, and 43%. It appears that the 20% college enrollment estimate presented in the report was calculated by simply averaging these five statistics, with no attention paid to the quality of the study or whether the outcome was measured at a reasonable age.
A second early and important study on educational outcomes for SEFC was Pecora and colleagues’ (2005) Northwest Foster Care Alumni study, which is based on a survey completed by 479 adults (response rate = 76%) between the ages of 20 and 33, who had been in family-based foster care for a minimum of 12 consecutive months between the ages of 14 and 18, sometime between 1988 and 1998 (Pecora et al., 2005). The study was limited to individuals placed in foster care in three locations in Washington State (Seattle, Tacoma, and Yakima) and one location in Oregon (Portland). The study reported that only 2.7% of former foster youth aged 25 and older attained a 4-year degree (Pecora et al., 2005). Although the study had a high response rate for this population (76%), several considerations limit the usefulness of the 3% statistic when describing the college complete rate of SEFC. Most obvious is that the statistic only counted bachelor’s degrees. This is a problem because SEFC are more likely to attend 2-year colleges than 4-year colleges (Havlicek et al., 2021; Okpych, 2021; Okpych et al., 2023), and the statistic fails to capture associate’s degrees. Despite this, the 3% statistic is routinely misquoted in programs and publications. Second, the sample includes adults who had been in foster care a long time ago, before major child welfare policies were enacted to support SEFC. Third, there are problems with the generalizability of the data. It is based on data collected from four counties in the Northwest, spread across two states. The sample only includes youth placed in family foster care, and thus excludes SEFC placed in congregate care settings that tend to fare poorer in educational attainment (Courtney & Hook, 2017). Thus, while the Wolanin (2005) and Pecora et al. (2005) studies provided an early look at educational outcomes for SEFC, both suffer from methodological limitations and are based on data from a bygone era of child welfare policy that compromises how relevant they are to current estimates.
Overview of More Recent Studies on Secondary and PSE Outcomes for SEFC
In the years since the Wolanin (2005) and Pecora et al. (2005) publications, many studies have been conducted that examine secondary and PSE outcomes for SEFC. In this section we provide a broad overview of this literature, focusing specifically on studies that were not included in our systematic review because they failed to meet one or more of the inclusion criteria.
Several studies report secondary and/or PSE outcomes as part of a program evaluation for SEFC. For example, Kroner and Mares (2009) measured the high school completion at time of discharge for SEFC who were served by an independent living program in southeastern Ohio. Villegas et al. (2014) used the Casey National Foster Care Alumni Study to examine the relationship between ethnicity and secondary/postsecondary completion among SEFC in several U.S. states. Quintana and Cook-Davis (2022) evaluated a college bridge program at Arizona State University that was designed to expand PSE access for SEFC Arizona State University. Lenz-Rashid (2018) and Unrau et al. (2017) reported graduation rates for students who participated in a campus-based support program for SEFC at San Francisco State University and Western Michigan University, respectively. Within the context of our inclusion criteria, one limitation shared by these and other studies is the participant selection criteria. Students who are recruited, screened-in, and/or volunteer to participate in programs are not a random sample of SEFC, so education outcomes among program participants may not be representative of outcomes for the larger SEFC population.
Another batch of studies draws on administrative data to examine education outcomes of SEFC. Watt et al. (2019) linked child welfare and education data for a representative sample of YEFC in Texas and reported rates of college enrollment and college completion. One limitation with the study is that the sample included individuals who had been in Texas foster care at any point in their lives (e.g., an adult who had only been in foster care as an infant). One issue is that, compared to youth in foster care exclusively as children, adolescents in foster care face distinct life circumstances, developmental tasks, uncertainty around aging out of care, and limited access to resources that aid the transition to adulthood. Several published studies conducted secondary analyses of data collected by the National Youth in Transition Database (NYTD, described below; e.g., Geiger & Okpych, 2022; Kim et al., 2019; Rosenberg & Kim, 2018; Watt & Kim, 2019). A limitation of these data when measuring PSE enrollment is that the survey only asks SEFC about current enrollment, and not counting past enrollment can lead to a substantial undercount of enrollment rates (Okpych, 2023).
Multiple studies analyze data from surveys of SEFC, but they have limitations with low response rates, representativeness of the sample, or the age at which outcomes are measured. For example, Reilly and Schlinkert (2022) assess the benefits of an extended program for transition to adulthood for SEFC in Clark County, Nevada; however, the survey response rate was low (47%), which could introduce nonresponse bias into estimates of educational attainment. Scott and White (2023) analyzed data collected from a survey of SEFC in Missouri with a high response rate (> 80%), but their measure of high school completion only captured youth who had graduated by about age 19. SEFC often take longer to finish high school and enroll in college than their peers, so measuring high school completion only up to age 19 will lead to an undercount of graduations.
It is encouraging that the amount of research attention to SEFC has increased over the past 2 decades, and these studies are making valuable contributions to policy in their own ways. However, when trying to accurately estimate secondary and PSE outcomes, our review finds that many of the studies have limitations using our review inclusion criteria. We include studies that have been published with a well-defined, representative sample of SEFC, a strong response rate, and that have measured education outcomes up to an adequate age. The purpose of this systematic review is to locate and summarize the findings of those methodologically sound studies. Specifically, three research questions guide our study:
What are the secondary completion rates, postsecondary education (PSE) enrollment rates, and PSE completion rates for SEFC?
How do the rates of SEFC compare with rates of young people in the United States?
What are the differences by race and ethnicity in secondary completion rates, PSE enrollment rates, and PSE completion rates for SEFC?
Methods
The research team included researchers from higher education and social work as well as a consultant with extensive higher education and child welfare expertise and experience administering programs to support SEFC. We used the Preferred Reporting Items for Systematic Review and Meta-Analysis Protocols (PRISMA-P) method to conduct our systematic review (Moher et al., 2015). A systematic review attempts to assemble all literature that fit specified criteria to answer specific research questions (Moher et al., 2015). The research team first developed inclusion criteria for the review, followed by a set of search terms designed to locate publications relevant to the research questions. Our systematic review was conducted between October 2023 and April 2024. Our review only included quantitative studies with representative samples of SEFC since our study’s objective was to identify accurate estimates of secondary and postsecondary outcomes for this population. Quantitative studies published in peer-reviewed journal articles, white paper reports, and books/book chapters were eligible for our systematic review. Dissertations were not included.
Study Inclusion Criteria
Our study had six inclusion criteria. A publication had to meet all six criteria to be included in the systematic review. First, the publication had to have a representative sample of youth who were in U.S. foster care on or after their 13th birthday. We selected age 13 because this is the cutoff used in the FAFSA that designates students who were in foster care at any time since turning age 13 to be an independent student for financial aid purposes (U.S. Department of Education, 2024). Second, if data were collected via survey, the study’s response rate had to be at least 60%. While acceptable response rates is a matter of debate in survey research, some scholars maintain that a response rate of 60% or greater is adequate for addressing concerns about nonresponse bias (e.g., Groves & Peytcheva, 2008; Sivo et al., 2006). 1 Third, the study must have assessed at least one of three outcomes up to a certain age:
Rate of secondary completion (high school diploma/GED) when study participants were age 21 or older.
Rate of PSE enrollment when study participants were age 21 or older.
Rate of PSE completion when participants were age 25 or older.
Since SEFC often complete educational milestones at a later age than their peers, the age specifications were used to ensure outcomes were assessed up to reasonable minimum ages. Fourth, study participants had to have been in U.S. foster care at some point in 2000 or later. A key federal child welfare law that earmarked $140 million per year for older youth in foster care was enacted in 1999 (Park et al., 2020). Thus, 2000 marks a critical shift in federal child welfare policy aimed at supporting the transition to adulthood for older youth in care. Accordingly, the fifth criterion is that the study had to be published in 2000 or later. Sixth, the study had to have been written in English.
Search Procedures
With consultation from two university reference librarians, we identified nine academic databases relevant to our topic to search the literature: PsycInfo; Scopus; Social Work Abstracts; SociINDEX with Full Text; Academic Search Premier; ERIC; PsycArticles; Social Work Online; and JSTOR. The database search was completed between October 24, 2023 and November 6, 2023. The keywords used in the search were generated from a review of the literature to identify terms commonly used for SEFC (e.g., “foster youth,” “foster care alumni,” “youth with foster care backgrounds”) and educational outcomes. The initial terms were vetted and refined by the research team and tested on several databases. See the Appendix for a list of the keywords.
The database search resulted in 3,527 publications. We augmented the database search with backward and forward-reference chaining and the use of commercial search engines (Google and Google Scholar) to identify publications that may have been missed by the database search (e.g., white paper reports). We also searched repositories known to have publications on transition-age youth in foster care, including the National Youth in Transition Database library and the Office of Children and Families, Office of Planning, Research and Evaluation. Members of the research team identified additional known sources. A total of 99 publications were identified through the augmented search procedures. Bibliographic information for each publication was imported to the reference manager software program Zotero. Duplicate records were identified and removed.
Data Extraction and Final Inclusion Process
After removing duplicate records, 2,802 unique publications were identified through the various search procedures (see Figure 1). We then transferred the publications to Rayyan, a software program designed for conducting systematic reviews. Two rounds of blind review were conducted to screen out studies that failed to meet all six inclusion criteria. The first round of review included two members of the research team who independently assessed each publication’s title, abstract, and keywords for relevance. There was greater than 98% agreement on exclusion and inclusion decisions. For publications where there was a conflict or uncertainty around inclusion decisions, the researchers met to review the publications until a consensus was reached.

PRISMA Flow Chart
A total of 74 publications were included in the second round of review. The second round was conducted by four members of the research team and involved careful inspection of the entire manuscript to assess whether all six inclusion criteria were met. A training session was conducted before the independent review phase to ensure consistency and calibration among the four team members. The 74 publications were divided into three batches, and the reviewers met after each batch to compare ratings. There were 16 publications in which there was at least one conflicting rating among members of the research team. Conflicting assessments were resolved during research meetings when each publication was carefully reinspected, evidence supporting an inclusion/exclusion decision was documented, and consensus was reached. Some publications had multiple reasons for exclusion. In those instances, the first identified reason that reached consensus was documented as the exclusion reason. The second round of review yielded 17 publications that were included in the systematic review.
The 17 studies each reported rates for one or more of the outcomes investigated in this review. In this manuscript, we report the estimates from each study in a summary table. A range of rates is provided for each of the three outcomes: high school/GED completion, college enrollment, and college degree completion.
Results
Description of Five Source Studies
Before turning to the findings, we briefly summarize the source studies that were the bases of the 17 publications included in this review. We provide references to the source studies with more information about the methodology. Five publications analyzed data from the Midwest Evaluation of the Adult Functioning of Former Foster Youth (Midwest Study; Courtney et al., 2004). The Midwest Study included a representative sample of youth who had been in foster care for at least 1 year in Illinois, Iowa, or Wisconsin and were 17–17½ years old when the sample was drawn in 2002. This was one of the first major longitudinal studies of transition-age foster youth after the landmark FCIA law had been enacted in 1999. 2 Baseline interviews were completed in 2002 with 732 participants (response rate [RR] = 95% of eligible youth), and subsequent interviews were conducted 2 years apart when participants were 19, 21, 23, and 25. The response rates for each follow-up interview exceeded 80%. The Midwest Study survey instrument gathered information in a wide range of domains, including youths’ educational status and attainment. One publication (Okpych, 2021) created PSE enrollment and completion measures from both survey data (up to age 25) and information from the National Student Clearinghouse (NSC; up to age 29/30). Combining NSC data with survey data had two advantages: the NSC data captured information from the Midwest Study sample who did not participate in the final interviews, and it allowed PSE outcomes to be measured up to age 29/30 rather than just 25. See Courtney et al. (2011) for more information about the Midwest Study.
The second source study is NYTD, which was used by two publications in our systematic review. In addition to funding the independent living services program, the 1999 FCIA mandated the creation of a nationwide data collection system to understand the transition to adulthood for older adolescents in foster care. NYTD was the fulfillment of that requirement. NYTD requires that every 3 years states survey all young people who are in foster care on their 17th birthday, and follow-up surveys are conducted at ages 19 and 21. The first NYTD cohort included youth in care who were 17 years old in 2011. The NYTD survey is relatively brief (28 questions total) and contains only two questions about education. Unfortunately, due to question wording (i.e., NYTD only asks about current enrollment), it is not possible to estimate the percentage of SEFC who had ever enrolled in PSE (see Okpych, 2023 for more information). However, NYTD can estimate the percentage of SEFC who completed a high school diploma or GED. Currently, NYTD is the only study that provides national estimates of education outcomes for SEFC. 3 For more information about NYTD, see the National Data Archive on Child Abuse and Neglect (2024).
The third source study is the California Youth Transitions to Adulthood Study (CalYOUTH; Courtney et al., 2011). Six publications analyzed CalYOUTH data. Note that one additional publication analyzed data from both the Midwest Study and CalYOUTH Study (Okpych & Courtney, 2019). CalYOUTH was designed to evaluate the impact of a California state law that extended the foster care age limit from 18 to 21 beginning in 2010. CalYOUTH had two main sources of data that captured information on youths’ educational attainment. The first was a longitudinal study of a representative sample of young people who had been in California foster care for at least 6 months and who were between the ages of 16.75 and 17.75 in late 2012 when the sample was drawn (n = 727). Baseline interviews were conducted in 2013 when participants were age 17, and three follow-up interviews were conducted when participants were ages 19, 21, and 23. CalYOUTH’s second data source was state child welfare records of the population of young people who had been in foster care on or after their 16th birthday from 2006 onward. CalYOUTH obtained NSC data for a sample of the population at multiple time points to estimate PSE enrollment and completion rates. See Courtney et al. (2020) for more information about CalYOUTH’s methodology.
The fourth source study was conducted by the Urban Institute to understand participation in the ETV program. Two publications analyzed data from the Urban Institute study. The study obtained child welfare administrative data, National Student Clearinghouse Data, and ETV data for 10 states. The study included young people who had been in foster care at age 16 or older. The years child welfare data were available varied by state but spanned from 2001 to 2016. For example, Tennessee provided data for youth in care over the course of 16 years (2001 to 2016), while Pennsylvania provided data that spanned 9 years (2007 to 2014). NSC data were used to calculate rates of PSE enrollment up to age 21. The total sample size for the Urban Institute study was over 130,000 SEFC. Refer to Hanson et al. (2022) for more information about the study’s methodology.
Finally, the fifth source study was conducted in Illinois by researchers at Chapin Hall and the University of Illinois-Urbana Champagne to understand college-going rates and experiences of SEFC who attended 2-year colleges (Havlicek et al., 2021). One publication analyzed data from the Chapin Hall study. Child welfare administrative data were used to identify the population of young people in Illinois foster care on or after their 17th birthday between 2012–2018 (n = 5462). NSC data were obtained in 2020 to estimate rates of PSE enrollment in both 2-year and 4-year colleges. Because some of the sample included youth who had not yet reached the age of 21 by the time NSC data were obtained, the authors of the report provided PSE enrollment estimates for just the cohorts of participants who turned 21 before the NSC data were accessed. This includes 3,239 SEFC whose 17th birthdays fell in the years 2012 to 2015.
Rates of Secondary Completion and PSE Enrollment and Completion
Table 1 provides key information on the 17 publications that were included in the systematic review. This includes the name of the study, region the study was conducted, the eligibility criteria of the study, the source(s) of data for the educational outcomes, the response rate (if applicable), and the sample size. The publications are ordered by study and then by the date of the publication. A few general observations can be made about the publications. First, several publications analyze data from the same source study but with different samples and different ages at which the outcomes were measured. Second, most of the studies are regional, including SEFC in one or more multiple states. The one exception is the NYTD. Third, the studies varied in the age up to which outcomes were measured, ranging from 21 up to 29/30.
Descriptions of Included Studies

Note. 1The sample excluded youth who were in the military or incarcerated at the time of the Wave 5 Midwest Study interview, reducing the sample size from 596 to 564. 2The 10 states include California, Colorado, Florida, Illinois, Missouri, New Jersey, Ohio, Oregon, Pennsylvania, and Tennessee. The years that were included varied for each state. The state with the largest time frame was TN, which included youth in care between 2001 and 2016. The state with the smallest time frame was Pennsylvania, which included youth in care between 2007 and 2014. See Table 3 or Hanson et al. (2022) for information on each state.
Table 2 presents rates of high school/General Education Development completion (“HS/GED completion” in the table), postsecondary education enrollment (“PSE enrollment”), and postsecondary education completion (“PSE completion”) from the 17 publications included in the systematic review. For secondary completion (based on eight publications), high school diploma/GED completion rates ranged from 69% to 85%. The rate from national data collected by NYTD was around 70%. The rates from different samples of the Midwest Study hovered around 82%, while rates from analyses of CalYOUTH data were slightly higher at 85%. NYTD estimates were measured when youth were 21 years old, while the Midwest Study and CalYOUTH estimates were measured when participants were a few years older (age 25/26 for Midwest Study participants and age 23/24 for CalYOUTH participants). However, it is unlikely the age differences between NYTD and the two other studies played a large role in the secondary completion rate differences. In Midwest Study reports (Courtney et al., 2004, 2005, 2007, 2011), the high school/GED completion rate climbed from age 17 (11.6%) to age 19 (63.0%) and to age 21 (77.0%), but after this the completion rate increased modestly to about 80%–82% by age 25/26. In CalYOUTH reports (Courtney et al., 2014, 2016, 2018, 2021), rates of high school/GED completion rose precipitously from age 17 (10.5%) to age 19 (70.7%) but then leveled off beginning at age 21 (84.3% at age 21 and 84.9% at age 23).
Summary of Secondary and Postsecondary Education Outcomes for Included Studies
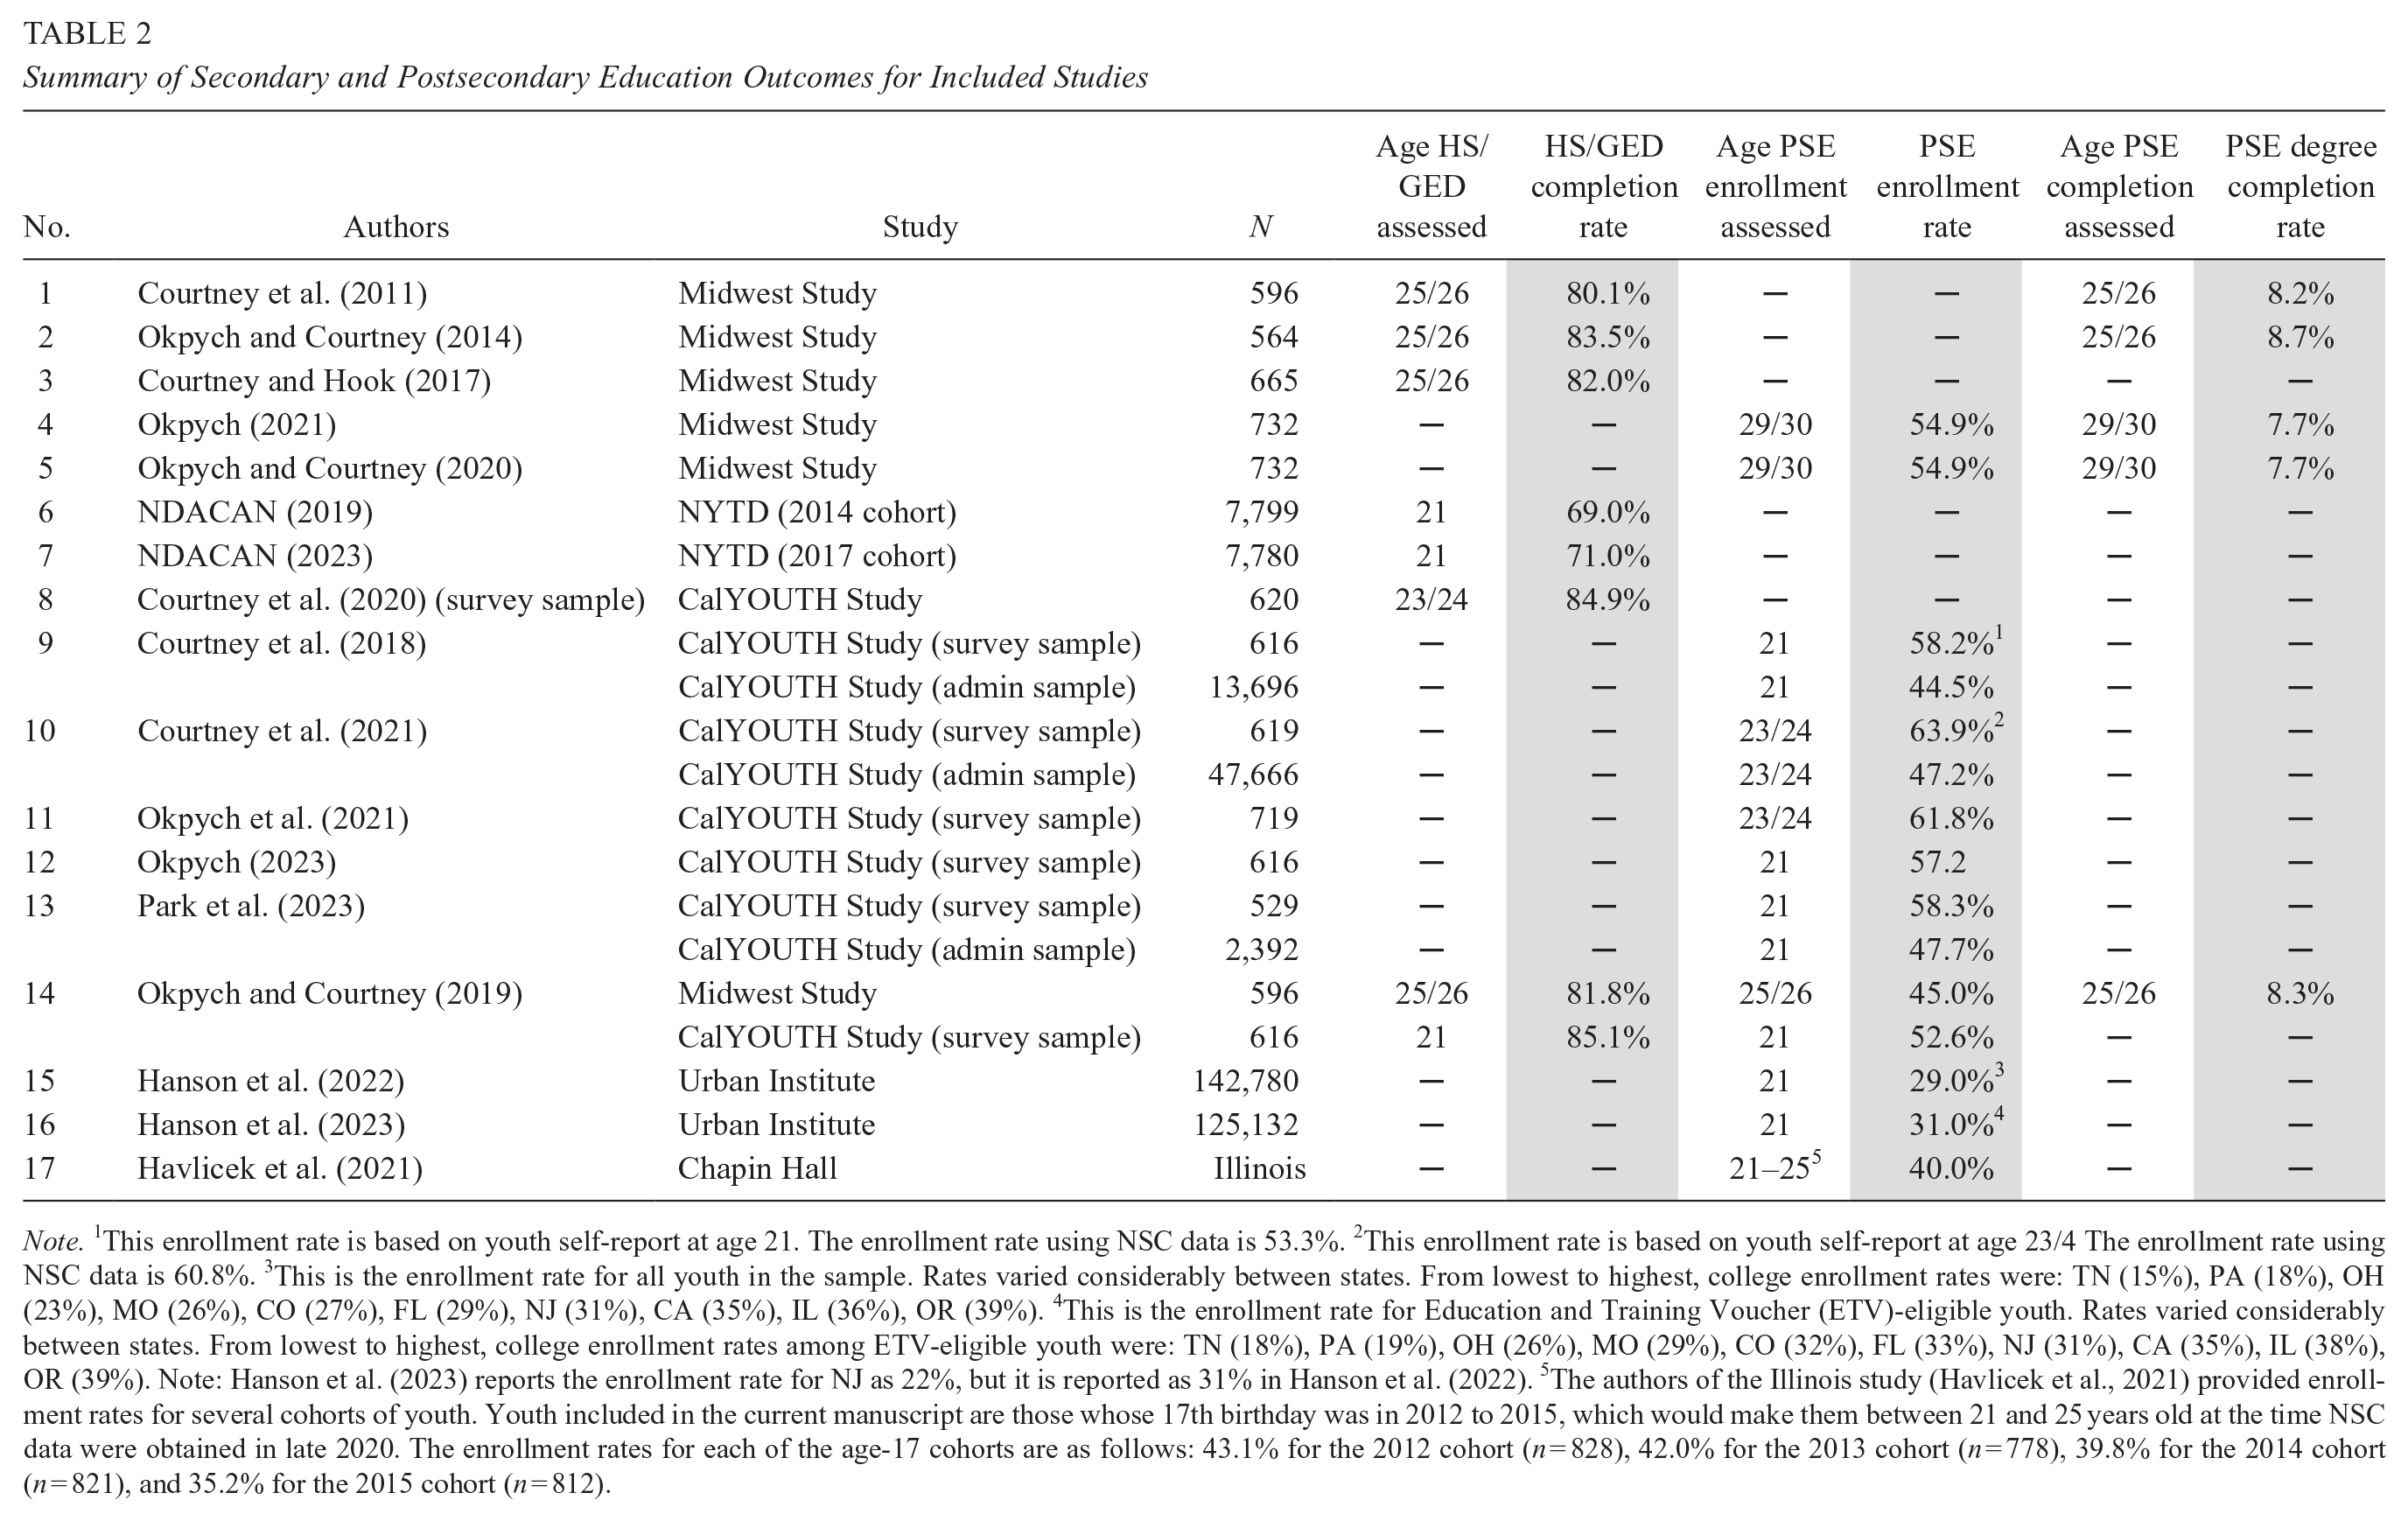

Note. 1This enrollment rate is based on youth self-report at age 21. The enrollment rate using NSC data is 53.3%. 2This enrollment rate is based on youth self-report at age 23/4 The enrollment rate using NSC data is 60.8%. 3This is the enrollment rate for all youth in the sample. Rates varied considerably between states. From lowest to highest, college enrollment rates were: TN (15%), PA (18%), OH (23%), MO (26%), CO (27%), FL (29%), NJ (31%), CA (35%), IL (36%), OR (39%). 4This is the enrollment rate for Education and Training Voucher (ETV)-eligible youth. Rates varied considerably between states. From lowest to highest, college enrollment rates among ETV-eligible youth were: TN (18%), PA (19%), OH (26%), MO (29%), CO (32%), FL (33%), NJ (31%), CA (35%), IL (38%), OR (39%). Note: Hanson et al. (2023) reports the enrollment rate for NJ as 22%, but it is reported as 31% in Hanson et al. (2022). 5The authors of the Illinois study (Havlicek et al., 2021) provided enrollment rates for several cohorts of youth. Youth included in the current manuscript are those whose 17th birthday was in 2012 to 2015, which would make them between 21 and 25 years old at the time NSC data were obtained in late 2020. The enrollment rates for each of the age-17 cohorts are as follows: 43.1% for the 2012 cohort (n = 828), 42.0% for the 2013 cohort (n = 778), 39.8% for the 2014 cohort (n = 821), and 35.2% for the 2015 cohort (n = 812).
Based on 13 publications, postsecondary enrollment rates ranged from a low of 29% to a high of 64%. The lowest rates came from the two publications from the Urban Institute study, which assessed PSE enrollment up to just age 21 using NSC data. The highest rates of enrollment were in the low 60%s and came from CalYOUTH survey data when participants were age 23/24. CalYOUTH estimates based on the large administrative sample and NSC data were lower by about 10 percentage points or more than the survey data estimates. In the middle were enrollment rates from the Midwest Study. Based on survey data collected from the 596 participants who completed the final survey at age 25/26, the PSE enrollment rate was estimated to be 45%. However, in the two manuscripts that included the full Midwest Study sample, drew on both survey data and NSC data, and examined enrollment up to age 29/30, the enrollment rate was about 55%. The enrollment rate from the Chapin Hall study, which included youth between the ages of 21–25 when NSC data were obtained, was 40%.
Finally, Table 2 shows that rates of postsecondary completion (based on five publications) came exclusively from the Midwest Study and hovered around 8% depending on the sample and data source. The degree completion rate was slightly above 8% in publications based on Midwest Study participants who completed the age 25/26 survey. Analyses of the full Midwest Study sample using both survey data and NSC data up to age 29/30 reported a completion rate that was slightly below 8%.
CalYOUTH is a second study that can provide an estimate of the PSE completion rate. CalYOUTH last interviewed participants at age 23/24, which is below this review’s inclusion criterion of age 25. However, CalYOUTH researchers provided the study authors with findings from a forthcoming publication that obtained NSC data when participants were age 27/28. Based on both NSC data and CalYOUTH survey data, 12% of CalYOUTH participants completed a 2-year or 4-year college degree (see Table 3). Thus, the SEFC college degree completion rate ranges from 8% – 12%.
Differences in Secondary and Postsecondary Education Outcomes by Race/Ethnicity. Statistically Significant Differences (p < .05) Are Boldfaced

Note. 1The results in the table were calculated by the authors who had access to the data for these studies. Of the original CalYOUTH Study sample (n = 727), 27 youths were not included in these analyses either because they did not consent to the study accessing administrative NSC data or because their records could not be matched to administrative data. 2Findings for the entire population of youth in the Urban Institute study were provided via personal communication by the study’s lead author (Hanson et al., 2022). 3In the CalYOUTH Study, Asian/Pacific Islander youth had a significantly higher degree completion rate than Black youth and multiracial youth. Hispanic youth had a significantly higher degree completion rate than multiracial youth. 4In the Urban Institute study, significant differences in PSE enrollment rates were found between all race/ethnicity groups. Readers should note that because of the large sample size, even small differences were statistically significant (p < .05).
In both the Midwest Study and CalYOUTH Study, more SEFC completed 2-year degrees than 4-year degrees. In the Midwest Study, 4.0% completed a 2-year degree and 3.7% completed a 4-year degree. In CalYOUTH, 5.4% completed a 2-year degree and 6.8% completed a 4-year degree.
Comparison of Educational Outcomes: SEFC Versus General Population
To put the high school diploma/GED and college degree completion rates of SEFC in context, we draw on data reported by the National Center for Education Statistics (NCES, 2023a, 2023b). Figure 2 displays completion rates for SEFC in green and the 2022 completion rates for U.S. young adults aged 25–29 in blue. It is estimated that between 69% and 85% of SEFC complete a high school credential by their mid-20s, which is lower than the national average of young adults with a high school credential (95%). On the right side of Figure 2, the rate of degree completion (associate’s or higher) for U.S. young adults aged 25–29 was 49% in 2022. This rate is about five times higher than the rate for SEFC, which is estimated to be between 8%–11%. 4

Comparison of Secondary and Postsecondary Degree Completion Rates: SEFC Versus National Averages
Differences in Education Outcomes by Race/Ethnicity
Table 3 presents differences in secondary and postsecondary outcomes for SEFC by race/ethnicity. An Urban Institute publication reported differences in college enrollment for a subsample of SEFC who received an ETV (Hanson et al., 2022), but the study authors provided statistics for the entire sample of SEFC in their study. Likewise, upon request, the authors of publications analyzing Midwest Study data (Okpych, 2021) and CalYOUTH Study data (Okpych et al., forthcoming) provided differences by race/ethnicity. Differences that are statistically significant (p < .05) appear in bold. In the Midwest Study, no statistically significant racial/ethnic differences were found in any of the three outcomes. In CalYOUTH, significant differences were not found in rates of secondary completion or PSE enrollment, but there were statistically significant differences in degree completion. Specifically, Asian/Pacific Islander SEFC and Hispanic SEFC were both significantly more likely than multiracial SEFC to earn a 2-year or 4-year college degree. Asian/Pacific Islander SEFC also had a significantly higher degree completion rate than Black SEFC. Finally, the Urban Institute study assessed PSE enrollment by age 21 across racial and ethnic groups. The study found rates to be highest among Asian/Pacific Islander SEFC (48%) followed by Native American/Alaskan Native (34%) SEFC, Black SEFC (33%), White SEFC (30%), and Hispanic SEFC (29%).
Limitations
This study uses best available evidence to estimate secondary and PSE outcomes of SEFC, but there are limitations of the data that warrant consideration. First, although NYTD provides national estimates of rates of secondary completion among SEFC, to date no national estimates exist for rates of PSE enrollment or completion. PSE rates are based on regional data originating from a single U.S. state or a group of states. Second, although we used a common set of inclusion criteria, individual studies differed in ways that may have impacted the outcome estimates. Possibly the most apparent factor was the age at which an outcome was measured. This is especially relevant to PSE enrollment and completion. For example, the lowest rate of PSE enrollment (29%) was reported by the Urban Institute study (Hanson et al., 2022). This study tracked PSE enrollment up to age 21, which was younger than other studies in this review (e.g., CalYOUTH and Midwest Study). This is important because past research has found that SEFC often face educational delays and a nontrivial proportion enroll in PSE after age 21 (Okpych, 2021). This should be kept in mind when interpreting the lower range of PSE estimates.
Third, studies also differed in the data source(s) for the educational outcomes. Some studies relied on youth self-report, others on administrative records, and others used a combination of the two. Surveys may be subject to misremembering or misreporting of one’s educational attainment as well as nonresponse bias if the rate of attainment among completers differs from that among non-completers. For example, if SEFC who did not complete follow-up surveys had lower levels of educational attainment than follow-up completers, then rates based solely on completers may be overestimated. Conversely, studies that rely on NSC data alone can also underestimate PSE enrollment and completion rates due to blocked records (i.e., SEFC who enrolled in PSE but in NSC data are indistinguishable from SEFC who did not enroll). Depending on the percentage of blocked records, NSC data will undercount the enrollment rate. The percentage of students with blocked records varies by state. For example, in the Urban Institute study, which included 10 states, the rate of blocked records ranged from 1.3% in Oregon to 12.1% in California. (Hanson et al., 2022). Some studies (e.g., Okpych, 2021) sought to overcome limitations of self-reported data and NSC data by combining data sources. This approach likely gives a more accurate estimate of PSE outcomes than studies that rely on one data source.
With these points in mind, we can consider the strengths and limitations of the studies vis-a-vis their methodologies. A strength of NYTD is that it is national in scope and uses standardized questions to capture high school/GED completion, but a notable limitation is it has the lowest response rates of all studies. This makes it susceptible to nonresponse bias. The Midwest Study and CalYOUTH Study both had high response rates (over 80% at all survey waves), so there may be less concern about nonresponse bias. Another strength of these studies is that, in some publications, survey data have been combined with administrative data from the NSC. Combining data sources mitigates the issue of missing data; NSC data can fill in missing data from survey nonrespondents, and survey data can fill in missing data from blocked NSC records (which was particularly high in CalYOUTH). One limitation of the Midwest Study is that it is the most dated study of those reviewed, and a limitation of both the Midwest and CalYOUTH studies are that they are regional in scope. The Illinois study is also regional, only draws on NSC data, and only investigated college enrollment up to age 21 for part of the sample. Likewise, the Urban Institute study assessed college enrollment with NSC data only up to age 21. Previous research suggests that some SEFC begin higher education later in life (e.g., Okpych, 2021), so the Urban Study likely presents a low-end estimate of the college enrollment rate. A strength of the Urban Institute study is that it includes 10 U.S. states, and so is the most geographically representative study after NYTD.
Discussion and Implications
The purpose of this systematic review was to provide current estimates of secondary and postsecondary education outcomes for SEFC based on best available evidence. In terms of our first research question, we found that secondary and PSE completion rates are higher than rates that are commonly reported in the public discourse. Many agency websites and even government offices report that about half of SEFC finish high school, 20% enroll in college, and 3% earn a college degree. However, our review finds the high school/GED completion rate to range from 69% to 85%, the postsecondary enrollment rate to range from 29% to 64%, and the degree completion rate to range from 8% to 11%.
Regarding our second research question, we found that rates of educational attainment are lower for SEFC than their peers in the general population. Our findings suggest a 10-percentage-point difference or more between SEFC and their peers in high school/GED completion rates. Disparities in college degree completion are even more stark. Young adults in the general U.S. population complete a 2-year or 4-year degree at a rate that is about five times higher than the rate for SEFC. The PSE completion gap for SEFC is still problematic and equity-minded policy and practice warrants its attention.
Our third research question about racial differences had the fewest number of publications to draw from, and in a few cases, estimates were provided from follow-up contact with study authors. Here we did not find evidence of racial/ethnic differences in secondary school completion rates among SEFC, but some differences were found in PSE outcomes. The Urban Institute study found that Asian/Pacific Islander youth (48%) were the most likely to enroll in PSE by age 21, followed by Native American/Alaskan Native youth (34%), Black youth (33%), White youth (30%), and Hispanic youth (29%; Hanson et al., 2022). Analyses of CalYOUTH and NSC data found that Asian/Pacific Islander youth and Hispanic youth were both significantly more likely than multiracial youth to earn a college degree by age 27/28 (Asian/Pacific Islander youth also had higher rates than Black youth).
Policy Implications
Our findings reveal that the educational outcomes of SEFC are below national averages. This calls for redoubled efforts to close these gaps. For example, one promising intervention is campus support programs tailored to meet the unique needs of SEFC. Currently, hundreds of campuses house these types of programs (Fostering Academic Achievement Nationwide Network, 2024; Okpych et al., 2020), but they are often plagued by unstable funding and limited staffing (Geiger et al., 2018). One recommendation is for the federal government to set aside funding for campus support programs for SEFC, similar to funding carved out for independent living services through the 1999 FCIA law. Creating a stable funding source will aid in the development and sustainability of these programs. Similar to FCIA, a small percentage of the funding should be set aside for evaluation in order to identify core elements and best practices for campus support programs.
A second policy recommendation pertains to meeting the basic needs and living expenses of SEFC. Although the evidence base is developing, studies have found that providing material assistance to SEFC through extended foster care (Courtney & Hook, 2017; Courtney et al., 2021; Okpych & Courtney, 2020), ETVs (Hanson et al., 2022; Okpych et al., 2020), and state tuition waivers (Geiger & Okpych, 2022) is associated with increased access to PSE. For example, in Texas, SEFC who utilized the tuition waiver program were 3.5 times more likely than their peers to graduate with a postsecondary degree (Watt & Faulkner, 2020). One issue is that this funding is difficult to obtain in some states (John Burton Advocates for Youth, 2022b) and may not meet financial needs. For example, the maximum annual ETV amount today is $5,000, the same as it was 20 years ago when the ETV program was first instituted (Okpych et al., 2020). However, the cost of college has ballooned since that time. For example, the average cost of tuition and fees at 4-year institutions was $7,040 in 1999 but has more than doubled over the past 2 decades ($16,646 in 2019; Hanson, 2024). Changes to federal and state policy can help ensure that ETVs maintain their buying power and can remove barriers to funding that SEFC should be able to access. California in particular has been leading the charge for implementing policy interventions toward enhancing educational opportunities for SEFC (Espino et al., 2024).
We also recommend that state and federal policymakers do an audit of higher education policies that might disadvantage SEFC. For example, emerging research shows that Satisfactory Academic Progress (SAP) policies are not equity-minded and create challenges for SEFC as they pursue their college degree (National Association of Student Personnel Administrators, 2021). SAP and other policies should be addressed to ensure that students have access to financial resources while they find their footing and navigate their early semesters of postsecondary education.
As a final policy recommendation, public and philanthropic institutions should require research projects on SEFC to report outcomes that are disaggregated by race and ethnicity. The country’s history of racist laws and policies contribute to the overrepresentation of Black and Native American families in foster care (Dettlaff & Boyd, 2020) and to inequities in educational attainment and generational wealth (Story & Reed, 2024; Valencia, 2015). Given their influence in society, public and philanthropic institutions should make it standard practice to monitor, locate, and redress racial disparities.
Practice Implications
Our first set of practice implications involves supporting SEFC to complete secondary education. Pre-college readiness programs like GEAR Up and Upward Bound have the ability to engage students in foster care; however, they are often limited by funding and resources to include SEFC at scale. Secondary education could look to successful components of support programs housed on college campuses when designing programs that address the unique needs of SEFC in high school. Promising programs exist, such as the First Star program that operates in schools in over a dozen states (First Star, 2024). The Fostering Higher Education model is another example of a program that shows promising findings around supporting high school completion and college access for SEFC (Salazar et al., 2023). Additional professional development is needed for high school teachers, counselors, and administrators to equip them to address the unique challenges faced by SEFC. For instance, SEFC often have gaps in learning due to multiple school changes and inconsistent access to educational resources. Without being meaningfully connected to teachers or support staff in the school who understand the dynamics of experiencing foster care, SECF may be reluctant to disclose challenges they are having and fall further behind their peers.
In terms of postsecondary education, colleges need to take steps to identify SEFC on their campus and provide professional development training to staff who are charged to work with SEFC. Public and private funding that provides support to SEFC should consider that SEFC may be enrolled in postsecondary education longer than students who did not experience foster care. The proliferation of “graduate in four” initiatives across U.S. colleges and universities is not inclusive. Simply put, 4-year institutions need to consider that SEFC might need longer than 4 years to graduate with a bachelor’s degree and thus provide necessary support services to their SEFC population. As noted above, campus-based support programs have shown promising findings on improving short-term PSE outcomes for SEFC (Okpych et al., 2020). For example students who participated in the Guardian Scholars Program at San Francisco State University had a higher 6-year graduation rate than the general campus population (73% vs. 46%; Lenz-Rashid, 2018). However, the evidence base is limited and there is a need for rigorous evaluation studies of campus support programs to estimate their impacts, including their impacts on long-term outcomes such as degree completion.
Programming and support services in PSE should be available to students beyond what may be considered traditional ages to support all SEFC. This includes the age restrictions to financial resources like ETVs, state tuition waivers, and institutional scholarships for SEFC.
Future Research and Funding Recommendations
There are several approaches to achieving accurate estimates of educational outcomes for SEFC. To understand education outcomes at scale, federal and state funding will be required to invest in data sharing agreements and data infrastructure needed to support the research. The creation of NYTD was a watershed moment that provides a national snapshot of SEFC up to age 21. The study questions capture secondary education completion but fall short with tracking PSE. One recommendation is to fix the existing NYTD questions so that the survey captures not just youth who were currently enrolled in PSE at the time of the survey, but also youth who had ever enrolled in PSE (Okpych, 2023). Another recommendation is for researchers to partner with state child welfare agencies to extend NYTD beyond age 21. Millions of dollars are spent each year by federal and state governments to collect NYTD data, but age 21 is just too early to meaningfully track PSE enrollment (some SEFC do not enroll until their early 20s) and PSE degree completion. Researchers can leverage the considerable resources already spent to survey SEFC up to age 21 and continue to track them up to a later age. If it was cost-prohibitive to conduct interviews, researchers could obtain permission from child welfare agencies and the youth to obtain NSC data. This would be a practical and affordable strategy to track long-term PSE outcomes for youth in their state.
A second recommendation is for states to combine administrative data systems to track SEFC’s educational outcomes. For example, California’s Cradle-to-Career data system will provide public-facing dashboards that allow users to create tables displaying outcomes for primary, secondary, and postsecondary education using administrative data aggregated across government departments (California Cradle-to-Career Data System, 2024). Also in California is the Transition-Age Youth Research and Evaluation Hub (TAY-Hub), which is housed within the California Child Welfare Indicators Project at UC-Berkeley. The TAY-Hub operates a data dashboard available to the public to track a range of employment and educational outcomes for SEFC in California. Importantly, the dashboard has the functionality to drill down in the data to examine outcome disparities by race, ethnicity, and other youth characteristics. Allowing users to analyze across regions, the tool is useful to see differences in disparities across space and over time. This functionality is useful to monitor changes, particularly when following a change in policy or practice. It is recommended that other data systems incorporate drill down features that allow users to assess racial disparities across regions and over time.
As another example, in Washington State, SB 6274 establishes a data sharing agreement between the state education department and the child welfare department to identify SEFC in high school. This legislation, which created the Passport to Careers program, allows the state to provide college access resources to SEFC and verify their foster care status when they apply for an ETV (Washington Student Achievement Council, 2024). These are examples of ways that states can leverage existing administrative data to understand the educational outcomes for SEFC.
Third, to ensure a more thorough understanding of education outcomes for all SEFC, institutions of higher education and state departments of education need to work with institutional research departments to better track outcomes of SEFC. For example, many colleges and universities are geared toward serving “traditional” students who enroll immediately after high school and are expected to graduate in 4 years. More attention is needed to understand the constraints and timeline of nontraditional SEFC.
The findings charge researchers to make it common practice to report outcomes differences by race for SEFC to increase the fields’ knowledge base, and to delve deeper into how race and racism play out in the educational outcomes of SEFC. Disaggregating educational outcomes for SEFC is important as it helps locate who is struggling along the educational pipeline, and guides qualitative research to investigate how and why these educational challenges persist across varying racial groups.
Conclusion
SEFC are a student group that warrants more attention by secondary and postsecondary education scholars and professionals. A first step in developing effective policies and practices is having an accurate understanding of their educational outcomes. These estimates will ensure that interventions are directed at key education milestones and can be used to monitor progress on closing attainment gaps.
Footnotes
Appendix
Acknowledgements
This project was undertaken by a research team formed within the National Conference for Hidden Student Populations (NCHP). The NCHP creates spaces for researchers and practitioners to collaboratively work on research projects related to the higher education system and hidden college student populations.
Funding
The author(s) received no financial support for the research, authorship, and/or publication of this article: No finanical support was received from NCHP for this project.
Notes
Authors
NATHANAEL J. OKPYCH is an associate professor in the School of Social Work at the University of Connecticut, 38 Prospect St., Hartford, CT 07103 (email:
KENYON WHITMAN is an assistant professor in the Department of Educational Psychology, Leadership, and Higher Education at the University of Nevada, Las Vegas, 4505 S. Maryland Pkwy., Las Vegas, NV 89154 (email:
JANE LEE is a doctoral student in the School of Social Work at the University of Connecticut, 38 Prospect St., Hartford, CT 07103 (email:
LIZ NERIA-PIÑA is an Adjunct Professor of Higher Education and Student Affairs at the Oklahoma State University, Stillwater, 201 Whitehurst, Stillwater, OK 74078 (email:
LISA A. JACKSON is an assistant teaching professor and a doctoral candidate in the College of Social Work at Florida State University, 296 Champions Way, University Center, Building C, Suite 2500, Tallahassee, Florida 32306 (email:
MADDY DAY is the proprietor and senior consultant at Maddy Day LLC & Associates, Kalamazoo, Michigan (email: