
Abstract
Given the rapid adoption of machine learning methods by education researchers, and the growing acknowledgment of their inherent risks, there is an urgent need for tailored methodological guidance on how to improve and evaluate the validity of inferences drawn from these methods. Drawing on an integrative literature review and extending a well-known framework for theorizing validity in the social sciences, this article provides both an overview of threats to validity in supervised machine learning and plausible approaches for addressing such threats. It collates a list of current best practices, brings supervised learning challenges into a unified conceptual framework, and offers a straightforward reference guide on crucial validity considerations. Finally, it proposes a novel research protocol for researchers to use during project planning and for reviewers and scholars to use when evaluating the validity of supervised machine learning applications.
Keywords
Introduction
Education research is currently undergoing a transformation, with scholars taking advantage of powerful machine learning technologies to generate novel educational insights. Broadly speaking, these technologies involve the use of computers to identify patterns in data (Samuel, 1959). This includes both supervised learning, where the goal is to identify patterns in labeled data (e.g., graded essays) to predict the labels of new data (e.g., ungraded essays), and unsupervised learning, where the goal is to identify potentially unknown patterns in data without any preconceived labels (e.g., clustering essays based on their content). Both approaches offer opportunities for education researchers. Indeed, education literature featuring machine learning has increased exponentially in the past decade (Mcfarland et al., 2021), with themed special issues indicating enthusiasm among journal editors (Mcfarland et al., 2021; Reardon & Stuart, 2019) and major funding organizations, including the National Science Foundation and the Institute of Education Sciences, promoting this line of research via themed competitions (NCSER, 2021).
However, alongside the rush to explore machine learning’s potential research benefits, there is an urgent need to evaluate the validity of inferences drawn from machine learning methods. There is a growing acknowledgment, for example, that supervised learning models, like their human counterparts, risk identifying particular patterns that promote stereotyping and the unfair distribution of resources (Kordzadeh & Ghasemaghaei, 2022; Van Giffen et al., 2022). For example, many educational outcomes from standardized test scores to college enrollment not only result from a student’s motivation and intelligence but also from the quality of the educational opportunities provided to them—factors that are intricately related to race and socioeconomic status (Reardon, 2011). Thus, supervised models that are trained on real-world data reflecting these realities have the capacity to exacerbate existing biases (Suresh & Guttag, 2021). Further, algorithmic bias is not the only mechanism whereby machine learning applications might cause faulty inferences. There are myriad ways in which a researcher may err in drawing conclusions from these methods.
Yet, despite the rapid adoption of machine learning methods by education researchers and growing acknowledgment of the inherent risks of these methods, methodological guidance in the literature is limited. In part, this is perhaps because foundational papers in machine learning have been developed beyond the social sciences, rarely address education issues, and may not share education researchers’ validity concerns. Further, although extensive guidance is available for education researchers as they plan and judge the quality of randomized experiments and quasi-experiments—from sources such as the What Works Clearinghouse (2019)—there is no such centralized guidance for researchers’ use of machine learning.
Given these challenges, it makes sense to consider the standards by which our field ought to evaluate studies involving machine learning, studies that now cover topics across curriculum, pedagogy, and policy. A shared understanding of how to weigh these studies’ claims and evidence can aid our interpretation of their scholarly contribution and the value of their recommendations for educational practitioners. Furthermore, methodological guidance that is tailored to education researchers’ specific needs could improve the quality of machine learning-based studies in the first place.
This article offers a series of contributions toward these objectives, focusing specifically on supervised learning. The guiding framework underpinning this effort derives from the discussion by Shadish et al. (2002) of validity types and associated threats to validity. For decades, social scientists have relied on the validity-types framework to guide their thinking about valid impact estimates (Campbell & Stanley, 1963; Shadish et al., 2002). In this approach, researchers consider the validity of inferences in terms of (a) the constructs represented by variables (construct validity), (b) the strength of association between two variables (statistical validity), (c) the causal relationship of those variables (internal validity), and (d) the generalizability of that relationship (external validity).
This article builds on the validity-types framework by considering how these four types of inferences pertain to instances of supervised learning. For each type, we address the following questions:
Construct validity: To what extent does a model reflect the construct it aims to predict? (Has the outcome of interest been defined and labeled appropriately? Do the model predictions align with this definition?)
Statistical validity: What is a model’s estimated performance, sensitivity, and uncertainty? (Are the performance metrics unbiased? How large is the sample on which performance was measured?)
External validity: How generalizable is the model performance? (Can the model be applied in the necessary circumstances while retaining its predictive ability? Is the model’s predictive ability consistent across subgroups?)
Internal validity: To what extent are the discussed relationships between outcomes, predictors, and/or treatments causal? (Are there confounders of an observed correlation between the treatment and machine learning-based measures of the outcome? And, if interpreted as such, is the relationship between predictors and outcomes truly causal?)
Drawing on an integrative review of machine learning applications that have appeared in American Education Research Association (AERA) journals, this article discusses the implications of each validity type for supervised learning research—identifying important threats to validity and offering a list of approaches to protect against such threats. The article thus critically interprets emerging supervised learning challenges via a unified framework already familiar to education researchers. Finally, the article culminates in a research protocol that can be used by education researchers in the planning stages of a machine learning project as well as by reviewers and readers seeking to judge the validity of machine learning applications.
Theoretical Framework
Shadish et al. (2002, p. 34) defined validity as “the approximate truth of an inference.” A foundational proposition of this article, therefore, is that the application of machine learning in education results in inferences—inferences about education, about education research, and about how these might be improved. Consider automatic grading systems, a common educational application of supervised learning. To develop such a system, researchers commonly ask human graders to rate a series of student essays according to their quality. These graded essays constitute the gold-standard labeled data, which the researchers anticipate their algorithm will learn to predict. The gold-standard data are randomly split into a training set and a testing set. Using the training data, the model learns a relationship between predictors (in this case, certain features of the written essays) and ratings. The correspondence between human and machine ratings is then assessed via the testing data, with researchers reporting the model’s performance metrics (see, e.g., Valenti et al., 2003). Using such performance metrics, authors and readers then draw inferences about whether the algorithm can or should be used in educational practice.
Thus, using the validity-types framework, the validity of such an inference relies on construct validity (e.g., has “writing quality” been appropriately defined and labeled? To what extent do the automatic grader’s predictions reflect the construct of “writing quality”?), external validity (e.g., in which populations and settings will the model’s predictions be faulty?), and statistical validity (e.g., is the presented performance metric an unbiased estimate of model error? How much uncertainty surrounds that estimate?). If the automatic grader is later used to measure the impact of an intervention, internal validity is also required (e.g., does the correlation reflect a causal relationship?). In using the validity-types framework, a researcher considers each of these validity types in turn, probing and adjusting for corresponding threats.
Of course, the understanding of validity by Shadish et al. (2002) is one formulation among many and may not even be the most common conceptualization in education research. The Standards for Educational and Psychological Testing (Phelps, 2011), for example, draw from a conceptualization of validity that is closer to the scholarship of Kane (1992) and Messick (1989) and posit that validation is best understood “as a process of constructing and evaluating arguments for and against the intended interpretation of test scores and their relevance to the proposed use” (Phelps, 2011, p. 11). In this line of thinking, researchers should (a) explicitly state the proposed interpretation of test scores, (b) identify the inferences and assumptions required to make a leap from the scores to the interpretation, (c) assemble all available evidence relevant to the inferences and assumptions, (d) evaluate the most problematic assumptions in the argument, and (e) continue to adjust the argument or interpretation as necessary (Kane, 2001).
When fully implemented in measurement scenarios, this alternative approach to construct validity is more comprehensive than the validity-types framework. Although researchers using the validity-types framework would only consider the listed threats of Shadish et al. (2002), a researcher successfully implementing an argument-based validation approach would consider all necessary assumptions, focusing on the most relevant ones to the test’s proposed use. However, Kane and Mesick’s conceptualization of validity speaks less to inferences other than those drawn from scores on tests (e.g., omitting inferences about causality). Further, creating a comprehensive validity argument is not straightforward (Kane, 1992, 2001). Thus, although an argument-based approach to validation may be more comprehensive and theoretically ideal in some scenarios, the checklist-like approach to validation by Shadish et al. (2002)—where researchers consider each threat in turn, checking off those that they have ruled out—is a more practical heuristic for our purposes. Thus, the protocol presented in the final section of this article provides such a checklist with specific questions to consider related to each validity type when planning and evaluating a study using supervised learning.
Approach and Organization
In this article, the validity-types framework is used to organize and contextualize threats to validity in educational applications of supervised learning. The threats-to-validity discussion draws on the framework and an integrative, restricted review of supervised learning applications of Shadish et al. (2002) in academic journals published by AERA—the largest American professional society focused on education research (AERA, 2024). The review includes studies published in the American Educational Research Journal, Educational Researcher, Educational Evaluation and Policy Analysis, Journal of Educational Behavior and Statistics, and AERA Open. Figure 1 provides an overview of the search and exclusion parameters. The final set of studies is limited to 27 articles, which either trained or used a supervised learning model to answer an education research question via the analysis of nonsimulated educational data. An additional 11 methodological and/or conceptual articles were consulted and cited where relevant. A full list of reviewed articles can be found in Tables 1 and 2. It is important to note that the review is not intended as a meta-analysis, nor is it meant to test a theory or formally summarize the state of the literature. Instead, the studies are used to illustrate threats to validity and current best practices for addressing those threats.

Search Protocol and Inclusion Criteria for Integrative Review.
Applied Articles Reviewed
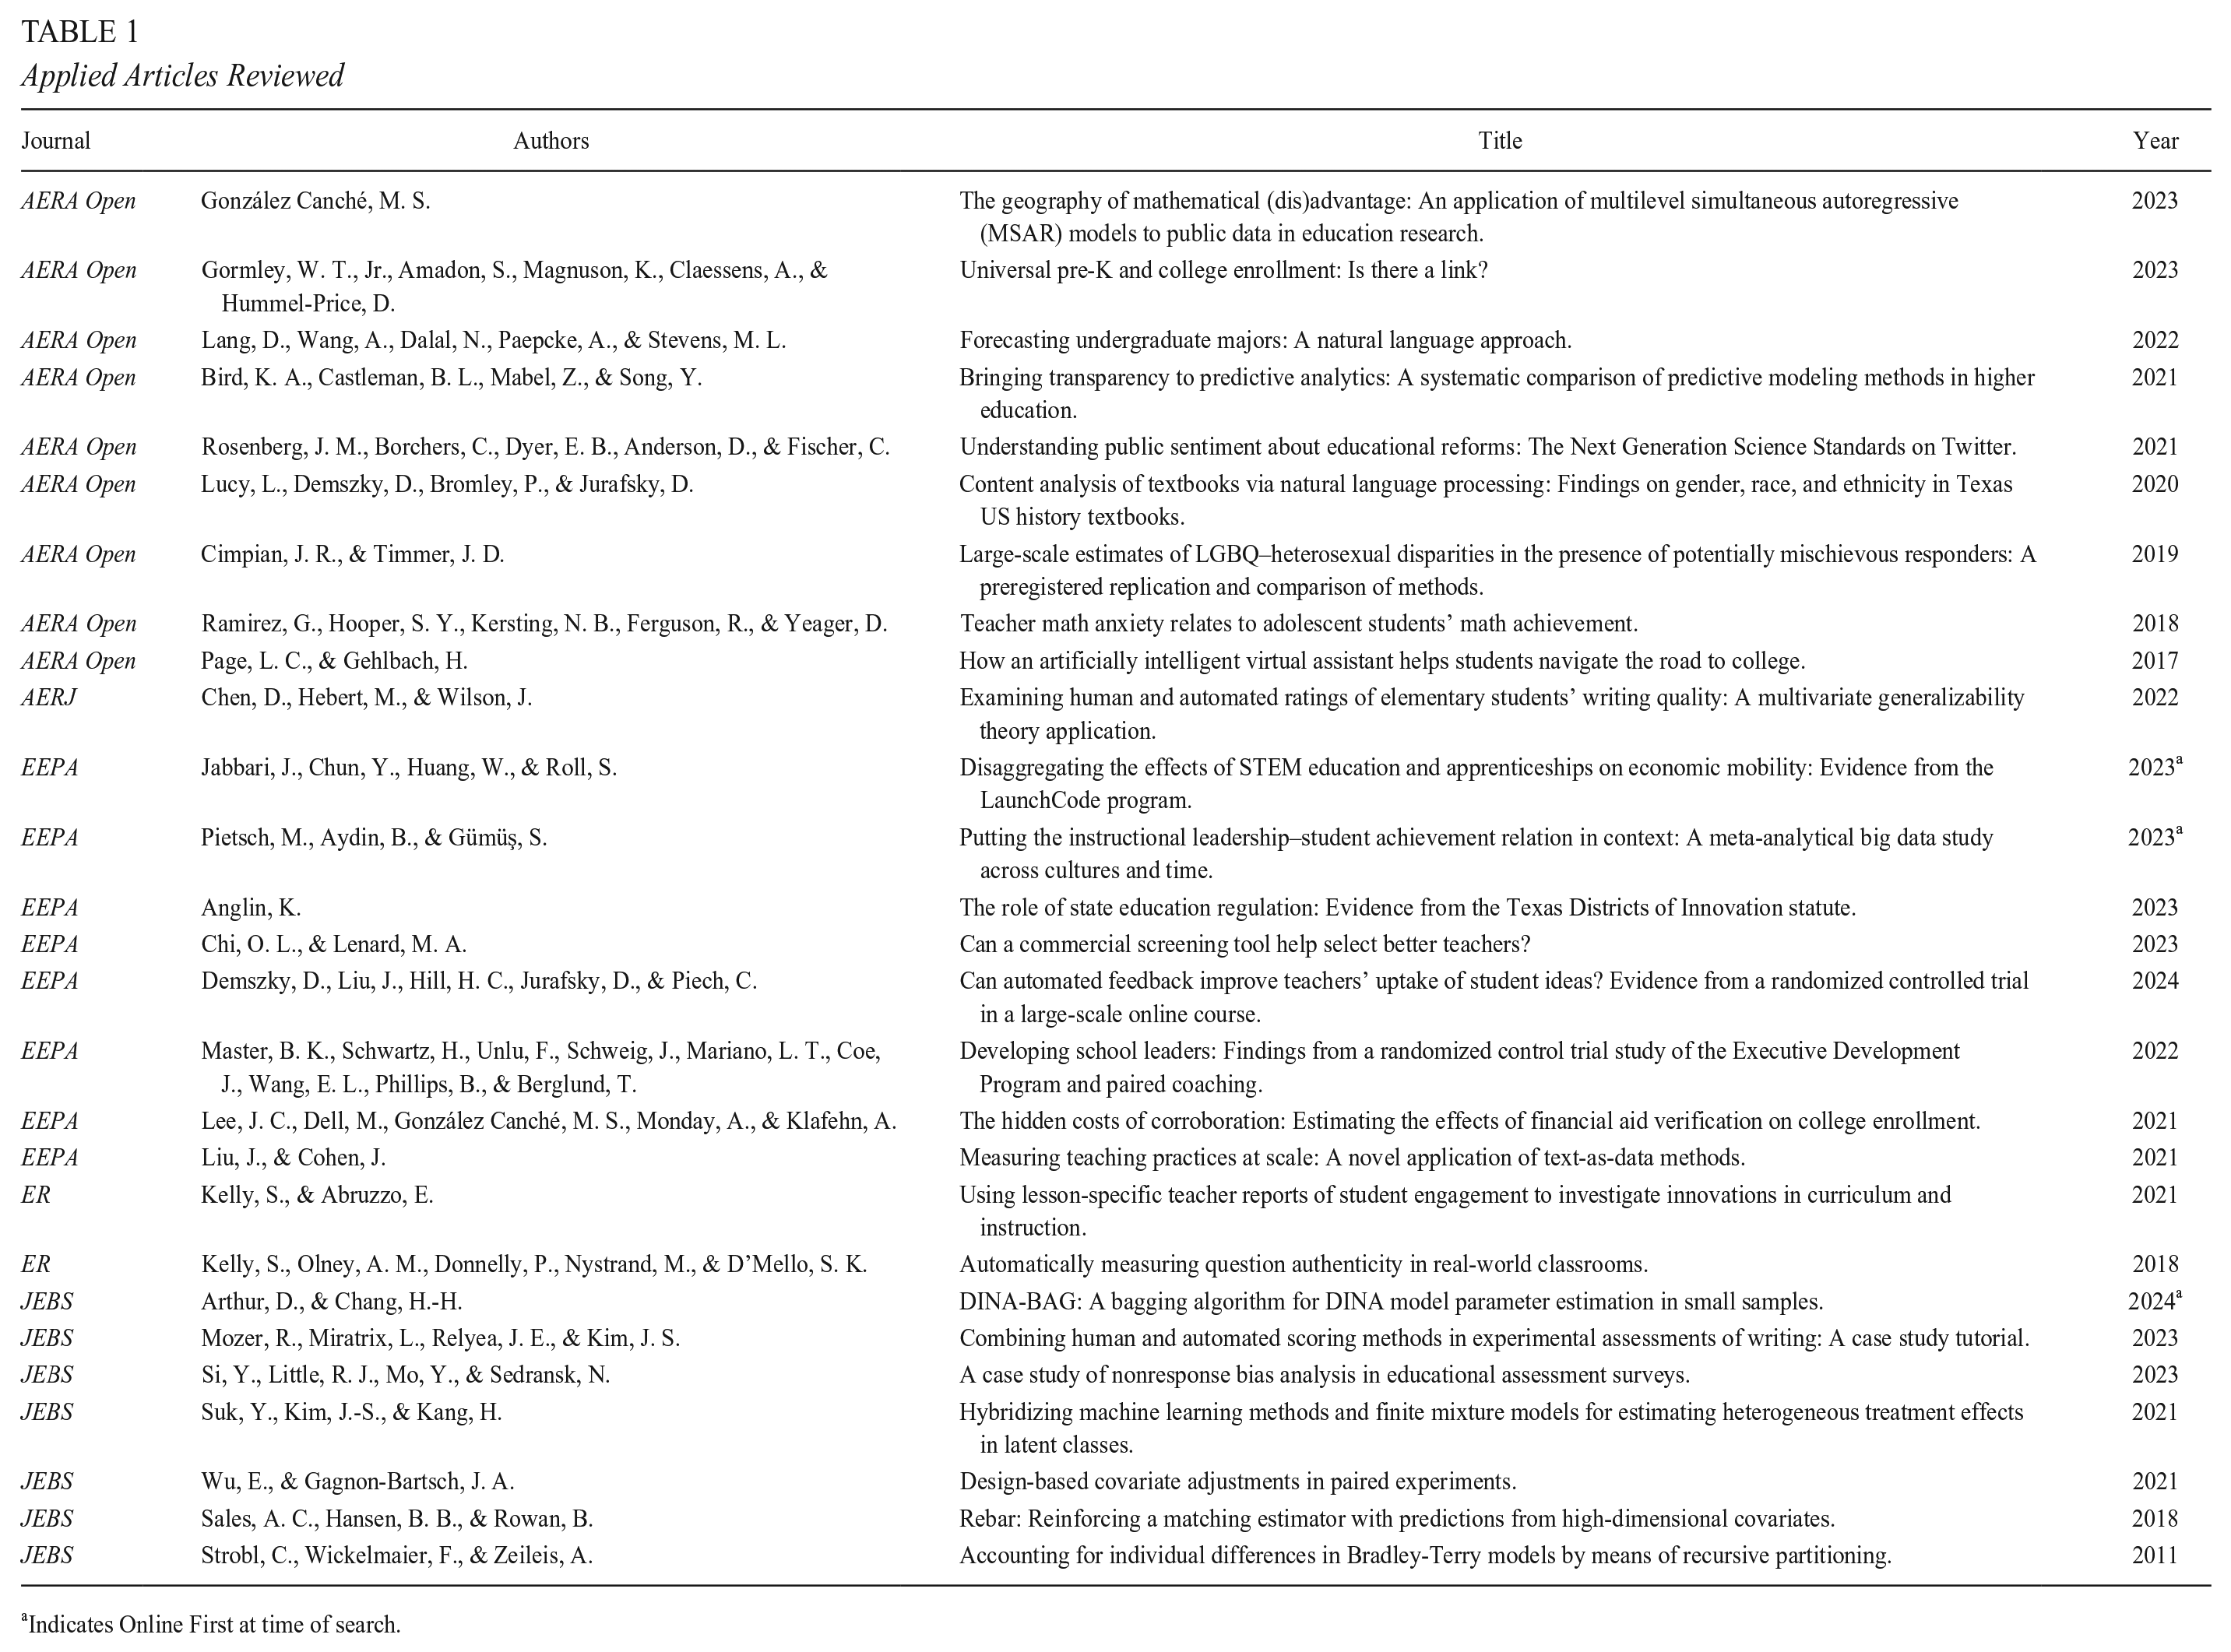
Indicates Online First at time of search.
Conceptual/Methodological Articles Reviewed
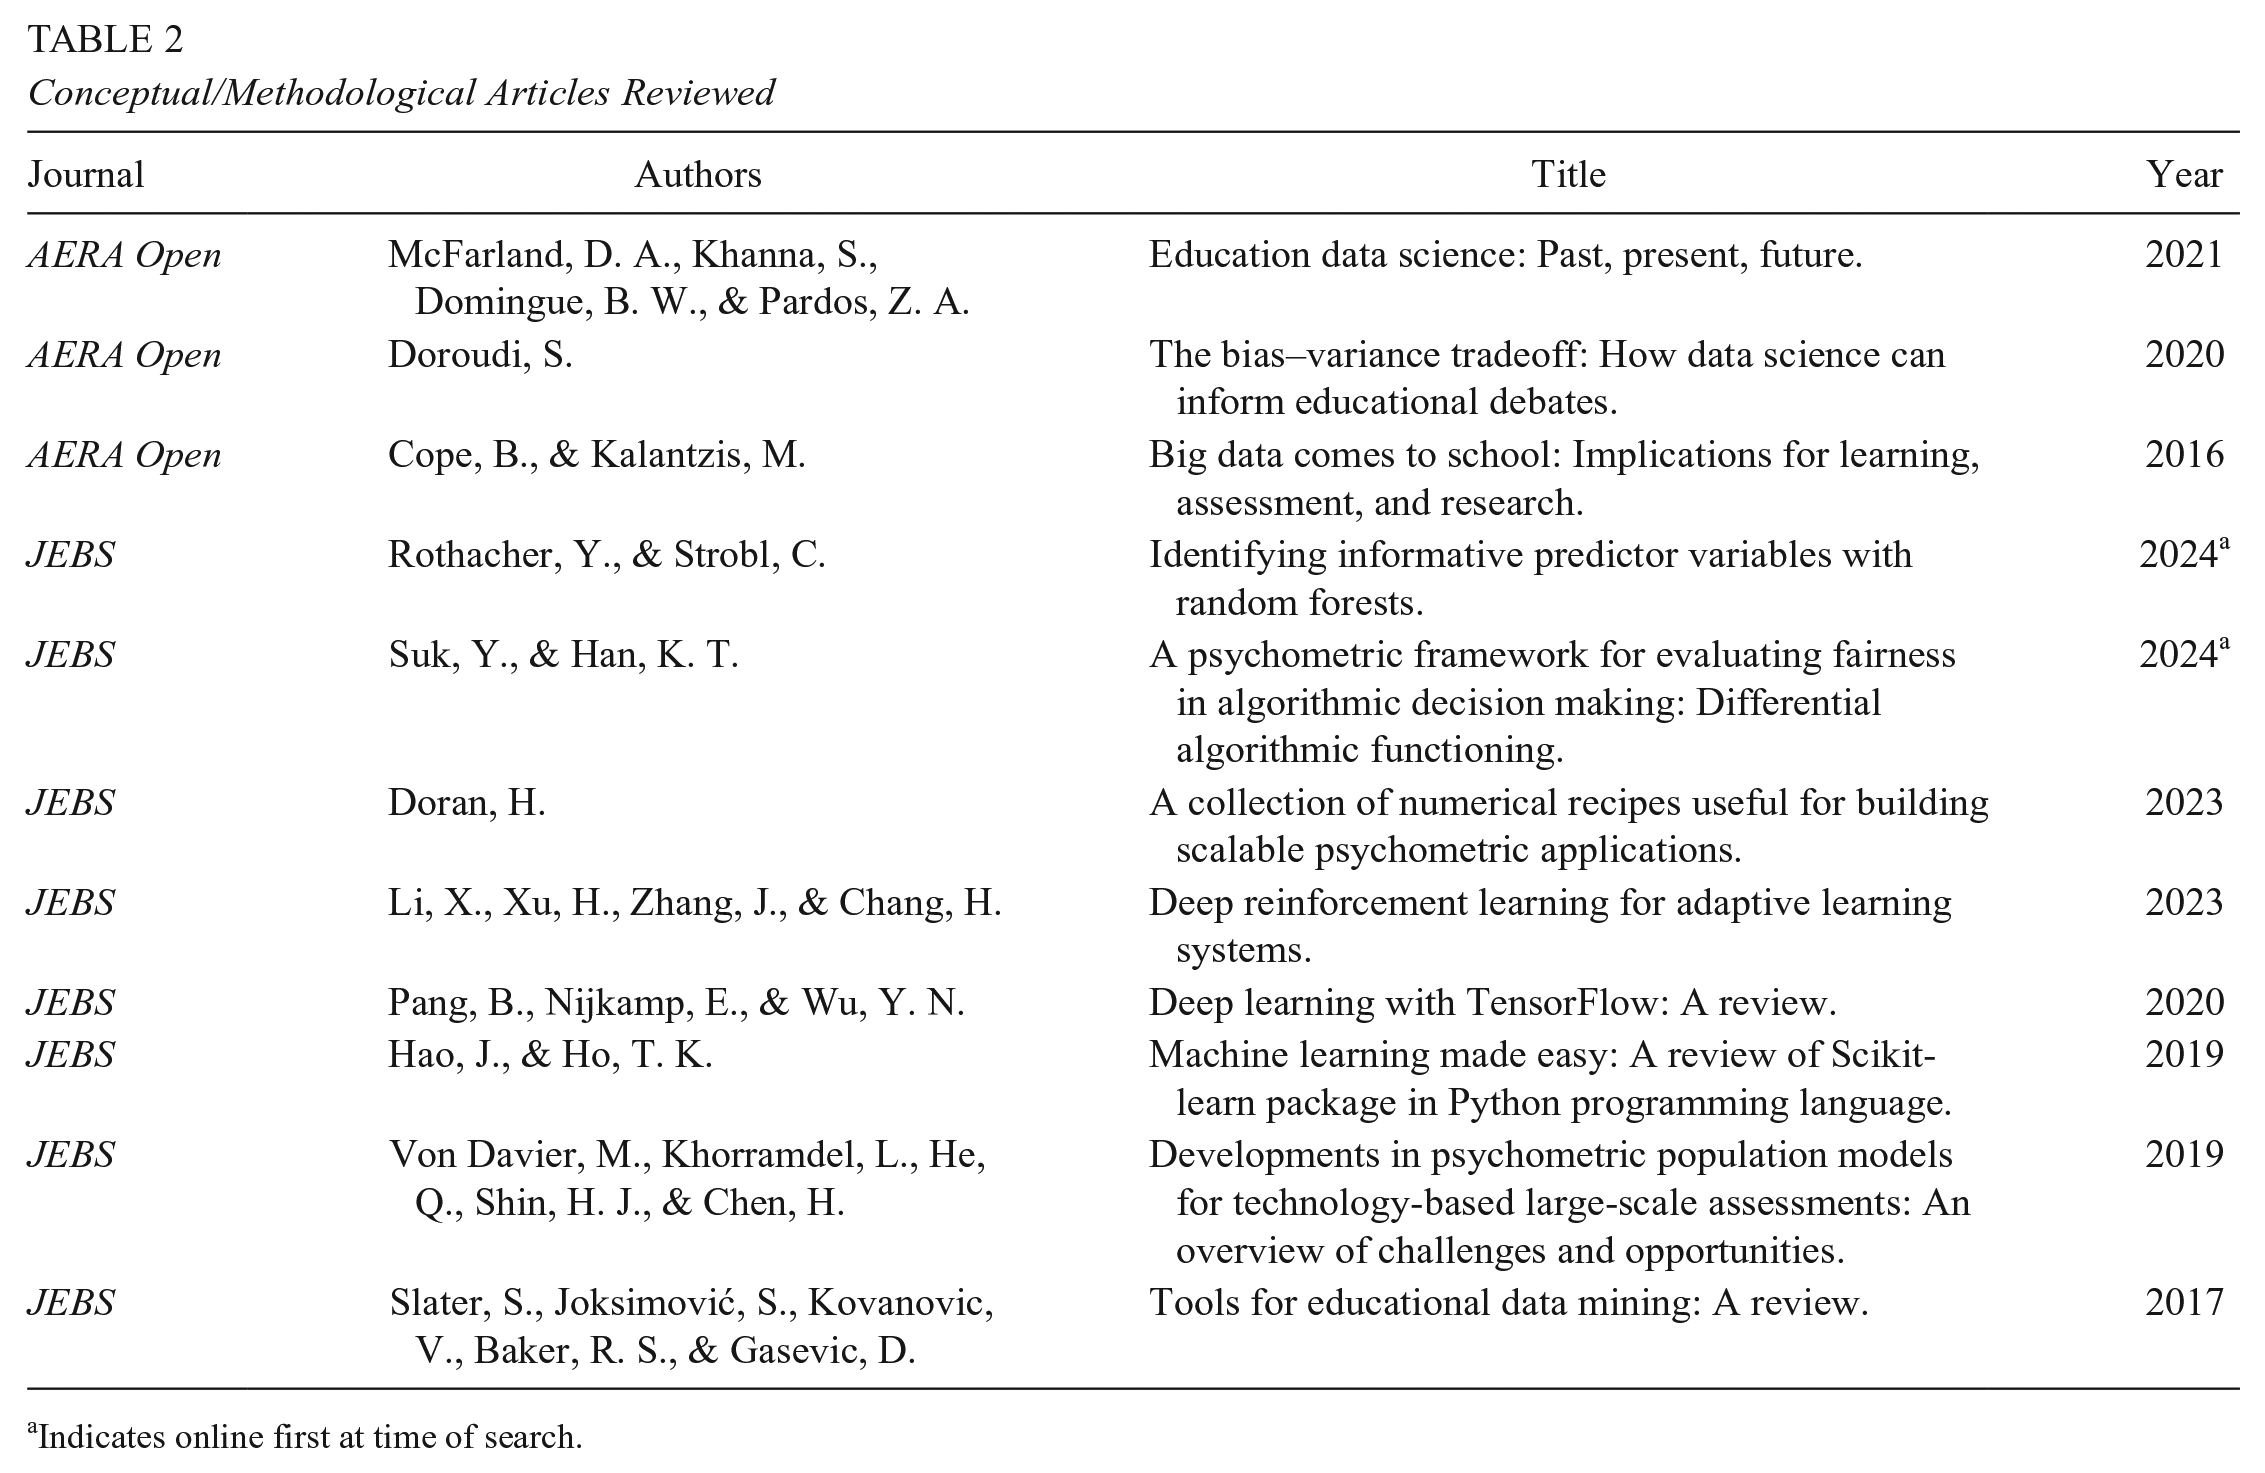
Indicates online first at time of search.
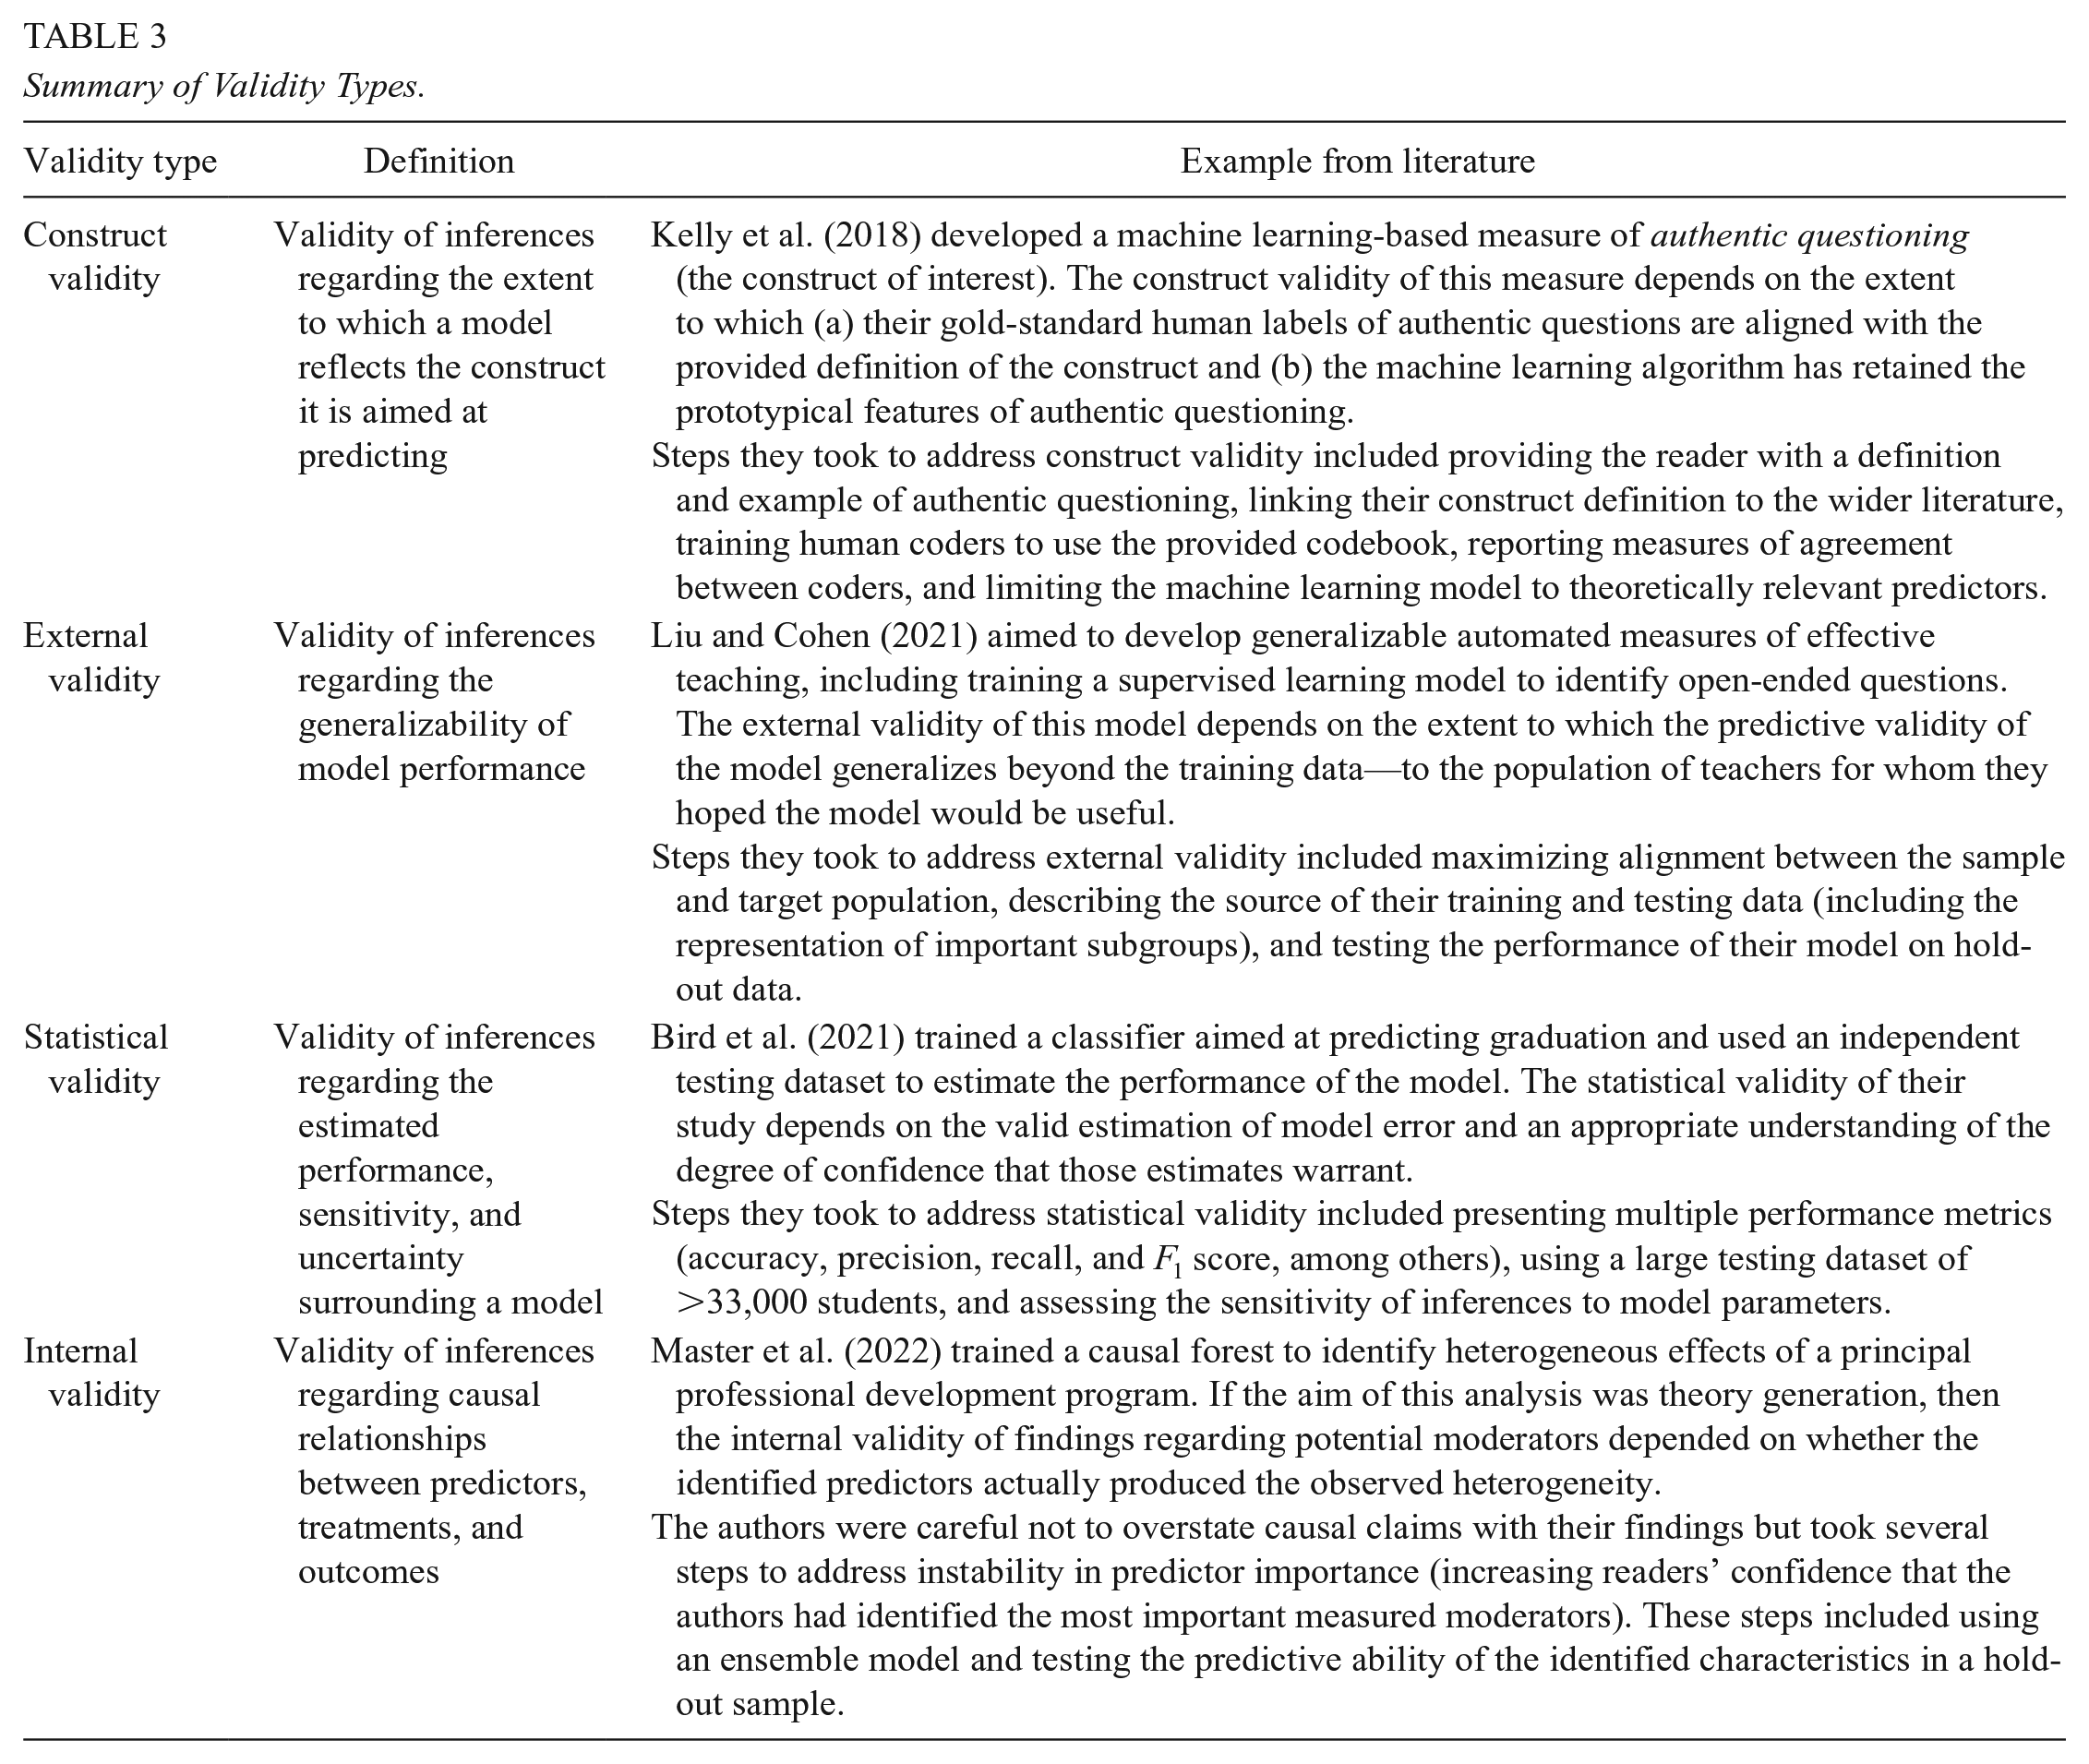
The following sections discuss each validity type in turn—construct, external, statistical, and internal—within a supervised learning context. Each of these sections describes threats to validity and outlines common methodological approaches to addressing those threats. A summary of the validity types, alongside illustrative examples, can be found in Table 3. Then, drawing on the identified threats and best practices, the article concludes with a presentation of a research protocol: a series of questions for researchers and reviewers to consider when conducting and evaluating supervised learning applications in education.
Summary of Validity Types.
Construct Validity in Supervised Learning
Often, when researchers apply supervised learning in educational contexts, it is for a measurement purpose: Researchers have a specific construct they aim to measure and train a supervised learning algorithm to do so (e.g., researchers might use an automated essay grader to measure essay quality). The validity of the resulting conclusions thus relies on the construct validity of the resulting supervised learning measure. Shadish et al. (2002, p. 20) defined construct validity as the validity of “inferences about the constructs that research operations represent.” For example, beyond supervised learning applications, researchers commonly operationalize “teaching quality” using teaching observation rubrics. In such cases, construct validity concerns the extent to which the observation rubric truly reflects the construct of interest (teaching quality).
In studies involving supervised learning, there is often a secondary level of operationalization. Researchers begin with an initial operationalization of a construct using traditional means, and then they use a machine learning algorithm to replicate those measures. For example, researchers may use observation rubrics to operationalize teaching quality and then train an algorithm to replicate those observation scores. To make valid inferences regarding teaching quality in these cases, we must infer that (a) the observation scores appropriately capture teaching quality and (b) the supervised learning algorithm has retained the prototypical features of teaching quality that were captured by the observation scores. Threats to construct validity may occur at either stage—from the construct to measure or from the measure to supervised learning prediction. Four original threats from Shadish et al. (2002) therefore remain relevant: the inadequate explication of constructs, confounding constructs, mono-operation and monomethod bias, and participant reactivity. A related threat in supervised learning is also worth being made explicit here: When there are errors in the gold-standard data, there will necessarily be errors in the final supervised learning measure. These threats are discussed next.
Inadequate Explication of Constructs
Measurement scholars have long acknowledged that valid measurement is bolstered by a strong theoretical understanding of the construct being studied (Cronbach & Meehl, 1955). Thus, a foundational step for improving construct validity in any measurement exercise is the careful specification of the theoretical construct of interest. Shadish et al. (2002, p. 74) considered a failure to do so as the “inadequate explication of constructs.” Given that the first level of operationalization in a supervised learning application involves turning a theoretical construct into labels within the gold-standard (training/testing) data, carefully specifying the construct of interest allows researchers to improve the quality of the gold-standard data and allows readers to assess the quality of model output. Researchers take two common approaches to addressing this threat:
They can provide a comprehensive definition of the construct of interest. For example, when using supervised learning to measure “authentic questioning,” Kelly et al. (2018, p. 452) defined authentic questioning—within the context of dialogic instruction—as “questions for which the answers are not presupposed by the teacher,” and they linked this definition to several instructional frameworks for effective teaching, thereby identifying the literature to which their study spoke.
They can acknowledge any debate or challenges in operationalizing the construct. For example, in predicting graduation, Bird et al. (2021, p. 3) explained the difficulty of defining “drop-out” given that students often leave college for periods of time while intending to return. Thus, the researchers instead aimed to predict “graduation,” where graduation was defined as completing “any college-level credential within 6 years” [Bird et al., 2021, p. 3], and they also provided an evidence-based justification for this definition, drawing on national time-to-completion data.
Errors in Human Labels
In the social sciences, gold-standard data are often created by researchers via hand labeling according to the construct of interest. In the qualitative literature, the process of applying labels to data is typically referred to as coding (while labeling or annotation are more commonly used in machine learning (Anglin et al., 2022). Although often overlooked in the machine learning literature, where fallible human labels may be treated as “ground truth” (Geiger et al., 2020, p. 325; Zheng et al., 2024), the coding process is central to determining the validity of supervised learning predictions. At best, a supervised learning algorithm can only learn to replicate human codes. However, as decades of qualitative research have demonstrated, human coding is rarely a straightforward process because codes are contextual, theoretical, and contestable (Shaffer & Ruis, 2021). Many rigorous qualitative research practices are thus also applicable here. Researchers can do the following:
They can provide a comprehensive codebook for human labeling (as in Aulck et al., 2021; Kelly et al., 2018; Nystrand et al., 1997). A codebook is a set of coding instructions that provides a definition of each label alongside examples and nonexamples (Shaffer & Ruis, 2021). For example, Kelly et al. (2018) created a codebook for labeling authentic questions that was 74 pages long and provided specific instructions to coders about how to handle common ambiguous teacher questions such as “What else?” (see Nystrand [2004] and Nystrand et al. [1997] for details on the codebook).
They can disclose measures of agreement between multiple human labelers (as undertaken by Kelly et al., 2018; Liu & Cohen, 2021; Ramirez et al., 2018). A high level of agreement indicates that multiple labelers’ understandings of the construct’s definition are closely aligned (Shaffer & Ruis, 2021). Relevant metrics include simple agreement, Krippendorf’s alpha, Cohen’s kappa, and correlation coefficients (Krippendorff, 2004).
They can describe human labelers’ training, knowledge, perspectives, and experience, allowing readers to gauge whether the labelers have the necessary knowledge and experience to understand a construct (Shaffer & Ruis, 2021; Snow et al., 2008).
Confounding Constructs
Confounding is typically understood in the context of internal validity, occurring when the correlation between a presumed cause (Variable A) and presumed effect (Variable B) is due to a third variable that is correlated with Variables A and B. The presumed causal relationship, then, is confounded by the extraneous variable. Shadish et al. (2002) argued, however, that the interpretation of constructs also may be confounded by extraneous variables. They provided the example of describing a sample as “unemployed”; the sample may indeed be limited primarily to those without jobs but also may disproportionately include victims of racial prejudice. Interventions that aim to address only one aspect of unemployment (e.g., currently jobless) are likely to be of limited use if the other construct (e.g., discrimination) proves to be a greater determinant. In this case, a construct validity error would occur if only one of the constructs is acknowledged.
In supervised learning applications, when construct confounding occurs at the first level of operationalization (from construct to measure), confoundedness may be exacerbated at the second level of operationalization (from measure to machine learning prediction). Consider, for example, the challenge of predicting college graduation. In most colleges and universities, drop-out occurs more frequently among Black, Hispanic, and lower-income students (Bird et al., 2021). Thus, as with the preceding unemployment example, drop-out is confounded by demographic characteristics. If demographic characteristics are included in the model, the model likely would identify these demographic variables as key predictors, resulting in students of color being more likely to be labeled as at risk for dropping out regardless of whether other associated risk factors are present (Baker & Hawn, 2021). Further, even if a researcher excludes demographic variables from the model, the model may focus on theoretically irrelevant factors that correlate with demographic variables (Hovy & Spruit, 2016). This phenomenon is one of the most commonly discussed types of algorithmic biases in the machine learning literature, variously termed social bias, historical bias, societal bias, or preexisting bias (Van Giffen et al., 2022).
It is worth briefly considering, however, why and when construct confounding is a problem for construct validity rather than, say, an instance of effective prediction. After all, the aim of supervised learning is to predict an outcome by identifying existing patterns. In the example, the model isn’t wrong to predict that students of color are more likely to drop out; in fact, because of systemic factors, they are (Brown & Rodríguez, 2009). The validity error would come in the interpretation of the label, particularly in the researcher’s failure to acknowledge the relationship between race, socioeconomic status (SES), and schooling (Bradley & Renzulli, 2011) despite machine learning predictions for individuals being influenced by these factors.
Importantly, construct confounding also can result from idiosyncrasies in the creation of training data, even in the absence of any real-world co-occurrence of constructs. Consider one infamous example. In “Automated inference on criminality using face images,” researchers claimed successful use of supervised learning to draw inferences about the criminality of individuals from photographs of their faces (X. Wu & Zhang, 2016, p. 10). However, critics later pointed out that the noncriminal photographs were selected from personal and professional websites, where people are commonly smiling, whereas the criminal photographs were selected from formal identification sources (e.g., driver’s license photos), where smiling was less common (Bergstrom & West, 2021; Bowyer et al., 2020). In other words, in the training data, “criminality” was confounded by smiling (even though smiling may not necessarily correlate with criminality outside these data); it was smiles, not criminality, that the classifier could identify. Concluding that a classifier can identify “criminality” rather than smiling is therefore erroneous, as is the conclusion that “it is possible to infer character from features” (X. Wu & Zhang, 2016, p. 1).
To address the threat of confounding constructs, researchers can do the following:
They can limit predictors to those that are theoretically relevant. For example, in predicting authentic questioning, Kelly et al. (2018, p. 455) limited themselves to “theoretically grounded language features” such as question stems and parts of speech tags. A supervised learning measure is less likely to be confounded by an extraneous nuisance variable if the researcher restricts the model to factors that are theoretically relevant to the construct (Zheng et al., 2024).
They can assess predictor importance using interpretable algorithms. For example, Lang et al. (2022) used data ablation techniques, systematically varying the predictors incorporated in their college major classifier to determine which predictors were most important. If a predictor without theoretical relevance to the outcome surfaces, this may indicate a co-occurring and potentially misleading construct (see also Bowyer et al., 2020; X. Wu & Zhang, 2016).
They can assess the fairness of the model using formal approaches, including statistical parity, separation, and differential algorithmic functioning (Barocas et al., 2023; Suk & Han, 2024).
Mono-operation and Monomethod Bias
All measures underrepresent constructs and contain irrelevancies (Shadish et al., 2002). For this reason, researchers are advised to use several measures of a given construct. Shadish et al. (2002) conceptualized a failure to do this as mono-operation bias (relying on a single measure) associated with monomethod bias (relying on a single method of measurement). For example, readers of a study may be suspicious if an intervention improves a construct when that construct is only measured using self-report. A stronger approach may be to triangulate results from both self-report and teacher report. The same advice holds true when supervised learning is used to measure an outcome. Construct validity will increase when there are multiple measures and methods of measurement, especially where these span both human and machine approaches (Grimmer & Stewart, 2013). To address mono-operation and monomethod bias, researchers commonly do the following:
They can replicate findings obtained with machine learning measures using non–machine learning-based measures (as in Mozer et al., 2023; Shores & Steinberg, 2022). For example, in estimating the number of student-weeks spent in remote instruction during the COVID-19 pandemic, Shores and Steinberg (2022) triangulated text classification–based estimates (applied to school websites) with mobile phone data—with key research findings consistent across both sources.
They can probe the sensitivity of individual predictions to multiple algorithms. For example, in the work of Bird et al. (2021) on graduation prediction, the authors assessed the extent to which the relative ranking of students’ drop-out risk was consistent across algorithms. Instability here would indicate that a decision of whether to intervene with a given student—because they are in the top x percentile for predicted drop-out risk, for example—may depend on the specific algorithm employed by the college.
Reactivity to the Machine Learning Model
Because humans actively interpret their surroundings and adapt their behavior in response, Shadish et al. (2002, p. 73) cautioned that “participant responses reflect not just treatments and measures but also participants’ perceptions of the experimental situation”—a phenomenon known as participant reactivity. For example, psychological evaluation may cause participants to act or answer questions in ways they hope will be viewed as psychologically healthy (Rosenberg, 1969). A similar phenomenon can occur when participants learn that they are being evaluated by a machine learning model; participants may attempt to game the model by guessing the actions that will improve their score. For example, in some automated grading systems, longer essays often receive higher scores (Bridgeman et al., 2012). If this becomes common knowledge, participants may start writing longer essays without changing the underlying quality of the work (Cope & Kalantzis, 2016). To address this challenge, researchers can do the following:
They can avoid sharing information about the method of measurement with participants. For example, when measuring the relationship between authentic questioning and teacher-reported student engagement, Kelly and Abruzzo (2021, p. 311) ensured that “teachers had no knowledge of the measures of instruction at the time of reporting.” If participants are unaware of assessment specifics, they are less likely to successfully manipulate their scores. In contrast, when institutions use algorithms for high-stakes decision making, publicizing information on the predictors is also an important aspect of transparency and accountability (Zheng et al., 2024).
They can aim for theoretical alignment between predictors and the construct of interest (as in Kelly et al., 2018). Given the conflict between transparency and participant reactivity, a better approach may be to ensure alignment between the predictors and the construct. In this way, reactivity can be directed toward more productive ends.
They can conduct interviews and surveys with participants. It is impossible to prevent respondents from generating their own hypotheses regarding researcher intentions and from changing their behavior accordingly. However, reactivity may at least be probed through interviews or surveys of participants (Shadish et al., 2002).
External Validity in Supervised Learning
Shadish et al. (2002, p. 83) conceptualized external validity within a causal evaluation framework, defining it as the “extent to which a causal relationship holds over variations in persons, settings, treatments, and outcomes.” In supervised learning, however, it is not a causal relationship that must hold over relevant variations but a predictive relationship. External validity in supervised learning thus may be conceptualized as the extent to which a model’s predictive ability, as estimated using the provided performance metrics, generalizes to the intended use cases. In a single study, this means that the performance metrics—estimated using the labeled testing data—must be a good estimate of the performance of the model in the unlabeled data. In other words, model performance must generalize from the testing data to the full sample of data included in the study (Yarkoni & Westfall, 2017). These data may include variations in people, settings, and time (Kapoor & Narayanan, 2023). Further, when models are made available for public use and/or applied to novel datasets, the scenarios may become increasingly diverse.
Threats to external validity are the reasons that such generalizations may fail. Shadish et al. (2002) identified interactions—when three or more variables influence each other—as the key challenge to external validity. In a randomized experiment, external validity is threatened if there is a substantial coefficient on a three-way interaction between the treatment, the outcome, and a certain characteristic of either the unit, treatment, outcome, or setting. In supervised learning, the external validity threat similarly occurs when there is three-way interaction between the predicted outcome, predictors, and the characteristics of samples, settings, or time points. Just as treatment effects often vary with study characteristics (Bloom & Michalopoulos, 2013), so too do predictive relationships (Kapoor & Narayanan, 2023). Thus, three types of interaction effects—samples, settings, and time—are discussed in more detail next. One additional threat, particular to supervised learning applications, is also discussed: the failure of a model to generalize because it was overfit to noise in the training sample.
Interaction Between the Predictive Relationship and Variations in the Sample
In supervised learning, the process of estimating performance metrics implicitly assumes that the testing data are a random sample of the population to which the algorithm will be applied (Zadrozny, 2004). Yet, in many supervised learning applications, training and testing data are not a random sample of the population of interest and instead may have distinct characteristics—a phenomenon known as sample selection bias. When these characteristics moderate the relationship between predictors and the predicted outcome, external validity is threatened. Further, external validity requires that relationships generalize not only to new relevant populations but also to variations within the original population (Shadish et al., 2002). In other words, external validity is also threatened when the model exhibits differential performance for one or more represented subgroups. To address this threat, researchers commonly can do the following:
They can select training/testing data so as to maximize alignment with the target population. Then, they can describe the source and characteristics of these data. For example, in developing automated approaches to measuring effective teaching, Liu and Cohen (2021) described the demographic characteristics of both the teachers and the students in their sample. They also noted the limitations of their classroom sample—fourth and fifth grade English language arts classrooms—indicating that “classroom discourse may well look different in mathematics or in the primary grades” (Liu & Cohen, 2021, p. 606).
They can ensure sufficient representation among population subgroups. If there is an interaction between the predictive relationships within a model and model subgroups, the model must be provided with enough data to learn those interactions (Buolamwini & Gebru, 2018). This can be addressed by oversampling important subgroups. In the case of Liu and Cohen (2021), for example, ensuring the model’s generalizability across linguistic subpopulations might mean oversampling classrooms with high proportions of English language learners.
They can evaluate the performance of the algorithm among subgroups (as in Chen et al., 2022; Lang et al., 2022). In addition to presenting average performance metrics, best practice requires that researchers also present performance metrics within subgroups (Mitchell et al., 2019). For example, Chen et al. (2022) assessed the performance of an automated essay scoring system among struggling and nonstruggling writers and demonstrated that the model was less reliable when scoring the essays of struggling writers. In other cases, additional subgroups might include those defined by race/ethnicity, nationality, gender, SES, and/or disability (Baker & Hawn, 2021).
Interaction Between the Predictive Relationship and Variations in Setting
Machine learning researchers often transport models trained in one setting for use in another (Lucy et al., 2020). For example, researchers commonly apply pretrained sentiment models to new data, such as applying a model trained to identify positive versus negative Yelp reviews to assess positive versus negative sentiment in student surveys. However, the sentiment of a particular word is often context dependent, creating an interaction between the setting and predictive relationships in a sentiment model. To address this threat, researchers can do the following:
They can set aside a hold-out setting for validation. For example, Kelly et al. (2018) trained their authentic question classifier on one set of schools and validated the model on a hold-out school not used to train the classifier. If the model performs well in the hold-out setting, this indicates that predictors of authentic questioning can generalize across setting characteristics.
They can evaluate pretrained models in the current setting. This may require hand labeling a sample of the current data to examine the performance of a pretrained classifier. For example, Lucy et al. (2020) evaluated a pretrained named-entity-recognition classifier (designed to identify proper nouns) to assess its ability to identify the names of people within history textbooks, finding that the performance was meaningfully lower than the performance on the original testing sample.
Interaction Between the Predictive Relationship and Variations in Timing
In many supervised learning applications, a model is trained on past data with the intention of applying it to future data. However, models that perform well initially may not retain their performance over time (Sculley et al., 2014), a phenomenon known as drift (Gama et al., 2004). A canonical example of model drift is the failure of Google Flu Trends. At one point, this model could accurately predict Centers for Disease Control and Prevention flu prevalence estimates days ahead of the release of the estimates (Ginsberg et al., 2009). Later, however, the model massively overestimated flu prevalence. The reasons for the failure of Google Flu Trends are not known, but one hypothesis is that changes in Google’s search platform—for example, the incorporation of suggested search terms for users—dramatically changed the nature of the underlying search data (Lazer et al., 2014). As a result, the relationship between the predictors (search terms) and the predicted outcome (flu prevalence) proved unstable over time. In education contexts, policy changes might similarly influence the relationship between predictors and outcomes. For example, high-quality teaching might look and sound different following the adoption of Common Core standards (Cohen et al., 2022). In this situation, a supervised learning model trained in the pre–Common Core era may not perform well in the post–Common Core period. To address this threat, researchers commonly can do the following:
They can assess the correlation between model performance and time (as in Lang et al., 2022). To evaluate the plausibility of model drift, researchers can assess whether there is a substantial correlation between model performance and time in past data. If the predictive ability holds stable over time in past data, this provides evidence that the predictive ability will be stable in future data.
They can monitor model performance. Just as researchers should evaluate model performance in new settings, they should periodically evaluate model performance in new time periods (Sculley et al., 2014).
They can update model training with current data. If model performance deteriorates, researchers can either retrain the model or update past training data with newly collected data (Lwakatare et al., 2020).
Model Overfit
Finally, all generalizations will be invalid if the model is overfit to the training data. When flexible algorithms are trained on data with many variables, an algorithm can reduce error in the training sample by learning idiosyncratic and ungeneralizable patterns (Hastie et al., 2009). Indeed, using its training data, a sufficiently flexible model can reduce error to zero without necessarily identifying any generalizable patterns. This is why a minimum standard for rigorous supervised learning incorporates the training/testing split. When model performance is estimated on data that are independent from the training data, these performance metrics provide a more accurate estimate of model generalizability (Emmert-Streib & Dehmer, 2019; Yarkoni & Westfall, 2017).
Statistical Conclusion Validity in Supervised Learning
In quantitative social science research, conclusions are drawn from statistical estimation, including point estimates (e.g., effect sizes), measures of uncertainty (e.g., standard errors), and statistical tests (e.g., null-hypothesis statistical testing). Statistical conclusion validity concerns the appropriateness of conclusions drawn from such evidence. In supervised learning, conclusions are similarly drawn from statistical estimation. Most commonly, conclusions regarding a model’s usefulness are based on the magnitude of performance metrics (e.g., accuracy, precision, recall, etc.). Threats to statistical validity in supervised learning include situations in which we may over- or underestimate the magnitude of the performance metric or the degree of confidence that the performance metric warrants. Importantly, an incorrect understanding of performance can result in faulty decisions, including the deployment of a deficient model because its performance was overestimated or because confidence was overstated (Varoquaux, 2018). Four threats to statistical validity in supervised learning are discussed next: misleading or uninformative performance metrics, optimizing a model to the testing data, dependence between the training and testing data, and an insufficient testing data sample size.
Misleading or Uninformative Performance Metrics
Researchers can choose several performance metrics to gauge a model’s usefulness. With binary classifiers—for example, classifying a student as at risk/not at risk—performance metrics commonly concern the relationship between true positives (TPs; positive cases correctly classified as positive according to the gold-standard data), true negatives (TNs; negative cases correctly classified as negative), false positives (FPs; negative cases incorrectly classified as positive), and false negatives (FNs; positive cases incorrectly classified as negative). Metrics include


(Note, however, that use of the term true here is somewhat misleading, a high rate of TNs and TPs indicates only agreement with the gold-standard data, which itself may be flawed, as discussed previously under construct validity.)
Researchers also commonly calculate summary statistics, such as the F1 statistic and the area under the receiver operating characteristic curve (Manning & Schütze, 1999). When a supervised learning algorithm aims to predict a continuous outcome—for example, predicting a student’s score for a given essay response—common performance metrics include the raw error, mean squared error, root mean squared error, and R2.
Conclusions regarding a model’s usefulness depend on an accurate understanding of the prevalence, magnitude, and types of error involved. How often, for example, does the model fail to identify an at-risk student? How distant is the average predicted teacher observation score from the gold-standard human observation score? Validity is threatened when the presented performance metrics omit this information. For example, accuracy does not distinguish between FPs and FNs. Therefore, the accuracy of a drop-out prediction algorithm does not indicate how often the model fails to identify an at-risk student. If drop-out is rare, the model could boast high accuracy without serving its intended purpose—such as helping administrators identify suitable students for intervention. Similarly, although summary metrics such as F1 will appropriately penalize a model for its systematic failure to identify either positives or negatives, they do not provide transparent information to research consumers regarding the prevalence of these errors (Green & Viljoen, 2020). To improve the policy relevance of performance statistics, researchers can do the following:
They can present metrics that transparently characterize the degree and types of errors (as in Arthur & Chang, 2024; Bird et al., 2021; Kelly et al., 2018). In binary classifiers, this includes precision, recall, specificity, and FP rate. In predicting graduation, for example, Bird et al. (2021) presented both precision (the share of true graduates that the model predicts will graduate) and recall (the share of predicted graduates who graduate). With a continuous classifier, metrics that clearly report the degree of error include raw error, mean squared error, and root mean squared error.
They can present multiple performance metrics alongside each other. Bird et al. (2021), for example, provided bar charts to demonstrate that graduation recall was routinely higher than graduation precision.
Model Optimized to Testing Data
In calculating performance metrics, researchers commonly have two goals: selecting between competing algorithms and hyperparameters (model selection/tuning) and estimating the final model’s performance (model evaluation). For final performance metrics to provide an unbiased estimate, however, these two functions must be completed on independent datasets. Otherwise, if testing data are used to support a choice between competing models, then final performance metrics will underestimate the true error, sometimes substantially (Hastie et al., 2009). Peeking repeatedly at testing statistics is akin to p-hacking; just as a quantitative researcher can exploit random statistical variation to inflate p values, a machine learning researcher can exploit random variation in the testing data to inflate performance metrics (Yarkoni & Westfall, 2017). To protect against this threat, researchers commonly can do the following:
They can split labeled data into three datasets instead of two: training, development, and testing. This second split between training and development data can be used for model tuning and algorithm selection, whereas the testing data are only used once, after the model has been finalized (see, e.g., Lang et al., 2022).
They can split labeled data into two overarching datasets, training and testing, but use k-fold validation within the training dataset to select the algorithm and hyperparameters (Hastie et al., 2009). In this approach, the training dataset is divided into k (commonly five or 10) equally sized subsets, or folds. The researcher trains the model k times, each time using k − 1 folds for training and the remaining fold for validation, rotating through all folds as the validation set. After identifying the best-performing hyperparameters and model setup, the model is retrained on the full training set before being validated on the hold-out testing dataset. See, for example, deployment of 10-fold validation by Bird et al. (2021).
They can preregister the specifics of the machine learning training process (e.g., the cross-validation method, hyperparameters tested, etc.), as demonstrated by Cimpian and Timmer (2019).
Dependence Between Training and Testing Data
For performance metrics to be unbiased, researcher decisions not only must be independent of the testing data, but the testing data itself also must be independent of the training data. In other words, knowing the outcome of an observation in the training dataset should not be useful for predicting the outcome of an observation in the testing dataset. This assumption is violated if, for example, the same person produced the two observations (e.g., one student produced an essay in the training dataset and another essay in the testing dataset) or if there are duplicates in the data (e.g., tweets that have been copy-pasted or retweeted by multiple users). If the degree of dependence is substantial, then a model could fit to noise in the dataset. Consider again the example of student essays. If one strong writer has an idiosyncratic writing style, the model might fit to those ungeneralizable idiosyncrasies. If that same writer has observations in the testing dataset, the model won’t be penalized for such overfitting. To address this threat, researchers commonly can do the following:
They can split the data for training and testing (or cross-validation) using the uppermost level of a hierarchical dataset. This might mean splitting observations at the person level (when individuals produce multiple observations), at the classroom level (when students are nested within classrooms), or at the school level (when teachers are nested within schools). For example, in training a classifier to identify authentic questions from teachers, Kelly et al. (2018) employed “leave one teacher out validation” so that performance metrics could not be overinflated via overfitting to individual teacher idiosyncrasies in the training data.
Insufficient Validation Sample Size
When researchers calculate performance metrics, these are point estimates derived from a sample (the testing data) with the purpose of generalizing to a population to which the model will be applied subsequently. As with all point estimates, these statistics should not be interpreted as the truth but rather as the best estimate of an unknown population parameter (Savoy, 1997). Thus, just as quantitative evaluation researchers present standard errors and confidence intervals regarding treatment-effect estimates, machine learning researchers should present confidence intervals surrounding performance metrics (Mitchell et al., 2019). Presenting confidence intervals would force researchers to acknowledge that high performance in the testing data, particularly in a small testing dataset, may be due to a lucky draw. Presenting confidence intervals also might encourage researchers to increase the size of their testing datasets, thereby increasing the statistical validity of their estimates. Approaches to confidence interval estimation include the following:
Estimating a binomial proportion interval. In the case of binary predictions, researchers may estimate a confidence interval by calculating a binomial proportion interval:
Bootstrapping the testing sample. For a given sample of n observations in a testing dataset
Internal Validity in Supervised Learning
Internally valid studies can help determine the extent to which an educational program has a positive impact on students, making it a top priority among governmental and funding agencies (What Works Clearinghouse, 2019). Contemporary education researchers thus are often highly attuned to methods that increase causal rigor. However, the growth of machine learning in education is somewhat at odds with a prioritization of internal validity. Although an algorithm will identify the combination of variables that best predicts the outcome of interest, there is no consideration of whether those variables are confounders of or contributors to the outcome. Further, there is no guarantee that the individual variables that are given the greatest weight in the model are the same variables that are most predictive of the outcome—only that the combination of variables is maximally predictive (Mullainathan & Spiess, 2017). Quite simply, supervised learning algorithms are optimized for prediction rather than causal inference. Although experiments and quasi-experiments are designed to estimate the impact of A on B, supervised learning methods are designed to estimate predictions of B from A (Mullainathan & Spiess, 2017).
Nevertheless, prediction can be used in the service of causal inference. Three common scenarios were identified from the reviewed literature. First, supervised learning algorithms may be used to measure outcomes or characterize treatments in an evaluation framework (as in Anglin, 2024; Harper et al., 2021; Mozer et al., 2023). Second, supervised learning algorithms may be used to build causal theory, particularly surrounding moderators, or to estimate heterogeneous treatment effects (as in Master et al., 2022; Pietsch et al., 2023; Suk & Han, 2024). Third, supervised learning algorithms are increasingly being used to identify and control for confounds (as in Gormley et al., 2023; Jabbari et al., 2023; Keller, 2020).
In the first case, where supervised learning is used to measure treatments or outcomes, the same threats to internal validity that might occur with any evaluation apply, including ambiguous temporal precedence, selection, history, maturation, regression, attrition, testing, instrumentation, and the additive and interactive effects of these (Shadish et al., 2002). Although a comprehensive overview of these threats is beyond the scope of this paper, readers may look to the Registry of Educational Effectiveness (Spybrook et al., 2019) and the What Works Clearinghouse (2019) protocols. This section highlights threats relevant to the second and third cases.
Instability and Selection Bias in Predictor Importance
Machine learning algorithms are adept at identifying nonlinear and interactive patterns in data (Hastie et al., 2009). They are thus especially useful for identifying heterogeneity in phenomena; researchers may use supervised learning to predict an outcome (e.g., graduation) and then observe the variables that are most predictive—such as the largest coefficients in a penalized regression or the first branches in a regression tree—to build causal theory around the variables that increase or decrease the outcome. If there are important interactive and nonlinear relations—for example, if men in STEM majors are at the greatest risk of dropping out or if a precipitous, rather than linear, drop in GPA causes students to leave school—supervised learning models can efficiently identify these patterns, helping researchers to build inductive theory (Choudhury et al., 2018). However, there are challenges in this approach. First, the most important predictor in a given model is not necessarily the most important available predictor of the outcome. Due to the flexibility of many supervised learning algorithms, slight variations in training data can cause notable changes in predictor importance, even while model performance remains unchanged (Keller, 2020; Mullainathan & Spiess, 2017). For this reason, the variables identified as highly predictive using flexible and adaptive algorithms such as regression trees and gradient boosting are less stable than those identified using ordinary least squares regression (Mullainathan & Spiess, 2017).
Furthermore, as with any analysis of patterns in observational data, a variable may be a stable and significant predictor of an outcome without necessarily having a causal impact on it. The identified predictor simply may be a correlate of another, unobserved variable—the true determinant. For example, a hypothetical supervised learning model may find that undergraduate students in a particular major are more likely to graduate. This may be due to their experiences in the major (i.e., a causal relationship) or because of the type of student who decides to pursue the major (i.e., selection bias). The model will not distinguish between these two possibilities. To address these threats when building theory, researchers may do the following:
Acknowledge that findings regarding predictor importance are correlational and exploratory (as in Lang et al., 2022; Master et al., 2022).
Use supervised learning to identify potentially important predictors and then assess the predictor-outcome relationship in a separate hold-out dataset, addressing the challenge of predictor instability. This is the approach taken by Master et al. (2022) when identifying potential moderators of principal coaching effects—training a causal forest on one portion of the data and then using a hold-out dataset to assess moderator importance.
Assess average predictor importance across many models (as in González Canché, 2023; Master et al., 2022). In an ensemble approach to supervised learning, a researcher trains many models on random subsets of the data—combining many regression trees into a forest, for example. Final predictions then result from aggregation across the models. Just as predictions are more stable in ensemble models, predictor importance is also more stable when aggregating across several models (Elith et al., 2008).
Unobserved Confounders in Models Predicting Treatment Selection
Finally, a common application of supervised learning in causal research is to aid the identification and control of confounders. For example, researchers commonly use regression trees to predict treatment take-up (McCaffrey et al., 2004). The resulting predicted probability scores are then used in a propensity score framework to control for selection. Empirical evidence from the within-study comparison literature suggests that—given the same set of potential covariates—machine learning approaches to propensity score estimation can reduce bias when compared with logistic regression approaches (Anglin et al., 2023). However, as with any matching or weighting approach, the algorithm’s success at eliminating selection bias depends on the quality of available data (Cook et al., 2008). Supervised learning cannot address the problem of unobserved confounders. To address the threat of unobserved confounders, researchers commonly can do the following:
They can present evidence of similarity between the treatment and comparison groups following propensity score weighting (as in Gormley et al., 2023; Im et al., 2016; Sales et al., 2018). Although balance on observable characteristics does not guarantee balance on unobservable characteristics, a discernible imbalance does increase selection bias concerns.
They can collect data on hypothesized predictors of treatment take-up. Selection bias is often reduced substantially when researchers control for pretreatment outcome measures and for variables that are theorized to influence selection, such as motivation or preferences (Keller, 2020; Marcus et al., 2012; Pohl et al., 2009; Wong et al., 2017). In contrast, exclusively controlling for demographic covariates rarely produces unbiased treatment effects (Wong et al., 2017).
Research Protocol
Drawing on the threats and best practices described earlier, the research protocol presented in Table 4 provides an initial starting point for improving and assessing the validity of inferences drawn from machine learning applications. Like the validity-types framework, the protocol emphasizes proactive design decisions. By considering threats during the planning stages of a study, researchers may preemptively address them—a sentiment often captured by the adage, “You can’t fix with analysis what you’ve bungled by design” (Light et al., 1990, p. xiii). Researchers can best address construct validity by identifying the construct of interest upfront and by selecting training data that best reflect that construct. They can best address external validity by ensuring that the training and testing sample and setting match the context(s) where the model likely will be applied and by ensuring the adequate representation of population subgroups. They can best address statistical validity by selecting the most informative performance metrics and by ensuring an adequate sample size in the testing data. And they can best address internal validity by selecting an appropriate design and by collecting data on the most relevant confounders. The protocol provided in Table 4 prompts researchers to consider these facets in the early stages of a study.
Summary Protocol for Machine Learning Applications in Education

Note. An X indicates the most relevant validity type to which the question speaks. CV = construct validity; EV = external validity; SV = statistical validity; IV = internal validity.
The validity of supervised learning applications also may be increased post hoc (i.e., after model training) through comprehensive reporting and transparency (Gebru et al., 2021; Mitchell et al., 2019). In the machine learning literature, the push for increased transparency has involved the increased adoption of standardized documentation to accompany public-use training datasets (Gebru et al., 2021) and pretrained models (Mitchell et al., 2019). Although studies applying supervised learning in educational contexts rarely release their training data or models, this approach is nonetheless instructive. To judge the validity of inferences drawn from supervised learning, critical readers require comprehensive information. To this end, the questions in Table 4 may serve as a prompt for future study authors when deciding which information to include in a paper.
Discussion and Limitations
This article draws a parallel between validity typology of Shadish et al. (2002) and the inferences drawn from supervised learning in educational contexts. It provides a holistic overview of threats to validity alongside example approaches for addressing those threats. The article’s aim is to improve the validity of supervised learning applications in education research. Naturally, however, its limitations reflect both the limitations of the original typology and of typologic approaches more generally.
First, catalogues of validity types and threats serve as heuristics for researchers (Mark, 1986). That is, these threats represent cognitive shortcuts (Reichardt, 1985). A catalog of various threats allows us to evaluate the validity of inferences more easily than we otherwise might (Mark, 1986), particularly given the heavy cognitive lift required to evaluate the validity of inferences derived using unfamiliar methods. However, such shortcuts also may serve as blinders, allowing unlisted threats to go unacknowledged (Reichardt, 1985). Further, typologies suffer from an inherent arbitrariness. Critics have pointed out that “definitions of validity and threats to validity have varied over time, are sometimes incongruous, and are not always easy to differentiate” (Reichardt, 2019, p. 27). As Mark (1986, p. 63) writes, “A validity typology is not a foolproof, logistically consistent, mutually exclusive set of categories. It is a device, an aid.” Even if distinctions between validity types and threats remain up for debate, therefore, attempts to collate and organize them still can prove valuable.
Second, any list of threats necessarily will be incomplete. Indeed, the number of threats identified by Shadish et al. (2002) tripled between 1957 and 1979 (Campbell, 1957; Cook & Campbell, 1979). The threats identified in this article are thus not expected to be comprehensive. Although machine learning applications in education are increasing quickly, the literature base is still relatively young; new challenges likely will be identified as the field develops. Similarly, best practices are also likely to grow and evolve, meaning that the approaches discussed here and in the protocol should be considered as examples rather than as a comprehensive list of requirements.
Third, Shadish et al. (2002) may themselves take issue with the application of their validity typology to supervised learning applications. These authors have long argued that internal validity is the sine qua non of research; in their view, internal validity must be prioritized before assessments regarding other validity types are deemed appropriate (Campbell & Stanley, 1963). In contrast, overemphasizing internal validity at the cost of other validity types has been heavily critiqued in discussions of the original validity typology (Albright & Malloy, 2000; Reichardt, 2019). This article is thus not the first to advocate for expanding the validity typology to include noncausal research (Huck & Sandler, 1979; McMillan, 2000; Onwuegbuzie, 2000).
Finally, as noted earlier, the understanding of validity provided by Shadish et al. (2002) is only one formulation among many and is not without its limitations. One key drawback of the framework, when applied to supervised learning, is the relatively limited focus it places on consequences and value implications (Kane, 2001; Messick, 1989). The threats to validity given by Shadish et al. (2002) focus on the causes of faulty inferences, encouraging researchers to rule out these threats and improve their inferences. However, comparatively less attention is given to the consequences of these inferences. As Kane (2001) points out, even accurate inferences are not sufficient to argue for test use; a medical test that can accurately predict an untreatable disease may still cause harm if applied without purpose, particularly if there are side effects. Similarly, even an accurate supervised learning model may have unintended consequences when applied in practice (Barocas et al., 2023; see also Lee et al. [2021] for an example of negative consequences resulting from a machine learning measure in higher education). Further, Shadish et al. (2002) only provide limited discussions of trust and transparency issues, key issues in supervised learning given that training datasets are rarely described and commonly underrepresent key demographic groups (Buolamwini & Gebru, 2018). For these reasons, the validity typology and associated checklists presented here cannot serve as the final conceptualization of machine learning validity in education research. Instead, they offer a practical form of scaffolding while best practice in the field develops.
Conclusions
Given the exponential rise of machine learning applications in education research, we are at a critical disciplinary juncture. Machine learning is equally capable of generating valuable insights and faulty inferences. This article aimed to increase the likelihood of the former by providing education researchers with a straightforward reference guide to validity considerations. Although machine learning technologies are quick to adapt and evolve, the most important questions concerning valid inferences are age old: Does the measured construct align with the construct’s theoretical definition? Does the sample genuinely reflect the populations of interest? Are the statistics unbiased? Do the correlations reflect causation? This article encourages researchers to pay close attention to these facets of supervised learning applications, increasing their rigor even as they employ cutting-edge algorithms.
Footnotes
Declaration of Conflicting Interests
The author declares no potential conflicts of interest with respect to the research, authorship, and/or publication of this article.
Funding
The author received no financial support for the research, authorship, and/or publication of this article.
Author
KYLIE ANGLIN is an assistant professor in research methods, measurement, and evaluation at the University of Connecticut. Her research leverages machine learning and natural language processing to advance research methodologies.