
Abstract
In 2018, a wave of educator strikes called Red for Ed swept through several states. Educators in Arizona won additional funding from the state legislature, supposedly for teacher salaries, which school boards could spend as they chose. This article quantitatively examines the participation and results of the 2018 Arizona educator strike, using this example to speak to theoretical work on types of union activity. I find that after the strike, per-pupil funding, teacher salaries, and student support staff salaries all increased. However, poststrike funding was added to Arizona’s preexisting funding formula, which advantaged the small, rural, predominantly White districts whose educators were less likely to go on strike. Educators who went on strike (often from large, urban districts with low property wealth) thus received less money for their districts and smaller raises than nonparticipating educators. This raises important concerns about how free riders can affect different types of union organizing.
Keywords
Introduction
In the spring of 2018, public schooling came to an abrupt halt for 800,000 Arizona students in a historic statewide educator strike. My fellow educators and I marched on the capitol for a week as part of the Red for Ed movement, a wave of educator activism that sprung up in an unlikely group of conservative states with weak unions, including West Virginia, Oklahoma, Kentucky, and Arizona. Red for Ed is well known for prompting statewide strikes with an emphasis on gaining increased education funding and teacher salaries. These strikes framed themselves as an attempt to fight back against austerity politics that had kept school funding and teacher salaries low in many states for a decade since the Great Recession (Allegretto, 2020; McCartin et al., 2020).
However, Arizona does not perfectly fit into the broader Red for Ed narrative of statewide strikes focused on teacher salary. While West Virginia, which started the strike wave, famously shut down the school districts associated with all 55 counties (Catte et al., 2018), large portions of Arizona schools and educators did not participate, challenging the conception of the strike as fully statewide. Unlike West Virginia, Oklahoma, and Kentucky, Arizona does not have a statewide teacher salary schedule (Henig & Lyon, 2019). Therefore, while the Arizona strike has often been described as ending in a teacher salary increase (Blanc, 2022; Flaherty, 2018a; Leachman & Figueroa, 2019; Snow & Tang, 2018; Strassfeld & Strassfeld, 2020), the passed legislation only increased per-pupil funding, giving school boards full discretion on how to spend the additional dollars (Education Budget Reconciliation, 2018; Randazzo & Ruelas, 2018; Ruelas, 2018; Wells, 2019). To my knowledge, this article is the first to examine who went on strike in Arizona and how the additional money was spent.
Previous work has studied how the 2018 Red for Ed movement arose and succeeded in such hostile territory. Scholars have examined how Red for Ed was inspired by the 2012 Chicago Teachers Union strike and the Bargaining for the Common Good Movement (Bruno & Ashby, 2020; McCartin et al., 2020). Some scholars have focused on the gendered aspects of the movement, given that teaching is such a feminized profession and teachers’ care for their students has been weaponized against their activism (Hanrahan & Amsler, 2022; Huget, 2020; Russom, 2020). The use of social media as an organizing tactic has received particular attention, given the centrality of Facebook groups to the strikes (Blanc, 2020a, 2022; Sikes, 2021). In Arizona specifically, Eric Blanc’s analysis credits the movement’s success to organizers using social media to build an intensive on-the-ground network, an experienced core of militant leaders that pushed for aggressive labor action, and productive collaboration between Red for Ed and the state’s teachers union (Blanc, 2019, 2022). Noah Karvelis, current academic and previous leader in Arizona Red for Ed, attributes the movement’s early success to its ability to exist outside the state’s typical political sphere (Karvelis, 2020).
These works have been instrumental to our growing understanding of how these teacher labor movements were organized and the reasons for their success. This article adds a quantitative lens that can enhance this rich qualitative work by examining what that success was and who benefited from it the most, by systematically examining (a proxy for) participation across the state and examining the strike outcomes. Specifically, I ask:
Which (kinds of) school districts participated in the Red for Ed strike in Arizona, for how long?
What was the effect of the strike on financial outcomes educators referenced in their demands? To what extent were demands met?
Were participating districts more likely to allocate funds towards strike demands?
Literature Review
Teacher Labor Movements
At the time of the Red for Ed movement, about 70% of public school teachers were a member of a teachers union (National Center for Education Statistics, 2018), typically a local affiliate of the National Education Association or the American Federation of Teachers. These unions advocate for teachers at multiple levels of government, from bargaining with districts to lobbying at the state and federal levels for legislation supported by members (Cowen & Strunk, 2015). However, these unions and teacher labor action broadly have long been controversial. While private sector labor disputes typically only consider the interests of workers and employers, public sector work involves public interests that are not necessarily represented at the bargaining table. In the case of teachers unions, the public has a pressing interest in education being effective and efficient (Malin, 1993). Thus, the central controversy of teachers unions is whether they improve the education system as a whole, only help teachers at the expense of students, or something in between (Cowen & Strunk, 2015; Lyon, 2021). Critics of teachers unions have pointed out that they typically seek out benefits for their members like higher pay and job protections that constrain the ability of administrators to help students (Moe, 2011). On the other hand, supporters of teachers unions point out that, by providing teachers with a voice, unions can support the development and retention of quality teachers and improve student learning conditions (Bascia, 2018; Weiner, 2012).
Prior work on the effect of teachers unions has been similarly mixed. Cowen and Strunk, in their 2015 review, found that stronger unions typically increase district spending and teacher salaries but found no consistent effect of teachers unions on student outcomes. Since this review, further work continues to defy easy answers with mixtures of negative, neutral, and positive effects of unions on student outcomes (Baron, 2018; Han & Maloney, 2021; Marianno & Strunk, 2018; Matsudaira & Patterson, 2017). I would argue that higher teacher salaries without hurting students is a positive finding, given that teachers are paid less than similar workers (Allegretto, 2020; Allegretto & Mishel, 2016) and that high teacher salaries can keep teacher turnover low (Clotfelter et al., 2008; Falch, 2011; Hendricks, 2014). Still, these findings are mixed, likely as a consequence of the difficulty in estimating the causal effects of teacher unionization as well as the variety of teachers unions. Unions with different members in different contexts have different goals, priorities, resources, and methods, so are likely to have different effects on schools and students.
Labor scholars often use a typology of union structure and behavior that they hypothesize leads to different results. Under a business unionism model, the union provides services like contract negotiation, job security, and legal support with grievances in return for dues (Dandala, 2019; Ross, 2007; Weiner, 2012). Union leaders are trusted with the direction and running of the union, while members pay dues and occasionally vote on leaders. Business unions focus exclusively on their members’ immediate concerns, which they enact through formalized contract negotiations and involvement in electoral politics (Dandala, 2019; Ross, 2007; Weiner, 2012). Social movement unionism (also called social justice unionism) is a different model in which the union itself is more democratic, with an engaged rank-and-file and broad leadership base rather than a small, disconnected leadership (Ross, 2007). Social movement unionism works to advance societal interests beyond its members (Fairbrother, 2008; Robinson, 2000; Weiner, 2013), which, for teachers unions, often means the interests of students and parents. These interests are addressed through formal or informal community bonds (Fairbrother, 2008; Moody, 1997b; Ross, 2007).
These models represent an overly simplistic view of unions, as any individual labor organization or movement will have a combination of motivating stories, goals, and tactics that can draw on different models of unionism (Ross, 2007). For example, unions can secure victories for the entire working class while providing key services to members, and social justice unions still address members’ immediate concerns like wages and working conditions (Dandala, 2019; Strassfeld & Strassfeld, 2020). Still, the repertoire of tactics, discourses of union purpose, and forms of internal organizations laid out by these frameworks can be helpful ways to understand how unions work (Brooks, 2017; Stanford, 2021).
Many scholars have studied social movement unionism within teachers unions specifically. Advocates point out that social movement teachers unions are best positioned to address broader issues they see in public education including chronic underfunding, the use of market logics in schools, and school segregation (Dandala, 2019; Strassfeld & Strassfeld, 2020; Weiner, 2012). Additionally, many have posited social movement unionization as a way to address the free rider problem, or the tendency of employees to not participate in labor unions when they can still benefit without participation (Pierson, 2018; Strassfeld & Strassfeld, 2020). After Janus v. AFSCME (2018) outlawed charging agency fees for nonmembers, social movement unionism’s tactic of building broader coalitions with parents, students, and other community groups emerged as a promising solution to the issue of free riders (Pierson, 2018; Strassfeld & Strassfeld, 2020). Prior work has analyzed the activism of teacher social movement unions in New York City (Weiner, 2013), England (Stevenson & Mercer, 2015), British Columbia (Rottmann et al., 2015), and North Carolina (Johnson, 2017), to name a few. Red for Ed itself has also been posited as the latest example of teacher social movement unionism (Dyke & Muckian Bates, 2020), but other studies have pointed out that Red for Ed in at least one state existed between multiple models of unionism (Kurtz & White, 2022).
Understanding that different models of unions employ different strategies, elevate different actors, and move towards different goals has prompted key questions about Red for Ed. Studying participation patterns can help shed light on the breadth of the coalition and the extent to which educators were responding to immediate financial concerns or more expansive educational issues. Studying the outcomes can shed light on the extent to which Red for Ed succeeded in making broad changes for the common good.
School Finance and Teacher Labor
Schools receive funding from federal, state, and local sources: Federal money often takes the form of specific grant funding focused on disadvantaged students, local funding originates from property taxes, and state funding usually focuses on providing additional funding to districts with lower property wealth (Wong, 1999). The role of the state legislature in school funding and school governance has been expanding since the 1970s and 1980s (Henig, 2013; Wong, 1999). This larger legislative role has changed the landscape of teacher union activism. Teachers unions have been quite powerful with school boards, which are very responsive to teachers unions’ focused attention and expertise (Henig, 2013). However, state legislatures must balance more competing interests, potentially diluting the influence of teachers unions (Henig, 2013).
Political involvement at different levels of control of the school system also invites more complexity in the implementation of the policy. Teachers unions have typically bargained with or struck against local school boards, where they can directly sign off on an agreement with key stipulations on wages, hours, class sizes, evaluations, and other important working conditions (Strunk et al., 2018). In contrast, negotiation with the state legislature invites more complicated policy implementation stages wherein the negotiated legislation is interpreted by local actors, who could be more or less sympathetic to union goals (Moffitt et al., 2023). These multiple levels of policy can open up opportunities for labor activism: For example, higher teacher salaries for teachers in a given district can be won either by convincing the school board to redistribute existing funds, by convincing the state legislature to increase overall funding, or by convincing the state legislature to change funding formulas to better benefit their individual district. These different policy landscapes might prompt teacher labor movements to adopt strategies from different models of unionism, which can impact the extent to which labor movements meet their goals.
Red for Ed in Arizona
Education in Arizona
Arizona’s roughly 1 million students are diverse, with the two largest groups being Latine students and White students, at about 45% and 38% of the student population, respectively, at the time of the strike. The next two largest groups are Black students and Native American students, who each make up about 5% of students. This Native American population is relatively high for the continental United States, and over 25% of the state’s land is reservation land (Shumway, 2015; Tribal Homelands in Arizona, n.d.). Arizona’s roughly 2,500 schools include 20 schools operated by the Bureau of Indian Education, 34 schools controlled by Native American tribes, and over 500 charter schools.
Arizona schools spent $9,057 per pupil in 2017–2018, compared to a nationwide average of $13,545 (National Center for Education Statistics, 2023). The state contributes to schools by calculating the amount it expects schools to spend using an enrollment count weighted by student need and teacher experience, calculating the expected local contribution using local property wealth and a standard tax rate, and paying the difference (Arizona Association of School Business Officials, 2017). These enrollment weights provide additional money for mileage traveled, for small isolated school districts, for each student with a disability, each English language learner, and each gifted and talented student, but notably not for each student eligible for free or reduced-price lunch (EdBuild, 2023).
Arizona teacher salaries are also well below the national average. In 2015, Arizona teachers experienced the largest wage penalty of all teachers in the United States, earning about 63% the weekly wages of other college-educated workers in the state (Allegretto & Mishel, 2016). As a consequence of these low salaries, Arizona has suffered from persistent teacher shortages, with yearly reports leading up to the strike showing high turnover and many teaching positions left unfilled or filled by underqualified individuals (Recruitment & Force, 2015; Sutcher et al., 2019; Tirozzi et al., 2014).
Building Up to the Movement
The 2018 Red for Ed movement began in West Virginia with educators striking for pay increases for all public employees in the state (McCartin & Sneiderman, 2020). On March 2nd, in the midst of the West Virginia strike, Arizona teacher Rebecca Garelli started a Facebook group that would grow into Arizona Educators United (AEU), a major grassroots organizer of the strike. AEU worked with the state’s teacher union, the Arizona Educators Association (AEA), sharing financial and organizational resources. AEU built a network of site liaisons at individual Arizona schools while gradually escalating tactics: Active Arizona educators began by wearing red and posting information on social media, then hosted walk-ins where activists met with parents in the morning before school to explain the movement (Garelli, 2020).
Karvelis (2020) argued that because AEU was a new organization, it was not limited by prior patterns set by the AEA. AEU was driven by rank-and-file teachers, who participated as site liaisons and on social media (Blanc, 2020a). The walk-ins and social media engagement also allowed the movement to reach beyond both union and nonunion educators to connect with parents and other community members (Garelli, 2020). There was a commitment to addressing Arizona’s diverse and multilingual population, as Red for Ed signs were consistently printed in English and Spanish, and Native educators started a “Rez for Ed” movement with the goal of addressing their schools’ and students’ unique needs (Blanc, 2019; Cázares-Kelly, 2019). Despite this progressivity, the movement positioned itself as apolitical (Blanc, 2019). There was a strong sense that Arizona was not ready for more progressive action (Karvelis, 2020), and the movement was even attacked because of leader Noah Karvelis’s previous writings on antiracist teaching (Blanc, 2019). Additionally, the movement’s radical potential as a new social movement did lessen as the movement grew in strength (Karvelis, 2020). Growth facilitated a shift towards more top-down decision-making, which created some distance from the rank-and-file (Karvelis, 2020). The alliance with AEA provided organizing resources but also allowed the more conservative AEA to have influence over decision-making (Blanc, 2019).
Due to the influence of strikes in West Virginia and Oklahoma, educators in the AEU were pushing for a strike from the beginning, but they met with resistance on multiple fronts. While Arizona did not have a law specifically banning teacher strikes, the state superintendent pointed to a 1971 attorney general opinion to argue that the strike was illegal and striking could result in losing teaching licenses 1 (Arizona News, 2018; Lindstrom, 2018). In the media, teachers saw warnings that the strike would fail (Roberts, 2018), arguments that the strike would harm students (Valdez, 2018), and constant reminders that organizer Noah Karvelis was a socialist (Syms, 2018). There was also resistance from within the AEA, which preferred to use the momentum of Red for Ed to support certain political candidates (Blanc, 2019). However, the AEU had enough grassroots momentum and enough support from progressives inside the AEA that they were able to push for a strike vote (Blanc, 2019). Though AEA was extremely hesitant to move towards a strike, their resources also made the strike possible. Ultimately, Red for Ed movement needed to use both grounds-up organizing in the vein of social movement unionism and the resources of a preexisting embedded business union in order to organize the strike.
The Demands and the Strike
In the lead up to the strike, Governor Ducey proposed a “20 by 2020” plan that promised to increase teacher salaries 20% by 2020. This included a 9% raise the year after the strike, two more 5% raises in the following years, and a preexisting 1% raise from the year before the strike—for a total of 20% by the 2020–2021 school year 2 (Office of the Governor, 2018). Teachers were not mollified because the proposed raises were too spread out, the promises were not set in stone, and the proposed funding came from cuts to welfare services.
On April 19, 2018, educators voted 78% in favor of a walkout (Goldstein, 2018). On April 26th, participating educators left their schools and marched on the capitol in 95 degree heat, joining supporters to form a crowd of about 50,000 (Woods, 2018). Educators maintained a presence both outside the capitol building and within legislative sessions, pressuring the Arizona house and senate to meet the AEU’s five demands, which were created through Facebook polls and ratified during the walkout (Garelli, 2020). Educators demanded
immediate 20% salary increases for teachers,
a return to 2008 funding levels,
competitive wages for support staff,
yearly raises until Arizona teacher salaries reached the national average, and
no new tax cuts until Arizona’s per-pupil spending reached the national average (Garelli, 2020; “What Are Arizona Teachers’ 5 Demands?” 2018).
Striking educators framed these demands in terms of helping students, using the argument that an investment in teacher salaries would keep great teachers in the classroom, but these are still traditional labor demands centered on pay. This indicates a mix of “both broad and narrow” reasons for the strike that blends multiple forms of unionism (Kurtz & White, 2022, p. 20).
My Role as a Strike Participant
Although acknowledgments of positionality are less common in quantitative than qualitative research, the growth of more critical approaches within quantitative research has brought attention to the importance of reflecting on how quantitative researchers’ identities and experiences influence their work (Jamieson et al., 2023; Tabron & Thomas, 2023). This work is informed by my own participation as a high school teacher in the Red for Ed strike in Arizona. While there could be concerns about bias, which I address by triangulating my memories with other firsthand accounts, using feedback from colleagues, and critical self-reflection, I view this experience as an asset. For example, my school stayed open throughout the strike, which sparked both my interest in strike participation patterns and the use of school closures to proxy for strike participation (explained further below). My personal involvement in debates over different budget proposals prompted me to dig deeper than the common narrative that the increased funding went to teacher salaries. While my work relies mostly on publicly available data to answer my research questions, my experiences informed which questions I asked, what data I collected, and my discussion of results.
Data
This study leverages a unique district-by-year dataset combining publicly available data with data that I collected. I use National Center for Education Statistics (NCES) data for information on district enrollment, demographics, staff, and finances from the F-33 district finance survey. I combine NCES data with data on district finances and teacher qualifications from the Arizona Department of Education. The longitudinal data set stretches from the 2005–2006 school year to 2019–2020, including 2 years of poststrike data while avoiding the many complexities resulting from the COVID-19 pandemic in the following years. Unfortunately, financial data only include state-run school districts, leaving out charter districts and many reservation districts run by Native American tribes or the Bureau of Indian Education. The final source of data is school closure data that I collected, explained in the next section.
Strike Participation
As the walkout was presumed illegal, data on teacher strike participation is difficult to find. I therefore proxy for strike participation using data I collected on whether schools were open for instruction during the walkout, as districts were forced to close schools when they lacked the staff necessary to safely operate. Even though school closure is nominally a school-level variable, I gathered closure data at the district level in order to keep data collection manageable and correspond with finance data. A district is considered closed, and thus participating in the strike, if it closed at least one school for instruction.
I collected information on strike closures from archived news articles (12News, 2018; abc15.com Staff, 2018; Cano, 2018a, 2018b; KTAR Newsroom, 2018a, 2018b, 2018c, 2018d), press releases, and social media posts from the time. When those were not available, I reached out to district leaders by phone or email to inquire about their history. Using these methods, I gathered closure data for 84% of traditional districts in the state, representing 98.5% of Arizona’s public-school enrollment. Further information about the school closure data and repeated analysis using only online sources can be found in Appendix A in the online version of the journal.
For Research Question 1 (RQ 1) (which districts participated), I examine overall patterns of school closure across the 6 school days from April 26 to May 3. For RQ 3 (using strike participation as a predictor of poststrike outcomes), I model strike participation with a binary variable indicating whether at least one school in a district shut down for at least 1 day during the strike. This creates a more interpretable coefficient and avoids the difficulty of comparing school shutdown patterns in districts with 4- and 5-day weeks.
Outcome Measures
Four district-level outcome measures were chosen to correspond to Red for Ed’s five demands, according to the crosswalk shown in Table 1. Two demands relate to teacher raises, which are represented with average teacher salary. For the demand that Arizona return to 2008 funding levels, I consider both per-pupil district revenue from the state (the direct effect of the funding bill that ended the strike) and total per-pupil expenditures (how much districts are spending overall). For support staff salaries, I use the student support staff category in the NCES data, which includes attendance, social work, guidance, health, psychology, speech pathology, and other student support. Districts are excluded from this analysis in years that they do not employ any of these workers. Red for Ed’s final demand to stop cutting taxes until per-pupil spending reached the national average is beyond the scope of this article.
Crosswalk of Red for Ed Demands and District Outcome Measures

Note. Red for Ed demands were created on the Facebook group for Arizona Educators United and ratified by vote during the strike.
Both teacher and support staff salaries are calculated by dividing the total amount paid in salaries in those categories by the total full-time equivalent (FTE) of employees. For support staff salaries, the small number of employees and larger proportion of part-time employees results in impractical averages during Great Recession years (2009–2010 to 2011–2012), so I start my analysis for that outcome in 2012–2013. Further detail about the teacher salary measure is in Appendix D in the online version of the journal.
For all outcomes, I create measures both with and without inflation adjustments. Raw numbers can more easily be compared to political statements of the time, In particular, the “20 by 2020” plan likely meant a 20% raise in nominal wages. However, adjusted numbers, given in 2020 dollars, better represent the experiences of schools and employees. For this reason, I use both raw and adjusted dollars for RQ 2 and focus only on adjusted dollars in RQ 3.
Methods
For RQ 1, I construct descriptive tables, figures, and maps showing varied school shut down patterns across districts across the six school days of the strike from April 26th to May 3rd.
For RQ 2, I perform multiple analyses. First, I use a synthetic control method to compare key outcome measures in Arizona to a synthetic Arizona with similar prestrike trends (Abadie et al., 2010). This synthetic Arizona is created by pulling from a pool of all states that did not experience Red for Ed strikes and selecting and weighting states in order to minimize differences in pretreatment outcome and other matching variables (here, average school size in the state and percentage of the state’s students that are students of color). If we can assume that the synthetic Arizona’s post-2018 outcomes represent what would have happened in the absence of the strike (a more reasonable assumption if the pretrends look very similar), the difference between Arizona and synthetic Arizona represents the causal effect of the strike. However, as is explored further in Appendix B in the online version of the journal, this method is not effective for all outcome measures because for some outcome measures, no combination of untreated states looked sufficiently similar to Arizona.
I additionally graph outcome measures over time compared to educator demands for RQ 2. While this is a weak causal method because I have no way to estimate how these outcome measures would have differed if the strike had not happened, I can still compare how spending changed after the strike to prestrike trends and educator demands.
For RQ 3, I conduct difference-in-differences (DiD) analyses to explore whether each outcome measure changed after the strike differentially in participating and nonparticipating districts. Though DiD is typically used to draw causal inferences, in this study I use the method for descriptive purposes. Unlike the previous RQ, the goal here is not to find out the effect of the strike but to compare how this impact might have been felt differently by different districts. I use the following model, shown for average teacher salary in a district, with similar models run for all outcome measures.

This predicts the average teacher salary in district d and year y. The variable
The available data are at the district-year level, which might raise concerns about representativeness and heteroskedasticity. Results for RQ 2 are weighted, results for RQ 3 are both weighted and unweighted (with only unweighted figures shown). Further information about weighting choices and alternative figures are shown in Appendix C in the online version of the journal.
Results
RQ 1: Who Participated in the Walkout?
Participation Over Time
The walkout lasted from Thursday, April 26th through Thursday, May 3rd, for a total of 6 potential days of school closure (5 for the many Arizona districts with 4-day weeks). As shown in Figure 1, district locale was a strong predictor of school closure. The strike was driven by participation in city and suburban districts (95% of which closed for at least 1 day), while rural and town districts were much less likely to participate. Several districts reopened throughout the strike: 50.3% of known districts had at least one closed school on the strike’s first day, but only 30% of districts had a closed school on the strike’s final day.
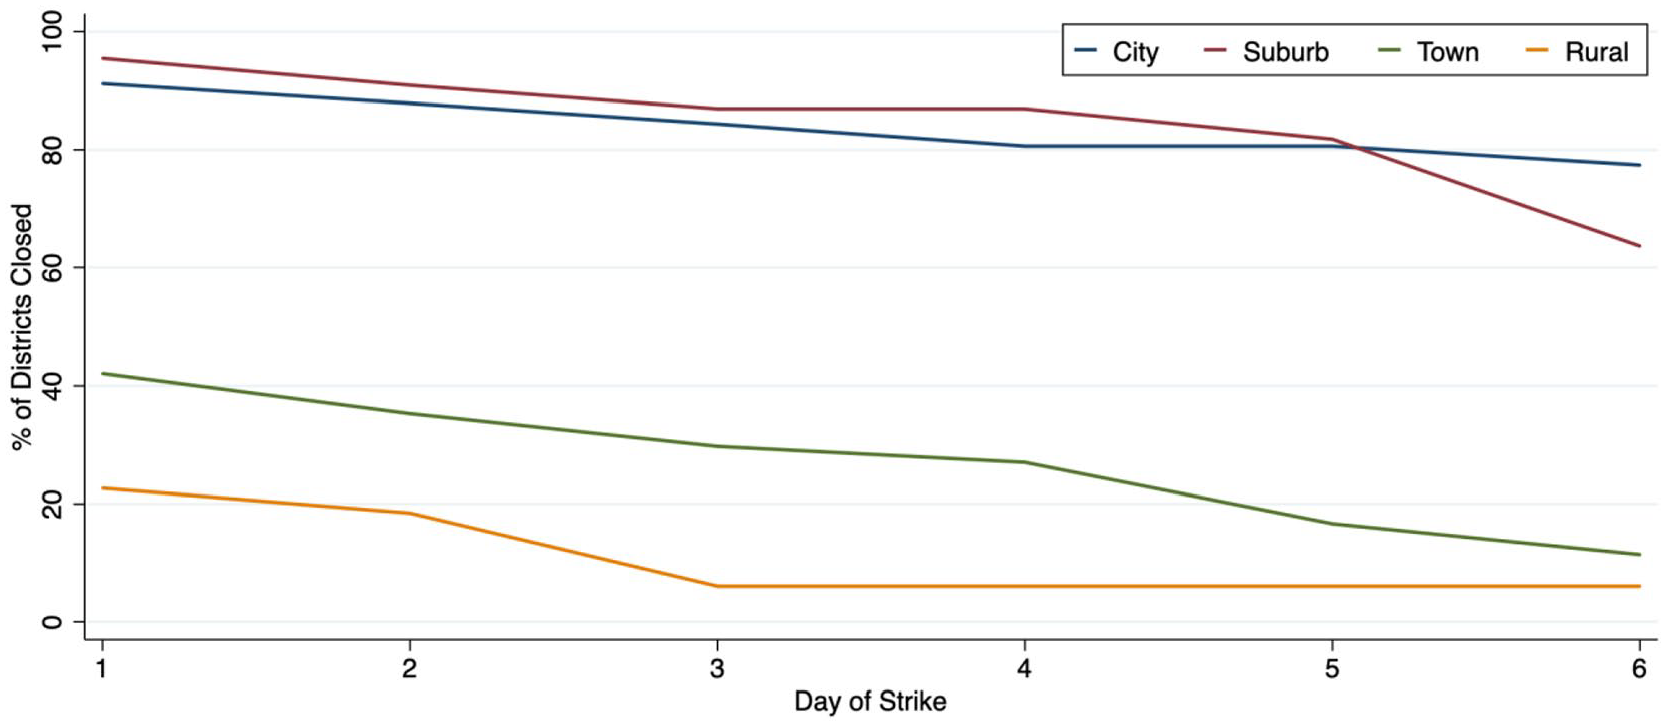
Strike participation over time, by locale.
Regional Participation
While the strike was statewide, actions were centered in Phoenix. Educators did not picket their schools but instead marched on the capitol and sat in on legislative sessions.
The most distant educators were a 6-hour drive from the capitol, so participation was highly regional. Strike participation by district, mapped in Figure 2, shows that districts closest to Phoenix were the most likely to participate, with more distant districts less likely to close schools. The figure shows spikes of participation in urban centers of Tucson, Flagstaff, and Yuma and higher participation along Interstate 10 (I-10) and I-17, major highways connecting Tucson and Flagstaff to Phoenix. This offers evidence that the additional burden of traveling may have dissuaded many educators from the rest of the state, but educators with easier access to the city were more likely to participate.

Strike participation by district.
Characteristics of Participating Districts
Table 2 compares many different aspects of districts with different school closure patterns. District size and locale are strong predictors, with larger and more urban districts much more likely to close than smaller and more rural districts. Some of the patterns by student race are likely related to the clear patterns by locale, as more urban districts were more likely to have more Latine and Black students and less White students. The pattern with Native American students is unusual, as the proportion of Native American students is highest for districts that closed for 1 or 2 days. If schools are separated by locale, this difference becomes stark: Rural schools tended to stay open throughout the strike, except for rural schools serving large proportions of Native American students.
Characteristics of Districts by Their School Closure Patterns During the Strike
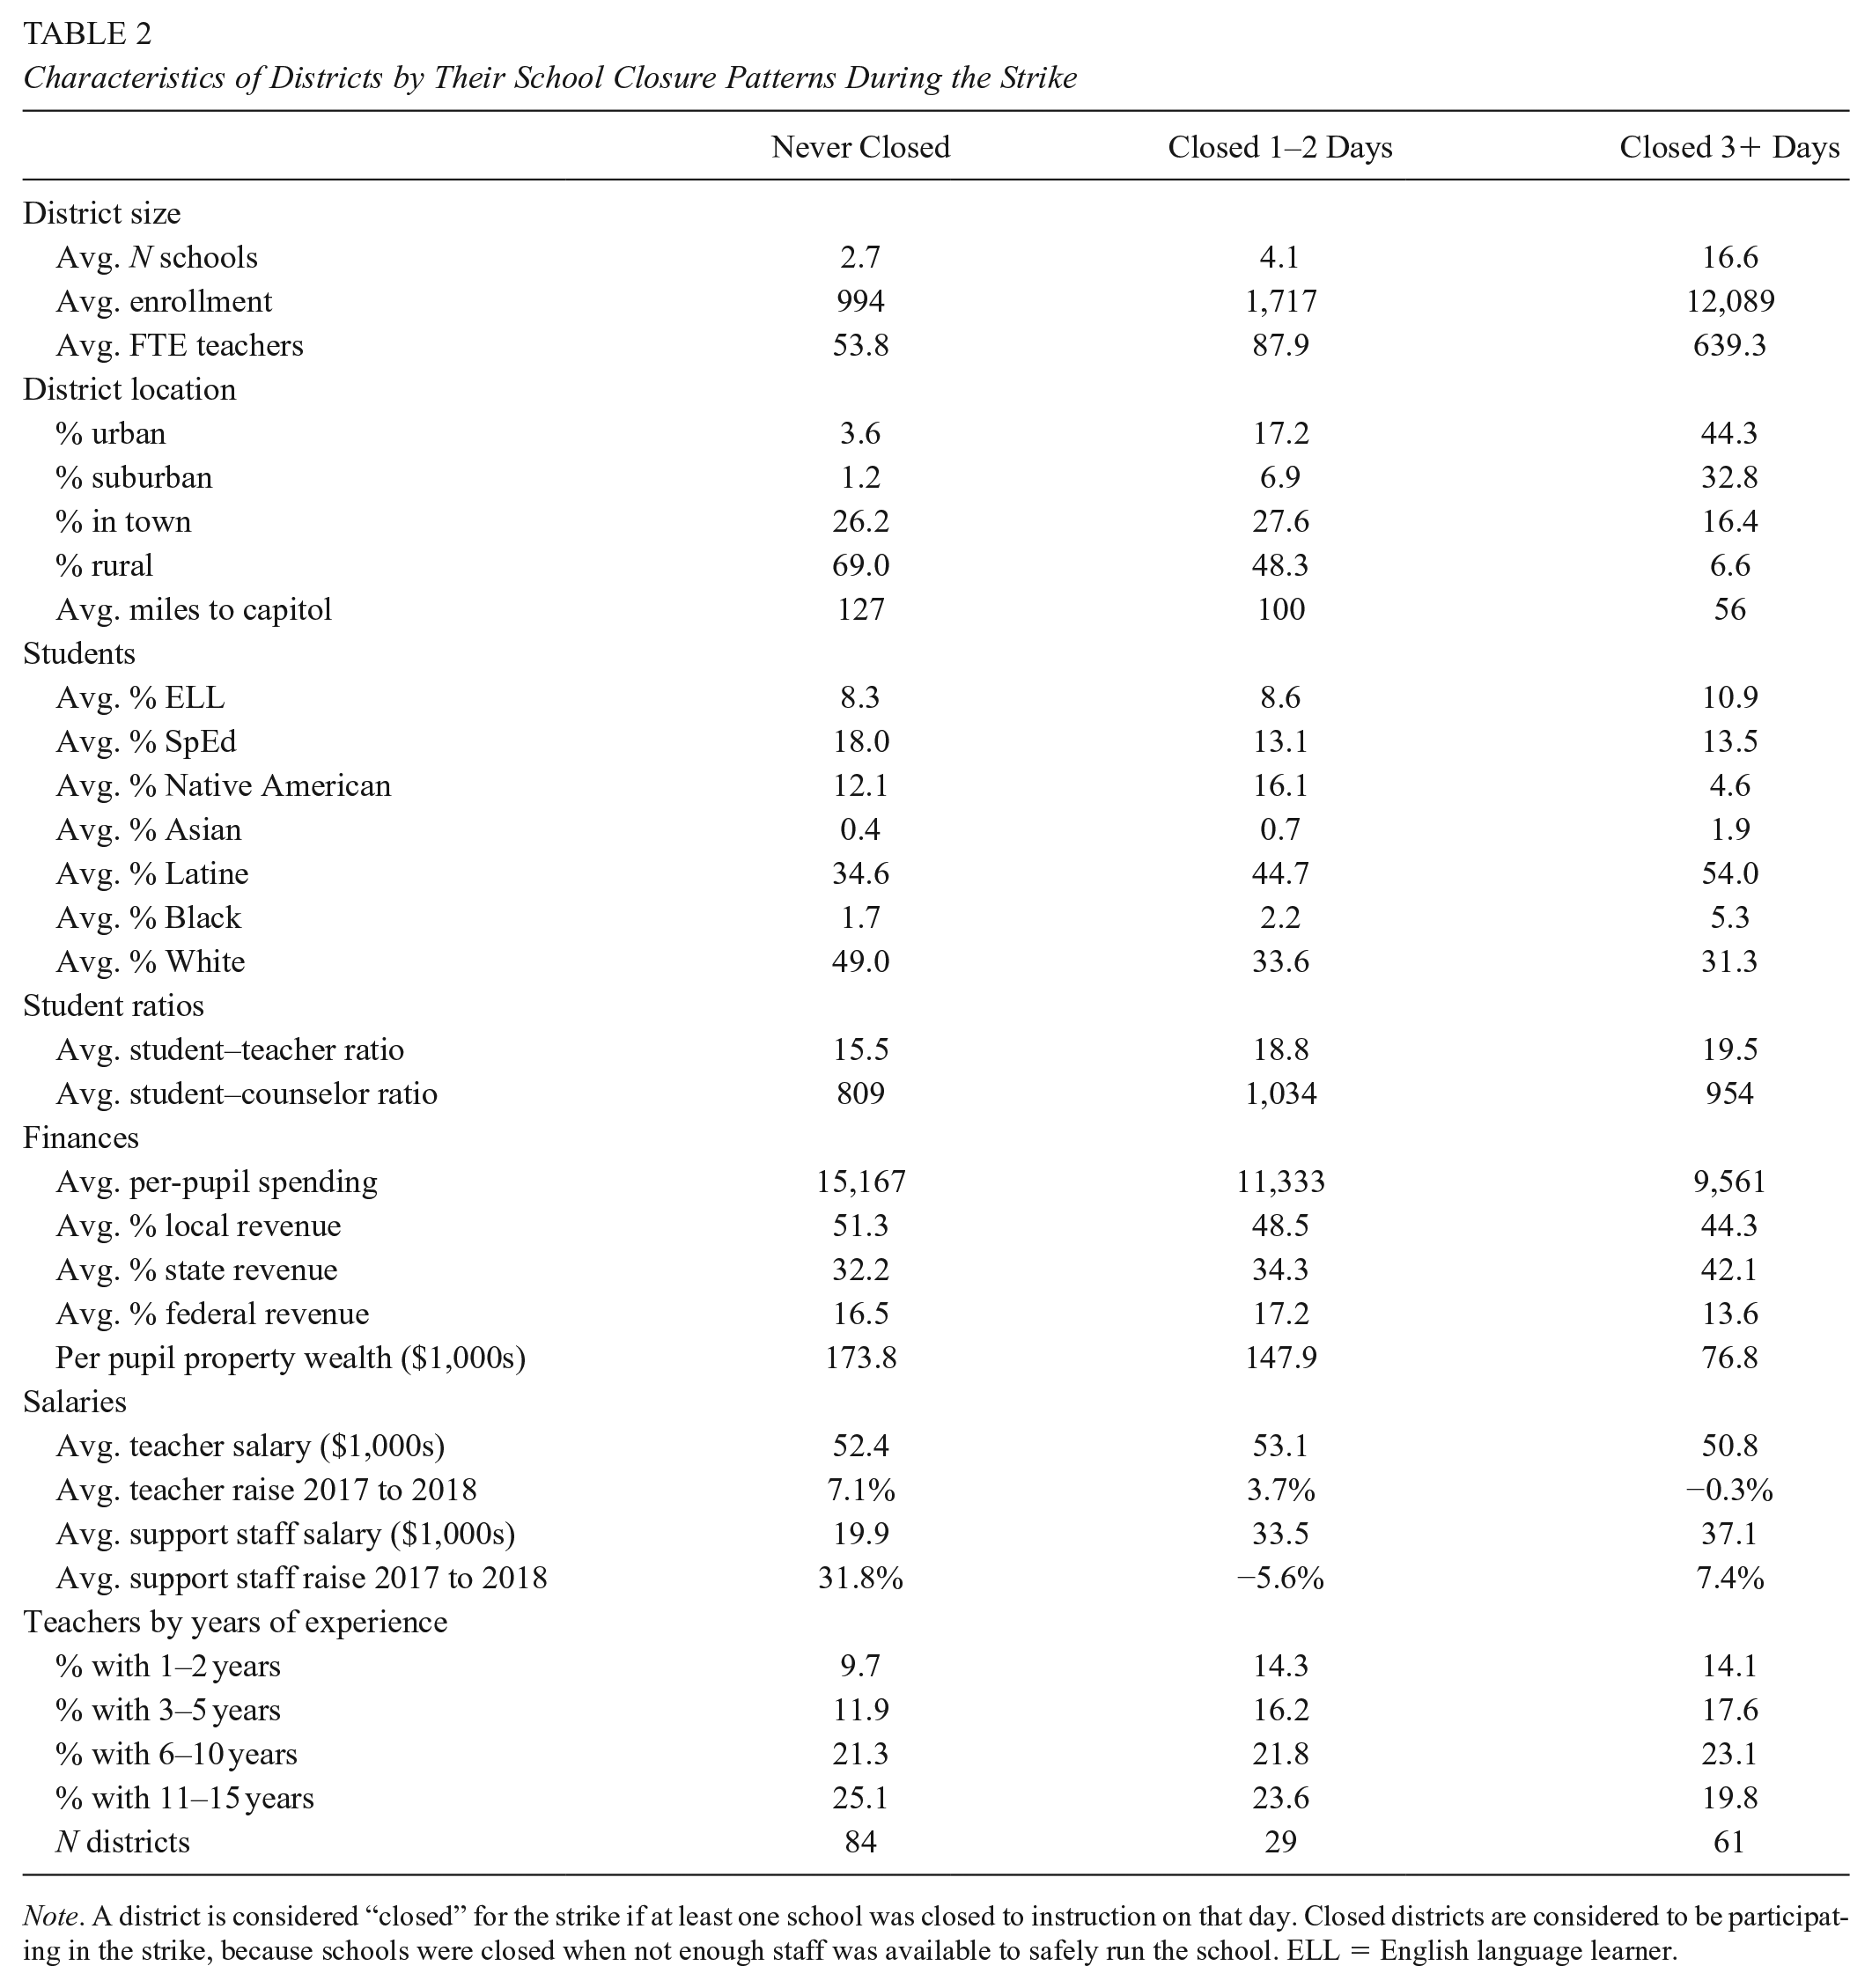
Note. A district is considered “closed” for the strike if at least one school was closed to instruction on that day. Closed districts are considered to be participating in the strike, because schools were closed when not enough staff was available to safely run the school. ELL = English language learner.
Financial data indicates that higher-need districts tended to participate more. Closing districts had lower per-pupil spending (a pattern that persists even after controlling for district enrollment), lower property wealth, and more dependence on state funding. Because state funding represents the difference between expected expenses and expected local contribution, these more dependent districts had higher need students, lower wealth, or both. Districts with lower teacher salaries were not necessarily the most likely to close and stay closed, but districts with slow-growing teacher salaries were more likely to participate. If teachers were going on strike in response to their salaries, it was likely in response to a lack of raises more than the level of salary. Similarly, support staff in lower-paid, high-raise districts did not go on strike, while higher-paid, low-raise support staff were in striking districts.
Teachers in participating districts were also less experienced. One possible explanation for this is that less experienced teachers are paid less by district salary schedules, so they were more likely to strike—but as stated above, that salary pattern is not as clear. It is also possible that these newer teachers were more likely to be younger and more politically progressive. Additionally, newer teachers may have been less intimidated by threats of firing or revoking their teaching license than veterans.
RQ 2: The Effect of the Strike on Demands
Funding From the State
Even though teacher salary is typically considered Red for Ed’s first demand, it is helpful to start with the most proximal outcome of the strike: the second demand, a restoration of education funding to 2008 levels. The strike ended with the passage of House Bill (HB) 2663, a new school funding bill that used the same overall funding formula using base student funding and multipliers but increased the base per-pupil funding amount by 7.5% and the per-mile student transportation multipliers by 2%. To calculate the size of this funding increase, HB 2663 used Ducey’s original 20 by 2020 plan, finding the per-pupil increase needed based on the average teacher salary, the number of teachers in the state, and the promised raise for 2019. Therefore, despite popular reporting of the strike conclusion as a 20% pay increase (Flaherty, 2018a; Leachman & Figueroa, 2019; Snow & Tang, 2018; Strassfeld & Strassfeld, 2020), HB 2663 is better understood as enough of a funding increase for the average teacher salary to be increased by 9%. Additionally, funding is increasingly weighted towards districts with higher transportation needs (typically rural districts).
Figure 3, which shows per-pupil revenue from the state over time, does show an increase in funding the year after the strike, but not necessarily higher than what would have happened without the strike. Figure 4 shows how per-pupil revenue from the state changed in Arizona compared to a weighted average of similar states (see Appendix B for more details on this method). Figure 4 shows a clear difference between Arizona and synthetic Arizona that only begins with the strike, which is marginally significant at a p < .10 level. However, these untreated states were not necessarily unaffected by Red for Ed. The p-value was high because the analysis found that untreated states like Arkansas and Mississippi also showed large divergences from their synthetic controls after 2018—but these states also had Red for Ed mobilizations, albeit smaller ones that were not full strikes (Harris, 2019; Menas & Litvinov, 2019). These states could have increased school funding in an attempt to avert a strike, as Governor Ducey attempted with the original 20 by 2020 proposal. Given that Red for Ed had broad impact nationally and the limitations of the synthetic control method, it is difficult to estimate a causal effect. I can only say that it is probable that the strike caused an increase in revenue. However, as Figure 3 shows, this revenue was still about $750 lower per pupil in 2020 than in 2008 (after accounting for inflation), indicating that striking educators likely made a change but did not fully accomplish their demands.

Per-pupil revenue from the state over time, compared to educator demands.
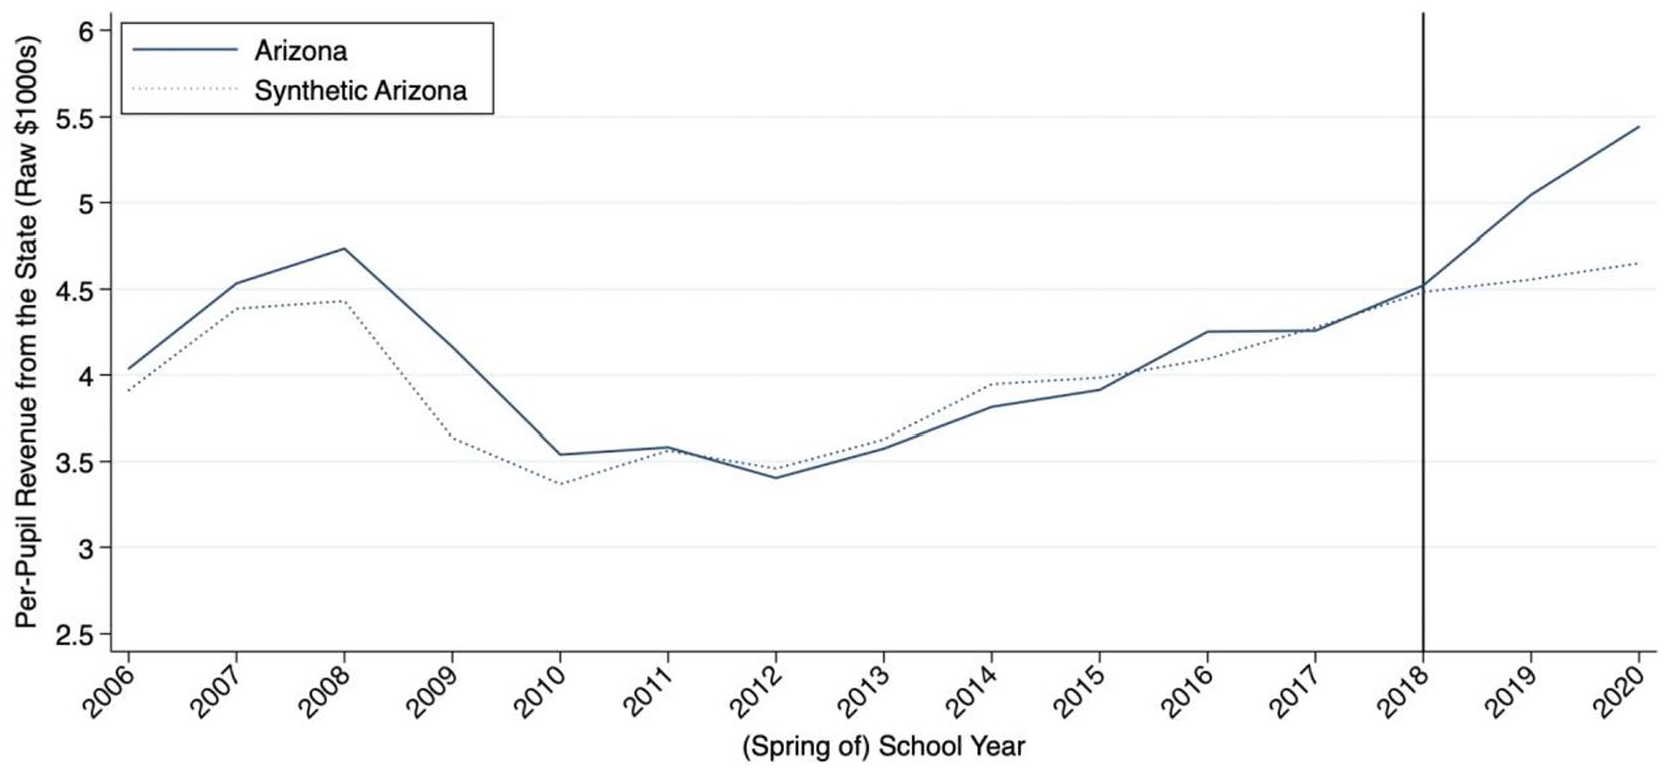
Synthetic control comparison of Arizona per-pupil revenue from the state.
Per-Pupil Expenditures
Educators did not just want a recovery of state revenue but also of total spending. Funding from federal or local governments could either contribute to or shrink the gap since 2008. Figure 5 shows that about each pupil in Arizona received about $1,100 less in 2020 than in 2008 (after accounting for inflation). Therefore, while about two thirds of the gap since 2008 was due to decreases in state funding since 2008, federal and/or local spending patterns were also contributing to the spending gap. State revenue increases in both 2019 and 2020, as shown in Figure 3, but Figure 5 shows that total per-pupil expenditures only increased in 2019. It is possible that local taxing effort may have been reduced after state aid was increased.

Per-pupil educational expenditures over time, compared to educator demands.
Figure 6, which compares per-pupil expenditures in Arizona to its synthetic control, supports this possibility. While per-pupil expenditures do seem to increase more from 2018 to 2019 in Arizona compared to the synthetic control, total spending slowed down from 2019 to 2020 in Arizona, allowing the synthetic control to catch up. There is no statistically significant difference between Arizona and the synthetic control after the strike (p = .29) for total expenditures. Again, the small number of poststrike years, the possibility of Red for Ed influence in comparison states, and the method make this causal inference tenuous, but it seems unlikely that there was any overall effect of the strike on total per-pupil expenditures. Funding did increase more between 2018 and 2019 than it had in many previous years, but still remained well below educators’ goals of a restoration of pre–Great Recession funding levels and likely no higher than it would have been in the absence of the strike.
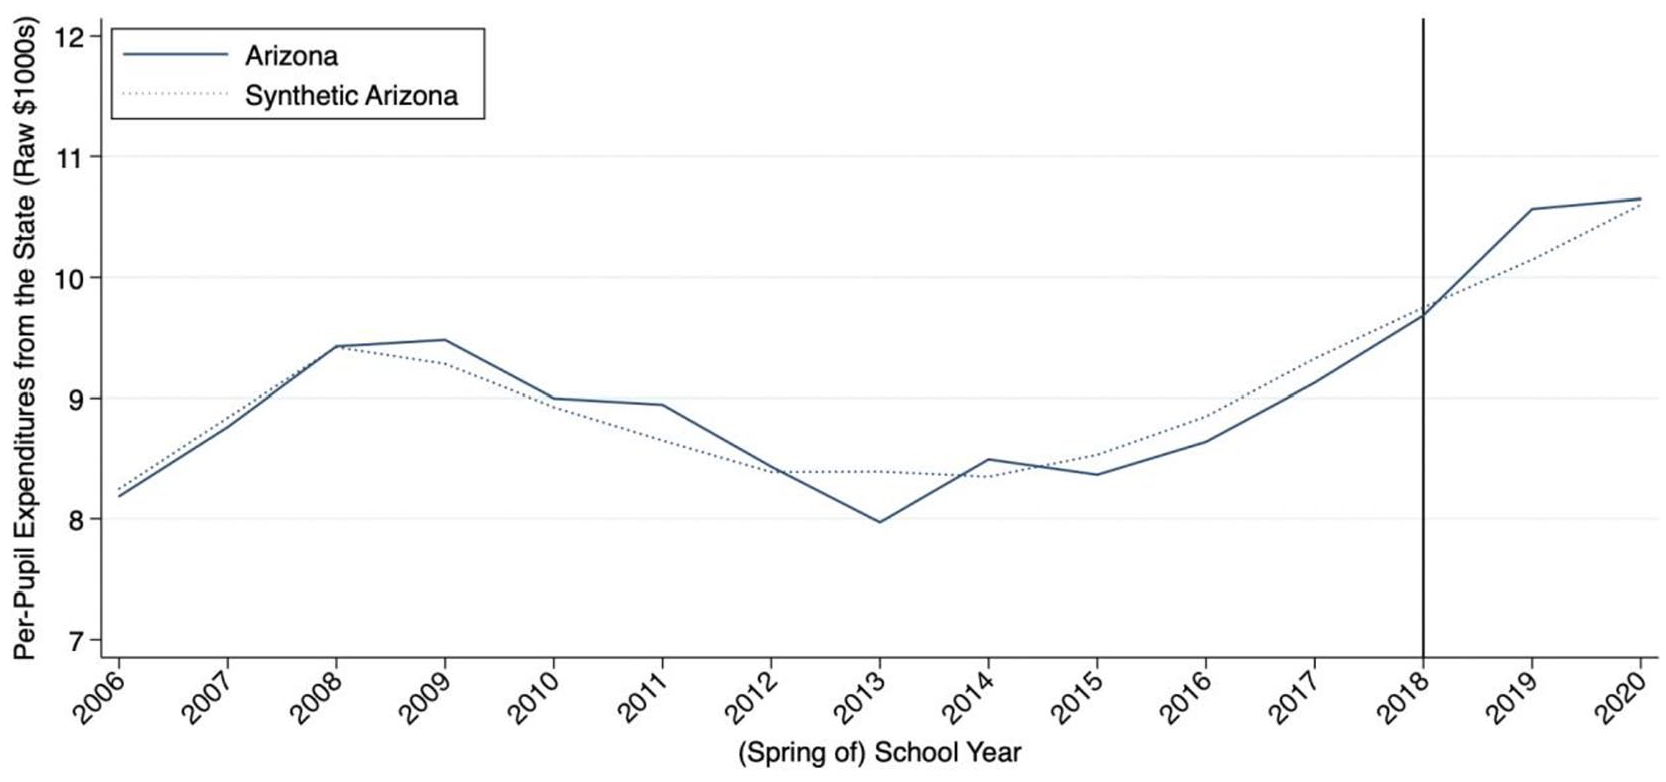
Synthetic control comparison of Arizona per-pupil expenditures.
Teacher Salaries
Striking educators asked for a 20% increase in salary with continued follow-up raises until teacher salary reached the national average (“What Are Arizona Teachers’ 5 Demands?” 2018). Figure 7 shows that neither demand is met. In 2020, 2 years after the strike, Arizona teacher salaries averaged to about $57,100, when a 20% raise from 2018 would be $61,800 and the national average was $64,200.

Average teacher salaries over time.
Teachers’ nominal salary increases do come close to Ducey’s more modest promises. From 2018 to 2020, Ducey promised 14.4% raises, and teachers received 11.2% in nominal salary increases (4.1% after accounting for inflation). Thus, the eventual salaries fell short of the 20 by 2020 plan, which was already a compromise with teachers’ demand for much larger raises. Unfortunately, because the synthetic control method was unable to find similar enough states to create a comparison group following Arizona’s pretrends (see Appendix B), I cannot evaluate whether the energy Red for Ed raised around teacher salaries likely caused teacher salaries to be higher than they might otherwise have been.
Support Staff Salaries
While no specific number was listed, educators wanted “competitive” salaries for support staff (“What Are Arizona Teachers’ 5 Demands?” 2018). Figure 8 shows that support staff salaries did increase from about $35,400 right before the strike to $37,200 in 2020 (after accounting for inflation), a 5.1% raise. However, average support staff salaries slightly decreased the year before the strike, so raises since 2017 are a much less impressive 1.4%. Depending on if one considers the context directly before the strike, support staff received a raise that’s either slightly smaller or slightly larger than teachers. Salaries are more competitive than they were before, but the lack of specificity in the demand and the lack of a valid synthetic control makes it difficult to say much more about support staff salaries.
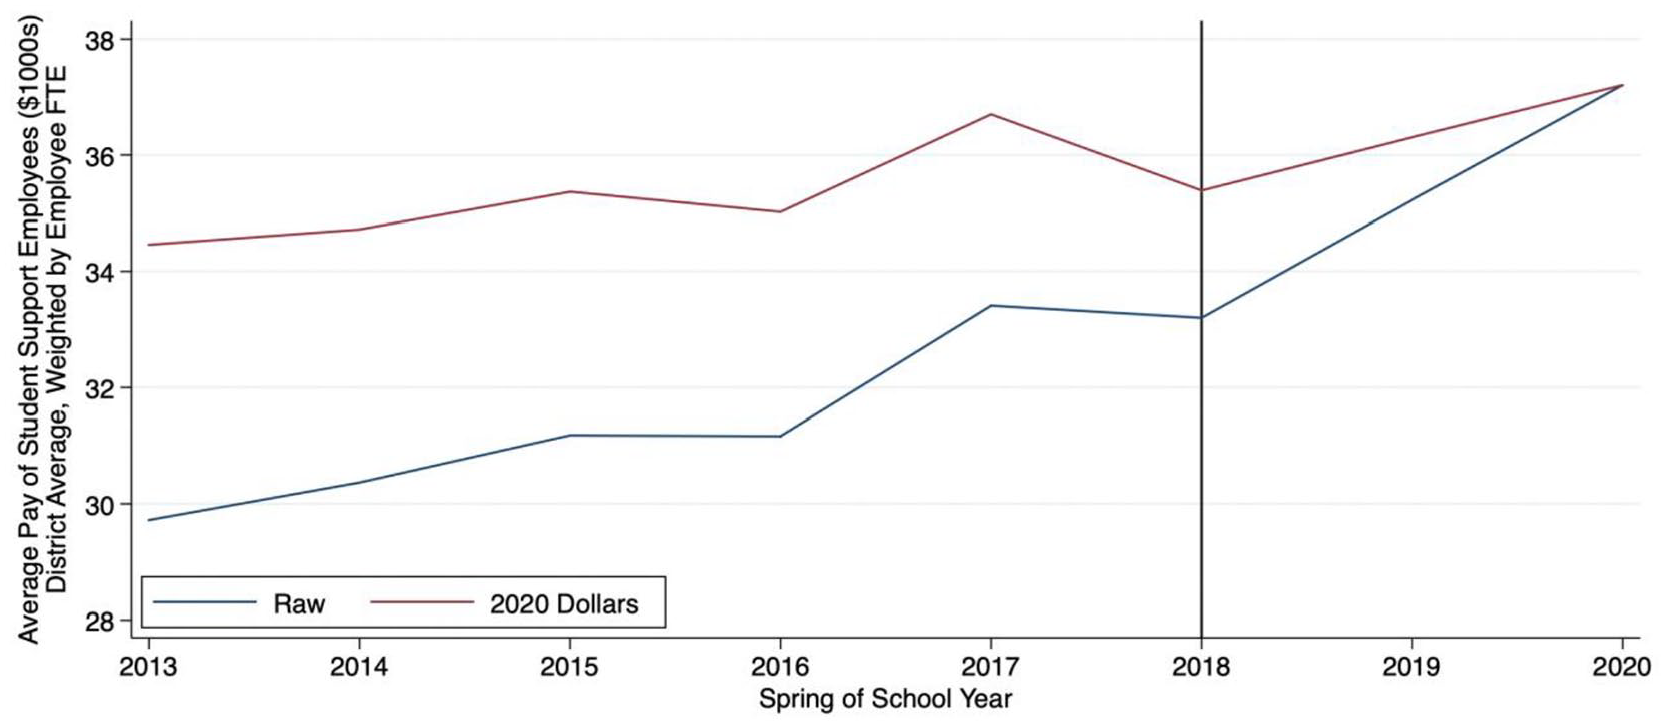
Average student support salaries over time.
RQ 3: Spending Changes in Participating and Nonparticipating Districts
Revenue and Expenditures
As previously mentioned, the bill that ended the strike increased the per-pupil base funding amount in Arizona’s state funding formula. Because funding depends on factors such as student demographics and teacher experience that differed by strike participation, the funding flows differently to participating and nonparticipating districts. Figure 9 shows per-pupil revenue from the state over time in districts that did and did not close schools for the strike, and Table 3 shows the more rigorous DiD model results for log-transformed revenue with and without weighting and covariates. Consistently across models, results show that participating districts’ state funding grew less after the strike than nonparticipating districts. This amount is practically significant (between 3% and 7% less growth, or between $65 and $360 less per pupil), but not statistically significant. Because nonparticipating districts were more likely to be rural, smaller, have more students on individualized education programs (IEPs), and have more experienced teachers, they were likely benefitting more from multipliers for high transportation needs, small schools, students with special needs, and experienced teachers.

Per-pupil revenue from the state over time by strike participation.
Difference-in-Differences Changes in Log-Transformed Per-Pupil District Revenue From the State

Note. All numbers are in log-transformed 2020 dollars. This DiD model compares how per-pupil state revenue changed after the strike differently in striking and nonstriking districts. A striking district is defined as closing at least one school for at least 1 day in response to the strike.
p < .05. **p < .01. ***p < .001.
In addition to receiving less poststrike revenue from the state, participating districts also showed smaller increases in their total per-pupil expenditures, compared to nonstriking districts. As shown in Figure (10 or 11) and Table (4 or 5), without controlling for any covariates, the average participating district experienced about 6.9% less growth in in per-pupil spending after the strike compared to the average nonparticipating district (in a linear model, this works out to about $1,300 less per pupil). This difference is larger and often statistically significant in unweighted regressions, but smaller and statistically insignificant in the weighted regression. Even at its smallest value, a difference in spending of about $400 per student or 2.8% in spending growth still represents a noticeable difference. This difference is not identical to the difference in state revenue, because different districts had different local and federal funding realities, but overall the story is fairly similar: The types of districts that were most likely to go on strike benefitted less from the funding formula that was still in use after the strike. Clearly, this difference in funding is not due to the strike, as the funding mechanism does not take that into consideration. Rather, it is a matter of the different strike participation patterns resulting in different poststrike funding realities for strikers and nonstrikers.

Average teacher salary over time by strike participation.

Per-pupil expenditures over time by strike participation.
Difference-in-Differences Changes in Log-Transformed Teacher Salary
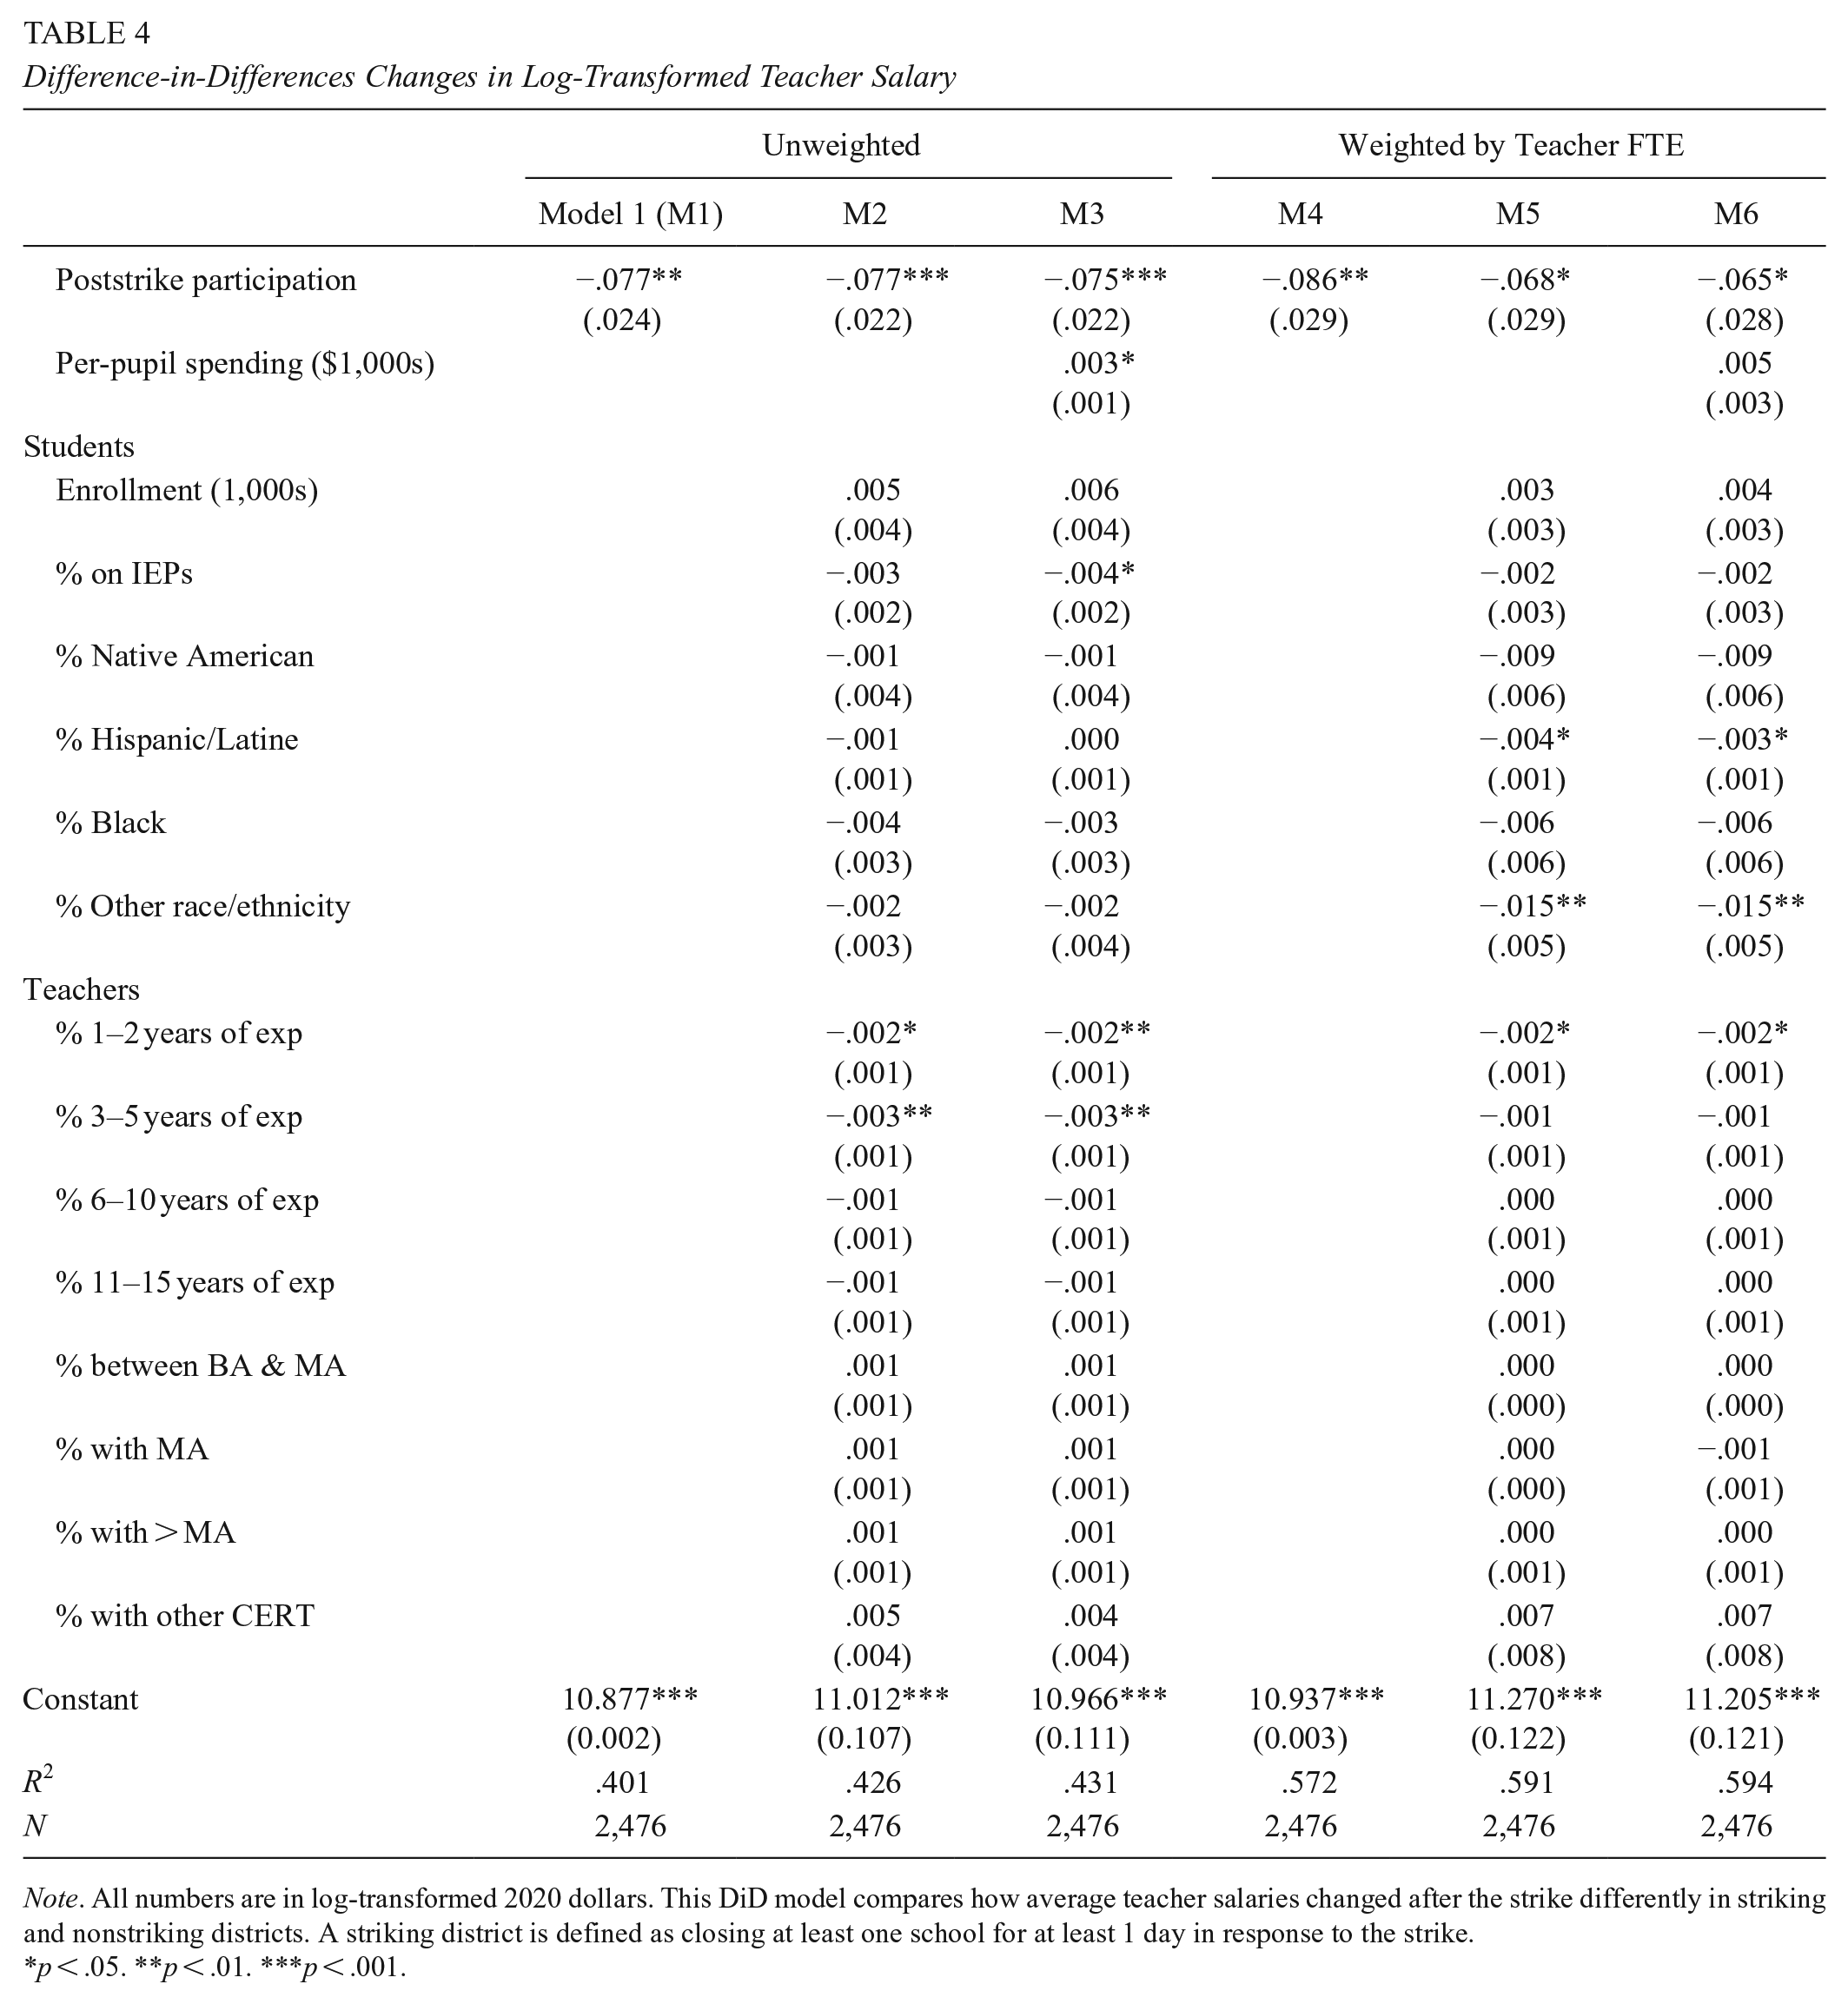
Note. All numbers are in log-transformed 2020 dollars. This DiD model compares how average teacher salaries changed after the strike differently in striking and nonstriking districts. A striking district is defined as closing at least one school for at least 1 day in response to the strike.
p < .05. **p < .01. ***p < .001.
Difference-in-Differences Changes in Log-Transformed Per-Pupil Expenditures

Note. All numbers are in log-transformed 2020 dollars. This DiD model compares how per-pupil expenditures changed after the strike differently in striking and nonstriking districts. A striking district is defined as closing at least one school for at least 1 day in response to the strike.
p < .05. **p < .01. ***p < .001.
Because of this difference in funding, I add per-pupil revenue from the state as a covariate in future tables that examine specific spending outcomes. This allows me to consider how striking and nonstriking districts who had the same state funding spent their limited funds differently.
Teacher Salary
While teacher salaries grew overall after the strike, they grew more in nonstriking districts than in striking districts. Figure 10 shows teacher salaries over time in participating and nonparticipating districts, averaged without weighting in inflation-adjusted dollars. The DiD results in Table 4 show that districts that closed for the strike were less likely to spend their increased funding on teacher salaries. Depending on controls and weighting, participating districts grew teachers’ salaries between 6.6 and 8.2% less, which works out to about $4,000 less for teachers—a difference that is both practically and statistically significant. This difference cannot be considered as a consequence of strike participation, as Figure 10 shows that participating and nonparticipating districts had different salary patterns for quite some time before the strike.
Support Staff Salaries
Support staff salaries showed a small increase after the strike, but separating by district strike participation patterns does not reveal strong differences. It does appear in Figure 12 that nonstriking districts decreased support staff salaries right before the strike and then increased them just after, but the DiD results in Table 6 show no statistically significant differences. The differences in the unweighted model are practically significant (a 6%–7% difference, or $3,000 in a linear model), but the lack of consistency across weighted and unweighted models, the lack of statistical significance, and the lack of visual confirmation in the figure makes it hard to say definitively that participating and nonparticipating districts invested differently in support staff salaries.
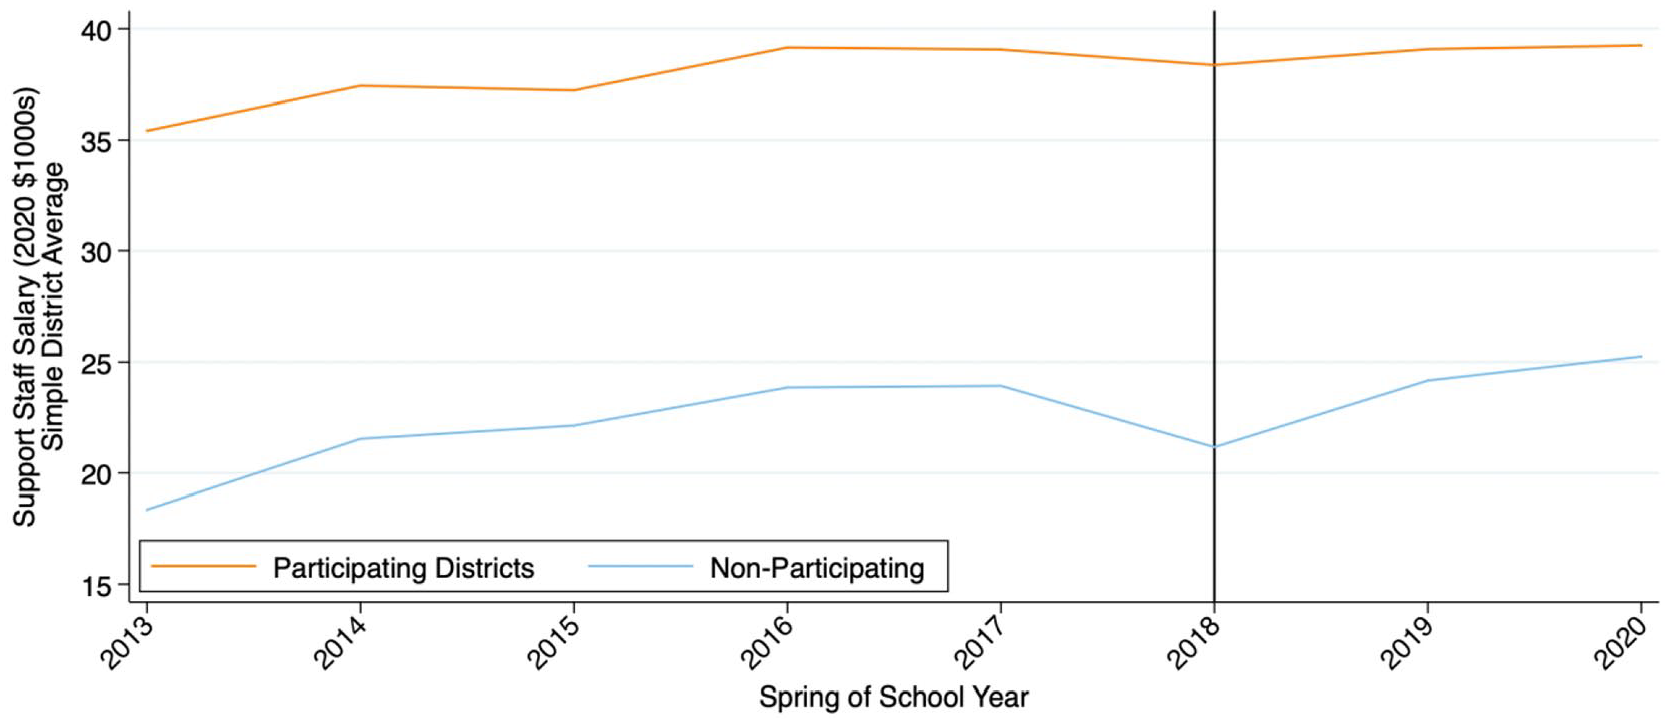
Average student support staff salary over time by strike participation.
Difference-in-Differences Changes in Log-Transformed Student Support Staff Salaries
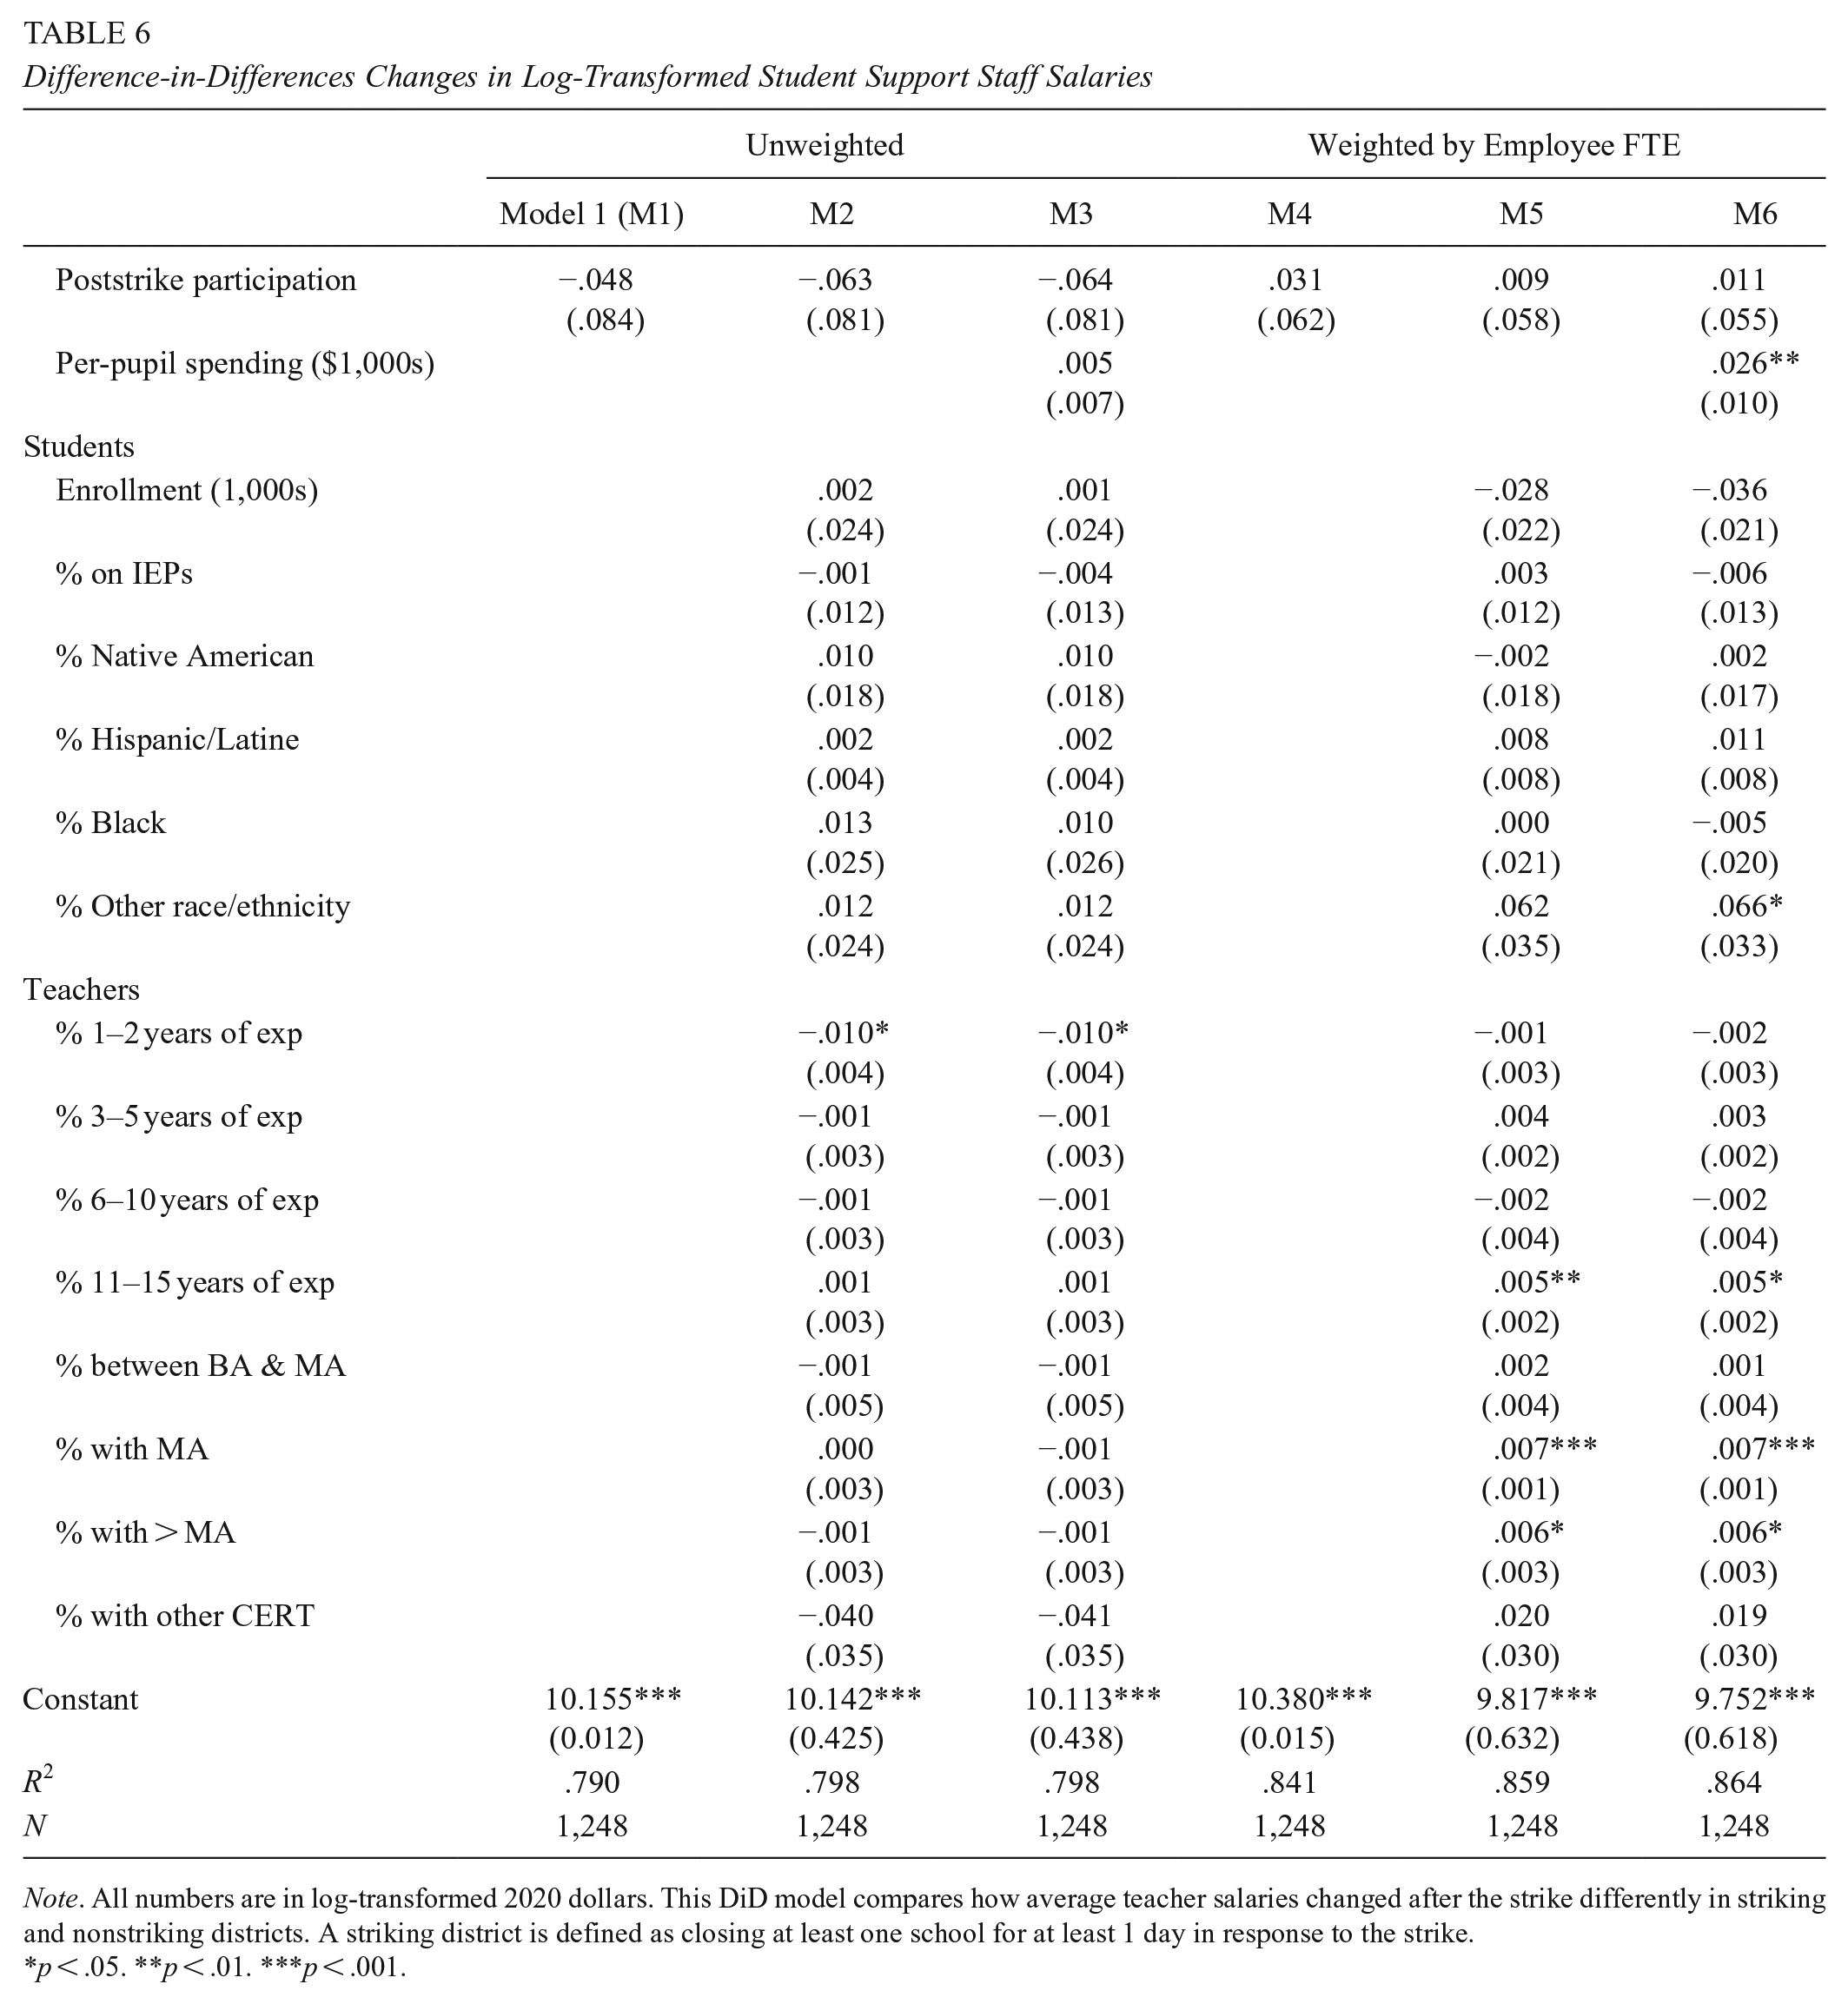
Note. All numbers are in log-transformed 2020 dollars. This DiD model compares how average teacher salaries changed after the strike differently in striking and nonstriking districts. A striking district is defined as closing at least one school for at least 1 day in response to the strike.
p < .05. **p < .01. ***p < .001.
Discussion
Participation Patterns: Location and Finances
While Red for Ed drew educators from across Arizona, more educators from closer to Phoenix and from large urban and suburban districts participated. The limited participation from rural educators was noted at the time, attributed to the distance, the limited number of site liaisons in rural schools, the lack of alternate infrastructure to feed low-income students, and the more conservative political context (Campbell, 2018; Farzan, 2018a, 2018b). My work reveals another possible contributing factor that sheds light on educator motivation: These small, rural schools might have felt less of a need for a strike.
Districts that stayed open through the strike tended to have higher per-pupil expenditures (even after accounting for enrollment size), higher property tax wealth, less dependence on the state as a source of funding, and salaries that were growing over time. To be clear, these schools were still underfunded relative to schools in many other states in the country, but a strike is a drastic measure, only taken in the most drastic circumstances. The educators in striking districts could be responding to many potential financial realities, including their districts’ low overall funding, the lack of recent growth in their salaries, and the limited taxable wealth in their communities that made them more reliant on state funding. This mix of motivations, some about the greater good, others about their own salaries and immediate needs, has been called a blend of business and social movement unionism (Kurtz & White, 2022).
Some of the issues that isolated rural educators from the movement could be addressed by organizing free food for students and multiple gathering locations, while others require more fundamental considerations of why educators strike. Based on the pattern of rural schools with high Native American student populations participating, the Rez for Ed movement seemed to succeed in encouraging strike participation even in rural schools. Rez for Ed blended attention to the unique concerns of educators of Native American students with connections to the broader Red for Ed movement and indigenous rights concerns (Cázares-Kelly, 2019). This might offer some additional guidance about the pattern shown in prior work on Red for Ed, whereby the combination of broad and narrow reasons for striking motivates educators into drastic action (Kurtz & White, 2022).
Demands Met With Limited Success Due to Multiple Compromises
Arizona educators had five demands for their strike, including a restoration of 2008 funding levels, an immediate 20% raise for teachers (with yearly raises until Arizona teacher salaries reached the national average), and competitive wages for support staff. After adjusting for inflation, by 2020, educators had received state funding increases that were still $750 short of 2008 levels, a 4.1% raise for teachers, and a 5.1% raise for support staff.
Unlike in other Red for Ed states like West Virginia and Oklahoma, Arizona had no statewide teacher salary schedule that could be directly changed—and there was certainly no such schedule for support staff. Educators thus had to negotiate over proposed raises twice. For teacher salaries, first, educators had to convince the state legislature to provide additional funding for cash-strapped districts, during which time the immediate 20% raise was argued down to an immediate 9% raise with two follow-up 5% raises. Second, educators had to convince school boards to spend these additional funds on teacher salaries, during which a 9% and 5% raise were lowered to 6.5% and 4.4%, respectively. These multiple rounds of compromise just moved educators further and further from the initial demand of 20% raises for teachers with follow-up raises afterwards. Additionally, the pattern whereby state revenue seemed to increase, but per-pupil expenditures stalled after 2019, indicates that local follow-up was needed to make sure the overall expenditures increased. As decision-making in education shifts to encompass more multiple-purpose government institutions at different levels of federalism, unions will need to think strategically about how to focus energy at multiple levels of government and multiple loci of power (Henig, 2013).
This secondary negotiation also presents a missed opportunity for further educator organizing. After the strike, Red for Ed struggled to maintain its grassroots momentum. The AEU worked on a ballot initiative to raise more money for education by taxing the wealthy and knocked doors for political candidates who endorsed the strike’s five demands (Karvelis, 2022). However, the ballot initiative was struck down twice by the Arizona Supreme Court, and the electoral move was not popular: The corps of 2,000 site liaisons who interfaced between AEU and their schools during the 2017–2018 school year quickly dropped to 500 (Flaherty, 2018b; Karvelis, 2020; Polletta & Oxford, 2020). One possible avenue for more direct action could have been following up locally. Speaking as a strike participant, while I understood at the time that we had won money for raises rather than raises themselves, I remember no concerted push from within the movement to bring the fight to district budget negotiations. Local engagement could have helped to ensure the money we fought for was spent in productive ways and local tax effort remained strong. Of course, it may have been difficult for the movement to enter into contentious conversations around prioritizing demands and taxes, but this further action could have gotten more educators involved in leadership and maintained organizing relationships that quickly deteriorated after the strike.
Nonstrikers Benefited More After the Strike
District-level participation in the strike, as proxied by school closures, was related to prior spending priorities. Districts that could benefit more from the strike (with lower per-pupil expenditures and lower property wealth, making them more reliant on state funding) were more likely to participate. However, when educators won increased funding, it was simply added to the same preexisting funding formula that already disadvantaged striking districts. The only change besides increasing the base per-pupil funding amount actually further disadvantaged striking urban districts by increasing funding for transportation that disproportionately supported rural districts. Therefore, larger amount of new state funding and larger per-pupil expenditure increases went to districts that did not participate in the strike. Additionally, districts that went on strike tended to have stagnating teacher and support staff salaries, with minimal raises over the past several years. This pattern continued after the strike. The people who needed change the most (educators in urban districts with more students of color and lower property wealth) went on strike, but because that change simply added to the preexisting funding formula and did not force individual school boards to change their spending priorities, they did not benefit from the strike as much as nonparticipating districts. Of course, this work is limited because “school closure” is only an imperfect proxy for participation in Red for Ed more generally. Educators who did not strike could still push for political change by contacting their legislators or by joining the march without shutting down their schools (in particular, educators from schools with 4-day weeks could join the capitol protest on the weekday during which their schools were not in session). While my measures may diminish the contributions of nonstriking districts, there is a large difference between a strike that manages to shut down a major public service and other forms of political engagement such as phone calls or protests. Educators who did not strike could help the movement, but they did not put their jobs or their teaching licenses on the line for it. These nonstriking educators may not be free riders in the classic sense, because they could still be part of the movement in other ways, but they certainly risked less than striking teachers and still benefitted more.
The issue of free riders has not received much attention in the Red for Ed literature, so I must rely on my own experience. The teachers around me were proud to represent the entire state; we believed that every student in Arizona deserved better, regardless of whether their teachers could join us at the capitol. Then I returned to work, where my nonstriking coworkers had been paid for a restful week of half days while I lost money for 12-hour days at the capitol. I learned that my nonstriking colleagues had been badmouthing strikers to our students. I believed those teachers deserved raises, but as the immediate solidarity of marching with other educators faded, I resented that some teachers had not had to work for it like I had. I thought that maybe, next time, they could do the work, and I could just rest. I am not proud of this reaction, and I was not willing to voice it at the time, but I still felt it.
It is worth considering the problem of free riders, especially given Red for Ed’s quick fading in Arizona. This decline was not inevitable. Red for Ed lived on nationally, bringing district-level strikes to blue cities like Los Angeles, Oakland, and Chicago in 2019 as well as returning to West Virginia for another statewide strike (Blanc, 2020b). The short lifespan of the Red for Ed movement in Arizona, though still somewhat mysterious, has been attributed to the failure of the ballot initiatives, migration towards electoral politics, and plain exhaustion (Karvelis, 2022). From my results about poststrike spending and my personal experience, I believe that a lack of unity from free riding may have also contributed. West Virginia’s Red for Ed movement, which closed all school districts in the state and won a raise in the statewide salary schedule, was still strong enough in 2019 to strike again (Blanc, 2020b). Arizona only closed about half of their school districts, nonparticipating districts received more funding and nonparticipating teachers better raises, and our Red for Ed movement shrunk quickly. This is certainly not a definitive explanation, but it does raise questions about free riding.
Free riders have been well studied in business unions as a problem requiring policy solutions such as agency fees or public subsidies (Fontaine, 2014; Pierson, 2018; Stanford, 2021). In contrast, there is little academic consideration of the free rider in a social movement union. Early work on social movement unionism imagined that some organizations allied with the union who had less economic leverage (such as parents’ groups in the case of teachers’ unions) would participate less, but envisioned full engagement from union members (Moody, 1997a). Prior work has laid out social movement unionism as a potential solution to free riders—not because social movement unionism actually eliminates the free rider problem but because broad coalitions and rank-and-file organizing can strengthen unions that are weakened by free riders (Pierson, 2018; Strassfeld & Strassfeld, 2020). Thus, the actual issue of how free riders affect social movement union activity is unaddressed. There were no dues to skimp on in Red for Ed, but there were interpersonal issues and threats to solidarity because some teachers risked and worked more than others for no additional benefits. I recommend further qualitative work on unions that use social movement tactics about how the issue of free riders can impact union actions and what organizing tactics are used to handle those issues.
Conclusion
Earlier, I introduced different types of unions whose different repertoires might have different effects on the lives of teachers and students. Business unionism is a model by which the union, led by a disconnected leadership, provides services focused on members’ immediate needs in return for dues. Social movement unionism works through an engaged rank-and-file of members, connected with outside community members and organizations to advance the interests of workers as a whole. I argued, based on qualitative reports, that Arizona Red for Ed had an engaged rank-and-file and spoke of broad social good, while also making use of the resources of a preexisting more hierarchical union and addressing bread-and-butter demands. The results of this study show that strike participation was responsive to both salary concerns and broader funding issues. Following these patterns, striking educators expressed their need for a raise along with broad concerns about the rights of Arizona students and educators to a better education system. Educators ultimately won an increase in the base per-pupil funding amount in the same overall funding schedule that still disadvantaged poor, urban districts with more students of color—the very districts that were the backbone of the strike. This pattern can be read in many different ways: as a social movement winning broad gains for all, as an example of the free rider problem, or as a failure to fully challenge inequities in the Arizona school funding system. Because poor urban districts benefitted less from the strike, I see this pattern as more of a limitation to our impact rather than an example of our generosity. For all our ambitions, we did not think to question the overall funding formula that did not include student multipliers for economically disadvantaged students. We did not follow up locally to ensure that the increased funding was spent in the way that would best help students and educators. There is nothing wrong with helping educators and students in districts that did not participate in the strike, but the strike did not question who needed the most help and who was getting it.
Arizona Red for Ed wanted to help Arizona students, but multiple steps throughout the process served to shrink Red for Ed’s expansive potential into a smaller, more manageable adjustment to the status quo. Our successes lay in building a grassroots movement with popular support beyond the movement and in improving spending on education in a hostile political climate. But in many ways, Red for Ed fell short of our goals to ensure a better education system for ourselves and our students. We were unable to do anything more than staunch the bleeding of the most obvious wound on Arizona’s education system—an important first step in a broader fight that Arizona educators continue to this day.
Supplemental Material
sj-docx-1-ero-10.1177_23328584241303493 – Supplemental material for Rising Arizona: Participation and Results of the 2018 Red for Ed Strike
Supplemental material, sj-docx-1-ero-10.1177_23328584241303493 for Rising Arizona: Participation and Results of the 2018 Red for Ed Strike by Michelle Doughty in AERA Open
Footnotes
Declaration of Conflicting Interests
The author declared no potential conflicts of interest with respect to the research, authorship, and/or publication of this article.
Funding
The author received no financial support for the research, authorship, and/or publication of this article.
Notes
Author
MICHELLE DOUGHTY is a postdoctoral researcher at Vanderbilt University; e-mail:
References
Supplementary Material
Please find the following supplemental material available below.
For Open Access articles published under a Creative Commons License, all supplemental material carries the same license as the article it is associated with.
For non-Open Access articles published, all supplemental material carries a non-exclusive license, and permission requests for re-use of supplemental material or any part of supplemental material shall be sent directly to the copyright owner as specified in the copyright notice associated with the article.