
Abstract
This paper presents comparative information on the strength of the association between socioeconomic status (SES) and literacy skills at ages 6–8, drawing on data from France, Germany, Japan, Rotterdam (Netherlands), the United Kingdom, and the United States. We investigate whether the strength of the association between SES and literacy skills in early-to-mid childhood depends on the operationalization of SES (parental education, income, or both) and whether differences in inequalities at the end of lower secondary schooling documented in international large-scale assessments are already present when children have experienced at most two years of compulsory schooling. We find marked differences in SES-related inequalities in early achievement across countries that are largely insensitive to the way SES is measured and that seem to mirror inequalities reported for older students. We conclude that country context shapes the link between parental SES and educational achievement, with country differences rooted in the early childhood period.
Keywords
Analysis of data from international large-scale assessments (ILSAs) like PISA at age 15 shows that stratification in educational achievement by family socioeconomic status (SES)—“the relative position of a family or an individual on a hierarchical social structure, based on their access to, or control over, wealth, prestige and power” (Willms & Tramonte, 2019, p. 289)—is pervasive. Parental SES determines early disparities in educational achievement and attainment and casts a long shadow in terms of its implications for the persistence of (dis)advantage across generations (Boudon, 1974; Breen & Müller, 2020). According to PISA, however, the relationship between SES and achievement is not uniform across countries. Equality of opportunity varies greatly across contexts, even among modern, high-income, democratic countries. Cross-national research that furthers understanding of the macro-level factors that shape educational inequalities can, therefore, help to identify the mechanisms that constrain, or that can be used to promote, social mobility.
Research based on the ILSAs has primarily focused on how the features of formal education systems mitigate or exacerbate inequalities (e.g. van de Werfhorst & Mijs, 2010) but an extensive body of single country studies, particularly for the United States, has established that SES disparities in achievement already exist at the start of primary education and even earlier (Bradley & Corwyn, 2002; Reardon & Portilla, 2016). This raises the question of how much cross-national differences in achievement inequality at the end of formal schooling reflect out-of-school, rather than in-school, processes linked, for example, to policies around social welfare, redistribution of income, and the organization of early child care. Comparative work that quantifies inequalities in the early childhood period helps to disentangle these processes by contrasting the degrees of inequality that exist before children have been exposed to different schooling systems, during a developmental period in which home and family conditions are of paramount importance (Waldfogel, 2010). When evaluating how far different national school systems reproduce inequality, it is important to know whether they are starting from a common baseline or whether local conditions make the provision of equal opportunities within the educational system a more challenging task in some countries than others.
Drawing conclusions by comparing single-country studies is difficult due to differences in the measurement of achievement and SES and different methods, but a small and growing body of work has sought to compare achievement distributions (Merry, 2013) and social inequalities in achievement earlier in the life course than is possible with the ILSAs only (e.g. Bradbury et al., 2019; Linberg et al., 2018; Passaretta et al., 2022). This body of research has shown that large SES disparities predate school entry and differ significantly in magnitude across countries, but to date, comparisons have been limited by the range of countries considered and the differences in the way SES is operationalized. This paper extends this work by considering the stratification of early achievement, using data from a wider selection of countries than any previous study, applying a common data analysis strategy, and considering two key dimensions of SES.
This paper therefore provides new evidence on inequalities in achievement test scores among children aged 6–8 using data from six advanced industrialized countries—France, Germany, Japan, the city of Rotterdam in the Netherlands, the United Kingdom, and the United States—analyzed by a team of national researchers who are participants in the Development of Inequalities in Child Educational Achievement: A Six Country Study (DICE) project. As children experienced at most two years of formal primary schooling, the paper delivers insights into the extent to which cross-national variation in achievement inequalities at later ages is already present in early-to-mid-childhood. We draw on findings from studies of inequalities later in the life course, showing that different dimensions of SES have independent effects on children’s development (e.g., Bukodi et al., 2021; Mood, 2017). Using only one dimension to measure SES results in an underestimation of inequalities (Bukodi & Goldthorpe, 2013; Eriksson et al., 2021), and more seriously for cross-national work, could result in distorted comparisons when the components of SES are correlated differently within countries (Marks, 2011). While many indicators have been proposed as components of SES, here we focus on two: parental education and household income. Parental education and household income provide advantages for children via different mechanisms and may vary in the extent to which their effects are shaped by country context. By disaggregating and comparing the contribution of these two major components of SES to overall stratification, it throws light on whether the penalties for children associated with low parental education and low household income differ across countries and on the sorts of biases that are likely to occur when SES is operationalized in terms of a single indicator.
In short, our paper aims to answer three research questions:
Do we see the same cross-national patterning of inequalities in early primary school as at the end of lower secondary school?
How large is the unique contribution of parental education and income on child achievement?
How does the impact of different SES dimensions on child achievement differ across countries?
Cross-national Differences in SES Gradients in Achievement at Age 15 and Earlier
To provide context, we start with results from the largest and most recognized international survey on student achievement, PISA, which provides a snapshot of achievement inequalities at the end of lower secondary education (at age 15). PISA measures parental SES via its index of economic, social, and cultural status (ESCS), a composite derived by combining measures of parental education, occupation, and an index of home possessions designed to proxy for material wealth and cultural capital (OECD, 2019, p. 52). The OECD defines the strength of the relationship between SES and achievement in terms of the proportion of outcome variance explained by SES—the R2—and labels this as SES gradients. We adopt the same approach in our analysis as the R2 can provide a summary measure of inequality when multiple components of SES are disaggregated into different predictor variables, and it incorporates information about achievement over the full range of the SES distribution.
In Table 1, the six countries explored in this study are ordered in terms of the percent of variation in reading scores at age 15 explained by the ESCS index (OECD, 2019). The OECD average, as well as the most and least unequal OECD countries, are included to facilitate wider comparison. The average percent of variance in reading performance explained by ESCS across OECD countries is 12%, but this varies between 6.2% in Estonia and 19.1% in Hungary, a more than three-fold difference. The countries represented in this study span a good range of the OECD distribution, with France and Germany toward the top of the range at 17.2–17.5%, and Japan toward the bottom at 8%, a more than two-fold difference. The United States is ranked third among the study countries in terms of achievement inequality, with an R2 value equal to the OECD average, with the Netherlands and the UK showing inequalities lower than the OECD average but higher than Japan. Results on inequalities in mathematics instead of reading reiterated this picture.
Socioeconomic inequalities in achievement at age 15 in selected countries from PISA 2018

Source. OECD (2019). Estimates of the percent of variance explained in reading and mathematics performance are taken from Tables II.B1.2.3 and II.B1.2.4, respectively (https://doi.org/10.1787/888934038609).
The first question we address in this study is whether this patterning of inequalities at the end of lower secondary education is already apparent in early primary education or whether cross-national differences in the SES gradient emerge over the course of the school years. Because this study operationalizes SES differently from PISA and because of differences in the measurement of achievement, comparing the R2s from PISA directly with those presented in this study on a within-country basis is not possible. The question of whether the SES gradient within individual countries strengthens or weakens as children age is, therefore, beyond the scope of this study. Our focus is instead on whether significant cross-national differences in SES gradients can already be discerned early in childhood and, if so, whether the rank ordering of countries remains stable between childhood and adolescence.
PISA provides an excellent snapshot of inequalities toward the end of compulsory schooling, but the ILSAs are limited in their ability to provide similar comparative evidence earlier in the life course. The earliest point at which children from large numbers of countries are surveyed by the ILSAs is in fourth grade (in PIRLS and TIMSS), when children are aged 9 to 10 and will have been exposed to formal systems of compulsory schooling for up to five years. Research using PISA (age 15), PIRLS (grade 4), and TIMSS (grades 4 and 8) has addressed the question of how SES gradients in achievement compare across countries at different stages of schooling using a pseudo-cohort or a differences-in-differences approach (e.g., Contini & Cugnata, 2020; Dämmrich & Triventi, 2018; Rözer & van de Werfhorst, 2019; Strello et al., 2021). These ILSA studies have the advantage that they can consider a large range of countries, model the factors that are associated with country-level changes in inequality over time, and draw on measures that have been constructed to be internationally comparable, at least within a single ILSA. Insights from these studies include the idea that cross-national differences in the SES gradient are already apparent at the end of primary school and these differentials exhibit stability over time—countries with high inequalities in primary school tend to have higher inequalities in secondary school (Contini & Cugnata, 2020). A few previous studies present comparative information on achievement inequalities earlier than grade 4 based on country-specific data sets. Passaretta et al. (2022) present estimates of gaps in language/literacy skills by parental education in Germany, the UK, and the Netherlands at multiple time points between ages 5 and 11. They show parental education gradients at age 5 are the largest in Germany, followed by the United Kingdom, and the smallest in the Netherlands. This ranking is unchanged by ages 7–8, despite a greater steeping of the gradient in both Germany and the Netherlands over the period.
Linberg et al. (2018) compare gaps at ages 6–7 in language/literacy and math skills in Germany and the United States, again by parental education, and find significantly larger gaps in Germany. Finally, a series of studies looks at early childhood cognitive achievement gaps in the United States, the UK, Australia, and Canada by parental education (Bradbury et al., 2015), relative income group (Bradbury et al., 2012), and absolute income group (Bradbury et al., 2019). Regardless of the way SES is operationalized, gaps are significantly larger in the United States than in the other three countries.
To summarize, the existing evidence suggests that early achievement gaps are larger in Germany followed by the United States, the United Kingdom, and finally the Netherlands. Considered alongside the evidence from PISA concerning inequalities at age 15 (Table 1), there is a good case that cross-national differences in childhood socioeconomic inequality are already apparent by the time children begin school and remain largely, although not perfectly, stable over time. To date, no study has considered more than three of our study countries simultaneously or included France or Japan with respectively very high and very low levels of inequality at age 15.
Measurement of SES in Comparative Studies
As mentioned previously, PISA measures parental socioeconomic status via its ESCS index (OECD, 2019, p. 52). This measure has the advantage of incorporating information on multiple dimensions of parental socioeconomic resources, but it has the drawback that it disguises differences in the implications of the individual components for children’s development across country contexts (Eriksson et al., 2021). Many countries rely on child reports of parents’ SES characteristics, which may be highly error-prone (Jerrim & Micklewright, 2014), and household income information is not collected at all in the fourth-grade ILSAs. Comparative studies of inequalities using primary-school ILSAs are, therefore, often forced to rely on a measure of the number of books in the home to operationalize parental SES, an indicator that is arguably a poor proxy for SES (Engzell, 2021).
Our research tries to disentangle the SES gradient—that is, differences in achievement by SES—that existed at the school entry from the later influence of schooling structures. Compared to the evidence available from the fourth grade ILSAs, measuring SES gradients in achievement just prior to, or as close as possible to, the point of school entry provides a purer measure of initial inequalities. To gain an in-depth and fine-grained comparative understanding of how the major aspects of parental socioeconomic resources relate to outcomes in early childhood, we must turn to national datasets, generate indicators that are as comparable as possible, and apply the same analytical strategies without ignoring important study and country-specific features. In addition, the quality of measures of parental SES available in national cohort studies far exceeds those collected in the ILSAs.
Existing comparative work on inequalities in early-to-mid childhood has utilized only single indicators of SES—most commonly, highest parental education but sometimes income (see above). Based on classical test theory, we would expect that measuring a latent factor with only one instead of multiple items will increase measurement error and reduce the observable correlations with other factors. Likewise, we can expect that the use of a single indicator will understate the “true” degree of inequality because SES is a multidimensional concept. This becomes problematic in comparative work if the indicator selected differs in its association with the remaining unmeasured components of SES across countries: countries in which the indicator is a better “proxy” for overall SES will show a stronger association with achievement outcomes, all else equal, and we risk misinterpreting this as evidence of greater social stratification in general.
Bioecological models of child development posit that distal factors, of which family SES is one, shape the proximal environments experienced by children in a multitude of ways, and these environments, in turn, affect their growth and development (Bronfenbrenner & Morris, 2006). The early childhood period is a particularly important one, during which rapid brain development lays the foundations for subsequent learning. Cunha and Heckman (2007) present a skills-beg-skills model akin to ideas of cumulative advantage or Matthew effects (e.g., Schneider & Lingberg, 2022), suggesting that existing inequalities tend to increase during childhood and youth. The literature on “schools as great equalizers” (Downey et al., 2004), in contrast, posits that learning environments at home differ much more than in formal school settings.
Consequently, after the start of formal education, inequalities might shrink or remain rather stable (Downey & Condron, 2016). During the first years, when formal education is absent in most countries, and the use and quality of early childcare programs vary, the family environment should exert a greater impact than later during schooling. Therefore, SES inequalities in achievement are expected to increase in the years before school entry particularly and remain rather stable thereafter (for Germany, see Skopek & Passaretta, 2021).
The components of SES are likely to confer benefits for young children via different mechanisms. Net of other socioeconomic resources, we expect higher parental education to increase the quantity of stimulating interactions parents provide for their children (Bukodi & Goldthorpe, 2013). More highly educated parents engage in more complex conversations with their children, use a richer vocabulary, provide higher instruction quality when learning with children, and have higher expectations for their children’s educational attainment (e.g., Davis-Kean, 2005; Hoff, 2003; Raviv et al., 2004).
Variations in disposable income, however, again net of other socioeconomic resources, are associated with the ability of parents to make more investments in children’s human capital (i.e., family investment model) (Becker & Tomes, 1986). This includes investment in children’s basic needs (e.g., housing and food), learning materials, and stimulating activities and services (including childcare or private schools). Parents with high incomes can also afford to reside or relocate to neighborhoods that are better suited to foster children’s development (Leventhal & Brooks-Gunn, 2000; Owens, 2018). Furthermore, shortages in income increase parental stress and thereby might lead to less involved and more inconsistent parenting (i.e., family stress model) (Conger & Conger, 2002).
Cross-country Variation in the Association of Different Components of SES With Achievement
On the face of it, we might expect more variability in the income-achievement association across countries than in the parental education-achievement relationship. Countries differ considerably in their overall levels of income inequality; in the extent, targeting, and manner in which the state offers financial subsidies and in-kind services (see Table 2 for selected indicators); and in their degree of residential segregation (Gutiérrez et al., 2020). All these factors could affect the way children’s lived environments differ for a given differential in their place in the income hierarchy—that is, how different the living conditions of “rich” and “poor” children are in different societies.
Country contexts in 2005 (countries ordered by SES gradient in PISA 2018)

Sources. OECD (2009) Society at a Glance (Gini coefficients); Strello et al. (2021) (age at first tracking); OECD (2022) (ECEC and family spending). Gini coefficients are for disposable income. Social spending figures are taken from 2005 and Gini coefficients from the mid-2000s in order to align approximately with analysis cohort birth years.
It is perhaps less obvious why the effect of parental education on children’s development, net of income, should differ across countries. Mediation of these effects is more linked to intimate intra-family interactions that take place within the home and, to some extent, to genetic mechanisms (Bukodi & Goldthorpe, 2013; Erola et al., 2016) that would seem less sensitive to the macro context. The extent to which children are exposed to compensating or reinforcing childcare environments outside the home, however, may play some moderating role (Schmutz, 2024).
The economic model of parenting of Doepke and Zilibotti (2019) provides a further rationale for why achievement gaps by parental education, as well as by income group, may differ across countries. Their model suggests that incentives to adopt certain styles of parenting are affected by the broader social context and that some parenting styles are considerably easier for parents with high levels of education. Specifically, the benefits of adopting an authoritative parenting style are hypothesized to be greater in systems where the stakes are higher, that is, where economic inequality in adulthood is greater and/or where education systems are more competitive, for example, because of early external school tracking (see Table 2).
Although the constraints imposed on parents by lack of financial resources, and by low educational attainment, may have different implications for children in different contexts, we would also expect some portion of their effects to be shared, both because educational attainment is a crucial determinant of parental income (Erola et al., 2016) and because there will be unmeasured parental traits (such as intelligence, self-efficacy, and a conscientious personality) that correlate with both (Briley et al., 2014; Krapohl et al., 2014). 1
Data and Methods
Data
We use recent micro-level data for France, Germany, Japan, the city of Rotterdam in the Netherlands, the United Kingdom, and the United States. The samples for France, Germany, Japan, the United Kingdom, and the United States are nationally representative. The datasets, measurement waves, and sample sizes are summarized in Table 3. In this table, and all subsequent figures and tables, we order the countries in terms of the R2 from the regression of PISA reading scores on ESCS shown in Table 1; this aids interpretation of our subsequent results and maintains consistency in presentation.
Data and assessment instruments in the six countries (countries ordered by SES gradient in PISA 2018)
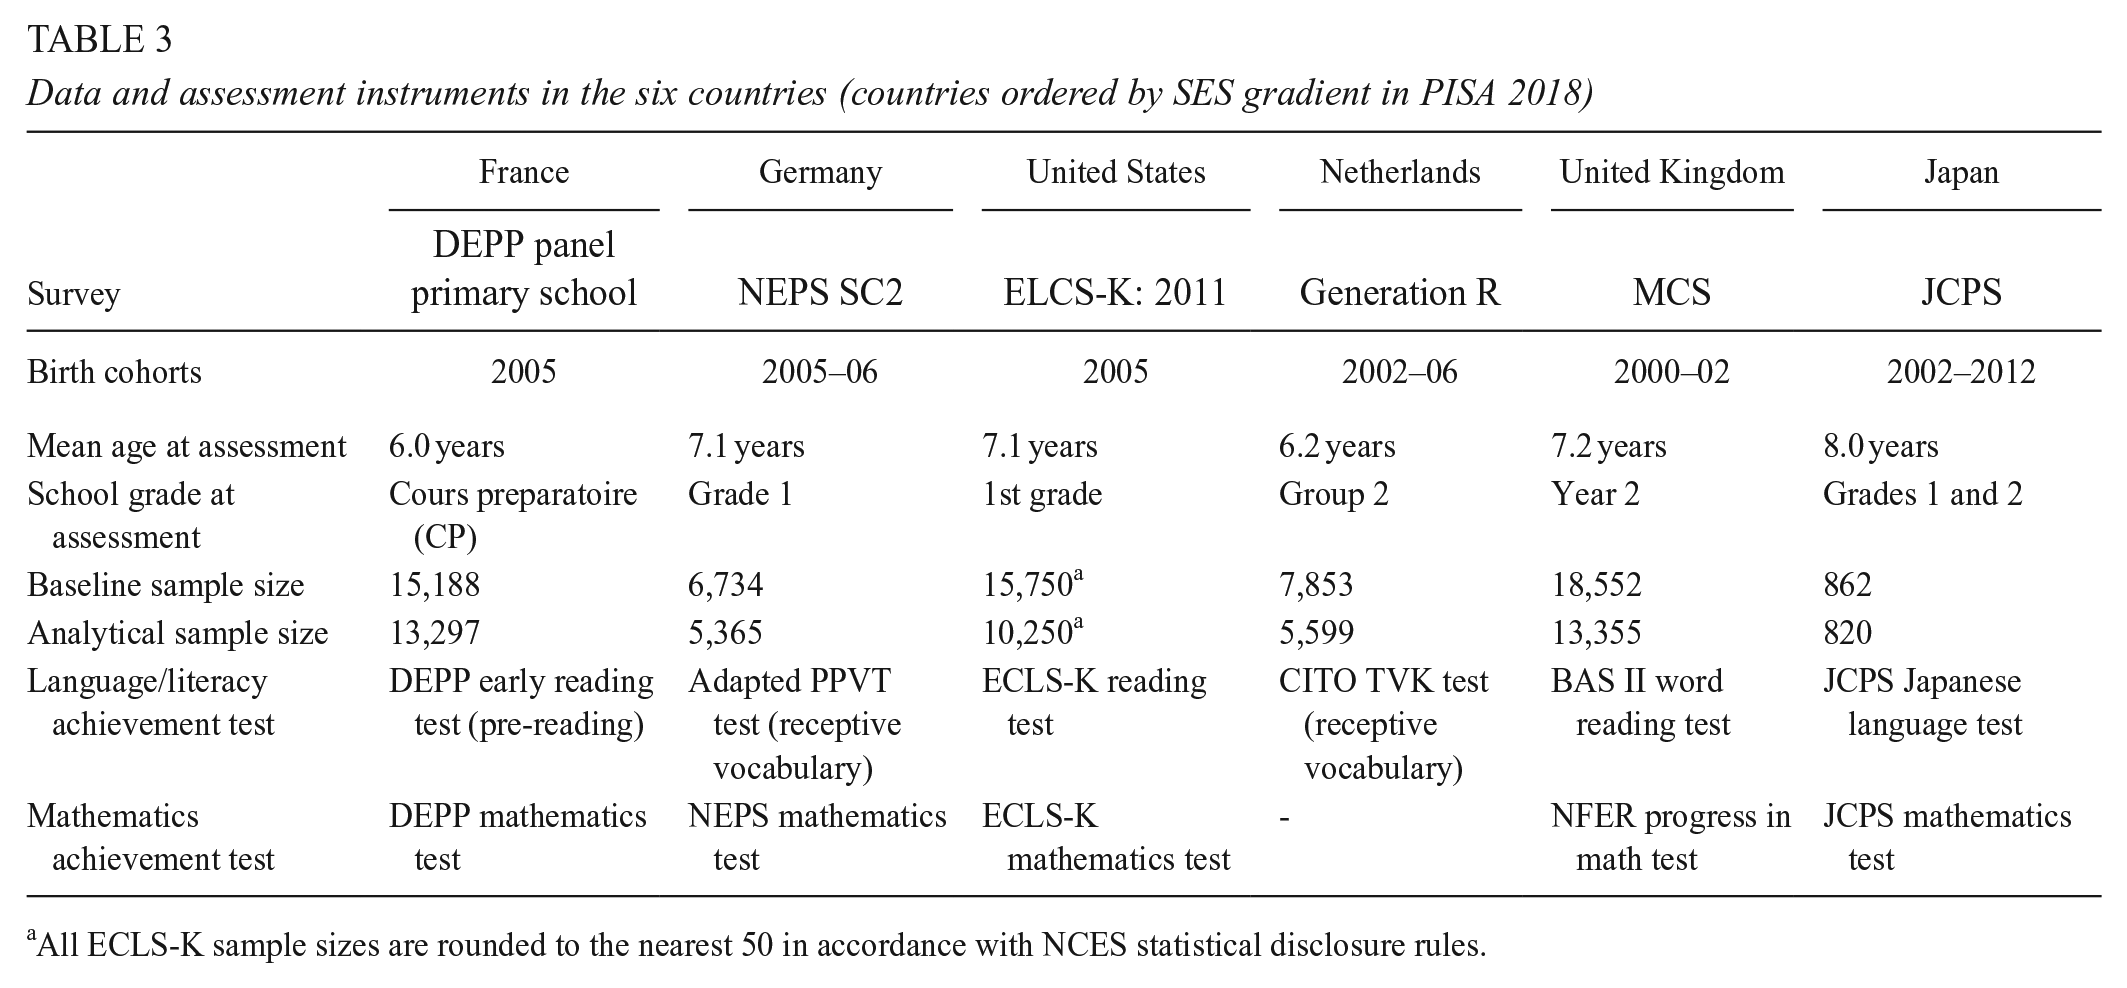
All ECLS-K sample sizes are rounded to the nearest 50 in accordance with NCES statistical disclosure rules.
For France, we use data of the DEPP panel, primary school (La Direction de l’évaluation, de la prospective et de la performance; DEPP, 2011; doi:10.13144/lil-1311). The target population of the DEPP primary school panel is children starting primary school in September 2011. DEPP sampled 977 primary schools in continental France and randomly selected one class per school. For Germany, we use the data of the National Educational Panel Study Starting Cohort 2, a sample that can be assumed to be representative of first grade in the year 2011–12 (NEPS SC2; Blossfeld & Roßbach, 2019; doi:10.5157/NEPS:SC2:9.0.0). For the United States, we use the data of the Early Childhood Longitudinal Study, Kindergarten Class of 2010–11 (ELCS-K:2011; Tourangeau et al., 2015). The ECLS-K sampled a nationally representative cohort of children who attended kindergarten in fall 2010 and spring 2011. For the Netherlands, we analyze the data of the Generation-R study (Gen-R; Jaddoe et al., 2006). The target population of Gen-R were expecting mothers living in the municipality of Rotterdam, with an expected delivery date between April 2002 and January 2006. For the United Kingdom, we use the data of the Millennium Cohort Study (MCS; University of London, 2023; doi:10.5255/UKDA-SN-6411-9). The MCS is a large-scale longitudinal study representative of children born in 2000–2001 and living in the UK at the age of nine months. For Japan, we use the data from the Japan Child Panel Study (JCPS). Unlike the data sources for the other countries, the JCPS surveys children in households recruited as part of the two household panel studies (the JHPS and KHPS), so data on children at a given age are collected over a range of calendar years. The JCPS has been conducted every year from 2010 to 2014 and every 2 years from 2014. We use data from 2010 to 2018 to maximize sample size.
We excluded all children who are not living with at least one biological parent and children who did not participate in the achievement tests, leaving us with analytical sample sizes of between N = 820 (for Japan) and N = 13,798 (for the United Kingdom). We selected survey waves to capture comparable ages and time in formal education: all sample children varied between 6 and 8 in age and were in either the first or second year of primary school when assessed. Age and exposure to schooling do not align perfectly in this sample of countries—Dutch children, for example, were younger than the German ones but had been in compulsory schooling for a year longer.
As Table 3 makes clear, most of the study cohorts were born in or around 2005, although the UK cohort was born a little earlier, around 2001, and the Gen-R and JCPS sampled from a wider range of birth years than the other studies. The PISA results shown in Table 1 relate to cohorts born in 2003 (who were, therefore, age 15 in 2018). The cohort alignment is therefore good, but not perfect, with children in our early childhood samples generally born around two years after the children surveyed in PISA 2018.
Measurement
Dependent Variable: Achievement
The outcome of interest is students’ language/literacy achievement in the first or second year of primary school. In a robustness check, we consider mathematics achievement, which, however, is not available for Rotterdam. Skills in both domains were measured with different standardized tests in each country, and where available, we used children’s latent abilities as estimated based on item-response theory. These achievement measures are not directly comparable because they are based on different tests without overlapping items used in all tests (Majoros et al., 2021). Following a common approach in the literature (e.g., Bradbury et al., 2015; Chmielewski, 2019), we make achievement gaps comparable across countries by standardizing test scores to a mean of zero and a standard deviation of one in each country. This approach is valid if all tests are interval scaled and all the different tests rank students similarly (Chmielewski, 2019, p. 522). For brevity, we henceforth refer to our primary measures as tests of literacy skills; however, we recognize that tests vary in the extent to which they assess verbal and/or reading skills (see Appendix A for further information on the content domains covered by the instruments and their comparability).
Independent Variable: Parental Education
For all six countries, we categorize parents’ education into three categories: high, middle, and low. Our main specification employs the “dominance” approach—that is, we code a single variable capturing the highest qualification of either parent who is co-resident with the child. The highest educational category contains those parents who have at least a bachelor’s degree. The lowest educational group differs between countries with comprehensive systems (i.e., little or no tracking below age 15; the US, UK, France, and Japan) and those with early tracking and a high degree of academic/vocational specificity (Germany and the Netherlands). In the United States, Japan, and France, this is defined as no qualification beyond a high school diploma (baccalauréat general in France); in the United Kingdom, this is attainment of at least a grade C qualification at the end of compulsory schooling (age 16). For Germany, low education is defined as no attainment beyond the intermediate secondary track, including a degree from the lower track plus vocational training, and for the Netherlands, no degree beyond junior general or pre-vocational training. The medium education group contains all parents who do not fall into the high- or low-education category (Bradbury et al., 2015). 2
Independent Variable: Household Income
We measure the income of the households in the same year as children’s achievement. The wording of the questions and the extent to which they include tax and/or transfer payments in the definition of income differs across surveys (see Appendix B). We use a measure of relative income position within countries—income quintile groups—on the basis that taxes and transfers will affect the variance of the income distribution but should have little impact on the rank ordering of households by income. Before defining quintile groups, we equivalize the original survey measures of income by dividing income by the square root of the household size.
Control Variables
Our baseline regression models include a minimal set of control variables that we would not expect to be correlated with SES but that are likely to contribute to the achievement variance: gender and age of child at assessment. For Japan, we also control for survey wave because, unlike the data for the other countries, data for Japan comes from a household panel and children were born in different years. Controlling for variables like these should improve the precision of the estimates by removing differences in the residual variance due to the sampling differences across countries.
Multiple Imputation
We use multiple imputations with chained equations to impute missing values in independent variables (Royston & White, 2011). We use all variables considered in the analyses for the imputation and additional auxiliary variables like parents’ employment status and welfare benefit receipt and create 20 imputed data sets. Descriptive statistics for the weighted imputed samples are provided in Table 4. (See Appendix C for further details on missing data and imputation.)
Descriptive statistics (imputed and weighted data, countries ordered by SES gradient in PISA 2018)

Note. Children’s achievement and household income quintile groups are not presented because they are standardized to 0.00 (SD = 1.00) and 0.20, respectively, in all countries. All ECLS-K sample sizes are rounded to the nearest 50 in accordance with NCES statistical disclosure rules.
DEPP only contains information on age in whole years.
Methods
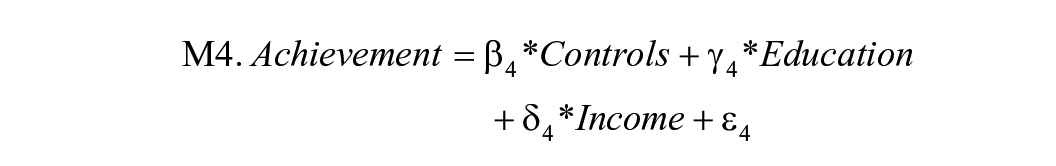
We employ OLS models to estimate the components of achievement scores. We run four different models:


We use the effect size measure “partial eta-squared” (partial
We adjust standard errors for the sampling design and apply survey weights. For France, the United Kingdom, and the United States, we used the weights provided by the survey designers. For JCPS and NEPS, a set of survey weights was created by the raking method to align with national population characteristics. Generation-R was not constructed to be representative of the Dutch population, and we only estimate the inverse probability of attrition weights.
3
To compare partial
Results
Country Differences in SES Gradients
Figure 1 shows the joint contribution made by indicators of highest parental education and parental income quintile group to the variance in literacy scores at ages 6–8—that is, R2[M4]–R2[M1]. The ordering of countries is the same as those in Table 1 and hence reiterates countries ranking in the % of variance in reading performance explained by ESCS in PISA 2018 from high to low.
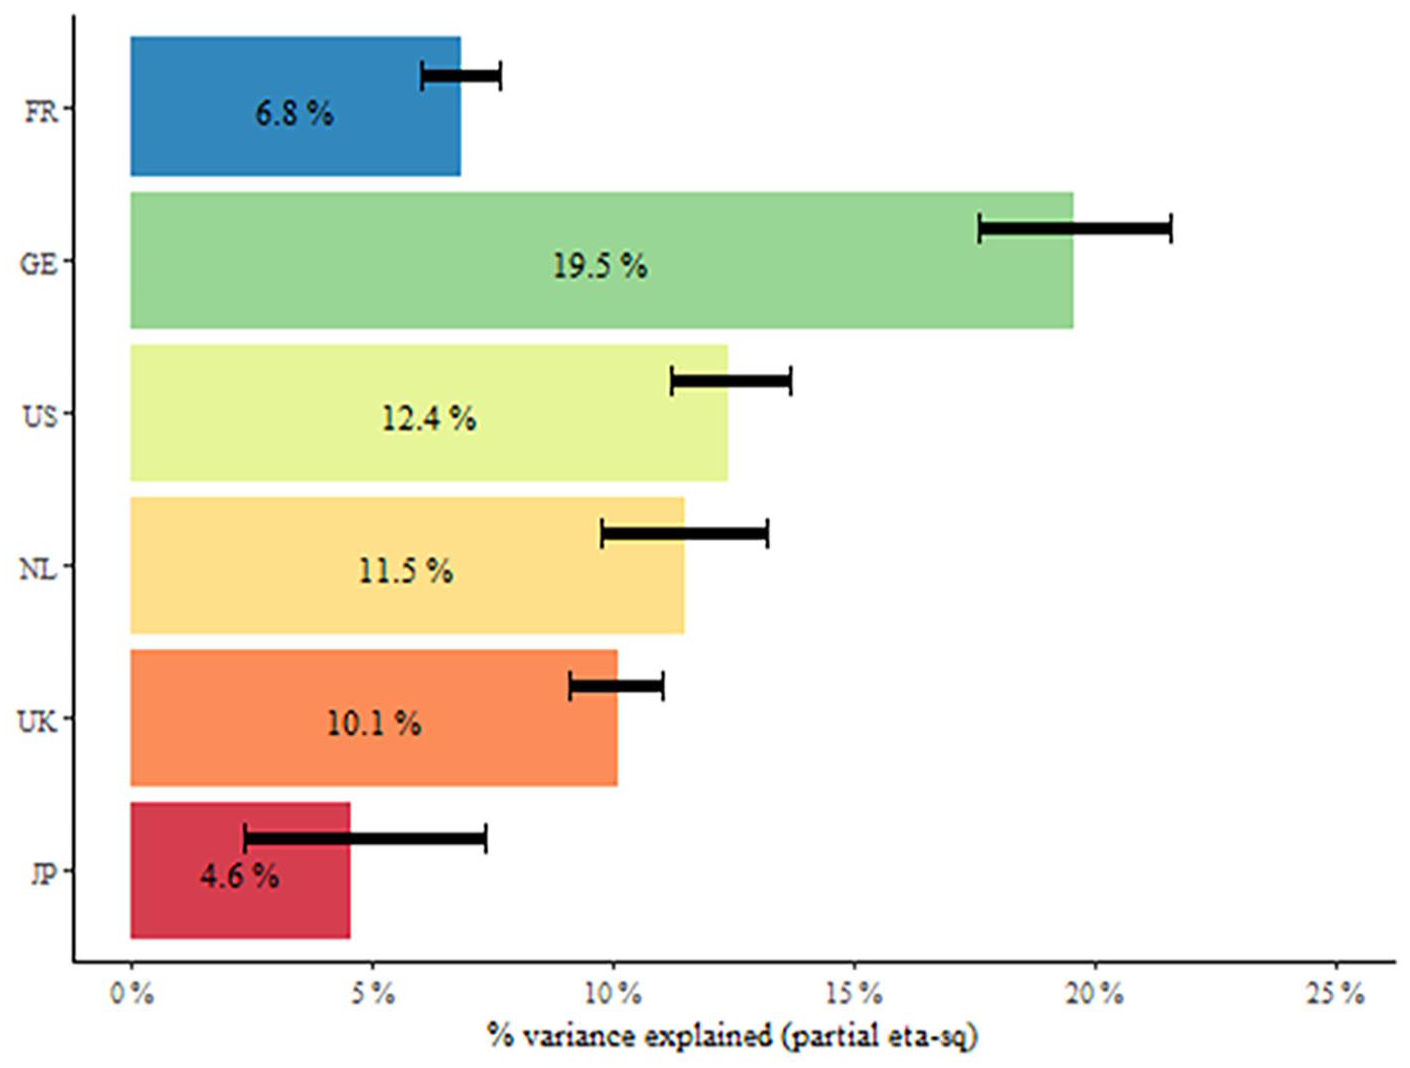
Percent of variance in literacy scores at ages 6–8 accounted for by SES: joint contribution of parental education and income group (countries ordered by SES gradient in PISA 2018).
With the notable exception of the position of France, the ordering of countries by the social gradient in early primary school is identical to the ordering at age 15 from PISA 2018. Germany has by far the strongest gradient and Japan the weakest, with the United States, Rotterdam (Netherlands), and the United Kingdom in intermediate positions. Within this group of five countries, cross-national differences are quite distinct, with 8 of the 10 pairwise comparisons reaching statistical significance (with p < .05); only the gradient for Rotterdam (Netherlands) is not statistically distinguishable from the US or UK gradients (Appendix Table D1). The gradient for Germany is more than four times larger than the gradient for Japan.
France is the exception from the remarkable stability in the relative degree of social inequality in our results and the results from PISA, which emerges for the other five countries. In PISA, inequalities are similar in France and Germany, yet at age 6–8, the gradient in France is only one-third the size of that in Germany and is significantly lower than in every country studied other than Japan. This difference is intriguing and suggests that the process by which France and Germany end up with similarly high inequalities in adolescence is rather different. Low SES children start a long way behind in Germany and remain there, whereas low SES children start on a remarkably equal footing in France in international terms but fall behind sharply during the course of schooling.
Contributions of Parental Education and Income
Figure 2 goes on to explore how our conclusions about cross-national variation in early achievement inequality would be affected if we were to characterize SES solely in terms of highest parental education (panel a) or income quintile group (panel b) rather than considering them jointly. In each panel, the solid bars represent the gross contribution of the first SES indicator or the percent of variation explained when the second SES indicator is omitted from the model. The open bars represent the net contribution of the second SES indicator or the increment in explanatory power when the second indicator is added to the first. In both panels, the gross contribution of the first indicator and the net contribution of the second indicator sum to the overall social gradient shown previously in Figure 1. To illustrate the example of France, parental education alone (the gross contribution of education) can account for 5.8% of the variation in achievement. Adding income to the model (the net contribution of income) increases the amount of variance explained by 1.0 percentage point, producing an overall gradient of 6.8%. The alternative decomposition, in which income is entered first, gives a gross contribution of income of 4.6% and a net contribution of education of 2.2%, which again sums to 6.8%. The difference between the gross and net contributions for each indicator reflects the shared contribution of the variance that cannot be decomposed: for France, this is 3.6% (=5.8 – 2.2 = 4.6 – 1.0) (see Appendix Table D1).

Alternative decompositions of the percent of variance in literacy scores at ages 6–8 accounted for by parental SES (countries ordered by SES gradient in PISA 2018).
Several points emerge from Figure 2. First, parental education and income both make unique contributions to the social gradient—the omission of either leads to a reduction in variance explained. Second, education is the relatively stronger predictor of the two. On average across the six countries, a model based solely on education results in a 2.1 percentage point reduction in the variance explained compared to when both education and income are included; the equivalent reduction for a model based solely on income is higher at 3.3 percentage points. Third, the comparative picture is affected relatively little if SES is operationalized in terms of a single indicator rather than in terms of the joint contribution of both education and income. Although the gross gradients are slightly more compressed in panel (b) than in panel (a)—differences in countries’ social gradients are less distinct when SES is operationalized solely in terms of income—the ordering of countries and the significance of pairwise differences is identical across Figure 1 and both panels of Figure 2 (Appendix Table D1). Hence, it appears that cross-national comparisons of the social gradient in childhood achievement are relatively insensitive to the way in which SES is measured, at least among this sample of six countries.
A comparison of the net and gross contributions of each SES indicator provides further insight into the source of country differences in the overall gradient. There is much less country variation in the net contributions of education and income than in the gross contributions. For both indicators, the net contributions for the United States, Rotterdam (Netherlands), and the UK range between 2.1 and 3.0 percentage points and are not statistically distinguishable. The net contribution of income in Germany is also within this range (2.6 percentage points; panel a), but Germany stands out in terms of its very high net contribution to education (7.1 percentage points; panel b). In contrast, the net contribution of income is relatively low in France and Japan (1.0 and 1.3 percentage points respectively; panel a), but the net contributions of education in those countries are in line with the intermediate countries (2.2 and 3.2 percentage points, panel b). The greater country variation in the gross than in the net contributions to the social gradient implies that cross-country differences are primarily rooted in differences in the shared SES component. All pairwise country differences in this shared component of the variation are statistically significant, with the sole exception of the comparison between Rotterdam (Netherlands) and the United States (Appendix Table D1).
Extensions and Robustness Checks
As discussed in the methods section, we could have chosen alternative operationalizations of key concepts, could have used alternative model specifications, and could have used additional control variables. Therefore, we conducted robustness checks to evaluate whether we would have obtained the same substantial results (for more details, see Appendix E). We explored results when measures of maternal and paternal education were included separately, when income was averaged over multiple years, and when mathematics test scores were used in place of literacy scores. In general, our conclusions remained unchanged.
One important extension was to explore the contribution of the demographic composition to the social gradients by adding indicators for family composition (two biological parents vs. single parents vs. stepfamilies), migration background (at least one parent born abroad vs. no parent born abroad), and foreign language spoken in the home. 4
Table 5 shows that the country ranking of SES gradients remains largely intact when controlling for the demographic composition of families; however, the average percent of variation explained by parental education and income across the six countries falls from 10.6% to 7.0%, indicating that demographic differences contribute in a nontrivial way to the social gradient. Controlling for demographic composition reduces the social gradient by most in Germany and least in France and Japan so that country differences in the remaining social gradients become more compressed. Nevertheless, marked differences remain with, for example, the percent of variance explained jointly by education and income in Germany still 2.7 and 7.6 percentage points greater than in the United States and Japan, respectively, down from 7.2 and 15.5 percentage points when demographic characteristics are not controlled.
Percent of variation in literacy scores at ages 6–8 accounted for by parental education and income group (partial eta-squared), with and without controls for demographic characteristics (countries ordered by SES gradient in PISA 2018)

Notes. Numbers show the percent of the variance contributed jointly by parental education and income group over an initial set of control variables (i.e., R2[M4] – R2[M1]). Models with demographic controls include indicators for family structure, presence of a foreign-born parent, and foreign language spoken in the home (only a single-parent indicator is included for Japan). Slight discrepancies in the baseline estimates compared to those reported in the main text are due to bootstrapping of the latter to derive standard errors.
Discussion
This study has provided estimates of the degree of SES-related achievement inequality at ages 6–8 in six advanced industrialized countries, for the first time considering the role of both parental education and household income in a joint framework and has contrasted cross-national patterns with those found in PISA when children have experienced 7–9 more years in the formal schooling system. Several intriguing findings have emerged.
First, we find evidence of marked country-level variation in the SES gradients in early primary school, with an ordering that remains highly (although not perfectly) stable in international rankings of achievement inequalities at age 15. The SES gradient in early primary school is the largest in Germany, and the smallest in Japan, with the United States, Rotterdam (Netherlands), and the United Kingdom in intermediate positions. France is the only exception; it had the largest SES gradient in reading in PISA 2018 but the second smallest gradient in early primary school (see Figure 1).
Findings are largely consistent with previous work on smaller subsets of countries that use differing methodologies: SES gradients in early-to-mid childhood are stronger in Germany than in the United States (Linberg et al., 2018), the United Kingdom, and the Netherlands (Passaretta et al., 2022) and stronger in the United States than the United Kingdom (Bradbury et al., 2015). The gradient documented here for the Netherlands is stronger than for the United Kingdom whereas Passaretta et al. (2022) find the reverse, but this can be accounted for by the urban nature of our Dutch sample, which is drawn from the ethnically diverse city of Rotterdam. When demographic composition is controlled, we find that the SES gradient is weaker in Rotterdam (Netherlands) than in the United Kingdom, consistent with Passaretta et al.’s findings.
This study adds to the existing evidence base by using data from two countries not previously considered in cross-national work—France and Japan—showing that SES gradients in both these countries are weaker than in the other four countries. Further, we show that our understanding of cross-national variation in early SES gradients is not sensitive to whether SES is characterized in terms of parental education, income, or both. National differences are apparent in, and driven by, variation in the shared component of the achievement variance that cannot be decomposed into separate sources. Parental education is relatively the stronger predictor of the two, but income also exerts an independent influence, net of parental education.
These findings raise the question of why children’s learning environments are more strongly differentiated by SES in some countries than others. As the early childhood period is one in which the influence of the home learning environment, which heavily depends on SES, is paramount (as opposed to later periods when less diverse school learning environments become more influential), a model that focuses on how the incentives and constraints of parents respond to the macro-environment provides a useful theoretical framework.
Doepke and Zilibotti’s (2019) economic model of parenting is based on the assumption that different parenting styles vary in their implications for children’s school achievement and also in their costs to parents, in terms of time, money, and psychological resources. SES will bite more sharply, and “parenting gaps” will be wider, in contexts where the returns to intensive parenting are greater. In addition to societal inequality and the structure of the education system, family policy can play a role in relaxing the constraints on lower SES families by subsidizing the costs of parenting, for example, in terms of time (e.g., paid parental leave) and money (e.g., access to affordable high-quality childcare).
We assess the salience of this framework for understanding why SES gradients vary in the sample of six study countries with respect to income inequality, features of early childhood education and care (ECEC), and school structure and government spending. We begin with the two countries with the weakest SES gradients in achievement—France and Japan. The low SES gradient in France is largely consistent with Doepke and Zilibotti’s framework. France has relatively low income inequality, as captured by the Gini coefficient, consistent with relatively weak incentives for parents to invest heavily in the future economic success of their children. French children do not experience high-stakes school tracking at the end of primary school, as in Germany or the Netherlands. Further, social expenditure on families in France is high, particularly in relation to the percent of GDP devoted to ECEC, which is more than double the OECD average (see Table 2). In France, preschool from age three onwards is free, almost universal, and tends to be of high quality. Responsibility for preschool lies with the Ministry of National Education, and preschool teachers are required to have at least a three-year college degree and must pass the national exam (Olczyk et al., 2021). Together, this is indicative of a context in which incentives for parents to prioritize their children’s educational achievement are relatively weak, income differentials between the rich and poor are relatively compressed, and the state helps to equalize access to investments in children, all of which would be expected to attenuate the SES gradient in achievement.
Japan, however, provides an example of a country with an SES gradient that is equally low or even lower than France but in a very different institutional context. Income inequality is higher in Japan, and social expenditures on the family are much lower than in any of the three Continental European countries. Like France, Japan does not practice early tracking, but the example of the United States shows this is not in itself sufficient to restrain the SES gradient. The weak connection between parental SES and children’s early achievement in Japan is, therefore, something of a puzzle; however, one can conjecture at least three reasons: First, Japan is known as a highly homogeneous society with an extremely low rate of inward migration and relatively little social grading in the timing and ordering of family transitions (Raymo & Iwasawa, 2016). Preschool is nearly universal also in Japan; over 95% of children attend some form of certified preschool with the national curriculum guideline at least two years before compulsory education. They may collectively serve to dampen differences between socioeconomic groups. Second, other reasons put forward for why SES gradients in East Asian countries are more compressed than in Western societies are broadly held cultural norms, such as filial piety and high values placed on education as a virtuous lifelong pursuit, and highly standardized education systems, although the evidence on this is mixed (Kim, 2019). Finally, the college earnings premium in Japan is much lower than in the other five countries (van der Velden & Bijlsma, 2016). Therefore, despite a high-income inequality, parents may not have a strong incentive for monetary investment in early childhood education, explaining a relatively low contribution of household income to child achievement. Regardless of the explanation, the example of Japan shows that relatively high economic inequality and low social expenditure can coexist with very modest achievement inequalities.
Turning to the two countries with intermediate SES gradients, the Netherlands and the United Kingdom, we again see sharply contrasting institutional contexts. Income inequality is the lowest in the Netherlands of all the six study countries but second highest in the United Kingdom (see Table 2). Set against this, the Netherlands has a system of early school tracking and only moderate social expenditure on families by OECD standards, while the UK system does not use early tracking in lower secondary schools and has levels of family expenditure that are well above the OECD average. Although the two countries exhibit similar moderate SES gradients, the nature of the incentives and constraints that low SES parents face seems rather different.
The final pair of countries, Germany and the United States, which have the strongest SES gradients among this sample, are also strikingly different in their contextual characteristics. The strong SES gradient in the United States is as we might expect, given its very high level of income inequality, low level of spending on ECEC, and weak social safety net (see Table 2). Differences in the material resources available to parents at the top and bottom of the socioeconomic spectrum will be more marked in the United States than in other countries and will be offset less by public policy. By this logic, the SES gradient should be weaker in Germany than in the United States, given its lower Gini coefficient and higher social spending, but the German gradient is equally as large, if not larger. Our supplementary analyses showed that the disadvantageous composition of low SES groups in Germany, in terms of migrant status, home language, and family structure, plays some role in accounting for its exceptionally strong gradient in early literacy skills, but this does not provide a full explanation.
The most obvious interpretation is that Germany’s early tracking system creates very strong incentives for parents to prioritize children’s academic performance in the early-to-mid-childhood period in attempts to secure access to an academically oriented gymnasium at age 10 rather than in intermediate Realschule or vocationally oriented Haupschule. This is consistent with other research that has shown high SES gradients in early tracking countries are already evident in primary school before tracking has taken place (Rözer & van de Werfhorst, 2019; Strello et al., 2021). Further, relatively low levels of ECEC expenditure may inhibit the ability of low SES parents in Germany to access high-quality compensatory childcare settings. The childcare ideology in Germany has been described as “explicitly familial” in that, historically, publicly funded institutional childcare was socially stigmatized, mothers were viewed as the ideal caregivers of children, and church and family were relied upon when parental care was not possible (Lokteff & Piercy, 2012). It is possible, therefore, that the influence of parents, and mothers in particular, on children’s environments is offset less by exposure to contrasting extrafamilial environments in Germany than in other countries. Our finding that there is an unusually strong net effect of parental education on literacy skills in Germany, independent of income, is consistent with the idea that social grading in parental interactions disproportionately underlies the SES gradient relative to social grading in financial resources. Nevertheless, it is still somewhat surprising that the SES gradient is stronger in Germany than in the United States, a country with far higher income inequality and a much weaker social safety net.
Of course, age at school tracking and income inequality are only partial indicators of the degree of competitiveness in the education system and the economy, respectively. The incentives for parents to prioritize academic achievement in children early in the life course will depend on the extent to which achievement confers access to superior schools, classrooms, and universities and on the degree to which educational attainment determines economic opportunity, as opposed to factors like wealth or social connections. Nevertheless, this simplistic analysis suggests that the extent of the early SES gradient in a country results from a complex interplay of different factors, none of which are either necessary or sufficient to flatten achievement inequalities in isolation. While the overall degree of income inequality in a society may be relatively resistant to policy initiatives, avoidance of competitive high-stakes transition points in the education system and state support for early childhood services are potential mechanisms that can respectively act on parental incentives and constraints to help mute socioeconomic differences in the early years.
Moreover, the striking stability in the SES gradients at age 6–8 and those at age 15 reported in PISA suggest that reducing inequalities before school entry may have far-reaching effects on social mobility. This proposition is further supported by findings from longitudinal research showing that inequalities change relatively little over the course of schooling (e.g., Bradbury et al., 2015; Farkas & Beron, 2004; Skopek & Passaretta, 2021) and from ILSA research that the ranking of countries in terms of SES gradients in primary and secondary school is relatively stable (Contini & Cugnata, 2020). However, the case study of France reminds us that caution is needed when focusing attention exclusively on environments in the early years. The strong French SES gradient in PISA suggests that the benefits for equality of its world-leading preschool system are eroded throughout primary and lower secondary schooling, such that it ends up with an internationally high gradient by age 15, with a level similar to that in Germany. Progress in elementary schooling is very unequal depending on the student’s social background (Caille & Rosenwald, 2006), tending to enlarge the initial SES gap in skills. The reasons for the enlarging gap are unclear, although factors noted by Doepke and Zilibotti (2019), such as the extremely hierarchical teacher-led nature of the French schooling system, its high rates of grade repetition, and the existence of elite prestigious lycées and grandes écoles, may play a role. Further research using longitudinal data is needed to help understand the factors that can successfully sustain low inequalities at school entry over the longer term or that can remediate high inequalities.
Limitations
Several limitations should be considered for the interpretation of our results. First, our measures of achievement are not directly comparable across countries because achievement was assessed with different tests, which assessed different subdomains of literacy. A direct comparison of achievement at school entry would only be possible if at least some of the items had been used in all countries (Majoros et al., 2021). Second, we must assume that parental education and income have been measured with similar precision in all countries. Furthermore, we could not analyze other dimensions of SES, which are also likely correlated with achievement, like occupational class or wealth (Bukodi & Goldthorpe, 2013). SES gradients would be even larger when including these dimensions, too. Third, there are differences in the age and birth cohort of children in different countries, which could be an alternative explanation for the differences in countries. The analyzed cohorts for France, Germany, and the United States are younger, and the analyzed cohort in the United Kingdom is slightly older than the cohort of children participating in PISA 2018. Fourth, the Japanese sample is comparatively small, resulting in unprecise estimates. Fifth, we only analyzed data from Rotterdam and not representative data from the Netherlands. Results may look different when considering the population nationwide.
Supplemental Material
sj-docx-1-ero-10.1177_23328584241299794 – Supplemental material for Cross-national Differences in Socioeconomic Achievement Inequality in Early Primary School: The Role of Parental Education and Income in Six Countries
Supplemental material, sj-docx-1-ero-10.1177_23328584241299794 for Cross-national Differences in Socioeconomic Achievement Inequality in Early Primary School: The Role of Parental Education and Income in Six Countries by Jascha Dräger, Elizabeth Washbrook, Thorsten Schneider, Hideo Akabayashi, Renske Keizer, Anne Solaz, Jane Waldfogel, Sanneke de la Rie, Yuriko Kameyama, Sarah Kwon, Kayo Nozaki, Valentina Perinetti Casoni, Shinpei Sano, Alexandra Sheridan and Chizuru Shikishima in AERA Open
Footnotes
Acknowledgements
We acknowledge the following data sources for the current paper: France: We are grateful to the DEPP institute for allowing us to use their data, as well as for helping us with data variables and documentation. Germany: This paper uses data from the National Educational Panel Study (NEPS). The NEPS is carried out by the Leibniz Institute for Educational Trajectories (LIfBi, Germany) in cooperation with a nationwide network. Japan: The data for this analysis, Japan Household Panel Survey (JHPS/KHPS) and Japan Child Panel Survey (JCPS), were provided by the Panel Data Research Center (PDRC), Keio University. Netherlands: The Generation R Study is conducted by the Erasmus MC, University Medical Center Rotterdam, in close collaboration with the Erasmus University Rotterdam and the city of Rotterdam. We gratefully acknowledge the contribution of children and parents. The general design of Generation R Study is made possible by long-term financial support from Erasmus MC, University Medical Center Rotterdam, Netherlands Organization for Health Research and Development (ZonMw), and the Ministry of Health, Welfare and Sport. United Kingdom: We are grateful to the Centre for Longitudinal Studies (CLS), UCL Social Research Institute, for the use of these data and to the UK Data Service for making them available. However, neither CLS nor the UK Data Service bears any responsibility for the analysis or interpretation of these data. United States: The US results are based on restricted-use data from the Early Childhood Longitudinal Study: Kindergarten Class of 1998–99 (ECLS-K). This study is sponsored by the National Center for Education Statistics (NCES) at the U.S. Department of Education and conducted by Westat with assistance from the Survey Research Center (SRC) and the School of Education at the University of Michigan and from Educational Testing Services (ETS). The findings reported in this paper are solely the responsibility of the authors and do not necessarily represent the official views of NCES or other agencies.
Declaration of Conflicting Interests
The author(s) declared no potential conflicts of interest with respect to the research, authorship, and/or publication of this article.
Funding
The author(s) disclosed receipt of the following financial support for the research, authorship, and/or publication of this article: The Development of Inequalities in Child Educational Achievement: A Six Country Study (DICE) is an Open Research Area (ORA)-funded project. We gratefully acknowledge funding support from the Economic and Social Research Council (ESRC Grant ES/S015191/1, United Kingdom); the Agence Nationale de la Recherche (ANR grant ANR-18-ORAR-0001, France); the Deutsche Forschungsgemeinschaft (DFG, Germany, SCHN 1116/1-1; WE 1478/12-1); the Nederlandse Organisatie voor Wetenschappelijk Onderzoek (NWO, The Netherlands, grant number 464.18.102); and Japan Society for the Promotion of Science (JSPS, Japan, grant number JPJSJRP 20181402, 21H04982, 22H04911).
Notes
Authors
JASCHA DRÄGER is a postdoctoral researcher at the German Institute for Economic Research (DIW Berlin), department Socio-Economic Panel; email:
ELIZABETH WASHBROOK is professor in quantitative methods at the School of Education, University of Bristol, email:
THORSTEN SCHNEIDER is professor of sociology with a special focus on social stratification in advanced societies at the Leipzig University in Germany; email:
HIDEO AKABAYASHI is professor at Keio University, Japan; email:
RENSKE KEIZER is professor in family sociology at the Erasmus University Rotterdam; email:
ANNE SOLAZ is senior researcher at the French Institute for Demographic Studies (INED); email:
JANE WALDFOGEL is a professor at Columbia University School of Social Work and a visiting professor at London School of Economics; email:
SANNEKE DE LA RIE is senior researcher at Statistics Netherlands; email:
YURIKO KAMEYAMA is associate professor at Keio University, Japan; email:
SARAH KWON is a postdoctoral scholar at the Crown Family School of Social Work, Policy, and Practice at the University of Chicago; email:
KAYO NOZAKI is associate professor at Osaka University of Economics, Japan; email:
VALENTINA PERINETTI CASONI is a research associate at the University of Bristol; email:
SHINPEI SANO is professor at Kobe University, Japan; email:
ALEXANDRA SHERIDAN is research assistant in the DICE project at the French Institute for Demographic Studies (INED); email:
CHIZURU SHIKISHIMA is professor at Teikyo University, Japan; email:
References
Supplementary Material
Please find the following supplemental material available below.
For Open Access articles published under a Creative Commons License, all supplemental material carries the same license as the article it is associated with.
For non-Open Access articles published, all supplemental material carries a non-exclusive license, and permission requests for re-use of supplemental material or any part of supplemental material shall be sent directly to the copyright owner as specified in the copyright notice associated with the article.