
Abstract
National interest is growing in Integrated Student Support (ISS) interventions, which offer schools systematic ways to reduce barriers to learning. The present study exploits the random component embedded within the school assignment system of a large urban school district to estimate the effect of schools providing ISS on student academic achievement at third, fourth, and fifth grade. The sample included students (N = 2,342) randomly assigned to schools—with or without ISS—via enrollment lottery. Students assigned to schools implementing ISS demonstrated higher achievement (from approximately .02% to more than 50% of a standard deviation) than those assigned to control schools. While we found some evidence for the efficacy of ISS by third grade, treatment effects were consistently largest and proved most robust across modeling strategies at fifth grade. The practical significance of these findings is discussed with attention to ongoing national efforts to improve the learning opportunities of economically disadvantaged students.
Keywords
Introduction
Economically disadvantaged children in the United States face major obstacles to academic success, despite decades of policy and practice remediation efforts (García & Weiss, 2017; Kaushal et al., 2011; Reardon, 2013). This inequity has serious consequences for the educational attainment and life outcomes of students, at tremendous costs to society (Holzer et al., 2008); for example, it has been estimated that children growing up in extreme poverty are up to twelve times less likely to graduate from high school than youth from middle-class families (Duncan et al., 1998). One reason schools struggle to support the learning of children experiencing poverty is that many of its causes of underachievement exert their influence outside of school. Inadequate nutrition, exposure to chronic stressors in the community, and limited learning stimulation in the home are but a few of poverty’s many mechanisms of harm that have been typically beyond the reach of schools (Dearing, 2008).
In the last decade, however, there has been increasing interest in the potential for schools to partner with community agencies as a means for reducing barriers to learning in a more integrated and comprehensive manner than schools can accomplish alone. Many such approaches seek to create systems (e.g., through dedicated staff roles and meeting structures) for schools to understand individual students’ strengths and needs, connect them to community supports that can benefit them, and follow up, monitoring progress. These approaches, broadly described under the umbrella term of Integrated Student Support (ISS), have shown promise for improving student outcomes.
To date, while multiple studies have provided empirical support for ISS, the evidence has been largely based on findings from non-experimental studies (Moore et al., 2014, 2017). Exceptions include two studies of an ISS intervention that randomized treatment within high schools; one found short-term achievement gains (ICF International, 2010) and one found positive effects on attitudes toward school but no achievement effects (Parise et al., 2017). 1 Notably, the studies employing randomization to date have involved secondary schools, and because they involved within-school randomization (i.e., student-level randomization in which students in the same high schools are randomly assigned to receive ISS or not) are susceptible to potential leakage effects, having comparison students either directly or indirectly influenced by treatment (e.g., through possible ISS impacts on teachers, school climate, or other school, classroom, or classmate factors). There remains a need for study of elementary school effects of ISS employing methods that can bolster the case for causal influence.
The present study advances this effort using a large natural experiment whereby children were randomly assigned to schools with and without ISS. Capitalizing on a kindergarten enrollment lottery process in a large urban school district that implemented an ISS intervention program in several elementary and K to 8 schools, we test the causal hypothesis that schools implementing ISS improve achievement for students. The ISS intervention program on which the present study is focused has demonstrated promising evidence in quasi-experimental studies. Yet, until now, the natural experiment created by school admissions lotteries has yet to be exploited. In the following sections, we synthesize the available literature on ISS models, describe the ISS model of focus in the present study (City Connects), and describe the kindergarten lottery process that made it possible to estimate causal impacts.
Poverty, Children’s School Achievement, and “Integrated Student Support” Interventions
A robust interdisciplinary literature has documented the many risks faced by children growing up poor (e.g., Brooks-Gunn & Duncan, 1997; Conger & Donnellan, 2007; Evans, 2004; Leventhal & Brooks-Gunn, 2000; Magnuson & Votruba-Drzal, 2009). Despite documented strengths of families living in poverty (e.g., González et al., 2005; Moore et al., 2002), these risks are significant. In the neighborhood, children and families in poverty face exceptional risks of exposure to toxins (e.g., lead poisoning) and stressful experiences (e.g., violence) as well as inadequate access to institutional resources (e.g., libraries, hospitals, grocery stores, public green spaces) (Evans, 2004; Leventhal & Brooks-Gunn, 2000). In the home, financial constraints seriously limit the quantity and quality of learning resources and supports (e.g., books, toys, consistent housing, and adequate lighting and space for studying) and interfere with parent-child relationships, as economic stress tends to undermine parenting engagement in learning interactions with their children as well as consistency and warmth (Bradley et al., 2001; Brooks-Gunn & Duncan, 1997; Conger & Donnellan, 2007). In turn, these risks have been linked with problems in brain neural development, cognitive functioning, and self-regulation beginning in infancy and with accumulating harm through childhood when exposure is chronic (Hanson et al., 2013; Johnson et al., 2016; Noble & Farah, 2013; Shanks & Robinson, 2013).
Given the risk that children in poverty face outside of school and the consequences of those risks for their learning in school, scholars have increasingly questioned whether schools can afford to focus exclusively on curriculum and instruction. Over the past decade there has been growing national recognition that schools must find ways to address the varied needs of children (Moore et al., 2014, 2017). This recognition has only accelerated with the myriad challenges faced by students living in poverty during the COVID-19 pandemic. Researchers, practitioners, and the federal government have called for comprehensive strategies that leverage community resources to mitigate the impact of out-of-school risk factors and economic inequality on student academic achievement and life chances (García & Weiss, 2017; U.S. Department of Education, 2017, 2021). One such approach to this challenge is ISS.
ISS programs were developed with the assumption that schools could in fact be transformed to address the multifactorial and dynamic nature of the risks faced by children living in poverty by identifying and addressing these complex risks and then tailoring a plan of supports (Moore et al., 2014, 2017). ISS programs are often implemented by a core person (such as a school counselor) who ensures that children are evaluated to identify both academic and non-academic barriers to learning; children and families are connected with resources to address needs as well as enrichment services that support child and family strengths and interests (e.g., music, arts, sports programs).
The City Connects Intervention
The City Connects model of integrated student support was developed and refined over the past two decades amid the growing concern for the burgeoning diversity, scale, and severity of the barriers to student learning. Developed through a university collaboration with a large, urban public school district and local community agencies, City Connects is based on theoretical and empirical understandings from developmental science for how comprehensive student support can be expected to impact student outcomes. The mission of City Connects is to help students achieve and thrive by connecting each and every child to a tailored set of prevention, intervention, and enrichment services that are available both in their school and in their communities (Walsh et al., 2014). Providing tailored services that support students’ individual strengths and needs serves to promote resilience (Masten, 2015; Masten et al., 2008) and connections across developmental contexts (e.g., family, school, and community (Bronfenbrenner & Morris, 1998; Garcıa Coll et al., 1996). First implemented in six elementary schools in 2001, City Connects has been scaled over time and now serves more than 175 schools across five states.
At the center of the City Connects program is a full-time Masters’-level licensed school counselor or social worker (Coordinator) who meets with each classroom teacher in the fall of each school year to review every student’s strengths and needs. Reviews are carried out using a protocol that elicits teacher insights across the developmental domains of (1) academics, (2) social-emotional/behavioral development, (3) health, and (4) family. This review process informs the development of an individualized support plan designed to build on each child’s strengths and interests and also to meet specific needs.
Through a secure online database that centralizes information about student needs and community resources, each student is then linked to a tailored set of services and enrichment opportunities that address his or her unique strengths and needs. For example, one student might be referred to a health service for an unmet physical need and also be linked with an afterschool program that provides evening meals. Another student demonstrating strength in art might benefit from an enrichment program at a museum. Coordinators also find programs and resources that can be delivered in the school to entire classrooms or grade levels to address wider opportunities and needs. Children identified as having intensive needs at any point during the school year receive a more in-depth individual review with a wider team of professionals who follow a detailed protocol to develop specific measurable goals and strategies for each student. Throughout the year, the Coordinator develops and maintains partnerships with community agencies and works closely with families. The development and implementation of a plan for every student is feasible because of the online database of resources, manuals, and online tools to support a standardized set of protocols and practices, and oversight mechanisms. Processes for follow-up with both agencies and families help Coordinators ensure that the right constellation of supports is in place or the plan is adjusted accordingly. Fidelity monitoring provides scores for each of seven core model components to further enhance feasibility and support accountability by providing data regarding evidence of standard implementation across school sites.
In previously published analyses, City Connects has been evaluated using non-experimental designs. Using propensity-score weighted estimates of treatment effects, for example, students who attended high-poverty elementary schools that implemented City Connects demonstrated significantly higher achievement than students in high-poverty comparison elementary schools, including higher fifth-grade report card scores in reading, writing, and math as well as higher GPAs and statewide standardized test scores in English language arts and math in middle school (Walsh et al., 2014). In addition, immigrant students who experienced City Connects in elementary school significantly outperformed immigrant students who never experienced the intervention on both reading and math achievement test scores, with the benefits of the intervention being most pronounced for immigrant students who were English-language learners (Dearing et al., 2016).
Attending elementary schools implementing the City Connects intervention has also demonstrated associations with higher educational attainment when using propensity score weighting to adjust for student- and family-level selection factors. For example, youth who attended City Connects elementary schools from kindergarten through grade 5 dropped out of high school at about half the rate of other children in the district during the same time period (Lee-St. John et al., 2018). After completing high school, students who previously attended City Connects elementary schools had a higher probability of enrolling in and, once enrolled, had a higher probability of completing two- and four-year college programs than comparison peers (Pollack et al., 2023).
This quasi-experimental evidence is encouraging and consistent with the causal hypothesis, but in the absence of randomization concerns about internal validity remain. The current study seeks to bolster extant evidence by exploiting a natural experiment in which students were randomly assigned to schools with or without City Connects through an enrollment lottery process. Given the previous studies summarized above, the present study does not claim to test new predictions, but rather is seeking to determine whether past quasi-experimental findings can be replicated and extended using a different methodology that has potential to add evidence that the beneficial effects associated with City Connects are in fact caused by City Connects.
Exploiting Lotteries to Test Causal Hypotheses in Education Research
A number of urban school districts assign students to schools using a centralized process based on the Gale-Shapley Deferred Acceptance (DA) algorithm (Abdulkadiroğlu et al., 2017). Typically, in this assignment process, students rank their school choices in order of preference, with a maximum number of choices permitted. If the number of applicants is larger than the number of available seats at a particular school, a random process is invoked. Applying students are assigned to a priority group at each school based on particular characteristics, which can be considered as the schools’ preferences over students. For students selecting the same school and belonging to the same priority group (i.e., tied on ranking within that school), a randomly generated lottery number is used to break the tie and determine who gets placement. Thus, conditional on application cycle, school preference, and priority group—that is, a “risk set”— the system produces random assignment with known probabilities (Abdulkadiroğlu et al., 2017). This conditional random assignment can then be capitalized on to create an instrument indicating whether or not a student receives a random offer to attend one of their preferred schools. Using this randomly generated offer to attend a treatment school as an instrument in instrumental variable regression analyses allows us to mitigate selection bias that would otherwise be present in naïve regression estimation approaches where treatment school attendance is non-random and most surely contains endogenous variation.
Several research studies have used the random component embedded in school assignment mechanisms to estimate the impact of other educational interventions (for example, Abdulkadiroğlu et al., 2013, 2014; Dobbie & Fryer, 2011a, 2011b, 2015; Dynarski et al., 2018; Weiland et al., 2020). However, as Abdulkadiroğlu et al. (2017) point out, a limitation of some of these studies is that they fail to exploit the full random variation within assignment systems. Lottery studies that only consider students’ first choice and ignore students who get assigned to a school during later iterations of the assignment process decrease the potential analytic sample considerably; moreover, the lottery instrument does not accurately represent school offers for cases assigned later in a multi-step algorithmic process (Abdulkadiroğlu et al., 2017). Some studies have considered the full set of school choices and priority rankings and looked at lottery offer differences within such strata, but this also considerably reduces degrees of freedom and sample size (Abdulkadiroğlu et al., 2017). Both approaches are limited in that they only consider oversubscribed schools and thereby fail to account for randomization into undersubscribed schools that happens in an iterative process when a student has been randomized out of schools to which s/he has previously applied.
In the present study, we take advantage of the Deferred Acceptance (DA) propensity score developed by Adbulkadiroğlu et al. (2017) to remedy these issues. They show that the propensity for being assigned to any particular school for every student can be calculated from lottery-based school assignment systems via simulation—repeatedly drawing lottery numbers for students at random and assigning them to schools using district assignment rules for each of the n randomly drawn lottery numbers. The average assignment rate across draws becomes the DA propensity score, representing a student’s risk of assignment. We then fit an instrumental variable regression to obtain causal treatment effects by conditioning on the DA propensity score along with students’ lottery offer to attend either a treatment or control school using two-stage least squares estimation. An advantage of this method is that it allows for the inclusion of students randomized to schools that are “undersubscribed” via lottery randomization out of more-preferred, oversubscribed schools. Consequently, this approach identifies the maximal set of applicants subjected to randomization and appropriately pools students with different sets of school preferences and priority rankings (but the same conditional probability of being assigned to a particular school), thus boosting analytic sample size and power as well as generalizability of the estimates (Abdulkadiroğlu et al., 2017). More recently, this approach has been leveraged to estimate the causal impact of universal preschool in Boston (Gray-Lobe et al., 2021), and the impact of Newark charter schools on student achievement (Winters, 2020).
The Present Study
Capitalizing on the randomization embedded in the kindergarten lottery assignment process for a large urban school district that implemented City Connects in a subset of schools, we estimate the impact of ISS on elementary school achievement in mathematics and English language arts. Specifically, we test the following hypothesis: children randomly assigned to elementary schools implementing City Connects through an enrollment lottery process will demonstrate higher scores on state achievement tests in mathematics and English language arts than children assigned to elementary schools in the same district that were not implementing City Connects.
Methods
Data
Anonymized student data were provided by a large urban school district, Boston Public Schools, in which City Connects was implemented in select schools during the years 2006–2013. Data included student kindergarten preference lists and associated enrollment lottery variables; school enrollment information; demographic characteristics (race, gender, eligibility for free- or reduced-price lunch, English learner status, immigration status, and special education status); and academic performance measures (report card scores and scores on the state assessment in English language arts and mathematics). To finalize student demographic variables in our data, the authors created time invariant demographic variables using an if-ever coding scheme, i.e., if a student was ever designated to a group category across all years, then that student was coded as always having belonged to that group; for special education status, we created a set of dichotomous indicator variables for students’ most severe special education designation across all years, which is based on the amount of time students spend in a general education classroom (i.e., less than 25% time outside of GE; 25–65% of time out of GE). The students who received instruction in a substantially separate classroom (more than 65% of time out of GE) at any point in their elementary school career were excluded from the analytic sample. To code students’ eligibility for free- or reduced-price lunch, we use two dichotomous variables indicating whether students ever qualified for reduced-price or free lunch (Dynarski et al., 2021). For English learner status, we coded a value of 1 if the student was ever enrolled in secondary English instruction. Gender, race, and immigrant learner status variables never varied within students in our dataset.
In the following sections, we describe the kindergarten lottery assignment system in Boston Public Schools, the methods used to identify randomly assigned students, and the analytic sample.
Lottery Study Design
During the years 2006 to 2013, after which a new student assignment mechanism was implemented, families seeking kindergarten entry submitted a preference list of up to ten schools wherein they ordered their top ten school choices in order of most preferred to least preferred for their child. Additionally, for each school a family names in their school preference list, their child receives a priority ranking at that school, such as having a child’s sibling already attending the school or school proximity to the child’s home (e.g., one mile radius), which is used to ordinally rank prospective students within each school. Families’ school preferences along with their child’s priority rankings were then used to match children to schools using the Deferred Acceptance (DA) algorithm. Specifically, the algorithm matched each child to their most preferred school and slots were filled at that school in order of students’ individual priority rankings until school capacity was reached. Subsequently, any child rejected from their top choice was entered as an applicant to their next most preferred school, thereby competing with that pool of applicants in the same manner. This process continued until each student was matched with a school in the district (note that some kindergarten students were assigned to schools administratively for various reasons and thus did not participate in the lottery process).
A critical feature of this assignment algorithm is the use of randomly generated lottery numbers for tie breaking. Whenever children applying to the same school also shared the same priority ranking within that school, a tie occurred in the assignment mechanism. To address this, the district generated a single independently and identically distributed lottery number from a uniform distribution and used these lottery numbers to break ties and decide which students gained entry into their preferred school; specifically, the student with the lower randomly generated lottery number gained placement at the school for which they were competing. This tie-breaking process generated valuable data for program evaluation since although assignment of children’s individual priority rankings at each school was non-random, reliance upon randomly generated lottery numbers for breaking ties on priority ranking created conditional random assignment, i.e., lottery randomization (Angrist et al., 2017).
Identifying Random Lottery Offers
To leverage the conditional random assignment embedded within the assignment mechanism, the authors first needed to identify which children in the assignment process experienced ties and gained entry to a school via their randomly assigned lottery number. Although the district had already provided us with its school assignment data including children’s kindergarten preference lists, priority rankings at each school, district-generated child lottery numbers, and school offer and enrollment information, these data did not contain information on which of the children’s school offers from the assignment process relied on randomly generated lottery numbers for tie-breaking and thus were randomly determined. To figure out specifically which offers were subjected to lottery randomization, the authors first had to recreate the school assignment process using the exact rules and lottery numbers employed by Boston Public Schools so that we were confident we understood its mechanics. We subsequently checked our understanding empirically by examining the degree to which our results from recreating the school assignment process matched the actual school assignment results given to us by the district (i.e., classification accuracy).
To replicate the school assignment process, we recreated the Boston Public Schools’ school assignment algorithm by implementing the DA algorithm available in the “matchingR” package (Tilly & Janetos, 2018) available in R. The DA algorithm, along with the necessary user-specified inputs (i.e., child school preference matrix, priority ranking matrices, and a list of school capacities), was included within a custom wrapper function to simulate the school lottery assignment system. First, the school assignment system was simulated using the same rules employed by the district along with students’ actual district-provided lottery numbers and the results from this simulation was compared against actual school offer results provided by the district. This process was refined until a high degree of classification accuracy was reached (Abdulkadiroğlu et al., 2017). For the purposes of this study, we defined a high degree of classification accuracy as 95%, i.e., 95% of children were assigned to a school via simulation that matched the school they were actually assigned to via Boston Public Schools’ lottery. Table 1 shows the classification accuracy of our replication procedure for the fall of each academic year spanning 2006–2010, demonstrating that we achieved a classification accuracy of 96% of children, similar to those reported as satisfactory in previous lottery-based studies (e.g., Abdulkadiroğlu et al., 2017).
Baseline Deferred Acceptance (DA) Algorithm Classification Accuracy

After demonstrating an adequate understanding of the assignment mechanism by simulating the school assignment system a single time using district-provided student lottery numbers, we then began varying the randomly generated lottery numbers to see whose school offer is affected by lottery number randomization. To achieve this, the assignment algorithm was run
Holding everything else constant, i.e., assignment rules, priority rankings, and school preferences, and varying only the randomly generated lottery numbers ensures that any variation in children’s school assignment across the simulated runs of the school assignment process is solely a function of the randomly generated lottery number. This allowed the authors to identify the set of children subjected to lottery randomization by examining the frequency with which children were assigned to City Connects schools across the simulated runs, the DA propensity score (Abdulkadiroğlu et al., 2017). If students were assigned to schools based only on school preference and priority ranking, which is fixed, then their assignment would be constant across simulation runs and thus have a corresponding frequency of assignment to a City Connects school of either 0 (representing never) or 1 (representing always). In accordance with this, cases with scores between (0, 1) were identified as being subjected to randomization to a treatment school and retained for analysis. Figure 1 exhibits the step-by-step process we took to identify random lottery offers used for estimating causal effects.
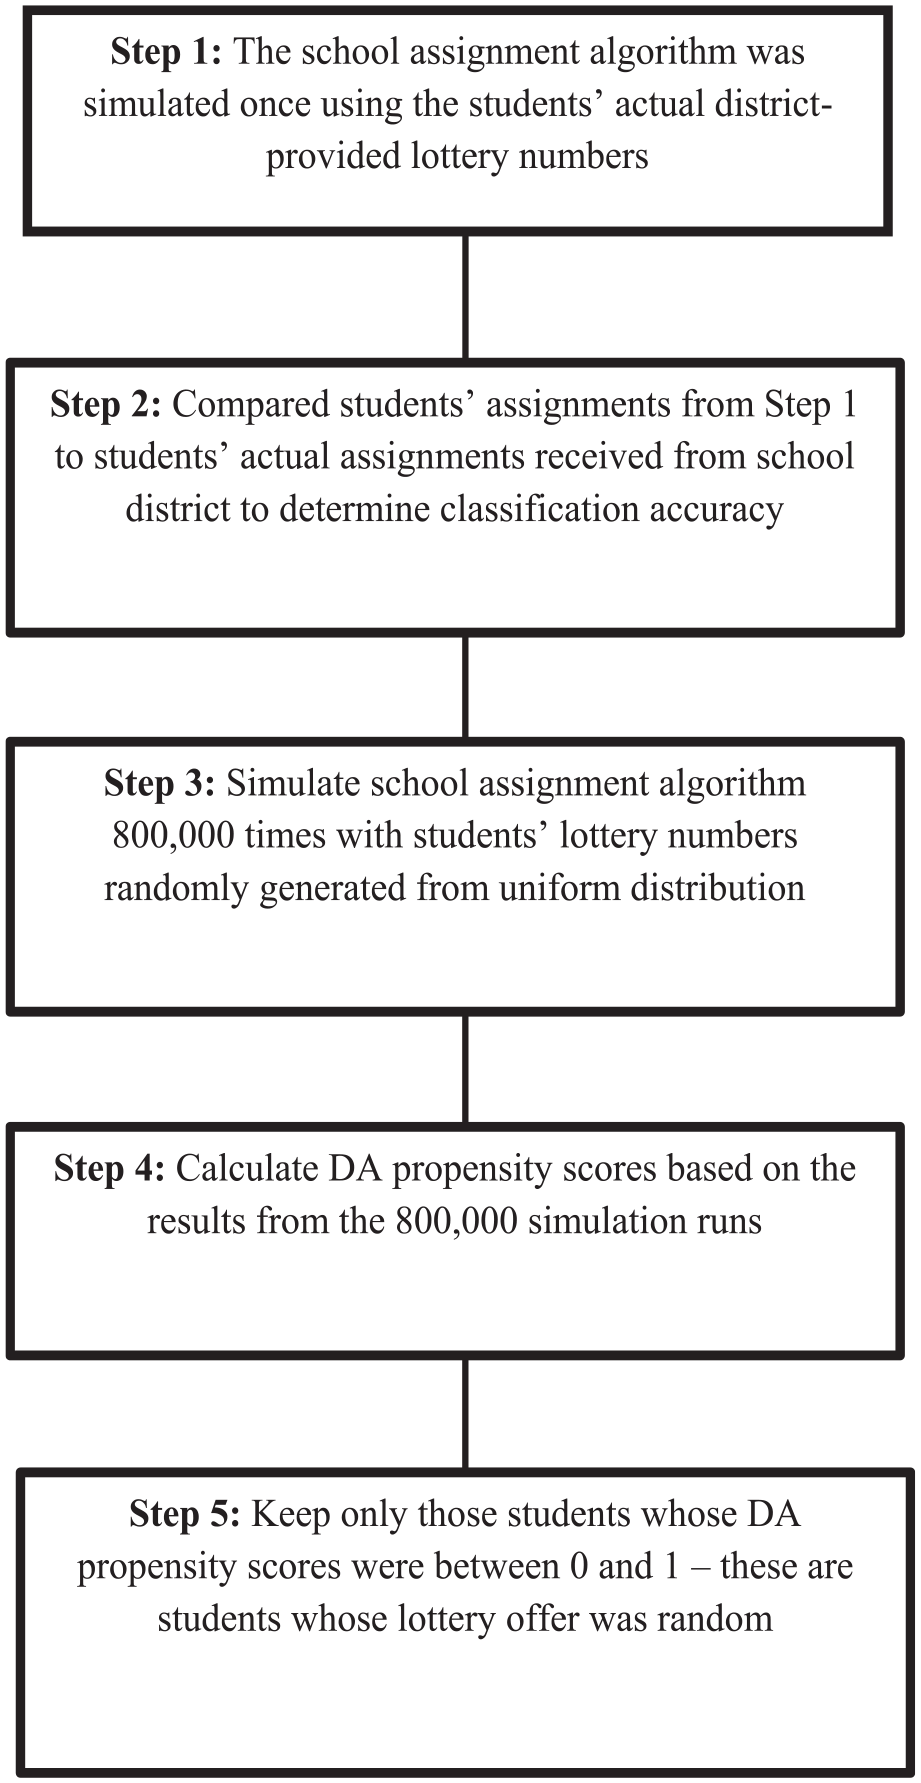
Step-by-Step Process of Identifying Random Lottery Offers.
Analytic Sample
During the study years, the number of schools in the district implementing City Connects varied between five and seventeen. Schools were not randomized into treatment conditions; instead, neighborhood clusters of schools were selected by district administration to implement City Connects based on having low average standardized test scores and high rates of poverty (as measured by percentage of students receiving free or reduced-price lunch). Table 2 presents implementation data for treatment schools in the analytic sample on key features of the intervention during the time under study, collected as part of the practice’s fidelity measurement system. In these years, nearly all students (99–100%) in schools implementing City Connects received a personalized support plan after a review with the coordinator and a teacher; most students (75–99% of a school) received at least one support or enrichment service. Multiple community partners were engaged in providing services, with the total number of partners per year ranging from 96 to 322. In general, fidelity of implementation is predicted to increase slightly over time as a natural consequence of the nature of City Connects: many elements of the practice can be implemented with high fidelity starting in a school’s first year (e.g., all students receive an individualized review of strengths and needs and a support plan), but a few elements tend to evolve over time (e.g., the number of community partnerships for a given school grows as the practice becomes more embedded in the community).
Implementation Data for Study Schools on Key Components of City Connects, by Year
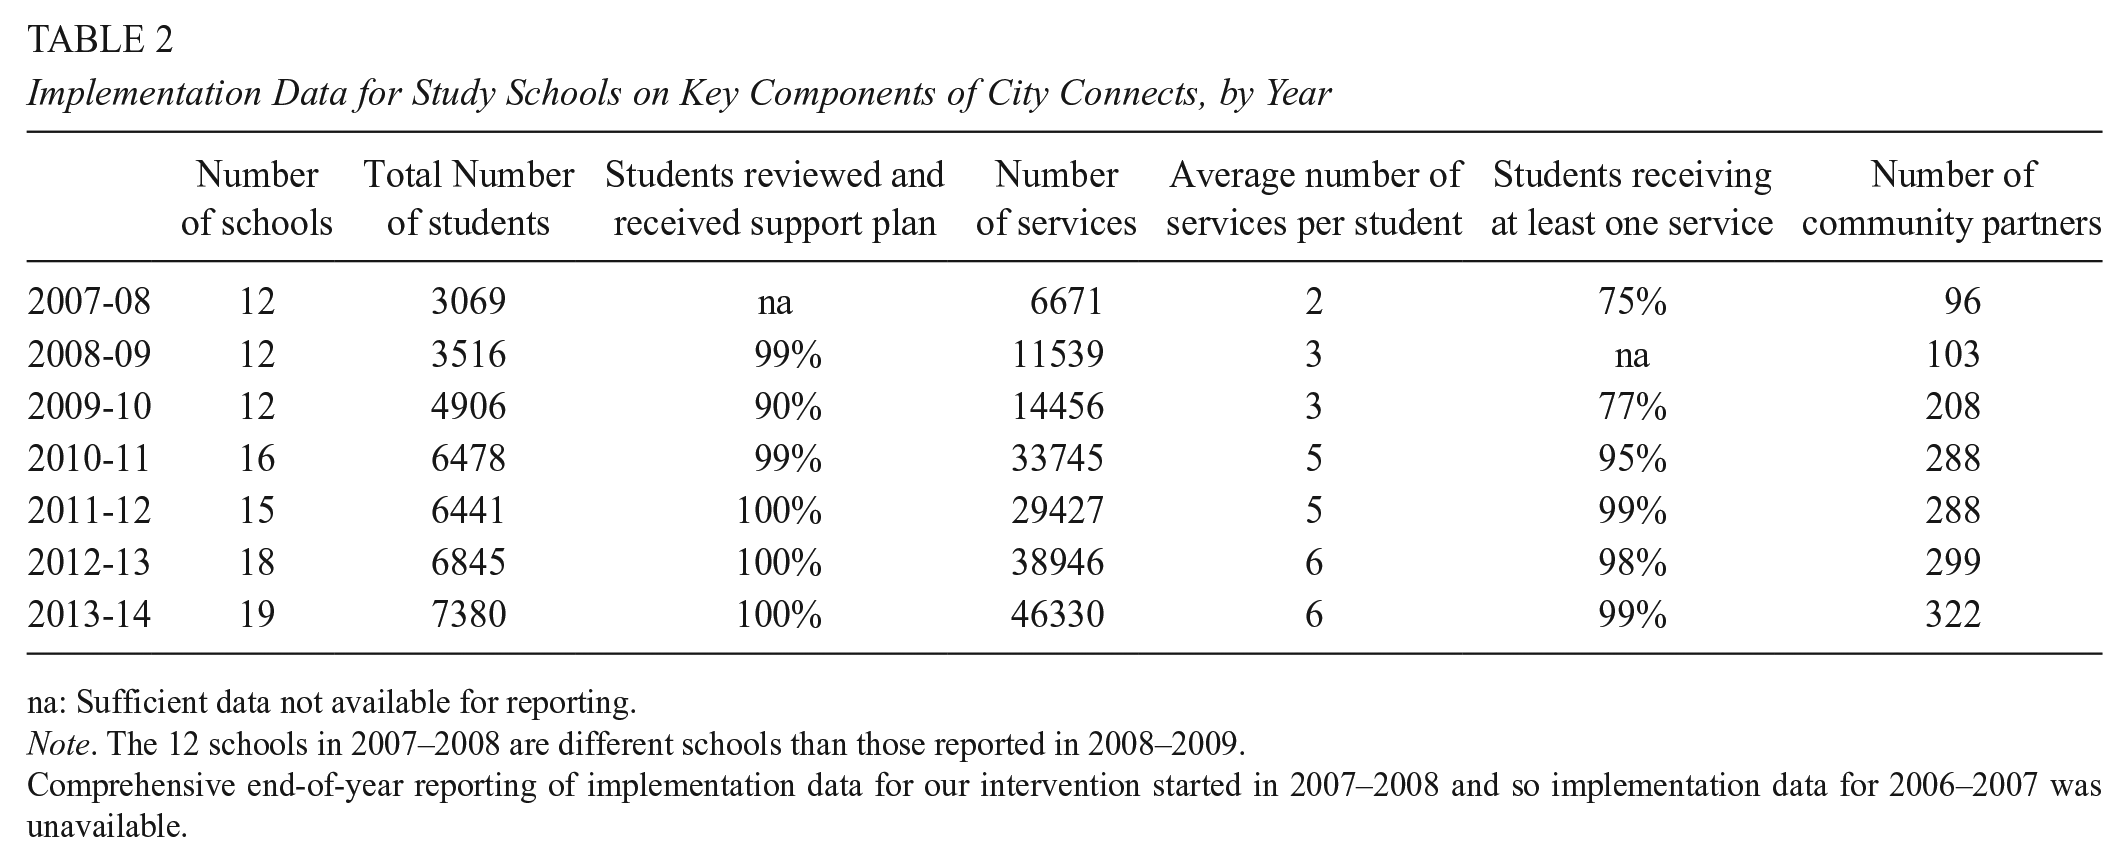
na: Sufficient data not available for reporting.
Note. The 12 schools in 2007–2008 are different schools than those reported in 2008–2009.
Comprehensive end-of-year reporting of implementation data for our intervention started in 2007–2008 and so implementation data for 2006–2007 was unavailable.
During the time of this study, non-treatment schools in the district also had student supports and services available that varied from school to school, but they did not utilize a structured support model with a designated coordinator and review of all students. Although student-level service data and partnership data was not available for non-treatment schools in the same way as for City Connects schools, a review of comparison school artifacts, processes, partnership data, and descriptions by leaders such as principals, assistant principals, and teachers in these comparison schools revealed several differences (Bowden et al., 2020). For example, comparison schools (a) lacked systematic screening processes for understanding student needs; (b) were primarily focused on crisis responses rather than proactive reviews; (c) tended to focus on academic and one or two additional domains in contrast to the full set of four developmental domains addressed in City Connects schools; and (d) reported 4–9 partnerships per school, in contrast to 39–47 community partners per City Connects school (Bowden et al., 2020).
In 2006, the first year of this study, treated and comparison schools did not differ significantly by school size (number of students), proportion of students by race/ethnic groups, English language learner status, economic disadvantage status, or special educational needs; or by percent of grade 3 students achieving proficient or advanced categories on the state assessment for both English Language Arts and mathematics. While schools did not have the opportunity to opt into City Connects or not, it is important to note a limitation to the methodology in this study: that there may be unobserved characteristics of schools that were assigned to City Connects that could be influencing results.
The final analytic sample included five cohorts of children who sought entry into a kindergarten program in Boston Public Schools during the 2006–2007 through 2010–2011 school years, whose offer to attend kindergarten was determined via school lottery, and whose lottery records could be linked to academic outcomes and demographic data. Students who didn’t participate in the school lottery process were assigned to a district school through administrative decision-making or other non-random mechanisms. Because the school assignment mechanism for these children is unknowable, we exclude them from our analyses, focusing only on the subset of children who participated in their district lottery process and for which the assignment mechanism is known. Moreover, children who received classroom instruction in substantially separate special education placements were excluded from the sample. Of the 8,211 children who applied for kindergarten entry during this period, 2,342 received an offer that was determined via random lottery, and 5,869 had DA propensity scores that were either 0 or 1 and therefore were assigned to schools non-randomly. A DA propensity score of either 0 (representing never assigned) or 1 (representing always assigned) means that the randomly generated lottery number for a given student never factored into their school assignment across the simulated runs of the assignment process and thus students were assigned to schools based only on school preference and priority ranking, which are non-random. For this reason, we excluded these students from our analyses. Figure 2 illustrates the steps we took to generate our lottery analytic sample.

Process for Identifying Lottery Analytic Sample.
Of the randomly assigned students in our sample, approximately 56% were assigned to a school that implemented the intervention by the time they were in fifth grade. By third, fourth, and fifth grade, these students could have received a maximum of four, five, and six years of the intervention, respectively; on average, students in the treatment sample who complied with their lottery assignment received 2.9, 3.2, and 3.6 years of the intervention. Based on the availability of outcome data, the fourth-grade analytic sample included only the first four cohorts, and only the first three cohorts are included in the fifth-grade analytic sample. Once children’s lottery records, demographic characteristics, and academic outcomes data were combined, the sample sizes were 1,357 for grade 3, 1,000 for grade 4, and 626 for grade 5.
Measures
Academic outcomes were represented by raw scores on the mathematics and English Language Arts (ELA) sections of the Massachusetts Comprehensive Assessment System statewide assessment at grades 3, 4, and 5. This state-administered standardized assessment had been administered since the early 1990s and used by the state to meet federal reporting mandates. Test reliability and validity have been well established (Massachusetts Department of Elementary and Secondary Education, 2010). Student score data were standardized by subject, grade, and school year to allow the model coefficients to be interpreted as predicted changes in standard deviation units and an index of effect size.
Estimating the Effects of City Connects Using Lottery Offers
To estimate the effect of schools implementing City Connects on student academic achievement at grades 3, 4 and 5, we used DA propensity scores from random lottery offers in two complementary models: instrumental variable and intention-to-treat regressions (Angrist et al., 2012). The instrumental variable regression model estimates the effect of schools implementing City Connects on academic achievement for children who complied with their lottery offer and, in fact, attended the school to which they were assigned for at least one term. In addition to the dichotomous treatment variable, we also estimated instrumental variable models for the number of years that students participated in treatment (i.e., attended a school implementing City Connects), otherwise known as dosage.
Note that the instrumental variable regression model does not provide information about the treatment effect for the approximately 35% of students in both treatment and control groups who did not comply with their lottery offer to attend a specific school. To address issues of non-compliance, we also estimated intention-to-treat regression analysis using the random lottery offer as the treatment variable. Details for the two regression approaches are presented in the following sections. However, before turning to these estimation strategies in further depth, it is also important to note a key difference between the natural experiment we exploit using the lottery and an ideal experiment: Ideally, students would be randomly assigned to schools and schools would be randomly assigned to receive the intervention. In comparison, lottery randomization only happens at the student-level; as a result, the identification strategy includes the effect of City Connects plus the potential for confounding effects of school-level differences between intervention and control schools. While we examined the association between receiving a lottery offer to a treatment school and certain school-level characteristics, we cannot fully address this limitation empirically. Nonetheless, lottery randomization at the student level does effectively rule out an entire class of endogeneity problems ubiquitous in non-experimental and quasi-experimental educational research: student-level selection and omitted variable bias.
Instrumental Variable (IV) Regression Model Approach
We estimated the localized average treatment effect (LATE) using a two-stage least squares instrumental variable regression using the random lottery offer as the instrument. DA propensity scores were used as covariates in the first- and second- stage equations of the IV analysis to control for assignment risk and create conditional random assignment. Predicted values from the first-stage regression were used as the treatment variable in a second-stage regression with student academic achievement as the outcome variable. Child-level covariates were included in both first- and second-stage regressions. Given that the outcome variables were standardized by subject, grade and school year, we used the regression coefficient as a measure of standardized effect size. Our instrumental variable regression model was as follows:
Second stage:

First stage:

Where
First-stage Estimates of Lottery Offer Effect on City Connects

***denotes p < .01.
Treatment dosage
In addition to estimating the effect of ever having received the treatment, we also use the same IV regression modeling approach to estimate LATE for dosage. Specifically, we estimated our dosage effect using the same equations shown in Equations 1A and 1B but instead set the variable
Intention-to-treat Regression Model Approach
For intention-to-treat models, the random lottery offer to attend an intervention or control school was the treatment variable in a regression model with academic achievement as the outcome. We conditioned the estimates on DA propensity scores to control for assignment risk; the random lottery offer in the regression model then captured the causal effect of randomly being offered a seat to attend a treatment school. Specifically, these models took the form:

Where
Heterogenous Treatment Effects
Heterogenous treatment effects were examined for gender, eligibility for free- or reduced-price lunch, and English learner status. Effects were estimated by including an interaction term between each of the aforementioned student demographic characteristics and a term capturing if-ever participation in the treatment,
Second stage:
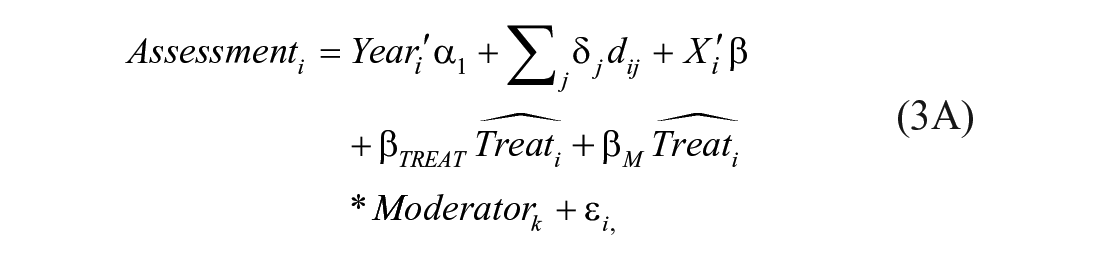
First stage:

Our intention-to-treat models used the random lottery offer to attend an intervention or control school as the moderator via the following:

Where
Results
Here, we present treatment effect estimates for grades 3, 4, and 5 from our two approaches: instrumental variable and intention-to-treat analysis. First, we report instrumental variable regression estimates of the localized average treatment effect (LATE) for students who received a random lottery offer to attend an elementary school implementing City Connects and complied with that offer. We discuss the results from our instrumental variable regression in both the context of if-ever dose and dosage. We then provide intention-to-treat regression estimates of the average treatment effect for children receiving a random lottery offer to attend a City Connects elementary school. We present the results by grade level as well as for a combined sample across grades.
Instrumental Variable (IV) Regression Model Results
First stage estimates of the instrument are presented in Table 3. For both treatment variables—ever treated and years of dosage—kindergarten lottery offer to enroll in a treatment school was strongly predictive of treatment compliance. This instrument was statistically significant at p < .01 and associated first stage F-statistic values were much larger than the recommended What Works Clearinghouse (2020) proposed threshold of 10 for all grade models. Recent econometrics literature, however, has proposed more stringent guidelines for assessing instrument relevance via F-statistics. Stock and Yogo (2005) cite that first-stage estimates greater than 16.4 in the single instrument case ensures a Type I error rate of no more than 10% (Keane & Neal, 2023). The F-statistics for our grade models are all equal to or are far greater than 29.5, far surpassing this criterion; in fact, the F-statistic for our grade 3 model (F = 159.7) surpasses even the most stringent criterion of F > 104.7 proposed by Lee et al. (2022), suggesting adequate instrument relevance. Moreover, given that lottery offers are randomly generated within risk sets and thus are uncorrelated with any measured or unmeasured confounders, it is plausible that our lottery instrument only impacts students’ standardized test scores through school allocation, making the exclusion restriction assumption tenable.
Estimates of the localized average treatment effect on academic achievement in grades 3 to 5 for children who complied with their random lottery offer are provided in Tables 4 and 5. At grades 3 and 4, children who were randomly assigned into schools implementing City Connects at kindergarten, and subsequently attended, scored between .02 standard deviations (σ) to .18 σ higher than those assigned to control schools. At these early grades, however, treatment effects did not reach statistically significant (p < .05) levels. At fifth grade, on the other hand, treatment effect sizes favoring those assigned to City Connects schools were considerably larger, −.57 σ higher achievement in mathematics and .63σ higher achievement in ELA—and statistically significant using the nominal unadjusted p-value (p < .05). However, when applying Bonferroni corrected p-values to control for the experiment-wise error rate, treatment effect sizes are no longer statistically significant (p = .32), albeit still of large magnitude.
Instrumental Variable Estimates of City Connects Effect on

Note. Standard errors, in parentheses, are clustered by school in the individual grade analyses and by student in the combined grade analyses. Adjusted p-values represent Bonferroni corrected p-values to control for multiple hypothesis tests.
Instrumental Variable Estimates of City Connects effect on
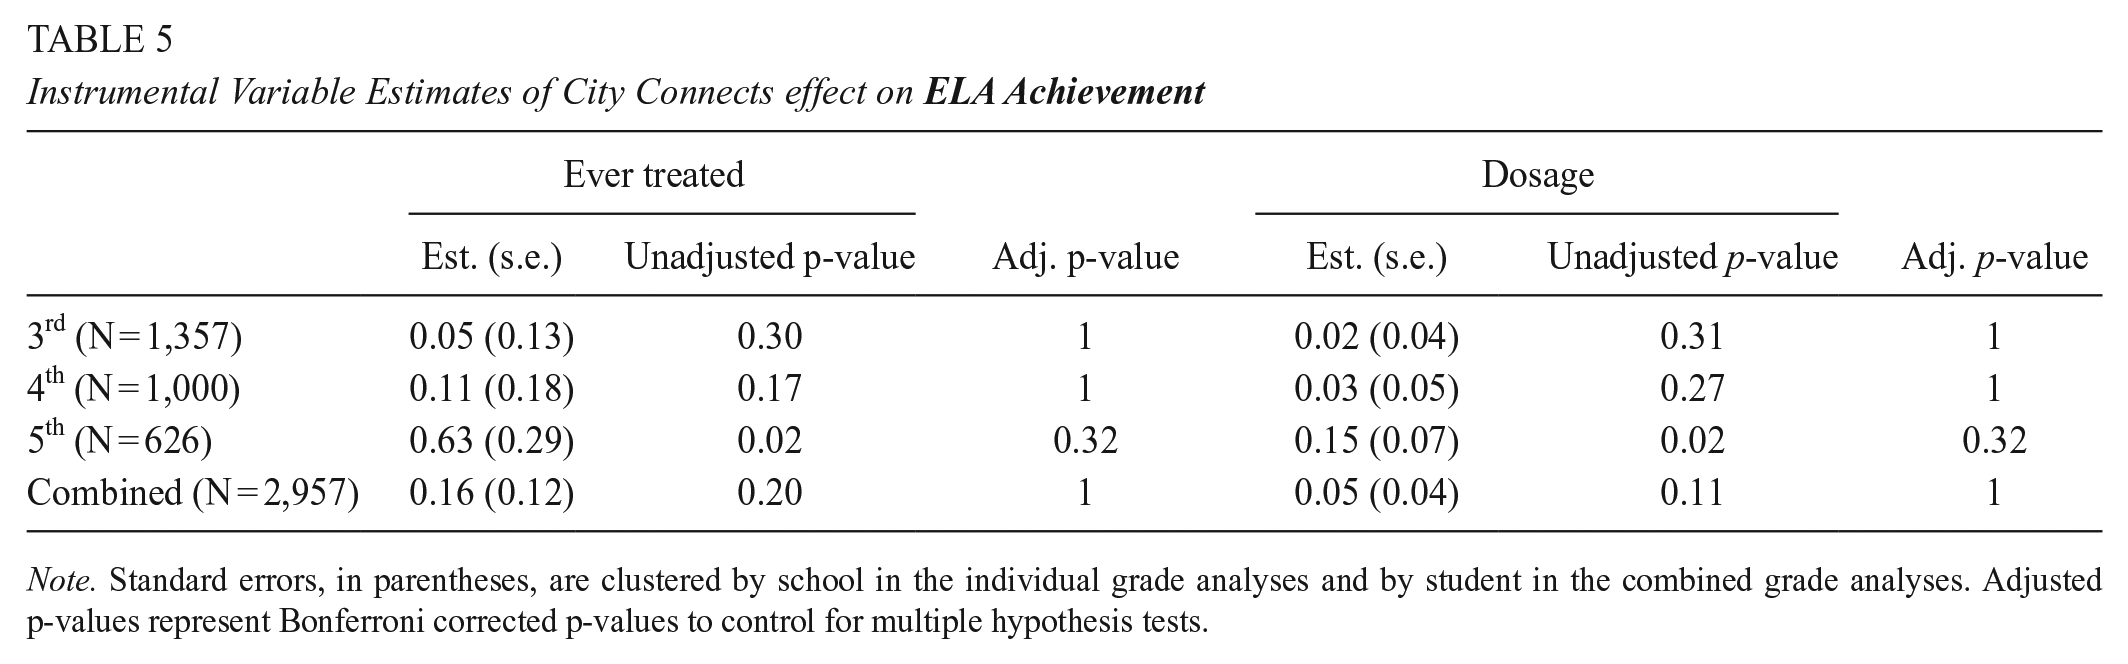
Note. Standard errors, in parentheses, are clustered by school in the individual grade analyses and by student in the combined grade analyses. Adjusted p-values represent Bonferroni corrected p-values to control for multiple hypothesis tests.
Using the recent guidelines for magnitude of effect set forth by What Works Clearinghouse (2020) and Kraft (2020), these effect sizes at fifth grade appear substantively meaningful with significant educational and policy relevance (Kraft, 2020). Further underscoring practice and policy relevance, each year of dosage yielded an average effect size of .14σ in math and .15σ in ELA.
Intention-to-Treat Regression Model Results
Tables 6 and 7 provide intention-to-treat estimates for children’s academic achievement in grades 3 to 5. At grades 3 and 4, achievement gains favoring children in City Connects schools ranged from .04 to .07σ, but similar to our IV estimates did not reach statistically significant levels. However, also consistent with our IV estimates, children in schools implementing City Connects scored, on average, .21σ higher in grade 5 in mathematics and .23σ in ELA than their non-treatment peers, significant differences based on nominal unadjusted p-values (p < .05). However, once again, when applying Bonferroni corrected p-values to control for the experiment-wise error rate, these significant differences disappear.
ITT Estimates of City Connects Effect on Mathematics Achievement

Note. Standard errors, in parentheses, are clustered by school in the individual grade analyses and by student in the combined grade analyses. Adjusted p-values represent Bonferroni corrected p-values to control for multiple hypothesis tests. We also ran a separate model combining grade samples and using years of dosage as a covariate.
ITT Estimates of City Connects Effect on

Note. Standard errors, in parentheses, are clustered by school in the individual grade analyses and by student in the combined grade analyses. Adjusted p-values represent Bonferroni corrected p-values to control for multiple hypothesis tests. We also ran a separate model combining grade samples and using years of dosage as a covariate.
Using the previously aforementioned guidelines for magnitude of effect, we note that the effects at fifth grade are substantively meaningful and of policy relevance (Kraft, 2020). Noteworthy is that while ITT regression provides an unbiased treatment effect, our estimates using this method are considerably smaller in magnitude than those from the instrumental variable regression; this is due to noncompliance issues (e.g., children not attending a City Connects school despite winning a lottery spot) attenuating the treatment effect. By the time students reached third grade, the first grade considered for our outcome analyses, 11% of students initially assigned to a treatment school were in a comparison school, and 7% of comparison students had entered into a treatment school.
Treatment Effect Heterogeneity
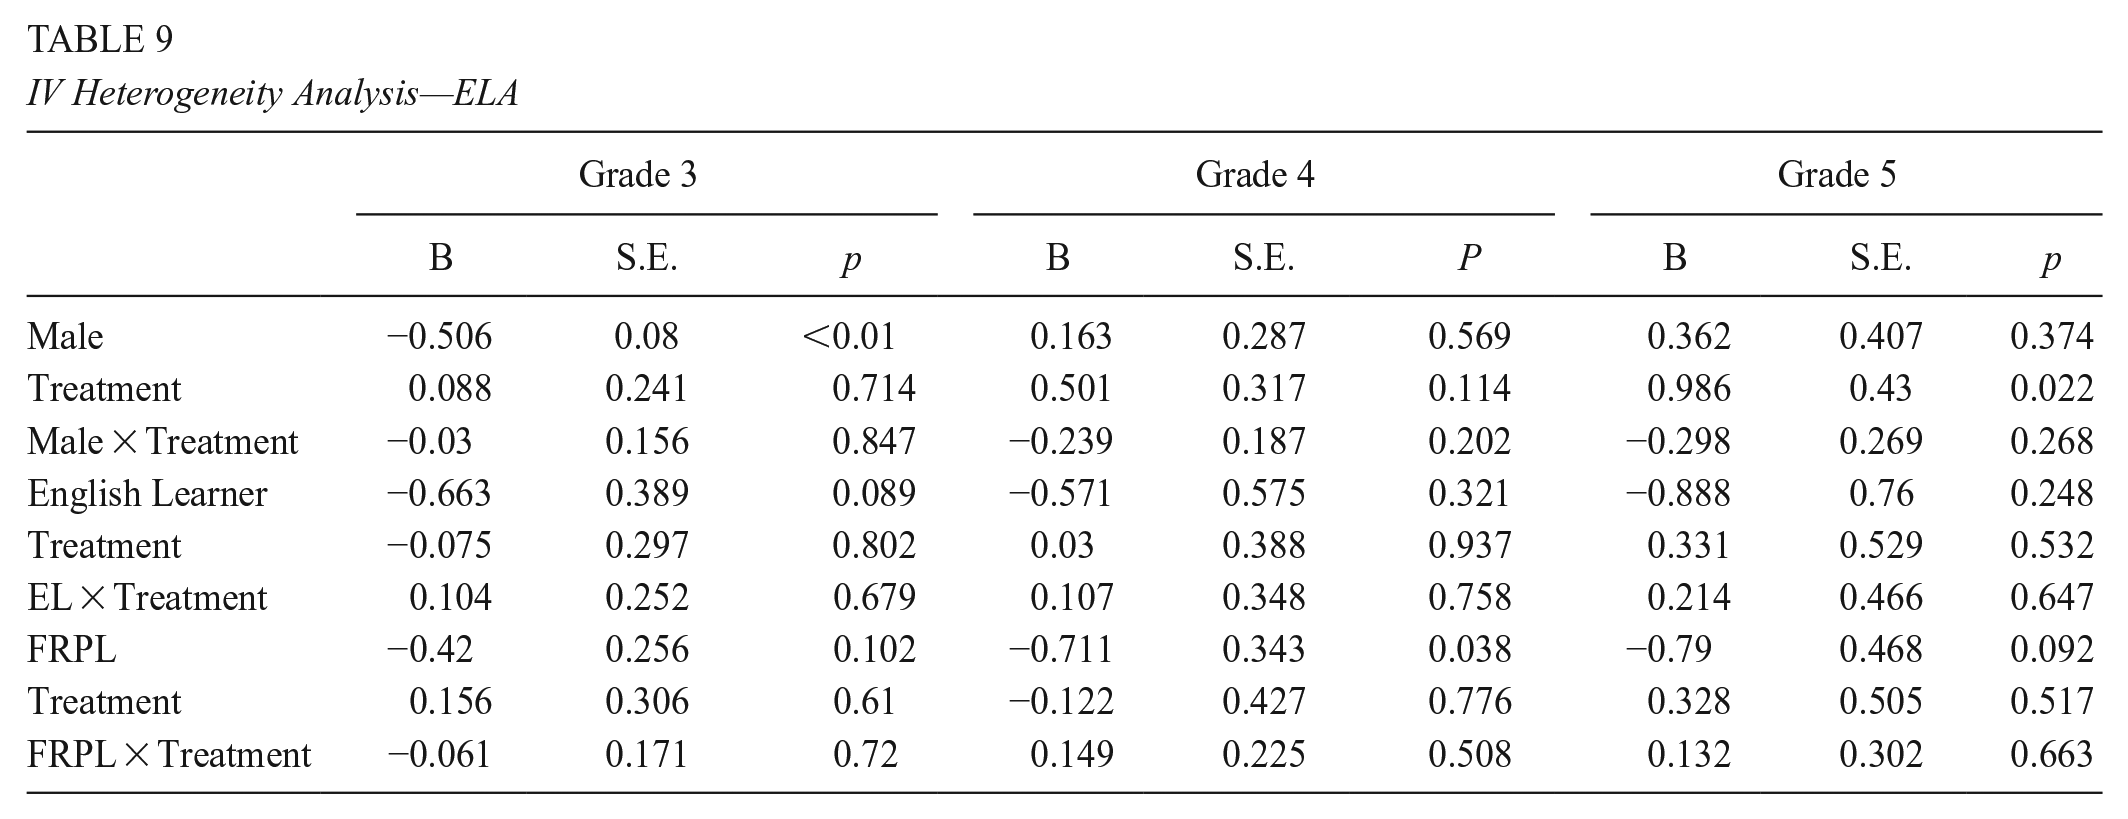
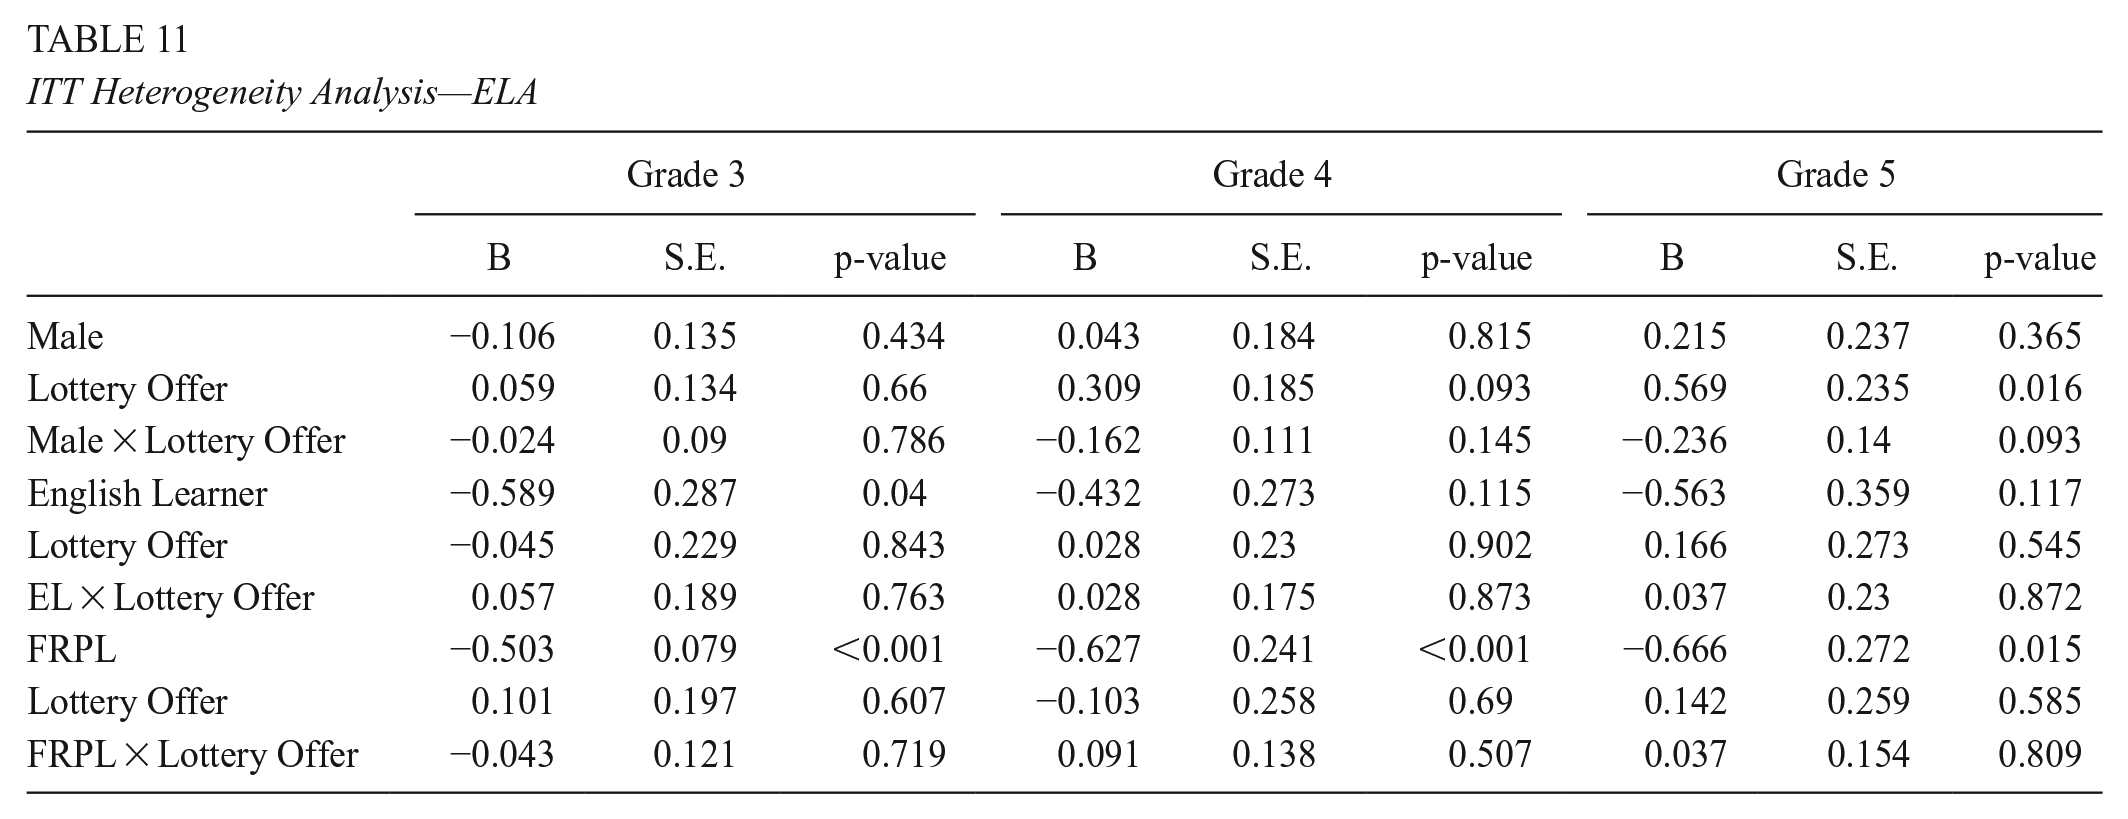
Tables 8–11 provide estimates from our treatment heterogeneity analyses, including the main effects of treatment and student demographic characteristics (e.g., gender, ELL, and FRPL) as well as the interaction effects for treatment by demographic characteristics. Across grades and demographic indicators, we detected no statistically significant interaction effects. The lack of interaction effects suggests that the size of treatment effects from our models presented in Tables 4–7 are fairly generalizable across genders, English-language proficiency levels, and FRLP statuses.
IV Heterogeneity Analysis—Math

IV Heterogeneity Analysis—ELA
ITT Heterogeneity Analysis—Math

ITT Heterogeneity Analysis—ELA
Validity Checks
The validity of the treatment effects presented in this study and their generalizability depends on key factors: our ability to identify random lottery offers, the sample participating in the lottery assignment system, attrition, and school-level confounding. This section presents results from empirical examinations into the validity of our regression estimates.
Efficacy of the Lottery Randomization
The internal validity of our treatment effect estimates hinges on successfully identifying randomized students within the school assignment process. To provide evidence of randomization, we examined the covariate balance between the group receiving a lottery offer to attend an intervention school and those receiving a lottery offer to attend a school without the intervention. Specifically, we estimated a series of linear probability models regressing each student characteristic at kindergarten on school lottery offer to a school implementing City Connects, lottery year, and children’s DA propensity scores. Given that the lottery offer is random conditional on the DA propensity score, none of the child characteristic variables should be significantly associated with the lottery offer in these models (Abdulkadiroğlu et al., 2017).
Table 12 provides results from the analyses examining child characteristics by lottery offer. Only free and reduced-price lunch status was significantly associated with receiving a lottery offer to a treatment school, although the standardized mean difference was quite small. These results offer evidence that the random assignment embedded within the lottery process was successfully captured.
Balance on Observable Characteristics in Kindergarten

Note. Standardized mean difference is calculated using Cohen’s D. Because randomization only occurs within DA propensity score strata, we also estimate differences within strata using linear probability models. These models estimate the difference in the likelihood of a student being of particular demographic group by treatment status, conditional on lottery year and DA propensity score. Also, these percentages represent the percentage of students falling within each demographic category within each respective sample and should not necessarily sum to 100%.
**denotes p < .05.
Attrition
While Table 14 indicates that children receiving random lottery offers to attend either an intervention or control school were similar at the time of receiving an offer, it is possible that subsequent non-random attrition processes could generate selection bias (Abdulkadiroğlu et al., 2014; What Works Clearinghouse, 2017). Among students offered a kindergarten seat via lottery, about 65% enrolled in the school they were assigned to. There were no differences in enrollment compliance by treatment status. Nearly 20% of students subject to the lottery did not enroll in the school district in kindergarten. Attrition rates across the full analytic sample and by treatment status are presented in Table 13.
Attrition from 2006–2010 Cohorts by Grade of Analysis

Tests of Baseline Equivalence by Analytic Sample

Note. SMD = standardized mean difference using Cohen’s D. LP = linear probability. Because randomization only occurs within DA propensity score strata, we also estimate differences within strata using linear probability models. These models estimate the difference in the likelihood of a student being of particular demographic group by treatment status, conditional on lottery year and DA propensity score.
In total, 42% of students are lost to attrition by the time third grade outcomes are observed. About 6% more students were lost to attrition in the treatment group for third outcomes. For fourth grade, 46% of students for whom such an outcome could be observed (i.e., the first four cohorts) are lost to attrition, with no differences in attrition by treatment status. For fifth grade, 54% of students for whom such an outcome could be observed (i.e., the first three cohorts) are lost to attrition, with no differences in attrition by treatment status.
Due to potential threats related to attrition, we also calculated differences in baseline characteristics by treatment status for each analytic sample, depicted in Table 14. While there were some differences in baseline characteristics by treatment status across each of the analytic samples, none were greater than 0.25 standard deviations. Thus, according to What Works Clearinghouse standards, the threat of bias due to attrition is tolerable under optimistic assumptions for grade 3, and tolerable under optimistic and cautious assumptions for grades 4 and 5 (What Works Clearinghouse, 2020).
Cohort Analysis
Given that our grade 5 estimates are based on a smaller number of lottery cohorts than our grade 3 and 4 estimates, cohort effects are a potential concern. Accordingly, we estimated ITT and LATE models at each grade level using just the first three cohorts (Tables 15 and 16), having found baseline covariate balance for these cohorts (Table 17) based on student characteristics within DA propensity score strata.
Instrumental Variable Estimates of City Connects Effect

Note. Standard errors, in parentheses, are clustered by school in the individual grade analyses and by student in the combined grade analyses.
denotes p < .05.
ITT Estimates of City Connects Effect for Students in 5th Grade Sample (Cohorts 1–3)

Note. Standard errors, clustered by school, are in parentheses.
denotes p < .10; **denotes p < .05.
Balance on Observable Characteristics in Kindergarten for Cohorts 1–3 (n = 626)

Note. Standardized mean difference is calculated using Cohen’s D. Because randomization only occurs within DA propensity score strata, we also estimate differences within strata using linear probability models. These models estimate the difference in the likelihood of a student being of particular demographic group by treatment status, conditional on lottery year and DA propensity score. Also, these percentages represent the percentage of students falling within each demographic category within each respective sample and should not necessarily sum to 100%.
In our models restricted to only the first three cohorts, we found significant treatment effects in both math and ELA at both third and fifth grade. Nonetheless, the third-grade LATE estimates for these three cohorts were about 50% smaller than those observed at fifth grade, and fourth grade estimates remained null in both the ITT and LATE models. Taken together, our analyses suggested that earlier cohorts may have experienced larger positive effects than later cohorts and, within cohorts, the size of treatment effects may increase between the time children are in third to fifth grade. The explanation for why treatment effects appeared least robust at fourth grade is, however, less clear.
Lottery Sample
Although school admissions lotteries generate random offers to attend a specific school, these randomly generated offers are only for children who decide to participate in the school lottery assignment process. We note that it is possible that children and their families who participate in the lottery process differ systematically from those who do not submit an application or who are assigned to a kindergarten school through non-lottery administrative procedures. Additionally, while our analytic sample focuses only on students who were subject to randomization within the kindergarten enrollment process, there may be differences between those who experienced lottery randomization and those who participated in the school assignment process but were not randomized via lottery.
To assess the robustness of our findings to this validity threat, we compared the demographic characteristics for the children subject to the lottery (i.e., the lottery sample) with children who were not subject to the lottery either because no applications were submitted on their behalf (i.e., they opted out of the school assignment process), or because they were not subject to randomization via lottery number. With standardized differences (using Cohen’s D) less than 0.20, Table 18 shows that the analytic lottery sample was similar to the non-lottery sample with regard to all observable characteristics except race; specifically, we note that the non-lottery sample, i.e., students opting out of the lottery assignment process at kindergarten, was comprised of more black students.
Covariate Balance Between Lottery and Non-lottery Sample

Note. These percentages represent the percentage of students falling within each demographic category within each respective sample and should not necessarily sum to 100%.
Lottery Offers and School Characteristics
Because schools were not randomly assigned to the intervention, school-level characteristics are a potential source of selection bias. To examine this, we investigated whether receiving a lottery offer to a treatment school led to students experiencing different levels of certain school inputs that may be associated with student achievement (but would not be affected by the presence or absence of the intervention) and for which school-level data were available: average class size, percentage of teachers licensed in the area of current teaching assignment, and the percentage of highly qualified teachers at grades 3–5. Specifically, we ran a series of multiple regression models where each of the aforementioned school inputs was regressed on lottery offer, DA propensity scores, and the set of covariates used for instrumental variable and intention-to-treat regression analyses. For these analyses, Huber-White cluster-robust standard errors were implemented (clustered by school for which the outcome was observed).
Table 19 provides the results from our analysis of the effect of receiving a lottery offer on school-level variables potentially associated with positive academic outcomes. We found that receiving a lottery offer to treatment schools led to very small, albeit statistically significant differences in class size and the percentage of teachers who were licensed. Students assigned to treatment schools experienced, on average, classes with 0.3 fewer students and 0.4% more teachers licensed in the area of their current assignment (see Table 19). Given the small magnitude of these differences, it is unlikely they biased our estimates of City Connects effects in a meaningful way. Nonetheless, the potential for unobserved sources of bias at the school-level cannot be ruled out.
Impact of Lottery Offer to ISS School on Other School-level Inputs

Standard errors, clustered by student, are in parentheses.
denotes p < .05.
Discussion
The present study provides a significant contribution to a growing evidence base on integrated student support in that it serves as a conceptual replication and extends the cumulative knowledge about integrated student support (Chhin et al., 2018; Derksen & Morawski, 2022; Duncan et al., 2014; Makel & Plucker, 2014). Given the limitations of previous research regarding the efficacy of the City Connects intervention of integrated student support, there is still a need for further work validating previously identified relationships between the intervention and student achievement. Consequently, we used a novel, sophisticated method to test previously explored hypotheses, extending previous research by increasing internal validity while maintaining high external validity given that we were able to avoid within-school randomization, thereby testing a treatment that is arguably more aligned with real-world delivery of whole school models of integrated student support than prior within-school randomized evaluations.
Complementing prior randomized studies for high school students, we report one of the more rigorous tests to date of the causal hypothesis that ISS can improve students’ achievement during the elementary school years. Using a randomized school assignment lottery in a large urban school district, we detect positive effects of ISS on math and ELA achievement. Effect sizes were generally largest and most consistently statistically significant (p < .05) at fifth grade, in some models indicating more than 50% of standard deviation improvement in math and ELA scores due to ISS. For the earliest cohorts in our study, we also found some evidence of positive treatment effects at third grade, but estimates never reached a statistically significant level (p < .05) at fourth grade. While these positive impacts were evident in models of both the local average treatment effect (i.e., treatment-on-the-treated) and intent-to-treat effects effect sizes were smaller using the latter approach.
In terms of practical significance of the fifth-grade findings, effect sizes for schools implementing City Connects indicated that student achievement improved by as much as 20 percentile points (e.g., our IV LATE effect sizes for Grade 5 mathematics and literacy scores correspond to a student moving from the 50th percentile to about the 72nd percentile). This level of improvement is equivalent to about 90% of the size of the average estimated Black-White achievement gap, and about 50% of the size of the estimated gap between students from high- and low-income families (Reardon, 2013). While treatment estimates were smaller in our ITT models, they remained of considerable practical significance: allowing for noncompliance and protocol deviations, the average score gains by fifth grade would move a student from the next to lowest performance category on the state exams (i.e., “Needs Improvement”) into the “Proficient” category. Below, we discuss these findings in greater detail with attention to the ways in which this large-scale natural experiment extends the evidence base on integrated student support.
ISS and Elementary School Achievement: Short- and Long-term Considerations
Given that the elementary school years are a pivotal time for establishing foundational learning skills, beliefs and attitudes toward school, and later behavioral engagement in school (e.g., Froiland & Oros, 2014; Guo et al., 2015; Herbers et al., 2012; Weidinger et al., 2018), the achievement benefits detected in fifth grade in the present study could prove critical in the long term. In fact, prior quasi-experimental evidence suggests that the treatment effects of City Connects on standardized achievement tests persist at least through eighth grade (Walsh et al., 2014). It is of note, however, that treatment effects in the present study were, in general, larger at fifth grade compared to third and fourth grade. Interestingly, our pattern of results is in the opposite direction of what might be expected with the commonly observed fade out of education intervention effects (Bailey et al., 2020). Moreover, results are consistent with previous quasi-experimental evidence that positive achievement effects of ISS emerge after at least two or more years of time in the intervention (Dearing et al., 2016). In other words, treatment effects appear to require sustained exposure; intermittent or short-term dosage may not be adequate for improving achievement. In light of the theory of change for ISS, this is perhaps not surprising.
The academic benefits of ISS are hypothesized to flow indirectly from an intervention that primarily addresses non-academic factors. Such factors, often exacerbated by poverty, include food insecurity, clothing and housing needs, effects of trauma and violence, medical issues, and lack of access to enrichment opportunities in sports, music, and the arts. Given the ubiquity, multidimensionality, and severity of risks (and their well-established lasting harms to learning and cognitive growth), it is likely unreasonable to expect immediate achievement gains when addressing systemic disadvantage. Nonetheless, we cannot empirically disentangle this theory of change explanation from the possibility that the differences between our third/fourth grade findings versus fifth grade findings were due, at least in part, to cohort effects; given the longitudinal nature of the data, the fifth-grade sample includes only those students who started kindergarten in school years 2007-08 to 2010-11. As the younger cohorts reach fifth grade, re-analyses should help disentangle this. Moreover, further interesting questions arise when you consider the plausibility of effect heterogeneity and how the ISS intervention effects may interact with important factors such as school type and practices, e.g., turnaround schools. Given the small sample sizes used for our study, taking such a direction wasn’t feasible; however, this remains an important line of inquiry and is worth exploring in the future as more school lottery and achievement data becomes available.
It is in light of the pervasive and sustained nature of the obstacles to achievement that the practice of City Connects is designed as a sustained and pervasive intervention. Consider, for example, the annual reviews of every child with each classroom teacher to develop a deep understanding of each individual student’s strengths, needs, and interests across academic, social-emotional/behavioral, health, and family domains. In turn, this leads to a tailored plan of support for each student. Addressing interests and strengths—not just needs—is predicted to foster a student’s sense of competence. And, as described, a student support database facilitates referrals to the district and community resources and services that are the best match for each student and enables tracking and follow-up. Moreover, the model also includes protocols and training for collaboration with families, enabling the school to capitalize on family strengths and empower family involvement. In short, we argue here that slowly emerging achievement gains are consistent with the theory of change and underlying causal model of ISS.
It is important to note, however, that cohort effects appeared to partially account for larger estimates at fifth grade. Although we were not able to formally test cohort differences due to sample size constraints, the three earliest cohorts in our study (who were the only cohorts for whom we could estimate treatment effects at fifth grade) evidenced statistically significant treatment effects at third and fifth grade. While we found some evidence that treatment effects grew larger between third and fifth grade even for this restricted set of early cohorts, it is worth considering at least two potential explanations for these cohort differences.
First, there is a reasonable possibility that the counterfactual has been changing, namely due to the growing attention to ISS strategies. Integrated student support interventions and their potential for addressing educational inequities have been garnering increasing attention from educators and policy makers and, in turn, implementation of these strategies and knowledge of their importance has dramatically expanded across the nation. While we found data on scale and growth difficult to track at the timing our data was collected, recent growth in scale helps illustrate trends that may have started when our study cohorts were in elementary school.
By 2016, approximately six U.S states had policies in place to advance integrated student support initiatives—a number that has grown to 24 states today—and integrated student support models are currently being implemented in all 50 states (Boston College Mary E. Walsh Center for Thriving Children, 2022; Moore et al., 2017). In response to this growing awareness, many schools without formal integrated student support systems in place have begun to adopt new strategies for securing community resources for their schools and offering some version of coordinated support to better assist challenged student populations. As a result, our counterfactual—i.e., what would happen if students didn’t receive the intervention—may have been changing over time, with later cohorts of students in control schools receiving increasingly more supports and services.
Second, cohort effects may have been driven by our use of high-stakes test scores as an outcome in our analyses, if schools often end up “teaching to the test,” and more effectively so over time, to avoid punishments stemming from test-based accountability practices. While this particular challenge is an important consideration and it is always ideal to assess children’s well-being in a manner that extends beyond merely standardized test scores, assessing other student outcomes was out of scope for this manuscript. This was for a few reasons, notably, the ways in which alternative student outcomes, such as behavior, effort, and other non-cognitive outcomes, are measured present their own complexity. Furthermore, examining student outcomes such as high school placement and high school graduation would severely reduce our analytic sample sizes, which would adversely affect the strengths of the current study. However, we do strongly recommend that this be an area of future research as more lottery admissions data becomes available and methods utilizing the randomization embedded within admissions systems become more widely accessible. Simultaneously, we acknowledge other key limitations of the present study, particularly those related to internal validity.
Heterogeneity
Interestingly, we did not detect statistically significant heterogeneity across student gender, English-language proficiency levels, and FRLP statuses, suggesting generalizability of treatment effects across these indicators. This is, however, perhaps not so surprising when considering that the intervention is a school-based intervention designed to reach every child in schools, not just the most disadvantaged. For all students, the intervention works to address needs and build on strengths. All students, including students with few or less acute needs, receive the full intervention. As a result, there is no conceptual or theoretical reason for us to believe that we should see treatment effect variations across demographic proxies of disadvantage. Also worth noting is that this research study takes place in a high-needs context wherein many, if not all, schools are serving large groups of students who are multiply disadvantaged. While these exploratory heterogeneity analyses examining single sources of disadvantage serve as a useful starting point, they are ultimately limited in that the comparisons fail to account for all the sources of disadvantage students experience that the intervention works to address.
Yet, perhaps even more important to this study is the issue of limited variation in disadvantage. Notice, for example, that on average over 85% of students in these schools qualified for free/reduced lunch, and (based on prior evidence on school economic segregation and our experiences working in these schools) it is exceptionally rare to find more than just a few children within the remaining 15% of students who might fall into conventional operationalizations of advantage. Consequently, our tests of heterogeneity are not comparable to those that might examine heterogeneity in integrated student support across poorer, middle class, and more advantaged students.
Limitations
While a critical strength of the present study was our ability to exploit a school admissions lottery system to randomize children to treatment schools, important limitations to this method should be noted. A potential threat to validity stems from the treatment effects being driven by oversubscribed schools, in which the total number of applicants is greater than the seats available. This would be particularly problematic in studies leveraging only first-choice lotteries for oversubscribed schools. If oversubscribed schools are the most desired for reasons related to academic quality, the external validity of the results are limited beyond such schools. Moreover, we cannot fully disentangle unobserved school factors from the implementation of ISS within these oversubscribed schools (i.e., school-level omitted variable bias).
Nonetheless, as mentioned earlier, an advantage of the method used in this study is that it allows for the inclusion of students randomized to schools that are “undersubscribed.” In total, students randomized to oversubscribed schools only make up 22% of the total sample. Additionally, only 19% of students randomized to a treatment school were assigned to an oversubscribed school compared to 26% of comparison students. Compliance with lottery assignment did not differ by treatment status regardless of whether or not students were assigned to an oversubscribed or undersubscribed school. Consequently, because oversubscribed students make up a relatively small proportion of the sample, the possibility that higher-quality schools—proxied by high desirability—may be driving the results is effectively mitigated.
Additional analyses examining the characteristics of students participating in the school assignment process and those opting out revealed that our lottery sample did not significantly differ from the district-wide population of entering students on observable demographic variables. However, we note that there may be remaining unobserved differences between children and their families who participated in the school assignment process and the families that either did not participate in the kindergarten enrollment application process entirely or participated but were not subject to lottery randomization. The inability to test for these unobserved differences may limit the generalizability of our findings based on lottery participation to larger student populations. A possible, important future direction of this work would be to use the propensity score subclassification estimator as discussed in Tipton (2013) to investigate the degree to which we could generalize findings from our lottery natural experiment to broader, more policy-relevant populations and the assumptions this would require.
Another possible limitation is the limited information we have about comparison schools that were not implementing City Connects. It is possible, for example, that comparison schools have adopted other interventions or have exceptional practices, student support related or otherwise. Based on previous qualitative work in this district, comparison schools did not appear to offer any elements of ISS or similar models; for example, these schools offered neither dedicated personnel nor systematic processes for reviewing every student and referring each to individualized supports (Bowden et al., 2020). Yet, comparison schools were also fairly conventional in having principals and assistant principals (with the help of teachers or school counselors, psychologists, and/or nurses) trying to support high-risk students and offering conventional programs such as before and after-school programs (Bowden et al., 2020). In other words, the comparison schools appeared to represent the status quo for student support. However, it remains a limitation of the present study that we do not have a fuller means of capturing observable (and unobserved) characteristics of comparison schools. Moreover, as we note above, the dynamic nature of school practices always raises the potential that some ISS, or related, practices came and went in the comparison schools across the time of our study.
Finally, the unit of randomization (students) should be considered within the context of the intervention design. As previously established, the causal effect identified in this study represents the impact of students being assigned to schools implementing City Connects and schools were not randomly assigned to the intervention. In probing potential confounds, we found significant effects of lottery offer on two of the three school-level factors we examined (i.e., class size and teacher qualifications). While statistically significant, however, the size of differences were seemingly negligible. For class size, for example, control schools had only 0.3 more students per class; in comparison, class size experiments suggest that a difference of about 7 students per class is required to substantially affect achievement (Nye et al., 1999). There was less than a half percentage-point difference in the proportion of teachers licensed to teach in their area. Given findings in the literature (Darling-Hammond et al., 2005) it is unreasonable to expect this difference to affect children’s test scores in the current study. Nonetheless, we recognize that we have only examined three possible confounds. Unobserved, more powerful, confounds are possible. Yet, it is worth noting that City Connects is an intervention targeted at disadvantaged populations and primarily implemented in underserved schools and therefore speculate that omitted school-level variables correlated with higher student achievement would favor control schools and not treatment schools. In other words, it is likely that control schools are overall more privileged than treatment schools in our study. Consequently, we suspect that any further omitted variable bias at the school-level would downwardly bias our estimates, thereby making the reported results conservative estimates of the effects of schools implementing City Connects on students’ academic achievement.
In closing, when considered in conjunction with quasi-experimental studies with similar results (e.g., Dearing et al., 2016; Walsh et al., 2014), the present study provides tenable evidence that schools implementing City Connects have positive effects on student achievement.
Conclusion
In this study, students who were randomly assigned to City Connects schools in kindergarten scored higher statewide Math and ELA tests than their peers randomly assigned to comparison schools, most robustly so at fifth grade. These academic outcomes result from an intervention that offers schools a feasible practice for addressing a wide range of non-academic factors that affect learning and thriving in school. Early and middle childhood academic outcomes are a major determinant of future educational attainment, success, and health (Huure et al., 2006). The effects of the COVID-19 pandemic on schools have further sharpened awareness of the critical influence of out-of-school factors on engagement and success in school. For practitioners and policymakers seeking approaches to improving equity by addressing barriers to learning brought on by poverty and other contextual factors while simultaneously building upon school, community, and family strengths, these findings add to the evidence base supporting a model of systemic, comprehensive student support.
Footnotes
Acknowledgements
We gratefully acknowledge the collaboration of the Boston Public Schools and its Office of Data and Accountability. We thank Henry Braun, Emily Doolittle, Parag Pathak, Lisa Gennetian, Amy Heberle, Deoksoon Kim, Terrence Lee-St. John, Pamela Morris, Richard Murnane, Caroline Vuilleumier, Paul Xu, and Courtney Pollack for their valuable comments and assistance.
Declaration of Conflicting Interests
The author(s) declared no potential conflicts of interest with respect to the research, authorship, and/or publication of this article.
Funding
The author(s) disclosed receipt of the following financial support for the research, authorship, and/or publication of this article: This research was generously supported with grant funding from the U.S. Department of Education’s Institute of Education Sciences to the Center for Thriving Children at Boston College (Award R305A170471). The opinions expressed are those of the authors and do not represent the views of the Institute or the U.S. Department of Education.
Notes
Authors
JORDAN L. LAWSON is the research consultant at the Mary E. Walsh Center for Thriving Children at Boston College, 140 Commonwealth Avenue, Chestnut Hill, MA 02467; email:
LAURA M. O’DWYER is the chair of the Department of Measurement, Evaluation, Statistics, and Assessment at the Lynch School of Education and Human Development at Boston College, 140 Commonwealth Avenue Chestnut Hill, MA 02467; email:
ERIC DEARING is the executive director of the Mary E. Walsh Center for Thriving Children and the professor of Applied Developmental Psychology in the Lynch School of Education and Human Development at Boston College, 140 Commonwealth Avenue Chestnut Hill, MA 02467; email:
ANASTASIA E. RACZEK was the associate director of Evaluation and Research of the Mary E. Walsh Center for Thriving Children at Boston College, 140 Commonwealth Avenue Chestnut Hill, MA 02467; email:
CLAIRE FOLEY is the associate director of the Mary E. Walsh Center for Thriving Children and research professor of the Lynch School of Education and Human Development at Boston College, 140 Commonwealth Avenue Chestnut Hill, MA 02467; email:
NOMAN KHANANI was the senior research associate of the Mary E. Walsh Center for Thriving Children at Boston College, 140 Commonwealth Avenue, Chestnut Hill, MA 02467; email:
MARY E. WALSH is the executive director of City Connects and the Senior Fellow of the Mary E. Walsh Center for Thriving Children and Kearns Professor Emerita at the Lynch School of Education and Human Development at Boston College, 140 Commonwealth Avenue Chestnut Hill, MA 02467; email:
YAN R. LEIGH is the director of Research and Evaluation at the Mary E. Walsh Center for Thriving Children at Boston College,140 Commonwealth Avenue, Chestnut Hill, MA 02467; email: