
Abstract
The ethnic and racial makeup of the United States has changed during the last several decades. Scholars have qualitatively shown how these changes affect school districts but have not identified their scale. We examine residential demographic change using a novel dataset derived from a geographic technique that leverages satellite imagery with 2000 and 2020 census data. We then analyze the effects of demographic change on student isolation and dissimilarity in elementary school districts. Our findings indicate that most elementary districts have changed, but the changes are uneven. The number of districts with White student intense isolation declined, particularly in suburban locales. Meanwhile, districts with student of color intense isolation increased, particularly in urban locales. These changes indicate that increasing diversity for White students has coincided with greater isolation for students of color. These findings should prompt scholars to reconsider their conceptualization of suburban school districts.
The 2020 U.S. Census shows that the racial and ethnic composition of the United States population continues to change (Jensen et al., 2021). Researchers have examined the effect of these changes on the education system, primarily focusing on gentrification, or when many White residents move into urban areas inhabited by residents of color (Mordechay & Ayscue, 2020). While educational research on gentrification holds potential, scholars must also investigate other patterns, particularly the migration of residents of color into once predominantly White areas (Diamond et al., 2021). These places include suburban locales that were historically havens for “White flight” during desegregation periods (Rury, 2020).
Recent scholarship has employed qualitative methods to uncover suburban school districts’ tensions as they transform from predominantly White to racially and ethnically diverse populations (Turner, 2020). This work reveals significant challenges facing school districts, highlighting a need to quantify the extent of racial change trends. To fulfill this goal, we assess the scale of racial change across elementary school districts from 2000 to 2020, focusing on suburban districts. We also examine the relationship between demographic changes and school segregation. We ask the following research questions (RQs):
How have school districts’ enrollment and residential populations changed in 2020 compared to 2000? How do changes in suburban districts compare to other locales?
How do school districts’ residential population changes reflect school enrollment changes? How do changes in suburban districts compare to other locales?
How have school districts’ student racial isolation indices changed? How do changes in suburban districts compare to other locales?
How have school districts’ racial dissimilarity indices changed? How do changes in suburban districts compare to other locales?
Our study uses decennial U.S. Census population data and employs a geographic technique known as dasymetric interpolation to determine the residential population of school districts in 2000 and 2020 using 2020 boundaries. We calculated an isolation and dissimilarity score for each school district using the National Center for Education Statistics (NCES) school enrollment data in 2000 and 2020. The findings reveal that most district residential populations were majority White in 2000 and experienced increased racial diversity by 2020. These findings were amplified in the suburbs, which enroll the most students. On average, the demographic changes have reduced the number of districts with White student intense isolation scores. However, these changes were not uniform. Our findings show an increase in districts with student of color intense isolation scores. Dissimilarity scores worsened in 24.04% of districts and at greater levels in cities and suburbs than in other locales.
These findings have implications for research on school segregation and prompt a need to reimagine how school district locales are framed. The suburbs acted historically as places of White flight and captured the public’s imagination as being exclusionary White places. The racial composition of suburban school districts is now different. Due to past racialized assumptions of “urban” and “suburban” labels, the demographic patterns we reveal suggest a need for scholars to reconsider the delineations between urban and suburban labels to align with the changing demographics in the United States (Milner, 2012).
Literature and Conceptual Framework
Persistent School Segregation
School racial segregation has worsened in the last 30 years (Owens et al., 2022). Segregated schools perpetuate an inequitable educational system. Isolation of students of color leads to unequal access to educational opportunities compared to White peers, thereby exacerbating achievement gaps (Ayscue et al., 2017; Clotfelter, 2004; Condron et al., 2013; Ladd, 2008; Mordechay & Orfield, 2017). School segregation also contributes to a deeply divided society that frays the social fabric of communities (Orfield et al., 2016). Diverse and integrated schools, if created with inclusive practices and shared power between groups, can bring students of diverse racial backgrounds into contact with one another and cultivate interracial friendships that challenge stereotypes (Ayscue et al., 2017). Interracial contact within public institutions could also reduce the implicit bias that harms students and adults of color in numerous social situations (Eberhardt, 2019). Scholarship on segregation and integration have focused on urban schools and are typically framed as urban issues, but scholars are increasingly considering these issues across an urban-suburban ecosystem (Diamond et al., 2021; Frankenberg & Orfield, 2012; Rury, 2020).
Lawmakers classify segregation as either de jure or de facto. De jure segregation is through the law, while de facto is through social forces such as housing preferences. The distinction between de jure and de facto segregation is complex and is perhaps even a myth because the dichotomy has obscured the relationship between government policy and social behavior (Rothstein, 2017). Policies shape behaviors that influence segregation, and past racialized policies shape present conditions of unequal opportunity based on race. Housing zones, school zones, vouchers, tax credits, and transportation influence where students attend school. Since policy influences individual decisions, policymakers should design policies to diversify schools, regardless of de facto or de jure categorizations (Rothstein, 2017). Therefore, school segregation is defined here as separation based on the racial identity of geographically proximate students, resulting from either de jure or de facto distinctions. Segregation is measured in this study using isolation and dissimilarity. Isolation refers to the concentration of students of a racial group, while dissimilarity refers to the uneven distribution of different racial groups.
The U.S. Supreme Court ended school segregation as an explicit policy through the landmark decision in Brown v. Board of Education (1954) but did not offer legal remedies for noncompliance. Significant changes in American schools did not occur until after Green v. County School Board of New Kent County (1968) and Alexander v. Holmes County Board of Education (1969). The Green and Alexander decisions declared that districts with legally mandated segregation must formulate plans to promote desegregation. Only then did widespread desegregation begin in the United States. In 1968, more than 78% of Black students attended intensely isolated schools; but by 1972, only 25% of Black students attended intensely isolated schools (Orfield, 1983). The most significant changes occurred in the South. The Northeast was the only region where segregation did not change between 1970 and 2000 (Clotfelter, 2004).
Integration in post-Brown America was never achieved despite some desegregation occurring in the 1960s and 1970s. Only 20 years after Brown and six after Green, the courts and government across levels withdrew their commitment to desegregation policy. The Court’s ruling in Milliken v. Bradley (1974) limited tools to promote interdistrict desegregation. The Court then ruled in cases like Pasadena City Board of Education v. Spangler (1976) that once school districts met the goals of court-ordered desegregation plans (termed unitary status districts), they could be released from federal oversight. Policy choices in other levels of government have since encouraged segregation. Federal agencies have overseen housing policies that catalyzed White flight to the suburbs, creating White-isolated districts outside cities (Orfield et al., 2003; Rothstein, 2017; Rury, 2020; Wilson, 2015). Local discriminatory policies and practices excluded families of color from suburban housing. These policies and practices include loan denial, redlining, blockbusting, racially exclusive contract covenants, police complicity in mob violence against Black residents, and other forms of discrimination (Rothstein, 2017). These issues have prompted policy suggestions to consider issues of racial equity at regional levels (Holme & Finnigan, 2018).
Several additional factors contribute to contemporary school racial segregation. A range of segregative policies emerged in the 1990s and 2000s, including the Supreme Court’s further retreat from desegregation in Parents Involved in Community Schools v. Seattle School District No. 1 (Clotfelter, 2004; Frankenberg, 2017; Orfield et al., 2016; Reardon & Owens, 2014; Reardon et al., 2012). White flight patterns worsened (Clotfelter, 2004; De la Roca et al., 2018; Frankel & Volij, 2011; Mordechay & Orfield, 2017; Siegel-Hawley et al., 2018). New school choice programs increased school segregation in many locations (Frankenberg, 2017; Orfield, 2013). Segregation has also worsened as residents form new districts to separate from existing districts, known as district secession (Siegel-Hawley et al., 2018). These forces have perpetuated a segregated and unequal society across metro areas, including in the suburbs.
Changing Geographies in the United States
Contemporary demographic change patterns could affect school segregation. The topic receives significant attention in academic research and popular culture (Lacy, 2016). This attention has focused on the return of White and affluent individuals to city centers in the 1990s and 2000s, referred to as gentrification. The phenomenon has been defined in varying ways, encompassing economic development, shifts in housing supply, and racial population change (Finio, 2021; Hackworth & Smith, 2001). Gentrification could reduce racial segregation, particularly in districts with citywide school enrollment policies, yet it has struggled to achieve this outcome (Mordechay & Ayscue, 2020; Stillman, 2012).
While gentrification’s impact on school segregation remains a popular topic, the more numerically prevalent demographic trend in the United States is occurring outside cities. The suburbs are experiencing racial and ethnic change, with a popular book referring to this trend as a “diversity explosion” (Frey, 2018). Racial demographics in the suburbs have changed because of two trends. The first involves Black residents’ migration into the suburbs in the United States’ southern region (Frey, 2018; Lacy, 2016). The second encompasses migration patterns of residents from Central and South America as they embark on the fraught journey to leave their homes in search of safer and more prosperous lives (Massey, 2008). Demographic change trends are found in communities nationwide, suggesting that school districts across the United States could also experience change.
Despite the extensive literature on demographic change in the United States, there is less research on the effect on school districts. While the distribution of individuals of color across different geographies in the United States is evident, the relationship between these patterns and school segregation remains understudied. Frankenberg and Orfield (2012) edited a volume that examined cases of racial change in suburban places, showing that suburban school districts tend to maintain racial segregation despite demographic change. Mordechay and Terbeck (2023) examined diversifying suburbs around Chicago. They show that these trends have increased economic school segregation but they noted differences across suburban rings, as Black and Hispanic students are increasingly disadvantaged in outer suburbs. Segregation manifests through the formation of racial enclaves where minoritized populations tend to cluster in older suburban areas (Diem et al., 2014). Kebede et al. (2021) examined these trends in rural places. They show that Hispanic enrollment drives much of the expanding ethnoracial diversity in rural places across the country and that students are less ethnoracially isolated than before, but segregation in these places remains. These studies show that population changes relate to school enrollment and segregation, but recent patterns have yet to be studied nationwide.
Conceptual Logic
School Districts as a Unit of Analysis
Our study focuses on the school district as the unit of analysis due to suburban school districts’ role in creating White enclaves post-Brown and during subsequent desegregation efforts (Rury, 2020). The fragmentation of Progressive Era city schools sustained racial divisions through discriminatory real estate practices in the suburbs and the subsequent migration of White families (Briggs, 2005). These families used the suburbs as an expedient way to resist desegregation measures, even in otherwise progressive Northern cities (Gamson & Hodge, 2018). Meaningful interdistrict desegregation attempts ended with Milliken v. Bradley (1974), and the boundaries between urban and suburban districts ossified (Nickson, 2022). The dramatic shift of 15% of the U.S. population living in the suburbs in 1940 to more than 50% by 2000 underscores the effect of White flight (Matheny et al., 2023).
Our analysis of how individuals traverse school district boundaries provides insight into the reciprocal relationship between broader social forces and the spatial-demographic composition of school districts. School districts and school zones help produce geographies of meaning based on their racial composition and how segregation or diversity unfolds within them (Buendia et al., 2004). Gerrymandered school zones within districts exacerbate segregation, especially those experiencing rapid racial and ethnic change (Richards, 2014). Our study’s findings provide policymakers, researchers, and administrators with quantitative data to understand better “the intersections of race, place, and inequality” across urban, suburban, and rural school districts, which are the foundational unit of governing and managing schools (Diamond et al., 2021, p. 249). Creating the suburban school district was a policy choice to prompt White flight, so understanding how districts have shifted amidst demographic change has tremendous policy implications.
Conceptualizing Measures of Segregation
School racial segregation is a popular research topic, with many studies pointing to the increase of segregation in recent years following its decrease in the 30 years after Brown (Fiel, 2013; Logan et al., 2004; Stroub & Richards, 2013). Richards et al. (2020) point to ambiguity regarding recent trends in segregation, showing that statistical choices and study design shape evidence of segregation as increasing or decreasing. There are merits and shortcomings to all measures of segregation. Many studies opt for commonly used indices, such as the Gini coefficient (Gini, 1921) or the Dissimilarity Index (Duncan & Duncan, 1955; Massey & Denton, 1988; Taeuber & Taeuber, 1965). Segregation measure selection should be dependent on which will best address a study’s research questions; for example, Reardon and Yun (2001) chose to use the Entropy Index (H), which fit their need for decomposition of between and within district components within their analyses (Reardon & Yun, 2001).
Other studies examine segregation using isolation/exposure, which typically show increased school segregation (Frankenberg et al., 2019; Orfield et al., 2003). Fry (2007) uses enrollment data to show how public schools became more integrated for White students but more segregated for Black and Hispanic students, using a measure of exposure. The isolation/exposure approach provides insights into a school’s racial composition but has limitations when students are spread evenly across schools based on race and ethnicity and are still isolated (Richards et al., 2020). This limitation occurs because exposure measures are susceptible to shifts in the overall racial/ethnic makeup of a student body or community (Reardon & Owens, 2014). As demographics change, these measures could show increased isolation even if student distributions remain even.
We use two segregation measures to account for the advantages and disadvantages of each: isolation and dissimilarity. These measures allow us to understand how little exposure students from different backgrounds have to each other while also accounting for how evenly students from different backgrounds are spread within districts.
Suburban Whiteness
While there is limited quantitative research on the relationship between recent racial demographic change and district-level school segregation, substantial qualitative research examines the local practices of diversifying districts. We conceptualize suburban schools and districts in the United States as historically structured as White spaces, run by White individuals, and serving primarily White students. The suburbs were envisioned to reflect the cultural preferences of White people. The process of suburbanization intensified following Brown and the subsequent implementation of school desegregation policy (Erickson, 2012). The embedded influence of whiteness in these structures, norms, and histories poses challenges for district leaders in diversifying districts (Castagno, 2014). The rise of localism in the suburbs inhibits equity solutions when suburban White residents act with hostility or indifference toward other communities (Rury, 2020). Meanwhile, urban districts have become synonymous with students of color, driven by the norms and behaviors of residents and students of color (Milner, 2012).
Suburban school district leaders struggle with practices that foster diversity, equity, and inclusion because norms like “colorblind managerialism” push them to avoid the political and market-based tensions that come alongside advocating for equitable schools (Turner, 2020, p. 11). Race-neutral policies in school districts are ineffective in promoting integration and equity, hindering efforts to address the challenges of diversifying student populations, especially since the suburbs are normatively White. Diamond (2006) shows that the educational system is unequal even in integrated suburbs because White students accrue advantages, contributing to achievement gaps. Evans (2007) explains that schools facing demographic change vary in their practices, but “schools generally have not responded well, sustaining and/or implementing programs, policies, practices, and beliefs that have harmed students of color” (p. 345). Diem et al. (2014) show the emergence of White racial enclaves in rapidly diversifying districts. Turner (2015) shows that district leaders are aware of issues related to demographic change and attempt to address them; however, they focus on individual and cultural definitions of inequality and use colorblind or color-muted plans that tend not to fix inequality. Welton et al. (2015) also show that leaders choose to address issues of race through race-neutral policies and practices as populations diversify. Holme et al. (2014) describe a district that prioritized technical changes to curriculum and instruction rather than addressing the normative and political dynamics of diversifying suburban districts. Diem et al. (2016) explain that race-neutral responses or inaction to demographic change exacerbate inequality and conclude that if “school districts are really serious about addressing racial change, they need to have conversations on how they can work to create policies within their schools that counter racism and are anti-racist in nature” (p. 758).
Recent educational research on race has focused on the acute inequities faced by students from minoritized groups in urban schools. In a review of the top five American Educational Research Association journals from 2000 to 2018, Diamond and Posey-Maddox (2020) found 164 articles focused explicitly on urban schools compared to only 24 on suburban schools (p. 70). The diversifying suburb trends have led to calls for more scholarship in suburban contexts (Lewis-McCoy et al., 2023). Meanwhile, the spatial imagination of the suburbs remains imbued with a historical construction that they are White, anti-Black spaces (Jenkins, 2021), and there is an urgent need for a robust suburban scholarship on the implications for students of color attending school in suburban districts. Urban educational research has suggested that “urban” is defined through race and not the size of a population (Milner, 2012). Past urban studies offer fertile ground for theoretical, empirical, and practical knowledge on the best and worst approaches to educating students from diverse backgrounds but may need now to consider places historically called the suburbs.
The changes occurring in suburban school districts present an opportunity to achieve some of Brown’s goals; however, it is essential to remember that suburban spaces were constructed with the same discriminatory beliefs and practices they are now tasked with dismantling. Diamond et al. (2021) summarize the tensions amidst these changes and explain the work the educational research community needs to pursue. A renewed focus on suburban studies, informed by research in urban studies, offers a path to understanding how policymakers, researchers, administrators, teachers, and students should respond to demographic change in the suburbs.
Methods
An Innovative District Dataset
Examining trends over time in a geographic area comes with many logistical and conceptual challenges. These challenges relate to school districts drawn from socially constructed boundaries that change. According to the NCES, there were 13,874 elementary serving (elementary + unified) school districts in 2000 and 11,890 in 2020. Additionally, a school district name may be consistent over time but not the area it covers. The NCES EDGE (Education Demographic and Geographic Estimates) program has identified 417 district boundary changes across school district types since 2007–2008 alone (NCES, 2024).
When districts change, researchers must decide whether to track the name of a boundary and its affiliated data or fix current boundaries in space and track the affiliated data to physical spaces. There are benefits to both approaches. For the former, the advantage is understanding how patterns change according to how a place is labeled, acknowledging that boundary changes account for some trends. This strategy effectively captures the effect of gerrymandering and boundary changes on outcomes like segregation (Richards, 2014). For example, tracking population data in the United States in 1776 compared to 2020 recognizes that the researcher is tracking patterns of affiliation to a political entity, not the land mass it covers.
Meanwhile, one could track the population changes within the landmass of the current U.S. boundaries from 1776 to 2020 and get results that account for people living on land with different affiliations. Tracking the name of a boundary and its affiliated data has the advantage of being more logistically manageable because data agencies like the NCES assign identification numbers and collate them over time. It is more difficult to track the trends of a fixed area of space because strategies are required to normalize boundaries and track the changes within those physical areas. Most governing agencies, including the NCES, favor tracking the name of an entity and its data over time because the data are cleaner. While there are advantages to following entity names over time, the further back in time one goes, the more incoherent these comparisons become. If we return to the year 1910, for example, we would be working with 200,000 school districts, and it would be impossible to make any meaningful comparisons between districts in 1910 and 2020 (Fischel, 2010).
The fixed name or fixed space options mean we could either ignore district labels and create mathematically equal geographic zones or analyze patterns based on district name identifiers alone. Neither approach satisfies us: One lacks meaning-making, and the other lacks consistency. Therefore, we decided to use current school district boundaries and their names but hold the geographic area of current 2020 school districts steady and then apportion people and schools within those boundaries at two different time points. This strategy allows us to understand the demographics in the currently labeled 2020 boundaries because they provide the most recent geographic associations people have with districts. We see two advantages to this approach. First, it is more consistent, as changes are analyzed within the same geographic space. The second is that people live in land masses, not administrative databases. Children attend school buildings, not district boundaries. At the same time, people make meaning out of district boundaries, and policymakers make decisions based on boundaries due to place associations. Our strategy aims to recognize these considerations of both space and place.
The challenge becomes how to create a dataset where one can hold boundaries consistent over time and effectively apportion schools and populations. We solve this problem using a geographic technique called dasymetric interpolation by overlaying 2000 and 2020 schools and appending their data into the 2020 district boundaries. This strategy has been employed in the field of human geography for decades (Holt et al., 2004). It helps account for unequal boundary changes and problems with flawed apportioning of populations. For example, if half of a 2000 boundary overlaps with a 2020 boundary, an imprecise strategy would be distributing 50% of the population to one 2020 boundary and 50% to another. Dasymetric interpolation uses satellite imagery analyses to accurately reflect population density with density indicators (homes, stores, buildings) to improve the reapportioning of the population across overlays. This method scans image pixels from satellite photos to weight the population based on density indicators. This strategy provides a sophisticated estimation of the 2000 population figures using the 2020 boundaries.
The 2020 elementary district boundaries were created using shape files from the Census Bureau. We focus on elementary school districts because the early years are crucial for forming racial bias, and these biases are related to racial exposure or a lack thereof (Rizzo, 2022). These shape files include what the Census classifies as unified (PK–12) and elementary districts (PK–8). Once the 2000 census data were interpolated to match the 2020 boundaries, we calculated the population within those boundaries in 2000 and 2020. Then, we plotted all 2000 and 2020 elementary schools, provided in NCES data, onto their corresponding districts. Schools that served K–8 or K–12 and primarily served students below eighth grade were included (6–8 or 5–8 or 7–8 would be included; but 6–12, 7–12, 8–12 would not). We used the boundaries to append the school-level data to the district boundaries. The dataset excludes charter school enrollments as districts do not typically operate charter schools, but we created a corresponding dataset with charter schools for analysis in future research. This study focuses on intra-district enrollment patterns, considering enrollment of students within districts because districts are the unit of analysis.
Our mapping strategy enabled us to determine a district’s population demographics and school student demographic characteristics for 2000 and 2020. These plots enabled us to examine changes in enrollment demographics over time and the distribution of intradistrict enrollment using segregation indices of isolation and dissimilarity. Dissimilarity indices are only effective when comparing two racial groups; therefore, we used White and Black, Indigenous, and Students of Color (BISOC) categories for analysis. The federal government labels the latter as “minority students,” for example, in their call to reduce “minority student isolation” (U.S. Department of Education [DOE] Office of Elementary and Secondary Education, 2022). We use the BISOC classification to adopt more inclusive language. Likewise, the district residential classification uses Black, Indigenous, and People of Color (BIPOC). We use a BISOC-White binary measure, but the full dataset offers more detailed racial categorizations that can be used for further research to examine changes in specific groups, such as comparing changes in the Black population to the White population or changes in the Latinx population to the White population. The data files are published to an open-access repository (Mann, 2024).
Our labeling strategy has limitations, as is true with any classification method. All classifications are reductive by design, and thus, a prominent limitation is that a White/BIPOC binary is a crude and generally inappropriate way to identify groups of people. Racial, cultural, and ethnic backgrounds are rich and vary significantly. The binary classification approach is used here because the goal is to understand at scale if and how formerly majority-White districts across the country have changed. This research does not focus on a single place or aim to understand the complex dimensions of diversity. Past and future research shows that the nuance and richness of these changes vary by region (Frey, 2018). Our analysis is intentionally broad and is not designed to capture nuance, and we acknowledge that diversity’s richness must be interrogated with additional quantitative and qualitative research.
District Classifications
The analysis determines changes in student enrollment in each district locale classification through the school plots and their corresponding data. Each district is classified into the following locales: urban, suburban, town, and rural. These locales correspond to the locale of the school district office. These classifications are drawn from the NCES urban-centric locale categories, and we collapsed them from 12 to four (NCES, 2022). There were originally three types of locales within each of the urban, suburban, town, and rural classifications, but we report findings with the four classifications to ease interpretation. We also analyzed the data using all categories and observed no benefit to including 12 locales in reporting.
There were two limitations with the district data. Due to data availability issues, we removed 6.48% of districts from the analysis. These removals include the entire states of Tennessee, Hawaii, and Alaska. Tennessee had no racial school enrollment data in 2000, and the land scan data did not cover Alaska or Hawaii. The findings, therefore, represent the universe of nationwide patterns less these states.
Another limitation in focusing on these districts comes with exploring within-district segregation rather than between-district segregation. Historically, most policies relate to within-district segregation, but research shows that between-district patterns tend to cause most racial segregation (Frankenberg, 2009). Exploring within-district patterns is still worthwhile because research shows that despite much segregation occurring between districts, school segregation would still decline in major cities if school districts created attendance zones that ensured students would attend their nearest school (Sohoni & Saporito, 2009). Further exploring different geographic areas, such as more macro-like metro areas or more micro-like attendance zones, will provide robustness to findings. Our study focuses on the district boundary because of its important historical role in driving migration patterns and defining the meaning of suburban places (Rury, 2020).
Demographic Change Analysis
We answer RQ1 by calculating the residential and student populations across locales in 2000 and 2020. We report total enrollment changes, the percentage of districts with majority White (50%+) residents in 2000, how this percentage changed in 2020, and the percentage of majority-White districts that experienced an increase in their BIPOC population by more than five percentage points and 10 percentage points. We also use ArcGIS software to map suburban districts and show those that changed to provide a visualization to assist in interpretation.
There are two limitations to the demographic change analysis. The first is that the percentage cutoffs are arbitrary. The cutoffs allow for a basic acknowledgment of change or not, which could have been at many different levels. To account for the arbitrary nature of this decision, we include two cutoffs rather than one and provide continuous kernel density plots of population and enrollment change so the reader can view the changes holistically (described in the RQ2 methods below). A kernel density plot is a curve representing a continuous variable’s distribution. It provides similar information as a histogram but offers a nuanced view by estimating the probability density function of the variable. The plot has an X- and Y-axis. The X-axis shows the variable’s value, which is the proportion of the reported demographic. The Y-axis represents the density of the value accounted for in the X-axis. For instance, if the variable is the proportion of the students who are White, a peak in the curve (on the Y-axis) at .5 (on the X-axis) indicates that many districts have about half of their student population identifying as White. A kernel density plot does not directly show the number of cases but rather how dense they are around specific percentages, giving insight into the distribution’s shape. We employed the Epanechnikov kernel density estimation using STATA software.
The second limitation is our change conceptualization could capture trends that occur due to unequal population decline rather than population growth. Both trend types shape the composition of a community, and we analyzed different growth and decline categorizations as robustness checks. Adjusting the classification to consider percentage change and growth in the count would reclassify 2.64% of districts, assuring us that there is no substantial difference based on the change classification strategy.
We answer RQ2 descriptively by comparing the racial demographic percentages of the student population with those of the residential population in each district in 2000 and 2020. The use of inferential statistics is not necessary, as the study is based on complete school enrollment demographic data reported by schools in the 47 states included in the study. Likewise, the census aims to provide a complete count of the residential population instead of relying on estimations. We report these findings in a table that compares the White resident and White student percentages across district locale classifications. We also provide kernel density plots for residents and students each year for each locale.
Segregation Analysis
We compare segregation indices at the school district level in 2000 and 2020 to answer RQ3 and RQ4. We answer RQ3 by counting and comparing the number of intensely isolated districts, those with a .90 (out of 1.00) isolation index, by district type for both White and BISOC student groups. We determined the intense isolation classification based on past research (Orfield & Ee, 2017, p. 12). The isolation index shows the proportion of students in schools with other students of the same race. For example, a White student isolation index score of .95 means a White student attends, on average, a school with 95% White students. Here is the equation:

where n is the number of schools; xi is the population of students with a given characteristic (e.g., White students) in school i; ti is the total population in school i; and XT is the total population of students with a characteristic (e.g., White students) in the district.
The isolation analysis for RQ3 comprised of two steps. First, we calculated an isolation score for each district in 2000 and 2020. Second, we classified and counted the intensely isolated districts in 2000 and 2020, as indicated by White or BISOC isolation scores of .90 or higher. We created a kernel density plot of White student isolation and isolation of students of color at each time point by locale to understand the distribution of isolated districts and how they differ depending on whether a district is urban, suburban, town, or rural.
The study answers RQ4 by comparing dissimilarity scores for each school district. The dissimilarity index shows how evenly students, based on race, are spread across schools within each district. Here is the equation:

where n is the number of schools; xi is the population of those with the first characteristic (e.g., White students) in a school i; and XT is the total population of those with the first characteristic (e.g., White students) of the district. Meanwhile, yi is the population of those with the second characteristic (e.g., BISOC) in a school i; and YT is the total population of those with the district’s second characteristic (e.g., BISOC). Dissimilarity is how evenly students are spread across a school district. For example, if a school district has 50% White and 50% Black students and each school has that exact composition, its dissimilarity score would be 0. If this district had two schools, one with 100% White and one with 100% Black students, its dissimilarity score would be 1.00.
The dissimilarity analysis comprised of two steps. First, we created a kernel density plot of racial dissimilarity at each time point for each district to understand the distribution of dissimilarity scores and how it differs depending on whether a district is urban, suburban, town, or rural. Second, we subtracted the dissimilarity score of 2000 from 2020 for each district. This calculation created a new score, the dissimilarity improvement score, which shows the change in dissimilarity in each district between the time points. A negative change suggests improvement, while a positive change suggests worsening. We created a histogram for each locale showing the distribution of districts relative to their dissimilarity improvement score.
Findings
RQ1: How Have School Districts’ Enrollment and Residential Populations Changed in 2020 Compared to 2000? How Do Changes in Suburban Districts Compare to Other Locales?
Most school districts experienced declining enrollments and racial change in their residential and student populations in 2020 compared to 2000. Table 1 shows the total student population by locale, revealing that almost every locale has seen a decline in student enrollment. The exception to this pattern is the suburbs, which comprise the highest number of students and the second highest count of school districts.
Elementary District Student Enrollment Changes and Residential Population Shifts From 2000 to 2020

Note. A majority-White district in this table is a district with 50% or more White residents. The last two columns on the right reflect districts that were majority White in 2000. BIPOC means “Black, Indigenous, and People of Color.”
Table 1 shows that 62.34% of all majority-White districts in 2000 experienced a more than five percentage point increase in residents of color, and 27.89% of majority-White districts experienced a more than 10 percentage point increase. The greatest number of changes occurred in suburban and urban districts. Table 1 shows that 56.48% of suburban districts experienced a more than 10 percentage point increase in residents of color, and the percentage of majority-White suburban districts fell from 91.39% to 80.26%. Meanwhile, 56.20% of urban districts experienced a more than 10 percentage point increase in residents of color, and the percentage of majority White urban districts fell from 77.23% to 57.64%.
Suburban changes are noteworthy considering the history of suburban White flight in the post-Brown era. As detailed in the literature review, these were once White-exclusive areas designed by and for White residents. Figure 1 shows all suburban districts in the United States. The districts in orange have experienced a more than 10 percentage point increase in residents of color, and those in blue have not. As the map shows, demographic changes in districts are not confined to a single region and occur across the United States.

Elementary suburban districts experiencing more than a 10% increase in the BIPOC population between 2000 and 2020.
RQ2: How Do School Districts’ Residential Population Changes Reflect School Enrollment Changes? How Do Changes in Suburban Districts Compare to Other Locales?
Racial changes have happened more in the student than in the residential population, and this gap intensified between 2000 and 2020. Table 2 shows the changes in racial demographics in student enrollment compared to the population. There were 9.28 percentage points more White residents than students in 2000 (Column 5, last row) and an 11.79 percentage point difference in 2020 (Column 6, last row). These numbers reflect a 2.51 percentage point increase in the gap (Column 7, last row). The increase in this gap was most significant in the suburbs, which had a 7.37 percentage point difference in 2000 (Column 5, first row) and an 11.49 percentage point difference in 2020 (Column 6, first row), which means a 4.12 percentage point increase from 2000 to 2020 in the gap between residents and students (Column 7, first row). The White student percentage in the suburbs in 2020 was 45.68% (Column 4, first row), making the suburban student population majority-BISOC.
White Elementary Student Population and White Residential Population Percentage in 2000 and 2020
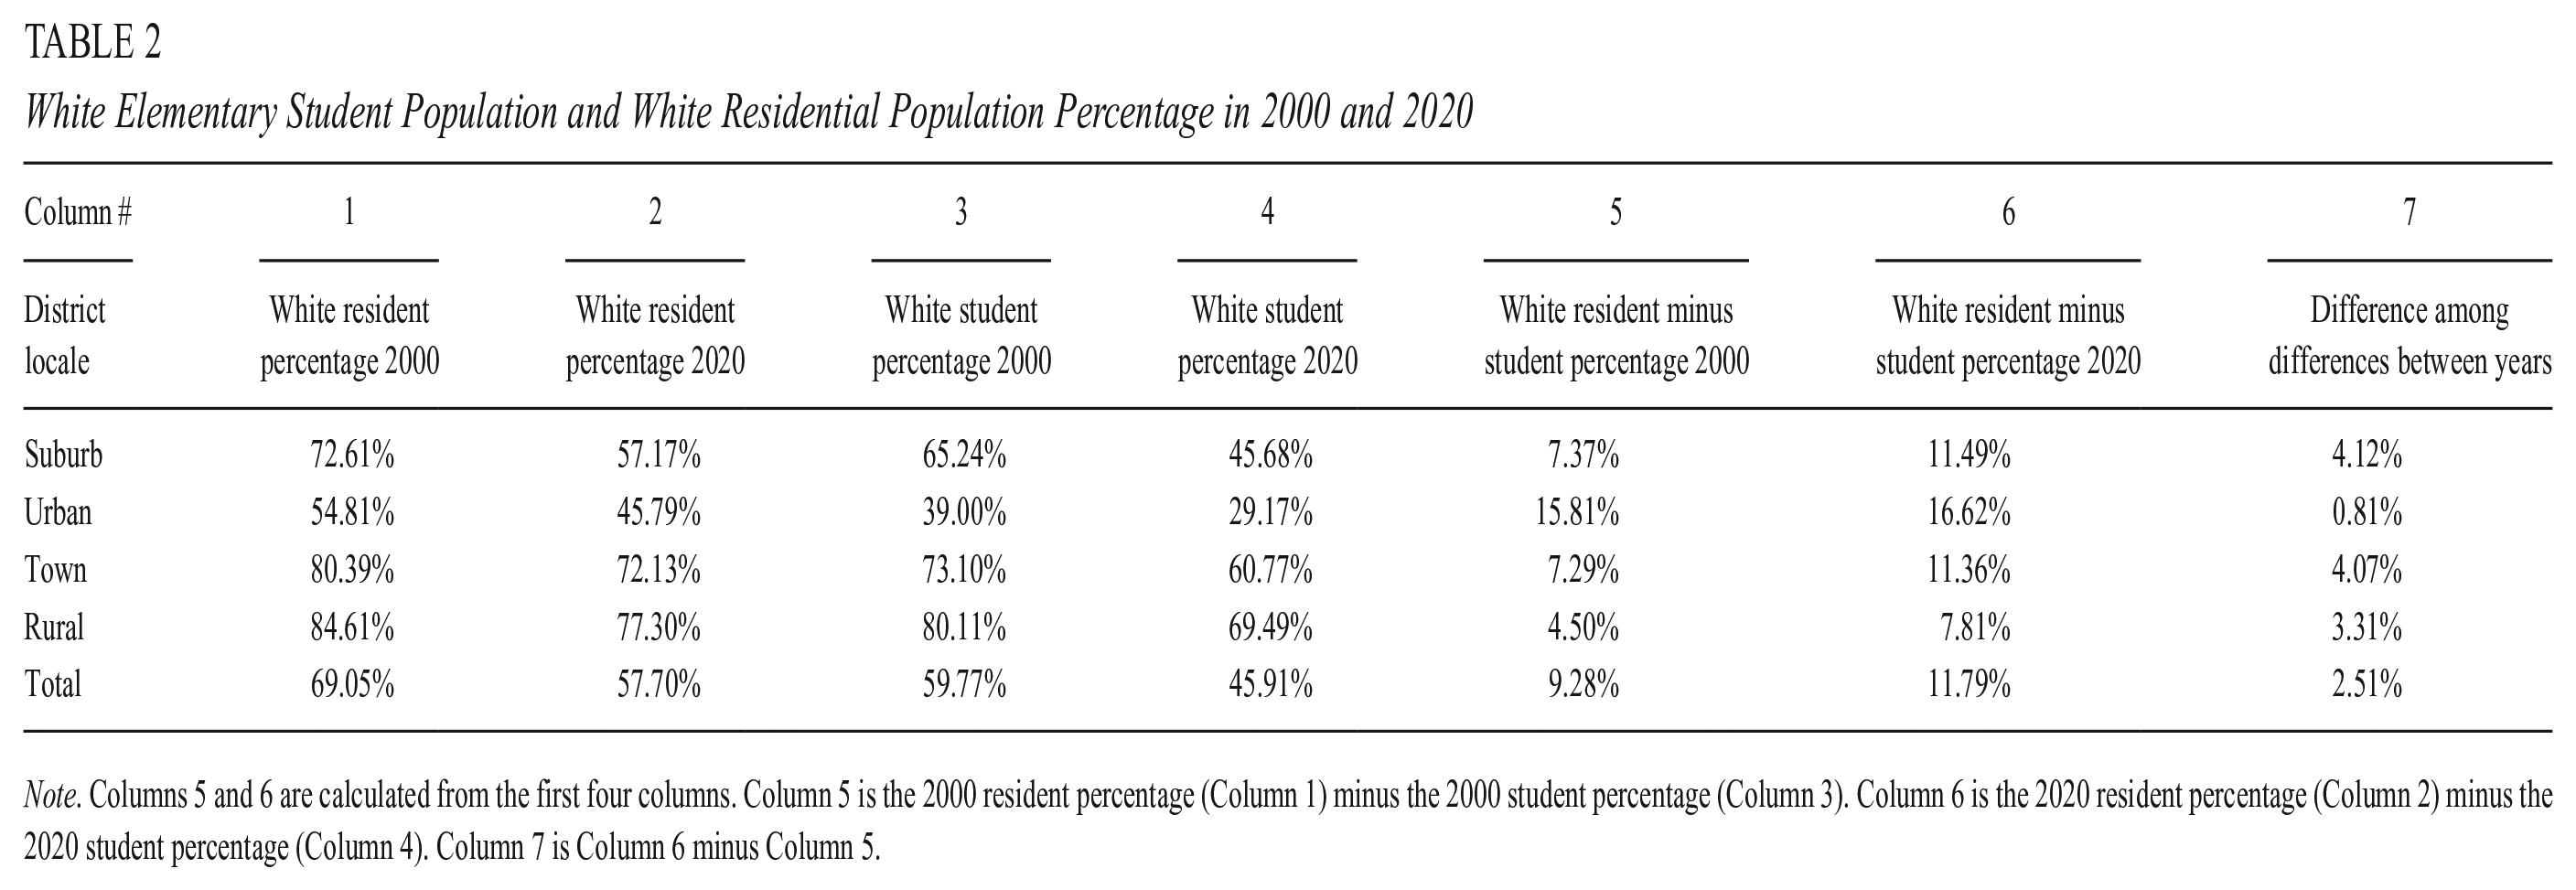
Note. Columns 5 and 6 are calculated from the first four columns. Column 5 is the 2000 resident percentage (Column 1) minus the 2000 student percentage (Column 3). Column 6 is the 2020 resident percentage (Column 2) minus the 2020 student percentage (Column 4). Column 7 is Column 6 minus Column 5.
Figure 2 shows the kernel density plot of the White resident and student percentages. This graph reiterates the findings above, showing peaks of majority-White districts across locales in 2000 that declined in 2020. The peaks are consistently sharper in the residential populations than in student populations across time points. The peak of the White student population in the suburbs has shifted from a peak of White students near 90% in 2000 to about 80% in 2020. This peak is flatter in 2020, indicating a broader array of White student percentage distributions. Meanwhile, the urban distribution of students shows a declining White student trend to the point that a peak is forming in districts with low (less than 20%) percentages of White students in 2020.

Kernel density plots of White resident and White student percentages in 2000 and 2020.
RQ3: How Have School Districts’ Student Racial Isolation Indices Changed? How Do Changes in Suburban Districts Compare to Other Locales?
The isolation analysis reveals reduced percentages of intensely White-isolated districts and increased percentages of intensely isolated BISOC districts. Table 3 shows that 53.50% of districts had a .90 or higher White isolation index in 2000 and 27.12% in 2020. There were 2.99% .90 or higher BISOC isolated districts in 2000 and 5.90% in 2020. The declines in the intensely isolated White districts and the increases in intensely isolated BISOC districts were most prominent in the suburbs and urban districts.
Change in Elementary Districts With .90 White or BISOC Isolation Index, 2000 and 2020

Note. BISOC means “Black, Indigenous, and Students of Color.”
Figure 3 shows the distribution of the White and BISOC isolation indices in 2000 and 2020. The distribution of the White isolation index has flattened in each locale. The 2000 White isolation figure reveals a spike in the White isolation scores of approximately .90 in every locale except urban, but these fell in 2020, although rural and town are still denser near .90. The suburban distribution is flatter, has a smaller spike, and is denser nearer .80 in 2020 compared to 2000. Meanwhile, the BISOC figure shows spikes on the opposite end of the distribution with flattening curves from 2000 to 2020. A notable change in the BISOC distribution is the beginning of a spike in urban locales of intensely isolated BISOC districts. These graphs collectively show the reduction of White intensely isolated districts, especially in the suburbs, and increases in intensely isolated BISOC districts, especially in urban locales.

Kernel density plot of district student isolation in 2000 and 2020.
Figure 4 depicts changes in intensely isolated White districts on maps in 2000 (top) and 2020 (bottom). The maps reveal widespread declines across the United States in intensely White-isolated districts across several states. National patterns generally hold, but regional variations in isolation exist. These variations merit future research. For example, Massachusetts, Rhode Island, Michigan, Wisconsin, Minnesota, the Dakotas, Iowa, Kansas, Wyoming, Washington, Oregon, the eastern portion of Pennsylvania, and the western portion of Virginia have significantly reduced intensely White isolated districts. Meanwhile, intensely isolated BISOC districts have risen. The BISOC pattern is less observable on a national map due to small relative percentages (which is why one is not shown).
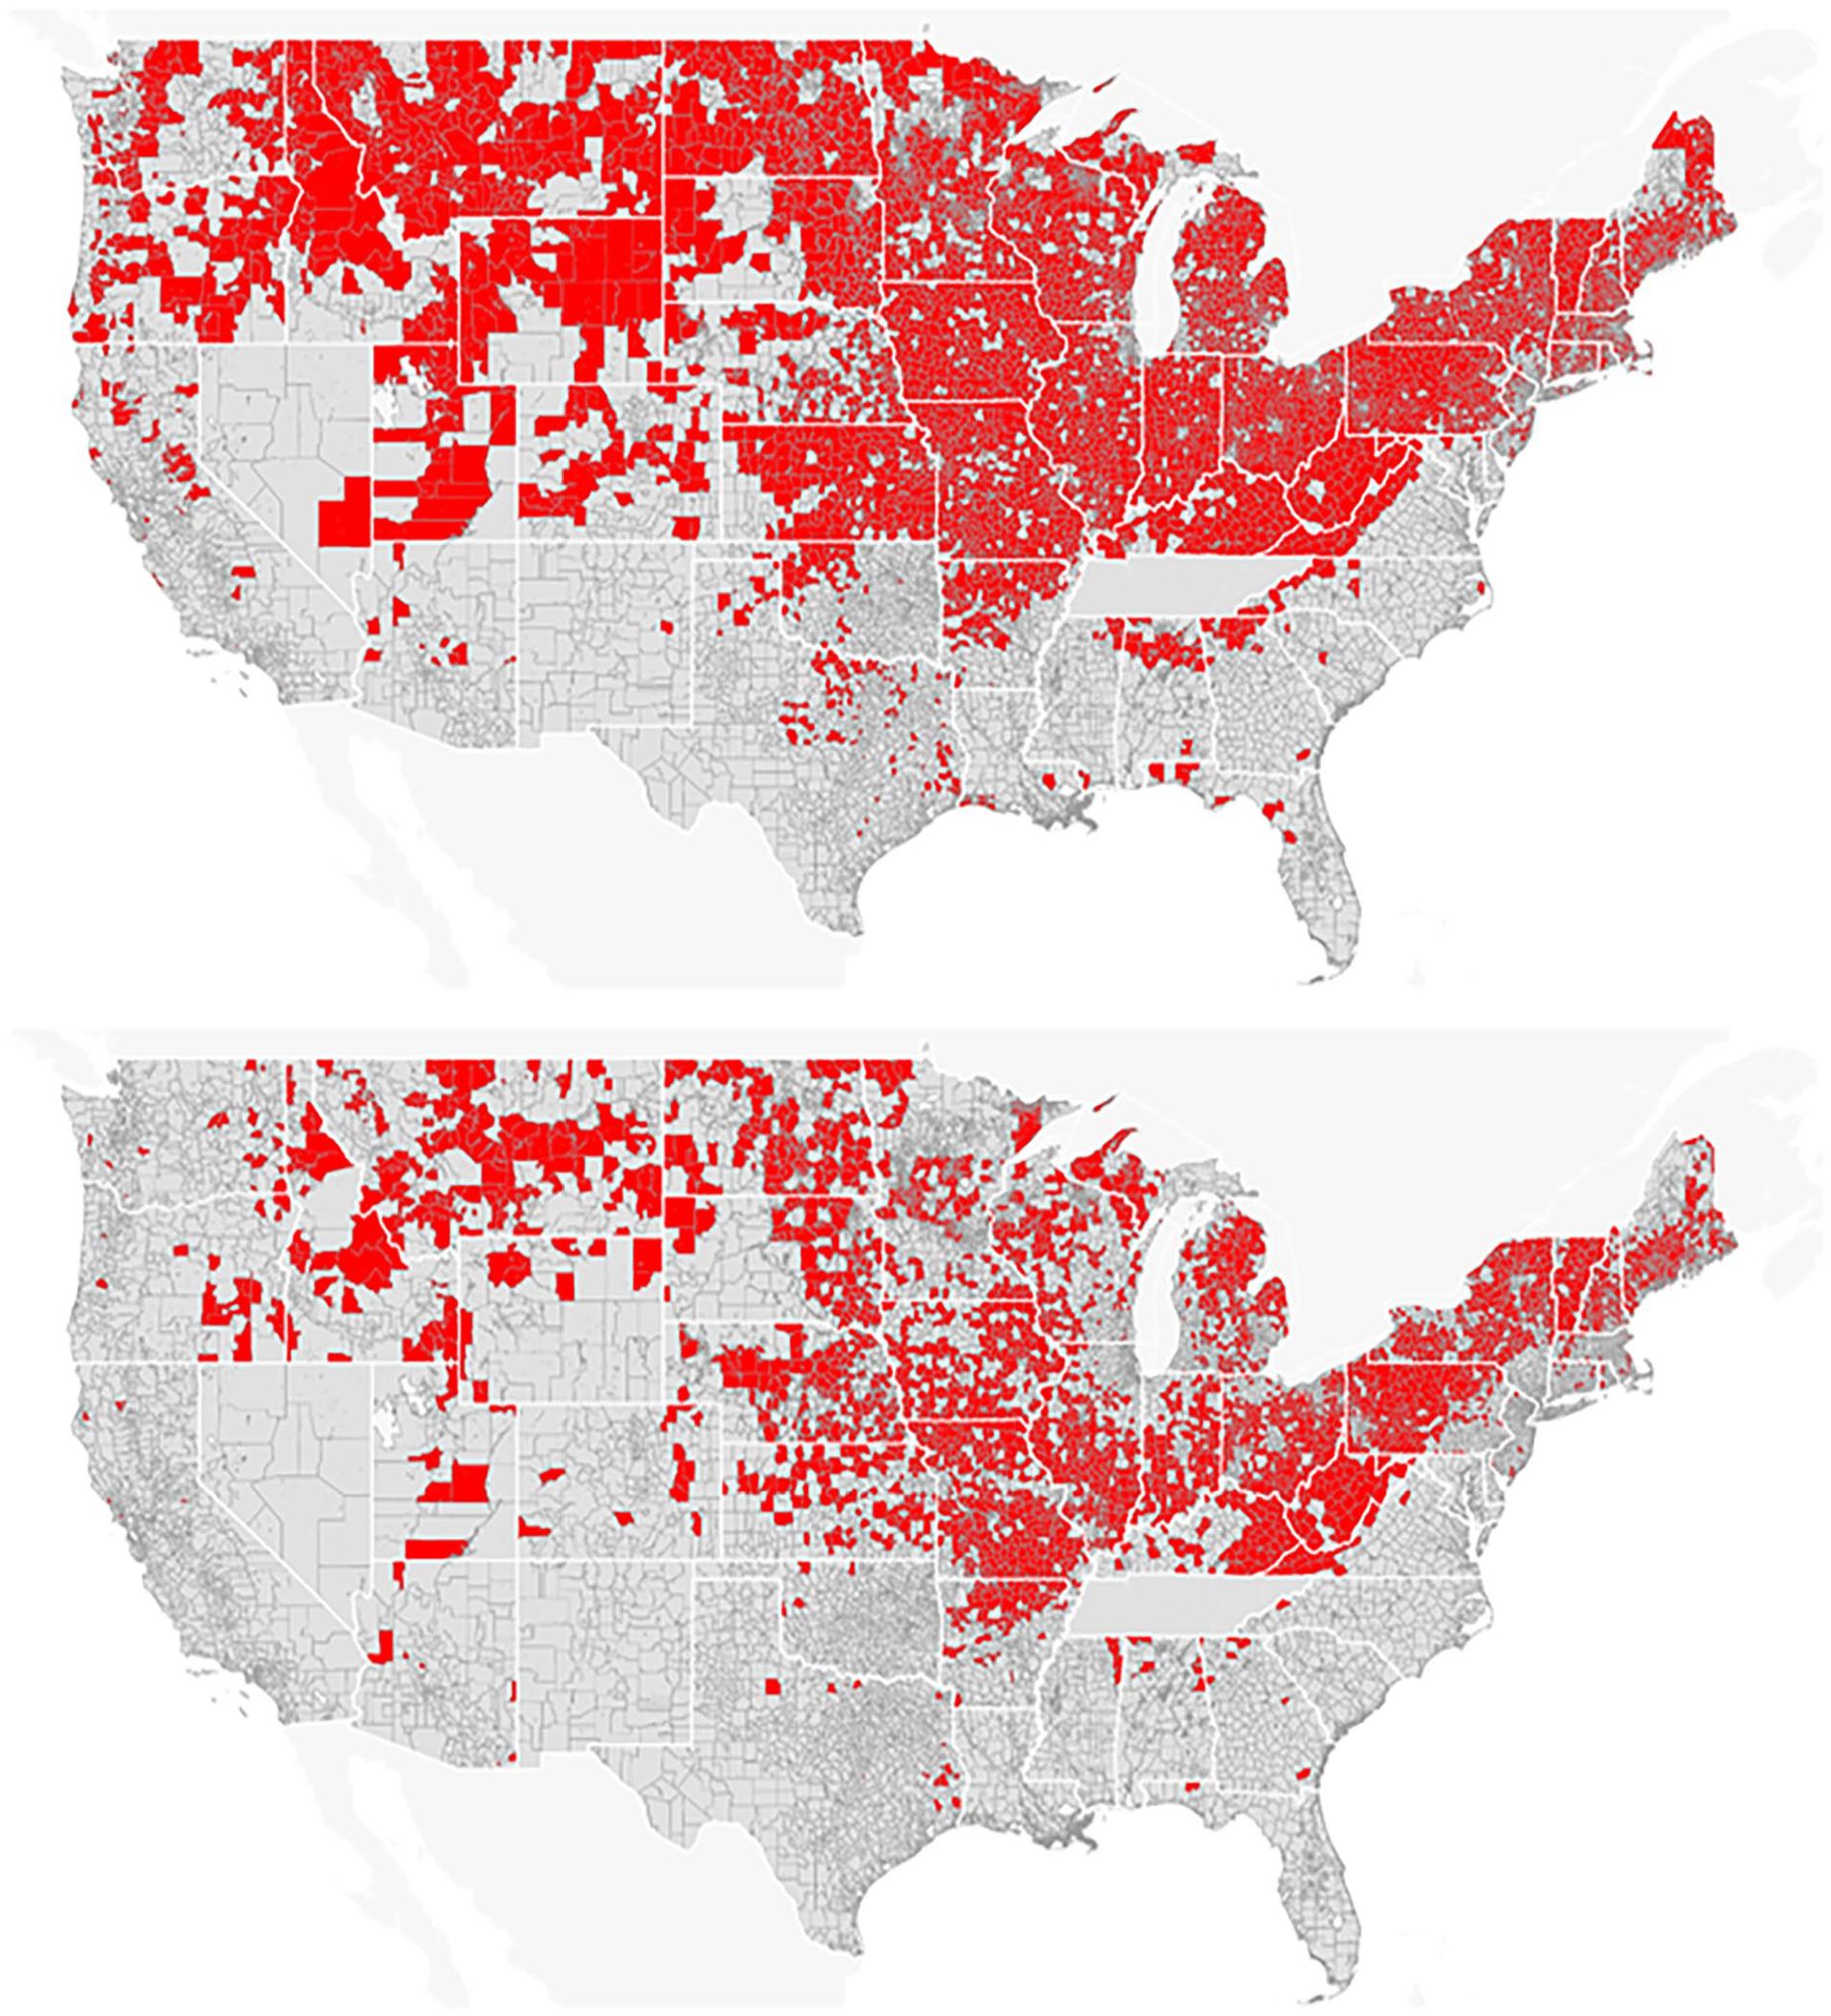
Elementary districts with White student intense isolation in 2000 (top) and 2020 (bottom).
RQ4: How Have School Districts’ Racial Dissimilarity Indices Changed? How Do Changes in Suburban Districts Compare to Other Locales?
The dissimilarity scores within districts generally remained low in 2000 and 2020, indicating that patterns outside districts, such as segregation between districts, cause most school isolation. The kernel density plot in Figure 5 shows the distribution remains similar between years, with the main difference being a higher density near the lowest end of the distribution for all district types except urban districts. This finding suggests that there is more unevenness in urban districts than in other locales, raising the possibility of continued segregation despite gentrification in urban locales.
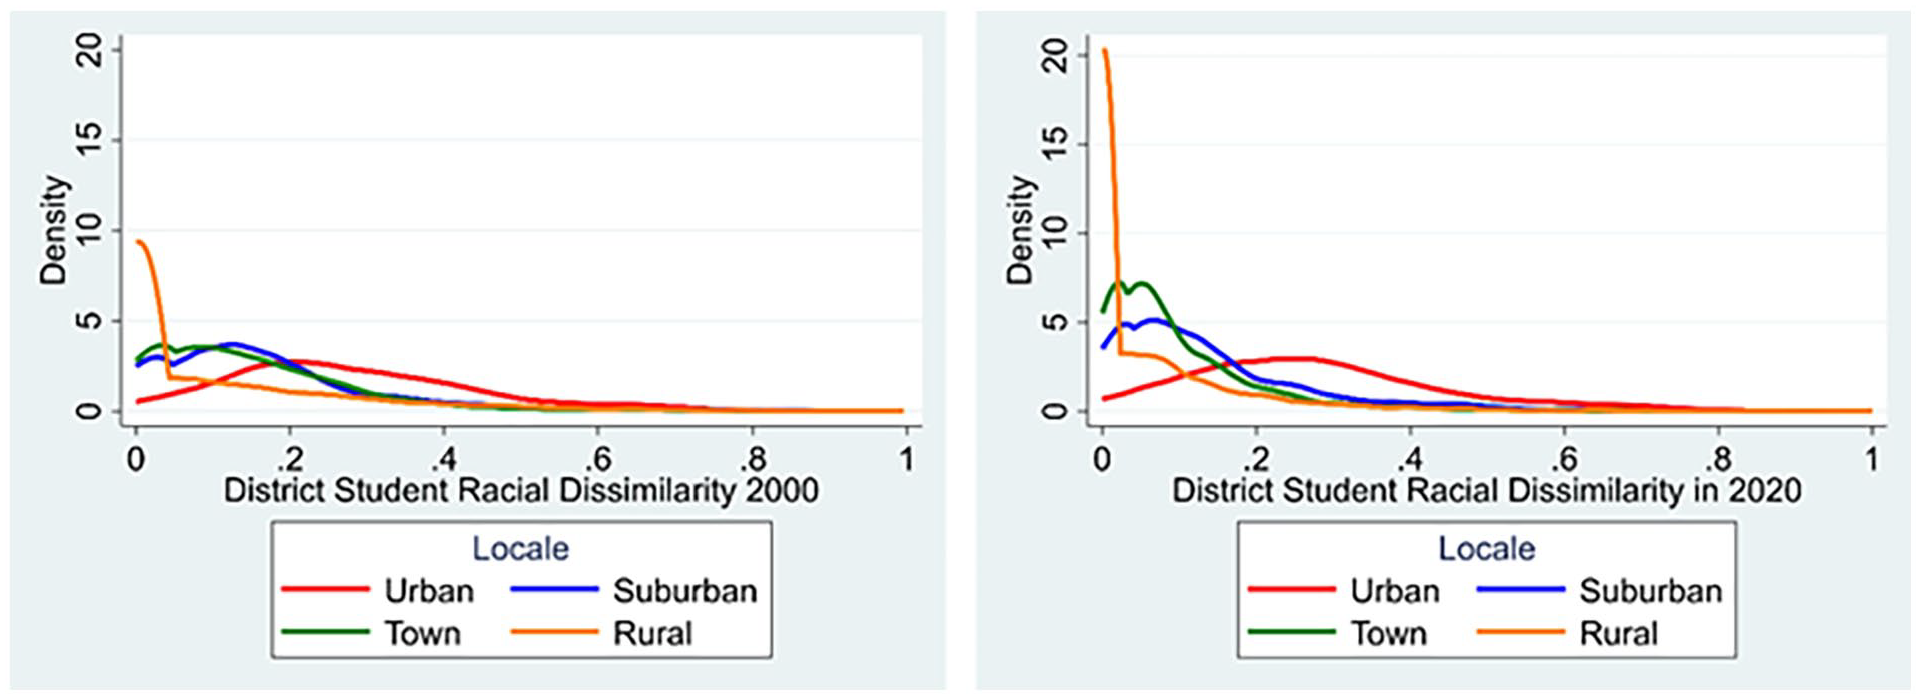
Kernel density plot of elementary district racial dissimilarity in 2000 and 2020.
The dissimilarity improvement score findings show that 24.04% of all districts saw their scores worsen. This number was 33.86% in urban districts, 30.72% in suburban, 24.24% in town, and 19.82% in rural. Put another way, in most districts across the country, dissimilarity is the same or improved alongside the demographic changes, but there were still many districts with worsening scores. Figure 6 shows the distribution of dissimilarity improvement scores across districts across locales; most show no substantial change. This figure suggests that most districts have similar evenness levels despite demographic changes, but these trends vary.

Elementary district dissimilarity improvement score from 2000 to 2020.
Discussion
The answers to the RQs reflect five main findings. First, most school district locales across the United States face declining enrollment except for the suburbs. Second, most majority-White districts across locales are experiencing racial demographic change, and these changes are amplified in the suburbs. These changes have led to a declining number of majority-White districts. Third, the student population across locales is experiencing racial change to a greater extent than the residential population, which has been consistent in urban locales but is now amplified in the suburbs. Fourth, demographic change has substantially reduced the number of intensely isolated White districts, but there has been an increase in intensely isolated BISOC districts. Fifth, dissimilarity indices have not changed for most districts, but 24.04% of districts nationwide worsened, including 33.86% in urban districts, 30.72% in suburban, 24.24% in town, and 19.82% in rural. The dissimilarity index changes suggest that segregation indices improve more in areas where residents of color migrate at higher levels (suburbs) than where White residents migrate at higher levels (urban locales).
Much academic research on demographic change focuses on urban gentrification and its impact on school enrollment (Finio, 2021; Hackworth & Smith, 2001; Lacy, 2016). Other scholars note that a “diversity explosion” is occurring across the United States, particularly in majority-White areas (Frey, 2018). Our study shows that most school districts in the United States are experiencing changing racial compositions in 2020 compared to 2000. These patterns are not a regional phenomenon. Instead, as others have shown, they are occurring across the United States (Massey, 2008). Our study supports Diamond et al. (2021), who suggest that while research on gentrification is noteworthy, the predominant changes happening in the United States are in majority-White districts, especially the suburbs. Thus, our findings have implications in three domains: demographic, policy and leadership, and theory.
Demographic Implications
The segregation analyses indicate a demographic dilemma due to racial change: While majority-White school districts are becoming more diverse, majority-BIPOC school districts are experiencing increasing isolation. These findings reflect previous research that shows that the relationship between neighborhood and school changes is complex (Candipan, 2019). The reasons for the decline in intensely isolated White districts and the rise in intensely isolated BISOC districts require deeper qualitative investigation and more in-depth case studies, which are beyond our study’s scope. One possible reason could be demographic: As the proportion of students of color in the national population increases, so does the number of students of color in both majority-White and majority-BIPOC districts. As a result, decreasing White concentrations in majority-White districts reduces White isolation, while increasing concentrations in majority-BIPOC districts heightens the isolation of students of color.
While the above demographic explanation is plausible, the explanation is complicated by trends of increased gentrification in cities, where more White residents are moving into areas predominantly inhabited by residents and students of color, which could hypothetically reduce BISOC isolation (Mordechay & Ayscue, 2020; Stillman, 2012). These urban trends, combined with suburban diversity trends, suggest that families of color may be making more integrative moves in suburban districts compared to White residents in cities. Further investigation is needed, as our national-level analysis only hints at these patterns and cannot uncover their depth and specificity.
The most effective way to uncover trends and motivations behind specific demographic and school enrollment patterns is through research within local contexts. For example, Mordechay and Terbeck (2023) provide a detailed examination of racial change in Chicago, explaining how population and enrollment changes occur in this metropolitan region. Given the scope and nature of our findings, our study should catalyze further localized research on the intricacies of demographic change and school segregation. Our study raises numerous questions that cannot be answered without further research: Why do isolation patterns differ between suburbs and urban locales? What are patterns within schools? Are White families more likely to avoid urban schools than families of color are to avoid suburban schools? Why? These questions highlight the complexity of demographic change and school segregation, underscoring the continued need for nuanced, context-specific investigations. Future research must delve into localized patterns to better understand the sociodemographic dynamics shaping local trends.
Policy and Leadership Implications
Policymakers, district administrators, and scholars must continue exploring strategies for dismantling inequitable practices in past and present suburban contexts (Diamond, 2006; Rury, 2020). This task is as essential now as ever, as our study shows that suburban school districts are racially diversifying. Policymakers and leaders must leverage these changes to reduce school segregation and promote integration. The urgency of reducing segregation stems from the knowledge that segregated schools lead to fewer resources for students of color, exacerbating achievement gaps in student outcomes (Ayscue et al., 2017; Clotfelter, 2004; Condron et al., 2013; Ladd, 2008; Mordechay & Orfield, 2017). Additionally, segregation intensifies the perils of a divided society, fostering division and bias (Ayscue et al., 2017; Eberhardt, 2019; Orfield et al., 2016).
Policy and leadership opportunities exist to leverage demographic changes to promote integration and educational equity. However, these opportunities come with challenges. Segregation occurs for various reasons, including White flight, school choice, school district secessions, and the enrollment and within-school tracking patterns set by school boards (Clotfelter, 2004; De la Roca et al., 2018; Frankel & Volij, 2011; Frankenberg, 2017; Mordechay & Orfield, 2017; Orfield, 2013; Siegel-Hawley et al., 2018). These factors pose challenges to leveraging demographic change for integration and equity, making effective management in diversifying districts a delicate task. Leaders and policymakers should use research-based strategies to support school and housing policies that reduce segregation and promote integration (Ayscue & Frankenberg, 2020).
Efforts to integrate student populations must be undertaken carefully to ensure they do not perpetuate inequality and racism in new ways. Even if district leaders and policymakers facilitate integrative patterns, there is a risk that students of color may not receive adequate support. School leaders have traditionally struggled to foster diversity, equity, and inclusion because they often pursue color-neutral practices that are designed to avoid the tensions and difficulties associated with advocating for equitable school systems (Diem et al., 2014; Turner, 2020; Welton et al., 2015). Research on integrated schools and districts indicates that district leaders and policymakers tend to seek assimilation strategies rather than honoring and including students from BIPOC backgrounds and implement programs and policies that harm students of color (Diamond, 2006; Evans, 2007; Lee & Hawkins, 2015).
Leaders should ensure that students of color are not burdened and that classes are integrated within schools (Holme & Finnigan, 2018). Leaders should also look to frameworks like Contact Theory, which advocates for equal status, common goals, and cooperative interdependence among everyone in a school building (Allport, 1954; Grapin et al., 2019). Districts must create antiracist policies rather than focusing on race-neutral technical changes (Diem et al., 2016; Holme et al., 2014). Qualitative research emphasizes that race-neutral policies in suburban school districts are an inadequate response to decades of discriminatory policies and practices (Turner, 2020). Leaders must recognize how inequity occurs across different domains of the educational ecosystem (Diem et al., 2022). Addressing issues systemically is crucial, rather than focusing solely on individual and cultural definitions of inequality (Turner, 2015). In short, increasing diversity in suburban school districts is necessary but insufficient for disrupting entrenched inequitable patterns.
Theoretical Implications
This study raises critical issues for scholars, especially those researching and theorizing about cities and suburban spaces. Historically, the suburbs were designed by and for White people and are conceptually construed as “White spaces” (Erickson, 2012). Our analysis shows that the suburbs no longer reflect the reality of being exclusively White. While most suburban residents are still White, White students in 2020 only make up a plurality in suburban schools. Of course, there are national variations in the diversity of suburban districts, so readers should consider local contexts when evaluating these claims. However, the fact remains that suburban school districts are more racially diverse in 2020 than they were in 2000. In 2000, a White student, on average, attended school with 90% White students in 43.20% of suburban districts. By 2020, this number decreased to 6.87% of districts. Suburbs across the United States are no longer synonymous with districts exclusively comprised of White students.
These patterns occur amidst a history of racialized spatial imaginaries and anti-Blackness occurring with the “persistence of historical force”—from literacy laws to Jim Crow to the court rulings that established de facto arguments as the new grounds for segregation (Sexton, 2016, p. 6; Weathersby & Weathersby, 2019). Jenkins (2021) theorizes “an anti-Black spatial imaginary as the prevailing spatial logic that has shaped the configuration and character of American social intuitions, including K-12 schools” (p. 107). The historical decisions of White families were not solely motivated by the race-neutral benefits of suburban education; rather, anti-Black imaginaries likely informed their decisions to avoid majority BIPOC districts. Given the current reality of diversifying suburbs, theories need to evolve to include contemporary suburban trends. One possibility is that anti-Black spatial imaginaries could also influence the decisions of families of color. This possibility would suggest an internalization of historically White places as beneficial, prompting moves by BIPOC families into suburbs despite their past racial exclusivity. However, this explanation is speculative and requires scholars to research the motivations and conceptualizations of the contemporary trends uncovered in this study.
Additionally, past scholars have used terms like multiculturalism and race-related educational research when examining urban contexts. Prominent scholars in the urban educational research space have even suggested that “urban” is defined through race and not the size of a place (Milner, 2012). This framing implies that the suburbs are becoming increasingly “urban,” or, perhaps more appropriately, scholars must redefine these labels.
Our findings suggest the need to expand suburban scholarship to reconceptualize and capture the nuance of evolving demographic shifts, as the “census-convenient” definition treats suburban schools as homogenous and monolithic (Lewis-McCoy et al., 2023, p. 4). Geospatial techniques can help provide data to inform both qualitative and quantitative approaches to conceptualizing suburbs beyond the notions of proximity to urban centers, size, and population density (Welsh & Swain, 2020). Since the spatial imaginaries of urban and suburban schools are tied to racial imaginaries, our geospatial approach to isolation and dissimilarity indices can challenge the homogeneous categorization implicit in the historical “census-convenient” definition. Geospatial techniques provide scholars, policymakers, and administrators with demographic data to understand the dissolution of essentialized conceptions of urban and suburban districts based on racial classifications.
Suburban school districts can no longer be synonymous with “exclusively White school districts.” How leaders and policymakers leverage demographic changes will shape future geographies of meaning for students and families (Buendia et al., 2004). Leaders and policymakers will determine whether the suburbs become synonymous with “diverse and equitable” or are remembered as “missed opportunity” districts. While the current meaning of the suburbs is yet to be solidified, one certainty is that these suburbs are not the same in the 2020s as they were in the 2000s.
Footnotes
Acknowledgements
We thank Maxwell Titus at ESRI for his support on the project.
Declaration of Conflicting Interests
The author(s) declared no potential conflicts of interest with respect to the research, authorship, and/or publication of this article.
Funding
The author(s) received no financial support for the research, authorship, and/or publication of this article.
Authors
BRYAN MANN is an associate professor in the Department of Educational Leadership and Policy Studies and Director of the Center for Geography of Education Policy at the University of Kansas, 404 Joseph R. Pearson Hall, University of Kansas, 1122 W. Campus Rd., Lawrence, KS 66045;
RYAN FITZPATRICK is a field instructor at the Institute for Urban Education at the University of Missouri-Kansas City and a PhD candidate in Educational Policy at the University of Kansas;
DANIAH HAMMOUDA is a doctoral candidate at the University of Kansas, Lawrence, KS;