
Abstract
We investigate whether and how Achieve Atlanta’s college scholarship and associated services impact college enrollment, persistence, and graduation among Atlanta Public School graduates experiencing low household income. Qualifying for the scholarship of up to $5,000 per year does not meaningfully change college enrollment among those near the high school GPA eligibility thresholds. However, scholarship receipt does have large and statistically significant effects on early college persistence (i.e., 14%) that continue through BA degree completion within 4 years (22%), although scholarship receipt does not impact graduation from 2-year colleges. We discuss how the selection criteria and processes of place-based programs intended for those from economically disadvantaged backgrounds may influence results for different types of students.
Introduction
Over the past three decades, published “sticker” prices of college have increased faster than inflation in all sectors of higher education. For example, from 1991 to 2021, average list tuition and fees to attend a public, 4-year institution increased 158% (from $4,160 to $10,740 annually). Such trends have fueled the perception that the United States is facing a crisis of college affordability (Heinrich, 2017), especially for students not from high-income backgrounds. In addition to the rise of college sticker prices, financial aid increased at a slower rate than list prices (Ma & Pender, 2021) and is a complex and uncertain process (Turner, 2018) that can hinder students’ ability to predict and access the aid that is available to them (Dynarski & Scott-Clayton, 2006). For example, under the current system, students do not know how much they will have to pay out of pocket to attend a given college until they have applied for both admission and financial aid and have received a financial aid package from that school. Place-based financial aid programs have the potential to impact students as they move into and through college and provide distinct and clearly articulated financial support to students and their families.
Place-based financial aid programs have grown in prevalence throughout the United States over the last two decades. The programs vary on several dimensions, including qualification criteria, financial generosity, 1 and flexibility. They generally seek to support college enrollment, affordability, and success among students who attend and graduate from secondary school in a designated district or other geographically defined area. In addition to financial aid, some also provide coaching and other support services (e.g., help completing the FAFSA [Free Application for Federal Student Aid]) to guide students through the complexities of accessing and succeeding in college. In this way, place-based programs have the potential to affect students’ journeys into and through college in numerous ways: encouraging application for college and financial aid; facilitating enrollment, persistence, and success through support services; and increasing college affordability and reducing student debt through direct financial support.
In this article, we report on the implementation and impact of a place-based college scholarship and associated student supports provided by Achieve Atlanta (AATL), a nonprofit organization founded in 2015 with the goal of improving college access, persistence, and completion for students graduating from the Atlanta Public Schools (APS). 2 Half of the district’s students are classified as “economically disadvantaged,” and three-quarters qualify for free or reduced-price meals (FRPM). 3 The signature component of AATL is the Achieve Atlanta Scholarship, available to students experiencing low-income to help cover the costs of postsecondary education (inclusive of tuition, room, board, and student fees). 4 The scholarship is generous, with a maximum value of $5,000 per year for up to 4 years to attend a 4-year institution or $1,500 per year for up to 2 years to attend a 2-year college or postsecondary technical program. AATL Scholarship funds may be used at any accredited, nonprofit school within Georgia or a school outside of Georgia, so long as it has a graduation rate of at least the national median. 5 This flexibility to take funds outside of the state differs from many other place-based scholarship programs, which more typically provide funding to attend specific institutions or institutions within a specific geographic region (e.g., a particular state). To date, the program has awarded over 4,400 scholarships.
Qualifying for AATL’s scholarship relies on a combination of place-, merit-, and need-based criteria. To be eligible, students must graduate from an APS high school, having attended for at least their last 2 years of high school. In addition, students must have achieved a final cumulative grade point average (GPA) of at least 75 (out of 100) to qualify for the $1,500 per year scholarship or a GPA of at least 80 to qualify for the $5,000 per year scholarship. 6 Finally, students must experience low income as indicated by an Expected Family Contribution (EFC) to the cost of college of below $8,00.
AATL supports can also include additional, nonmonetary services. Specifically, several partnering colleges that enroll AATL scholars have a dedicated, on-campus AATL counselor. This counselor supports AATL scholars to navigate college-specific issues and processes, such as course registration. In addition, recent cohorts of AATL scholars have had access to one-time “emergency grants” of up to $500 to help pay for living costs, books, transportation, and other expenses and “completion grants” for those needing additional financial support in their final year of college. Beyond the colleges with dedicated counselors, AATL additionally partners with two external coaching organizations—Beyond12 and Edu-Tech Enterprises—to provide support to students attending other in-state institutions.
We estimate the impacts of AATL’s scholarship and other supports using two analytic strategies. First, we use a regression discontinuity design (RDD) to assess the impact of scholarship eligibility on college enrollment. At the 75 GPA threshold, the comparison is between eligibility for the $1,500 scholarship (above) versus no scholarship (below). At the 80 GPA threshold, the comparison is between eligibility for the $5,000 scholarship (above) versus the $1,500 scholarship (below). Second, we use regression analyses together with a host of sensitivity analyses to assess the impact of scholarship receipt on college persistence and completion, conditional on enrollment. 7
To preview our results, our regression discontinuity analyses reveal no impacts of scholarship eligibility on overall college enrollment or college quality at either GPA threshold. As discussed in more detail below, we reason that this result is not necessarily unexpected, given the scholarship’s complex eligibility criteria and the timing with which scholarship qualification is finalized after high school completion. In contrast, our regression analyses reveal that, conditional on enrollment, scholarship receipt is associated with large and statistically significant improvements at all stages of college persistence through to 4-year college completion. 8 We do not find evidence that scholarship receipt influences 2-year college completion.
Lastly, the effects of AATL Scholarship receipt on persistence vary by high school GPA. There are no positive effects for scholars with a GPA between 75 and 8. Whether the lack of impact for students in this GPA range is driven by the relatively small award ($1,500 per year) or the high likelihood of attending a 2-year college is impossible to disentangle. In contrast, the scholarship’s effect is largest for students with GPAs between 80 and 9. Many of these students, particularly those with GPAs below 85, are ineligible for Georgia’s generous HOPE scholarship, and none of the students within the GPA range of 80 to 90 are eligible for the state’s even more generous Zell Miller scholarship. 9 The HOPE scholarship and, to a greater extent, the Zell Miller scholarship cover a large fraction of college tuition for in-state students. We see almost no effect of the AATL scholarship for recipients with GPAs above 9. These academically advanced scholars have access to other grants and also have higher rates of persistence than peers with lower GPAs.
Overall, this work contributes to our understanding of college scholarships and more specifically, place-based scholarship programs for students experiencing low income, many of whom are also first in their family to attend college. This is particularly important in the Atlanta context, where most students face financial hardship, and the other place-based scholarships potentially available to them, HOPE and Zell Miller, are merit-based. At the end of this article, we discuss in greater detail the potential factors that contribute to the results we observe and the broad, practical lessons we derive from our findings.
Background: Literature Review and Conceptual Model
The literature on the impact of financial aid on college access and success is substantial. For recent comprehensive reviews, see Dynarski et al. (2023) and Nguyen et al. (2019). Here we briefly summarize the relevant literature related to place-based scholarships, specifically. The AATL scholarship is an example of a place-based scholarship, a model of financial aid provision that has gained a substantial foothold in the U.S. college-going landscape over the past two decades. The Kalamazoo Promise was among the first in 2005, and since that time, over 100 communities have followed suit, typically with investments from local philanthropies, businesses, and individual donors. 10 Although AATL focuses on providing aid exclusively to students experiencing low income, this is not the case for all place-based scholarships. Nevertheless, many existing place-based scholarships focus on school districts or other geographic areas that serve large shares of economically disadvantaged students. For example, Kalamazoo Public Schools and Pittsburgh Public Schools, both districts supported by prominent and generous place-based scholarship programs, serve student bodies in which two-thirds of students are identified as economically disadvantaged. 11
Typically supported by a mix of public and private funding, place-based scholarship programs have multifaceted goals, including promoting local economic and workforce development, stabilizing populations, fostering a college-going culture in the K–12 context, and directly promoting postsecondary attainment through financial subsidy (Swanson et al., 2020). These place-based programs often adopt the “Promise” nomenclature to provide clear signaling that college can be a financially viable option for students. Indeed, qualitative work found that the Pittsburgh Promise “put college on the table” for students who perceived college to be out of reach financially (Page & Iriti, 2016). This finding aligns with quasi-experimental evidence that place-based scholarship programs in localities such as Kalamazoo and Pittsburgh as well as New Haven, CT, and Knox County, TN, have contributed to increases in college enrollment, persistence and completion (Andrews et al., 2010; Bartik et al., 2021; Bell & Gándara, 2021; Bozick et al., 2015; Carruthers et al., 2020; Daugherty & Gonzalez, 2016; Gonzalez et al., 2014; Page, Iriti, et al., 2019; Ruiz et al., 2020; Swanson & Ritter, 2020).
Looking across these place-based scholarships, variation in factors such as program generosity, flexibility, complexity of programmatic requirements, and uncertainty of eligibility may help to explain variation in program effects (Dynarski & Scott-Clayton, 2006; Swanson et al., 2020). In the context of other place-based programs, the AATL scholarships are similar in terms of overall generosity and are comparatively more flexible, in that students can use scholarship funds to attend most institutions in Georgia and even some institutions in other states. On the other hand, accessing funds requires applicants to meet several criteria, leaving students potentially uncertain of their own eligibility prior to applying, which can range from the fall of their senior year through most of the spring. Among those who do apply, students must wait until after high school completion for their final cumulative GPA and their scholarship eligibility, as a result, to be finalized. Other sources of financial aid, including those directly from the institution in which the student enrolls, typically are equally if not more uncertain when students are applying to college.
Conceptual Framework
Such complexity, uncertainty, and delayed timing in the financial aid process across the United States have been recognized as barriers both to college access and to the effectiveness of financial aid as a tool for improving college-going outcomes (Dynarski & Scott-Clayton, 2006; Dynarski et al., 2022). These points are elucidated by a pair of studies focused on the University of Michigan. First, Dynarski et al. (2021) collaborated to design and experimentally test an initiative through which the university sent targeted, personalized outreach to high-achieving high school seniors from low-income backgrounds who resided in the state of Michigan. This outreach included an offer of an unconditional guaranteed scholarship to cover tuition and fees for 4 years for those who applied, were accepted, and enrolled in the University of Michigan. Most of those students targeted would have had their tuition and fees covered regardless, but the outreach eliminated any uncertainty by making the promise of tuition and fees even before they filed the FAFSA. In fact, students did not have to file the FAFSA to be eligible (although most did). The effort led to large increases in application to and enrollment in University of Michigan among the students targeted.
In a follow-up study, Burland et al. (2022) add to the experiment a third informational arm. In this condition, students received information about a free-tuition program for which they are likely eligible, contingent on providing proof of need. This less-certain offer produced smaller effects on application to the university and no effects on enrollment in the University of Michigan. Burland et al. (2022) interpret this result as indicating that low-income students value financial certainty highly in the process of making schooling decisions. This is especially sensible in the context of the United States’s high-price, high-aid model for funding higher education.
We situate these two studies together with Becker’s (1962) seminal model of human capital accumulation which broadly stipulates that a person should invest in human capital (e.g., going to college) if the lifetime benefits of such an investment outweigh the associated costs. Of course, the reality of financial aid markets introduces complexity into this model in forms such as uncertainty, imperfect information, financial and borrowing constraints, among others. In addition to these limitations, this theory has been critiqued for its simplification of a complex higher education, labor, and capital market as well as its inability to fully explain income inequality (e.g., Marginson, 2019). Even so, a basic prediction of the human capital model is that if the cost of obtaining higher education is lowered—for example, through the provision of financial aid—we should expect educational attainment to increase.
In this study, we investigate whether and on what margins the AATL Scholarship contributes to such increases in postsecondary educational attainment. As we show, our results are consistent with the likelihood that complexity in applying for the scholarship, uncertainty in students’ own eligibility, and the nonoptimal timing of final award notification may intersect to reduce students’ likelihood of applying for AATL funding and, in turn, diminish the chances that the funding opportunity will affect students at the margin of college enrollment. In other words, the later the timing of the scholarship, and the higher the complexity and uncertainty of receiving a scholarship the lower the likelihood of changing a student’s college enrollment decision. Nevertheless, among students who do enroll in college, those who also are able to navigate these uncertainties and access AATL support realize substantially improved college persistence and completion outcomes because of the AATL funding and other supports that they receive, consist with much of the literature on the impacts of financial aid on college persistence and completion (Nguyen et al., 2019). In the sections that follow, we describe our data and analytic methods.
Data
We use student-level data from three primary sources—APS, AATL, and the National Student Clearinghouse (NSC). 12 To build our analytic sample(s), we begin with data that includes basic demographics, including sex, race/ethnicity, FRPM status, and GPA for 12,209 APS students from the graduating classes of 2016 through 202. 13 Table 1 presents summary statistics for these students. More than half (55%) of the sample students are female, and a majority (80%) are Black. Approximately 13% of students are White, and nearly 6% are Hispanic. 14
Summary Statistics of APS Students and AATL Scholars
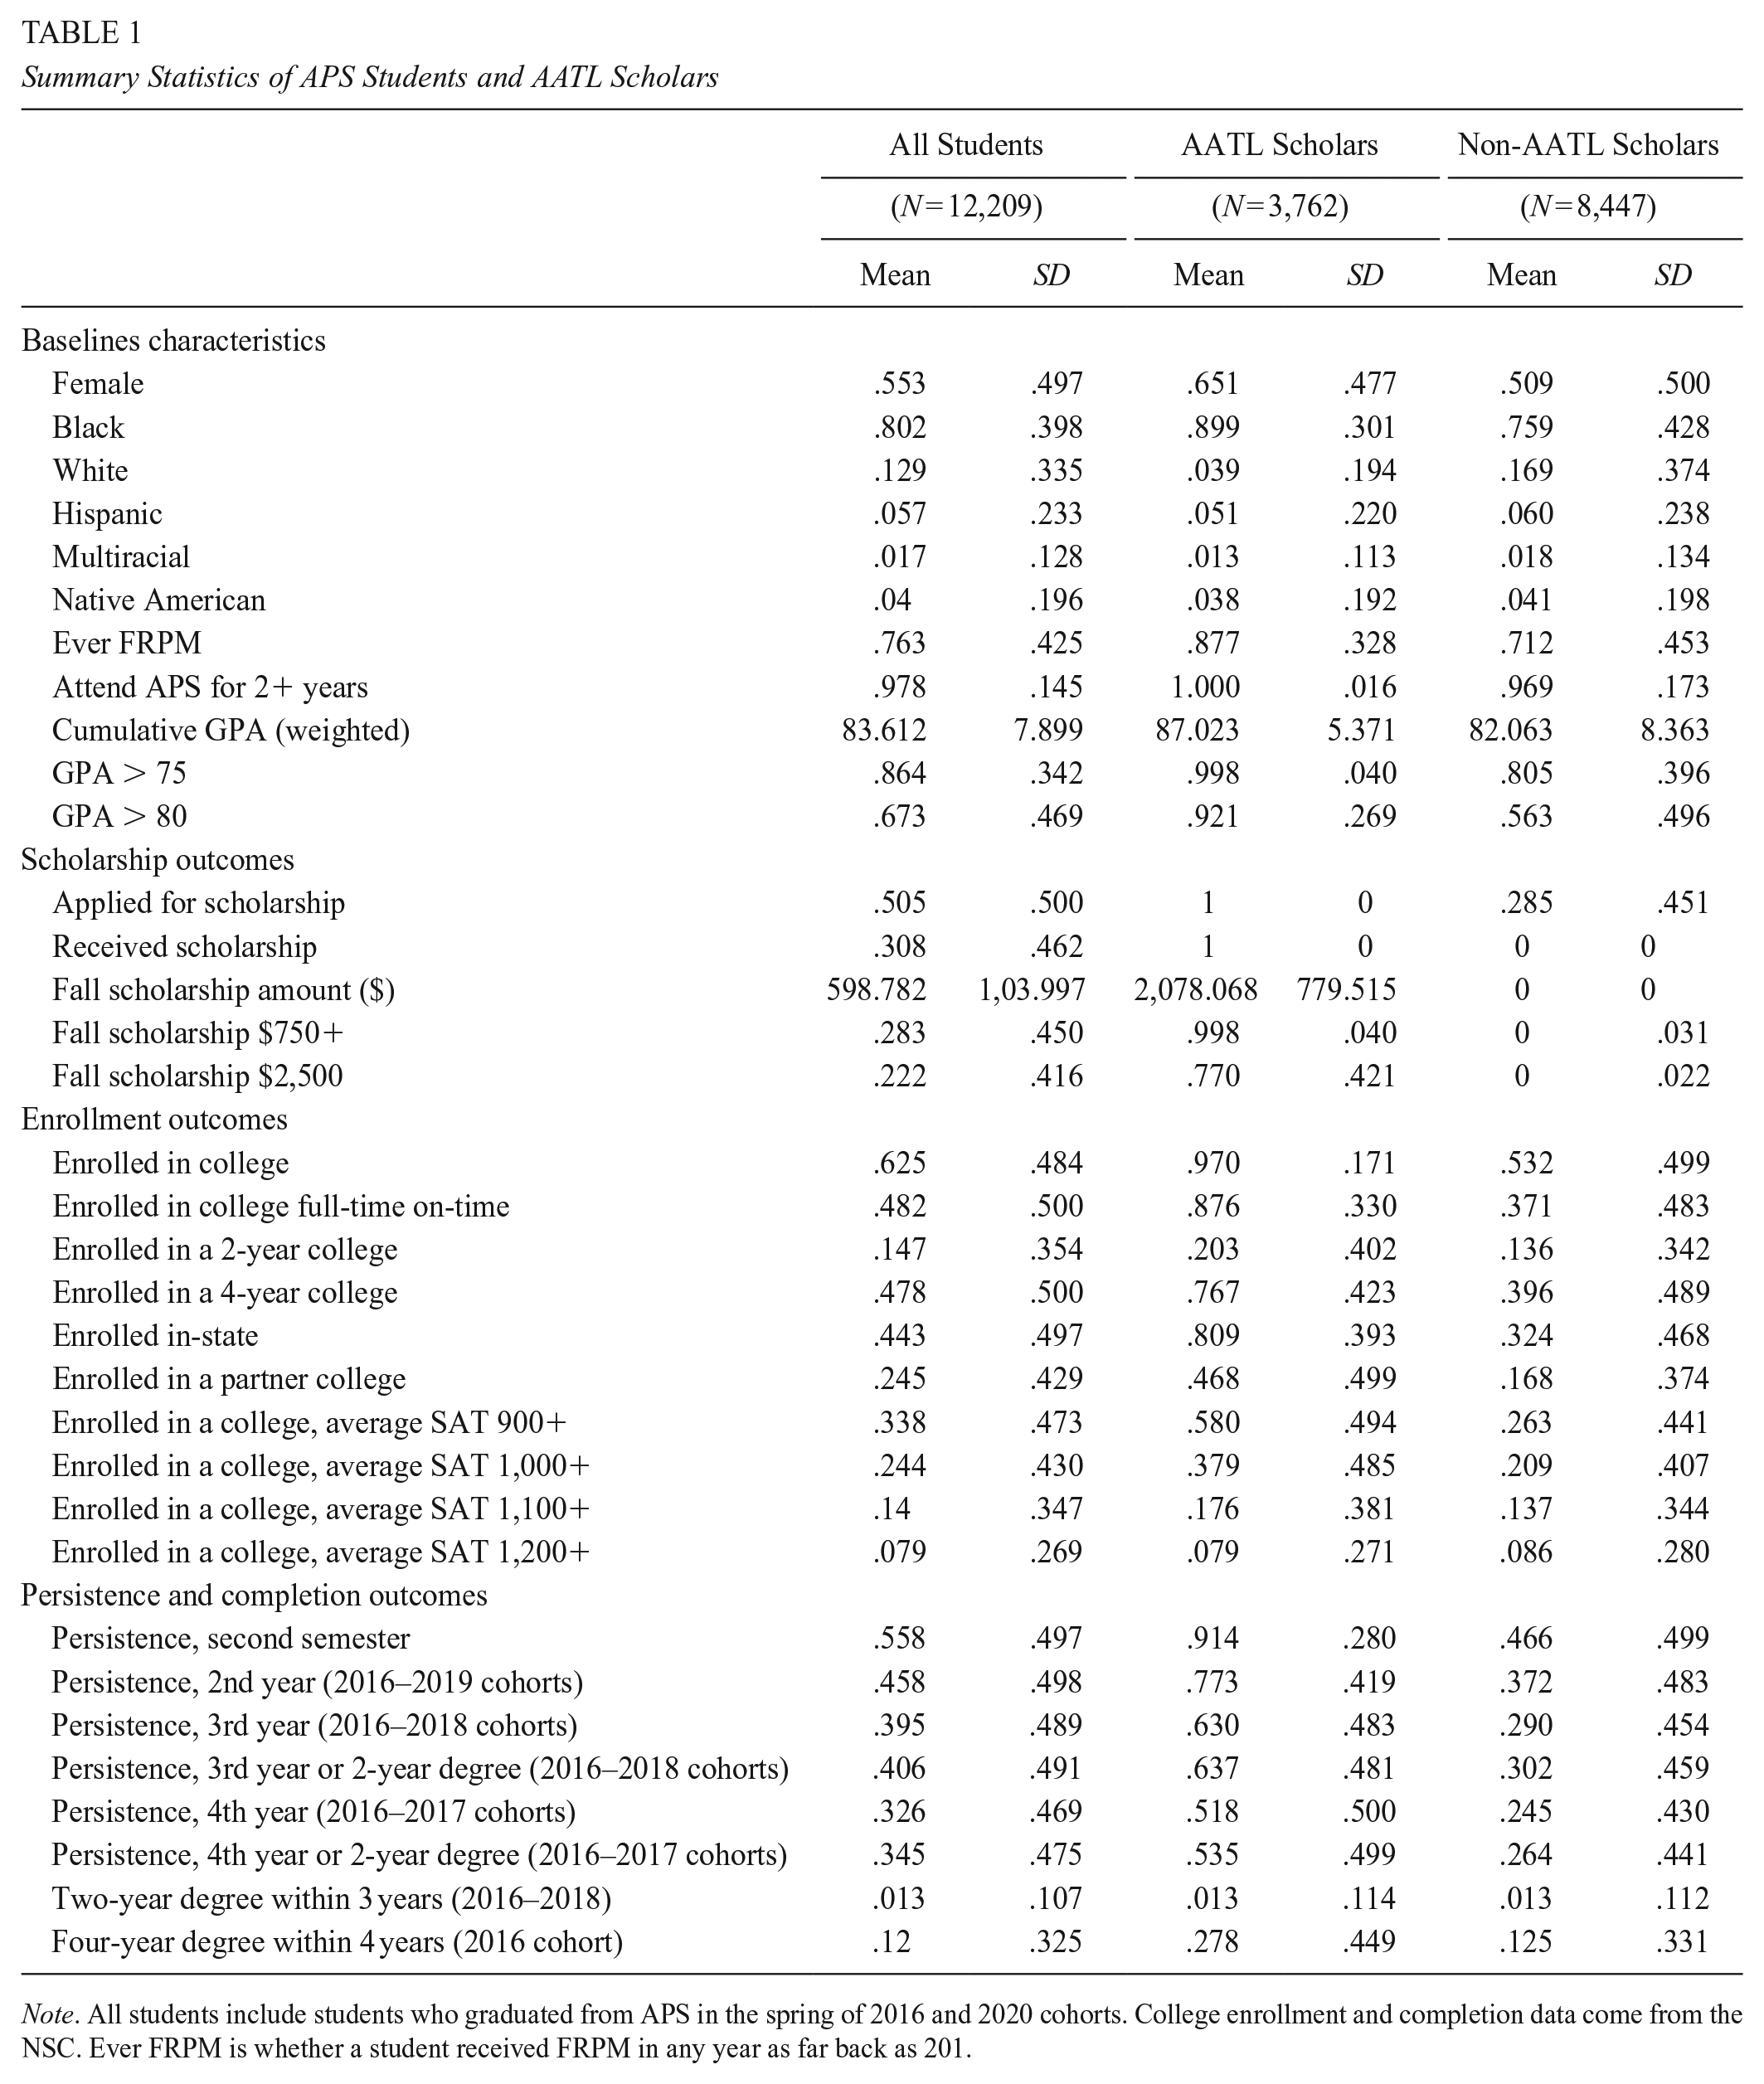
Note. All students include students who graduated from APS in the spring of 2016 and 2020 cohorts. College enrollment and completion data come from the NSC. Ever FRPM is whether a student received FRPM in any year as far back as 201.
The APS data also includes key measures used to define eligibility for the AATL Scholarship and our analytic sample. First, we identify students who enrolled in an APS high school for 2 consecutive years prior to graduating, a criterion for eligibility. Nearly all sample students (98%) meet this condition. Second, we use APS student-year records to determine whether a student was ever FRPM eligible in any of the years for which we have data, including a few years prior to 2016. This is our only proxy for financial need, although it is an imperfect indicator of true income eligibility, which can be determined only after students complete the FAFSA. Over three-quarters (76%) of students ever qualified for FRPM. In addition, some high schools were designated as having the Community Eligibility Provision (CEP), which provides FRPM for all students, regardless of individual eligibility.
Third, we use the cumulative weighted GPA (measured on a 100-point scale) at the time of graduation. This variable is calculated by APS and used by AATL to determine whether students are academically eligible for the scholarship. From this continuous measure we define two new indicators for scholarship eligibility—whether GPA is 75 or above and whether GPA is 80 or above, designating eligibility for the smaller and larger AATL Scholarships, respectively.
We augment the student-level APS data with student-level AATL data on scholarship application and receipt, student-level college-enrollment data from the National Student Clearinghouse, as well as college-level data from the National Center for Education Statistics’ Integrated Postsecondary Education Data System (IPEDS). We discuss these data sources in more detail in the supplemental appendix in the online version of the article. The middle and rightmost panels of Table 1 display summary statistics for AATL scholars and nonscholars, respectively. 15 Figure 1 shows differential AATL Scholarship application rates by high school and over time. Note that scholarship recipients have a range of GPAs. Scholarship receipt is most common for students with GPAs at or around 9. The decline in prevalence of scholarship receipt for students with higher GPAs is likely because GPA is often correlated with parental income, making the highest-GPA (and highest-income) students less likely to be eligible for the scholarship. Beneficial for analyses discussed below is that there are scholarship recipients and nonrecipients at all GPA levels; we need not compare students with GPAs below 70 who are academically ineligible to receive the grant to those with GPAs above 80, for example. Rather, in some analyses, we rely on idiosyncrasies in the application process, such as high school culture, knowledge, and support around the scholarship, to identify scholars and nonscholars who are otherwise similar.
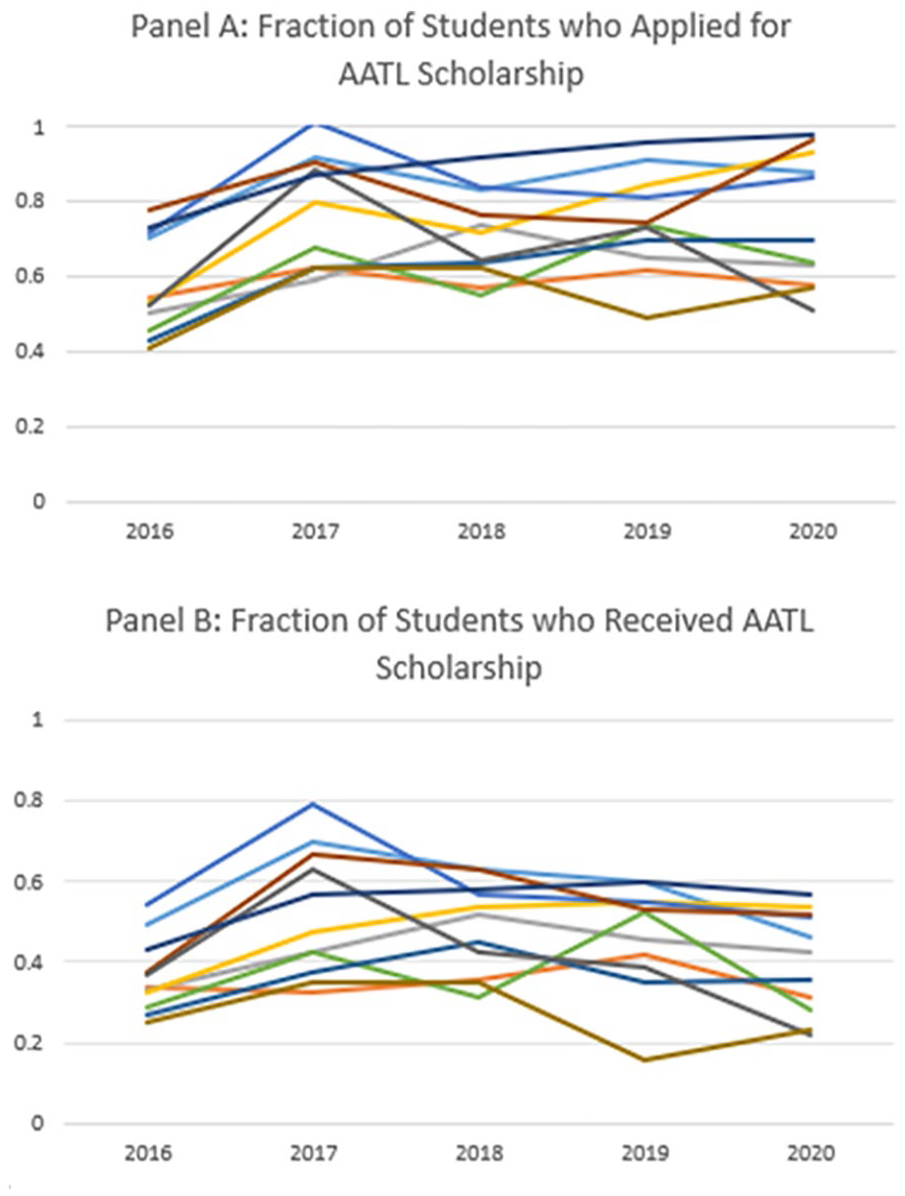
Fraction of students receiving FRPM who applied and received AATL scholarship, over time, by high school.
Methods
We use two different analytic strategies to address questions regarding the impact of AATL Scholarship eligibility and receipt on college access, persistence, and completion. First, we use an RDD that capitalizes on the GPA thresholds that determine scholarship eligibility. Second, given limitations of the RDD approach (discussed below), we additionally use ordinary least squares (OLS) regression analysis to characterize the relationship between scholarship receipt and college-going outcomes, applying different sets of controls and sample restrictions to rule out potential confounders to interpreting our estimates as causal. Here, we describe these two analytic approaches.
Regression Discontinuity Design for Enrollment Impacts
We use an RDD to estimate the impacts of scholarship eligibility on college enrollment. The RDD uses high school GPA, which determines scholarship academic eligibility, as the running variable. This implies that we are comparing students just above and just below the academic eligibility thresholds (i.e., GPA of 75 and 80) with the assumption, for example, that students who earn a 74.8 GPA are, on average, almost identical to students who earn a 75.0 GPA, but for the opportunity to receive the AATL Scholarship and associated services. Because the two groups of students are, on average, similar, we can isolate the impact of the scholarship without any unobservable confounding variables that may lead to bias. We conduct RD analyses separately at the 75 and 80 GPA thresholds with the following equation:

GPA is the cumulative weighted high school GPA (recentered at the relevant threshold) for student i in cohort t. ABOVE is an indicator variable equal to one if GPA is above the scholarship eligibility threshold and zero otherwise. We interact GPA and ABOVE to allow for different slopes on either side of the scholarship eligibility threshold. X is a vector of student attributes, including sex and race/ethnicity dummy variables. HS and T are high school and cohort fixed effects, respectively, and
Before estimating Equation 1, we restrict the sample to include only students who have been in APS for at least 2 consecutive years prior to graduating and those who were ever FRPM to remove students who are ineligible for the scholarship for nonacademic reasons. This restriction focuses our attention on the single forcing variable GPA and, consequently, increases statistical precision around each threshold. In Appendix Table 1 in the online version of the journal, we present summary statistics for the subsample of 9,219 students and for the two analytic samples within a 5-point bandwidth at each threshold.
Our primary interest is in estimating
Because there are two thresholds and corresponding scholarship amounts, we estimate Equation 1 separately for each threshold and rely on a relatively narrow bandwidth to avoid crossing the second threshold in an analysis focused on the other. Specifically, our main specification relies on a 5-point bandwidth at each threshold (70–80 and 75–85), which coincides almost exactly with the Imbens-Kalyanaraman optimal bandwidth for some of the primary outcomes.
18
When using the 75 GPA threshold, we interpret
Lastly, RDDs are local average treatment effects, so our estimates on the impact of scholarship eligibility pertain only to students just around the 75 and 80 thresholds. We are not estimating the impacts of eligibility at different margins, including the GPAs where scholarship take up is most prevalent (near a GPA of 90). Impacts may differ across the distribution of academic performance, and this possibility is partial motivation for our second analytic strategy.
OLS for Persistence and Completion Impacts
Basic Design
We turn to OLS to assess the effects of AATL Scholarship and service receipt on college persistence and completion. Here, OLS has several advantages relative to RDD. First, there is an order of magnitude improvement in statistical power allowing us to make precise statements about our estimates. This is in part because we make use of the many observations outside the RDD 5-point bandwidths. Precision also improves because we are estimating the impact of scholarship receipt, which is perfectly observed, as opposed to scholarship eligibility, which is imperfectly measured. These gains in precision are particularly important as our persistence and completion analyses make use of fewer cohorts; an RDD with fewer cohorts may lead to larger standard errors and uninformative estimates, in turn. 19
Second, we can estimate average effects of scholarship receipt and consider how these effects vary across the range of GPAs. This is in contrast to RDD limiting us to estimating local average effects at the specific GPA thresholds associated with qualifying for funds. In fact, an additional limitation of the RDD is that at the threshold for the more generous scholarship, the comparison is between eligibility for the smaller versus the larger scholarship. In short, although OLS leaves us open to potential threats to a causal interpretation, the benefits of this exploration are clear.
To estimate the effect of receiving an AATL Scholarship and associated services on college persistence and completion, we estimate the following equation:

Here, SS is an indicator equal to one if student i in high school graduating cohort t receives an AATL Scholarship and zero otherwise. The corresponding coefficient,
Along with controls for student demographics and high school and cohort fixed effects, we continue to exclude students who do not attend APS for the 2 years prior to graduation. In some, but not all specifications, we include students who were never eligible for FRPM to test whether results are sensitive to this measure of financial hardship. We cluster standard errors at the high school level.
We restrict these analyses to students who enroll in college and can therefore persist and graduate. Without such conditioning, graduation effects, for example, may represent the combined effect of enrollment and completion. For this reason, it is common for examinations of college persistence and completion outcomes to condition on enrollment (Nguyen et al., 2019). Using a subsample of students who are plausibly induced by the scholarship to enroll in college might create an endogenously determined subsample. However, as we show, we find no impact of scholarship eligibility on enrollment. This stands as partial justification for focusing on the subsample of enrollees when estimating college persistence and completion effects. Additionally, some analyses focus exclusively on students who earned high GPAs in high school. Most, if not all, of these students likely intended to enroll in college regardless of the scholarship.
Identification and Alternative Specifications
Our goal is to estimate the causal effect of the scholarship and services on college persistence and completion, which means obtaining an unbiased estimate of
After fitting the main specification with the full sample, we first reestimate the model using only students ever designated as receiving FRPM. As discussed above, this noisy measure of financial need does not entirely rule out unobserved differences in financial need between scholars and nonscholars. Nevertheless, restricting the sample to ever-FRPM students serves as a strategy for assessing the direction of the bias present from not accounting for financial need.
Second, we reestimate the equation using only the sample of APS graduates who apply for the scholarship. This helps address the concern that scholars and nonscholars differ in their general awareness of or interest in the scholarship and other college-related opportunities. Of course, additional differences may remain, even conditional on applying for the scholarship. We turn to these potential differences next. In addition, these remaining differences allow us to hypothesize about the likely direction of any systematic bias that may remain after accounting for interest in and knowledge of the scholarship opportunity.
Third, we fit Equation 2 using the subsample of scholarship applicants who also have an EFC of zero dollars as calculated by the FAFSA federal methodology. We only have measures of EFC for AATL applicants, as they complete and submit their FAFSA as part of the AATL application process. By including only zero-EFC applicants, we simultaneously remove concerns about scholarship knowledge and interest as well as concerns about differences in financial need between scholarship recipients and nonrecipients. Zero-EFC students are those with the most financial need, and all of these students meet the financial criteria to qualify for the AATL Scholarship.
Fourth, we use only the subsample of applicants that AATL determines are both academically and financially eligible for the scholarship. In this subsample, students who do not receive the scholarship most typically attend a college at which AATL funds may not be used.
Fifth, we add college fixed effects to Equation 2. This removes a concern, highlighted in the previous subsample, that scholars and nonscholars who are similar along most dimensions attend different colleges. The college fixed effects restrict comparison to scholars and nonscholars who attend the same college. Similar to the previous argument about only using college enrollees, this is potentially problematic if the scholarship induces students into different colleges. As we show, there is limited evidence of this occurring, perhaps because students’ scholarship status is not finalized until mid-June, by which time most students have finalized their college choice.
Finally, we combine several of the above sample restrictions and controls to remove multiple sources of bias simultaneously. Across these alternative specifications, we de-emphasize attention to any particular set of estimates and instead encourage focus on qualitative changes across results to assess the potential direction and magnitude of any bias that may exist.
Results
We begin with results from our RDD analysis to assess the impacts of scholarship eligibility on scholarship application, receipt, and funding amounts. In Table 2, we present the local estimates separately at the 75 (top) and 80 (bottom) GPA eligibility thresholds.
Impact of Scholarship Eligibility on Scholarship Receipt (RDD)

Note. Only includes students in APS 2+ years prior to graduating and ever on FRPM. Running variable is high school GPA, whose slope we allow to vary above/below the scholarship eligibility threshold. Bandwidth of 5 GPA points around threshold. Includes controls for sex and race/ethnicity and fixed effects for high school enrolled and cohort. Standard errors in parentheses clustered on GPA.
p < .01. ***p < .001.
First-Stage Impacts—Scholarship Application, Receipt, and Funding Amounts
At both thresholds, there are positive but statistically insignificant coefficients on the probability of applying to the scholarship. An insignificant result at the 80 threshold is not surprising, as those just below this GPA threshold are still eligible for a scholarship, albeit a smaller one. At the 75 threshold, we estimate a 4.6 percentage point (21% over the control mean) increase in application for those just eligible. This effect on application is still not as large as we might expect. The modest size could be in part because students—and especially those close to the 75 threshold—do not know their final GPA and consequently their AATL academic eligibility until the end of the school year when grades are finalized. In addition, they do not know their financial eligibility until after completing the FAFSA and receiving their EFC. Given this uncertainty, many students may apply even though they ultimately do not qualify. On the other hand, the uncertainty itself may discourage students from applying. This is further supported by Figure 2, which illustrates that a relatively small fraction of scholarship recipients falls between GPAs of 75 and 8.

Share of APS graduates who receive AATL Scholarship, by high school GPA.
Turning to scholarship receipt, there is a 6.6 percentage point increase in the probability of receiving the scholarship for students just above the 75 threshold, compared to almost nobody below the 75 threshold receiving a scholarship (column 2). At the 80 threshold, the jump is 9.7 percentage points (a 60% increase). Figure 3 plots this relationship and visually confirms the results. These results suggest that the scholarship award process is working as designed but that scholarship receipt among eligible students is far from universal. 22 Further, these effects on scholarship receipt are smaller than those found for other place-based scholarships. The AATL scholarship is perhaps most similar in structure to the Pittsburgh Promise. The Pittsburgh Promise requires students to meet eligibility standards related to attendance (90% or better), enrollment (continuous enrollment for 4 years of high school), and academic performance (on a 4.0 scale, GPA thresholds at 2.0 for the “extension” scholarship and 2.5 for the “core” scholarship). The extension scholarship supports enrollment at the Community College of Allegheny County, whereas the core scholarship can be used to attend any public or private institution in Pennsylvania. In the years when the Pittsburgh Promise scholarships were similar in generosity to AATL, just qualifying for the core scholarship increased scholarship receipt by nearly 26 percentage points over a rate of 29% just below the 2.5 threshold (Page et al., 2019). The AATL first-stage effects are much more modest in magnitude. Below, we discuss what might be leading to these differences. This smaller magnitude limits our ability to make precise statements as well as evaluate heterogeneous effects or impacts on downstream outcomes.

Fraction of APS students who received AATL scholarship, by high school GPA.
The last three columns of Table 2 present impacts on the level of funding received. At the 75 threshold, there is a $38 discontinuous jump in average scholarship funds awarded in the first semester. This corresponds to a 6.1 percentage point increase in the probability of receiving at least $750 in scholarship (the intended maximum level of funding at the 75 threshold) in the first semester. The analogous estimates at the 80 threshold are $267 and an 11 percentage point increase in the probability of receiving at least $2,500 (the intended maximum level of funding at the 80 threshold) in the first semester. 23 Appendix Table 3 in the online version of the journal shows that the results for each outcome are robust to modeling decisions.
College Enrollment
In Table 3, we present RDD estimates for the impact of eligibility for the scholarship and services on college enrollment. Column 1 shows no impact of eligibility on the probability of enrolling in college at either threshold. This is visually confirmed in Figure 4. The coefficients are very small in magnitude although not precise. For example, although the point estimate on college enrollment suggests a 1 percentage point decline at the 75 threshold, we cannot rule out impacts of close to a 6 percentage point increase. Based on sample sizes used to estimate effects, we estimate minimum detectable effects for college enrollment of 7 to 8 percentage points and approximately 6 percentage points at the 75 and 80 GPA thresholds, respectively. 24 Thus, we are underpowered to detect effects on enrollment of the magnitude that we estimate.
Impact of Scholarship Eligibility on College Enrollment (RDD)

Note. Only includes students in APS 2+ years prior to graduating and ever on FRPM. Running variable is high school GPA, whose slope we allow to vary above/below the scholarship eligibility threshold. Bandwidth of 5 GPA points around threshold. Includes controls for sex and race/ethnicity and fixed effects for high school enrolled and cohort. Standard errors in parentheses clustered on GPA.

Fraction of APS students who enrolled in college, by high school GPA.
Next, we evaluate whether the AATL Scholarship opportunity induces full-time, on-time enrollment, a necessary condition of scholarship receipt. The second column of Table 3 shows positive but modest and statistically insignificant estimates. Here again, the standard errors are large enough that we cannot rule out meaningful effects. In addition, if we were to scale these intent-to-treat estimates by the first-stage estimates on scholarship receipt (6.6 and 9.7 percentage points at the 75 and 80 thresholds, respectively), the impacts of scholarship receipt on full-time, on-time college enrollment would be substantial.
The last two columns consider whether students are induced to enroll in 2-year or 4-year colleges, as the scholarship has different rules and incentives at the two margins. We see no strong evidence of such a resorting of students across 2- and 4-year colleges. This is reaffirmed in Figure 5, as is the robustness of all the results in Appendix Table 3.

Fraction of APS students who enrolled in 4-year college, by high school GPA.
College Type
In Table 4, we examine how scholarship eligibility impacts the type of college in which students enroll. In the first two panels of column 1, we consider impacts on in-state (vs. out-of-state) college enrollment. The estimates at the two thresholds are small and statistically insignificant. In the third (bottom) panel, we consider the subsample of 4-year college enrollees. Recall, we previously showed that 4-year college enrollment is not influenced by scholarship eligibility. Here, we estimate a 5.3 percentage point increase in the probability of staying in-state for students who just barely are eligible for the full scholarship. Although the estimate is not statistically different from zero, it is suggestive of a meaningful change in staying in-state for college. Figure 6 shows a modest jump in the probability of enrolling in-state at the 80 threshold (not conditional on 4-year enrollment).
Impact of Scholarship Eligibility on College Type (RDD)

Note. Only includes students in APS 2+ years prior to graduating and ever on FRPM. Running variable is high school GPA, whose slope we allow to vary above/below the scholarship eligibility threshold. Bandwidth of 5 GPA points around threshold. Includes controls for sex and race/ethnicity and fixed effects for high school enrolled and cohort. Standard errors in parentheses clustered on GPA.
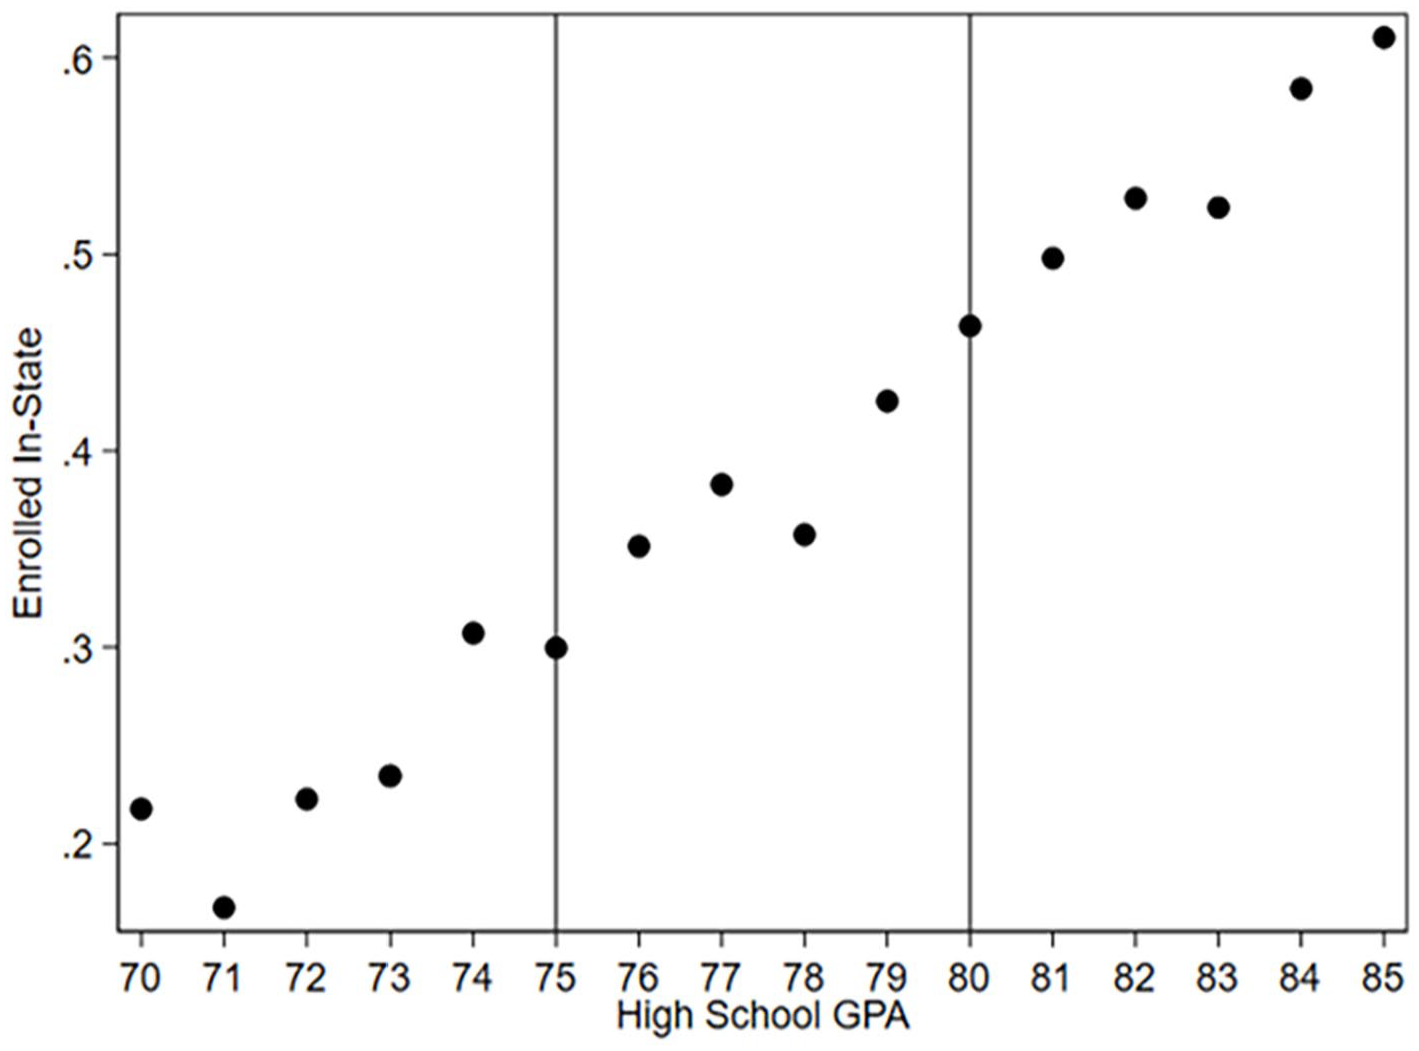
Fraction of APS students who enrolled in an in-state college, by high school GPA.
Next, we present results for the probability of enrolling in an AATL partner college (Table 4, column 2). This is a potentially important outcome, as the additional supports at partner colleges could influence persistence. We see no evidence of an impact at the 75 threshold but suggestive evidence of an increase in partner college enrollment at the 80 threshold. The suggestive evidence at the 80 threshold is reinforced in Figure 7 and Appendix Table 3. Finally, the last four columns of Table 4 show little evidence that college selectivity, as measured by average SAT of students enrolled, is impacted by scholarship eligibility.

Fraction of APS students who enrolled in an AATL partner college, by high school GPA.
Overall, the results do not show evidence of a large-scale redistribution of students at the GPA margins into different colleges based on eligibility for (and sometimes receipt of) the scholarship. Point estimates, although imprecise, suggest that students may be somewhat more likely to enroll in Georgia and at the AATL partner colleges, which are all in-state.
Persistence and Completion
We now turn to the OLS results on the effect of AATL Scholarship (and services) receipt on college persistence and completion, conditional on college enrollment. 25 The results in Table 5 show that, across the range of specifications and outcomes, scholarship receipt has a very large and statistically significant effect on persistence outcomes. These results show no effect on 2-year college graduation but a meaningful effect on 4-year college graduation.
Relationship Between Scholarship Receipt and Persistence and Graduation Outcomes
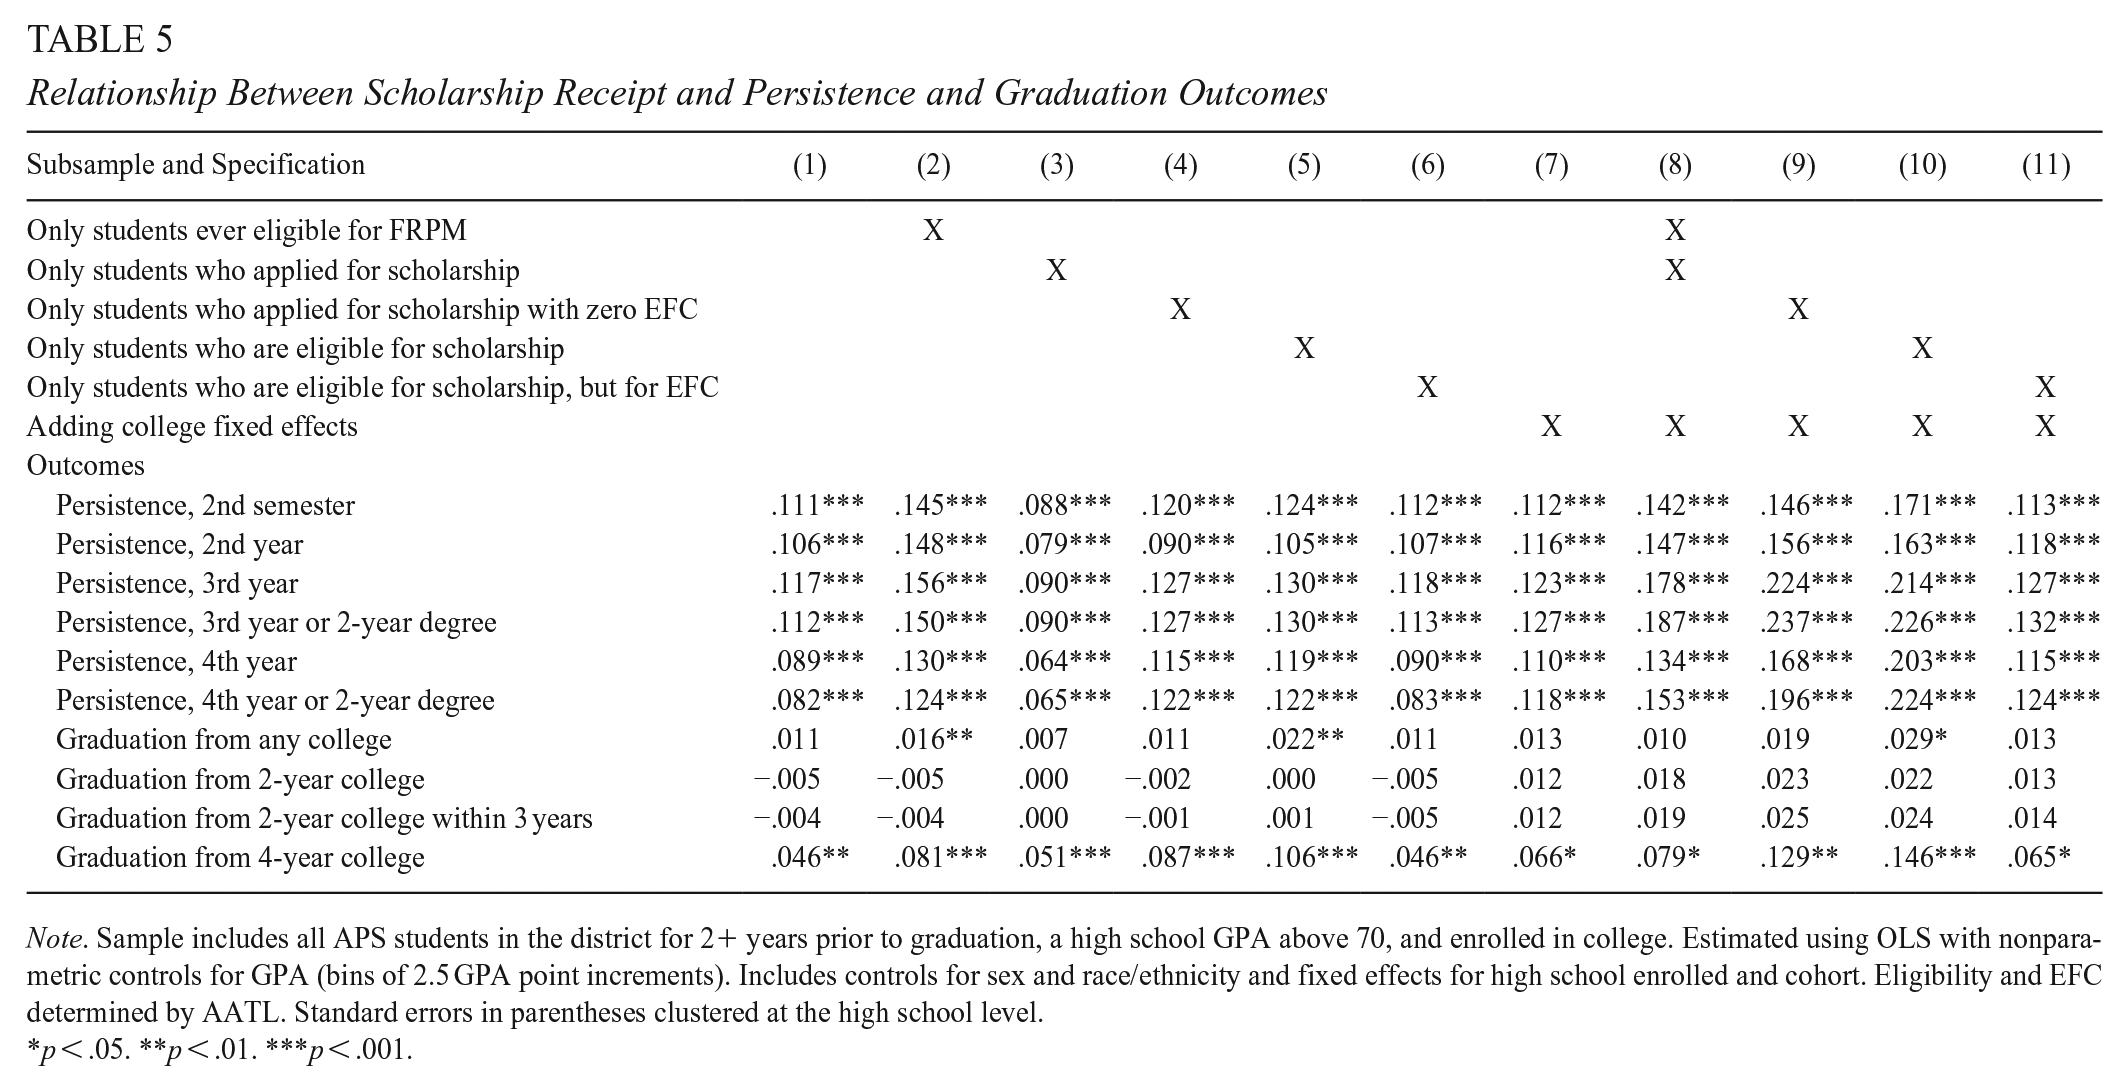
Note. Sample includes all APS students in the district for 2+ years prior to graduation, a high school GPA above 70, and enrolled in college. Estimated using OLS with nonparametric controls for GPA (bins of 2.5 GPA point increments). Includes controls for sex and race/ethnicity and fixed effects for high school enrolled and cohort. Eligibility and EFC determined by AATL. Standard errors in parentheses clustered at the high school level.
p < .05. **p < .01. ***p < .001.
The first column and first row of results suggest that college enrollees who receive the AATL Scholarship and services are 11.1 percentage points more likely to persist to the second semester than nonscholars, controlling for GPA, demographics, high school attended, and cohort. This represents a 13.6% increase relative to nonscholars who also enroll in college. 26
Table 5, columns 2 through 11 estimate each step of the discussion in the Identification and Alternative Specifications section, above, that addresses potential unobservables correlated with scholarship receipt that may bias this initial estimate. For example, column 2 uses a subsample of only FRPM students, and column 4 uses only scholarship applicants with zero EFC—both in response to potentially unobserved financial need. In both columns, the magnitude of the coefficient increases compared to column 1. Next, we address the potential for differences in college outcomes due to differences in academic preparation (column 5) and differences in postsecondary institutions (column 7) by using only scholarship-eligible students and including college fixed effects, respectively. The coefficient estimates are not substantively different from those in column 1. Columns 9 through 11 include several of these restrictions simultaneously and the point estimates once again increase. The smallest estimate in column 3, which only includes the subsample of scholarship applicants, is 8.8 percentage points.
The second outcome row considers persistence to the 2nd year of college and provides a window into the remainder of the persistence results. According to the first specification, college enrollees who receive a scholarship are 1.6 percentage points (16%) more likely to persist to their 2nd year of college than nonrecipients. The result fluctuates down a bit in some specifications (e.g., column 3) and up by more than 50% (e.g., column 9) in others but remains large in magnitude and statistically significant. These estimates rely on one fewer cohort than the previous row. In Appendix Table 7 in the online version of the journal, we reestimate the Table 5 results with the 2016 cohort only and show that changing sample composition is not driving the magnitude of the coefficients. The coefficients for persistence to the second semester and to the 2nd year are similar, implying that the effect of scholarship receipt on persistence does not fade across the first several years of college.
The next few rows show persistence effects into the 3rd and 4th years of college. Here, estimates continue to hover around 10 percentage points. They also fluctuate a bit across specifications, but they do not change much relative to the previous rows, suggesting a strong persistence effect that lasts throughout college.
Turning to college completion outcomes, we observe marginal evidence of an effect of the AATL Scholarship on college completion and clear differences in the effects on 2-year and 4-year degree completion. We see no evidence that scholarship recipients are more likely to earn a 2-year degree. In contrast, we estimate a 4.6 percentage point increase in the probability of earning a 4-year degree in the basic specification; the point estimate associated with this effect only increases in the specifications that take additional steps to account for potential confounders. As before, we note that our statistical power to precisely estimate these longer-run college completion results is reduced, as we have 4-year completion data only for the 2016 cohort. 27
These results are consistent with conclusions drawn from Nguyen et al.’s (2019) meta-analysis of causal studies on the impact of grant aid on college degree attainment. Based on a set of studies that meet their inclusion criteria, Nguyen and colleagues estimate that, conditional on college enrollment, $1,000 of grant aid corresponds to improvements in college persistence and degree attainment of about 1.5 to 2.0 percentage points, on average. Further, they find that programmatic effects tend to be larger for grant aid programs that are more generous, that include need-based criteria, and that include both funding and supplemental supports. The maximum AATL Scholarship award of $20,000 ($5,000 per year for 4 years) is consistent with the upper end of program generosity considered in this meta-analysis, making the AATL Scholarship program characteristics consistent with programs where larger impacts would be expected. The authors note that they lack sufficient information to characterize whether or the extent to which these average effects scale linearly across scholarships of different amounts, although as noted, they do conclude that effects are generally larger for grant aid of higher value.
Persistence and Completion by GPA
Finally, in Table 6, we consider how our persistence results may differ by high school GPA. Especially in the Georgia context, some students may benefit more from the AATL Scholarship, because additional scholarships, notably the HOPE and Zell Miller Scholarships, are available to students with higher GPAs.
Relationship Between Scholarship Receipt and Persistence and Graduation Outcomes, by GPA

Note. Uses sample and specification from column 3 of Table 6 (only scholarship applicants). Sample size changes across GPAs and with longer-term outcomes. Clustered standard errors at the high school level not shown.
p < .05. **p < .01. ***p < .001.
To examine the heterogeneous effects of the AATL Scholarship on persistence, we reestimate the third column of Table 5 (limiting our sample only to scholarship applicants) but separately for subsamples of students in 2.5 GPA point increments. 28 First, we find no effects of scholarship receipt for students with GPAs below 75. This is sensible, as there are almost no such scholars. In the range of 75 to 80, where students primarily, but not exclusively, received the smaller scholarship and are eligible to go to a 2-year college or technical school, we observe an initial increase in persistence that quickly fades out. That is, these students who enroll in 2-year colleges are persisting to the second semester at higher rates because of the scholarship, but the scholarship does not induce persistence to further semesters.
Moving across the columns, scholars with GPAs between 80 and 82.5 see the largest impacts, upwards of 20 percentage points, that last for multiple years, with some falling off in magnitude in the 4th year. These are the same students on the margin of receiving the larger scholarship that were under consideration in the RDD. They are also students with GPAs that are just below the HOPE scholarship levels, so the AATL Scholarship may be a very important source of funding particularly for these students.
Next, scholars with GPAs between 82.5 and 90 generally are about 10 percentage points more likely to persist for multiple years compared to similar nonscholars. These are students who frequently are also eligible for the HOPE scholarship. The impact of the AATL Scholarship and services on persistence is smaller for students with a GPA above 9. There are positive but statistically insignificant effects between 90 and 92.5. Between 92.5 and 100, there is no evidence of the scholarship impacting persistence or completion rates. Students with GPAs in this upper range tend to have more scholarship opportunities, including the HOPE and Zell Miller scholarships, and also are more likely to attend more selective colleges with higher graduation rates. Given these contextual factors, it is sensible that the effect of the AATL Scholarship on persistence and completion would be smaller among the highest achieving students. Of course, this does not rule out the possibility of impacts on other important dimensions that we cannot observe in our data, such as college academic performance, choice of major, and extracurricular engagement.
Discussion
The AATL Scholarship program was designed to support APS graduates—specifically those from low-income backgrounds—to pursue postsecondary education after high school and to do so affordably. AATL’s stated organizational vision is that “Atlanta is a city where race and income no longer predict postsecondary success and upward mobility.” The AATL Scholarships are generous enough to substantially reduce the out-of-pocket college costs that families may face, particularly when combined with other financial aid for which students may qualify. In this article, we examine the implementation and impact of the AATL Scholarship in meeting these goals.
Our RDD results point to relatively modest take-up of the opportunity to apply for the scholarship at the eligibility thresholds, particularly around the 75 threshold. This, in turn, leads to modest effects on scholarship receipt and null effects on college enrollment at these thresholds. The potential contributors to these modest effects may be both analytical and programmatic. First, as detailed previously, students must meet a specified financial-need criterion to qualify for funding. This criterion is based on a student’s EFC, calculated from information students and families report on the FAFSA. Because not all APS students file the FAFSA and report their EFC to AATL, we condition our sample on a proxy measure for financial need. The best proxy available in APS administrative data is an indicator for FRPM eligibility. We recognize the imperfection of this measure, both because students who individually would qualify for FRPM may not apply for it and because of the role of the CEP, which provides FRPM for all students in a school, regardless of individual eligibility. For example, among the nearly 4,000 students who received AATL funding in the years we consider, approximately 13% were never flagged as FRPM. This means that when we condition our sample on the ever-FRPM indicator, we may be excluding some students who are financially eligible for the AATL scholarship and including some students who are financially ineligible. Including those who are not financially eligible attenuates the effects that we estimate at the GPA thresholds.
The modest take-up that we observe may also be driven by the scholarship’s eligibility requirements and how they affect students’ willingness and ability to apply. To qualify for funding, students must meet several criteria. Specifically, they must (a) have enrolled in APS for at least 2 years prior to graduation; (b) meet the EFC threshold for financial need; and (c) meet the academic GPA standards noted above. Although the first requirement is easily known and readily understandable, the other two may introduce considerable uncertainty. Regarding the need-based requirements, students may have a tenuous understanding of their family’s finances, making it necessary to complete the FAFSA and obtain an EFC before knowing if they meet AATL’s definition of need. 29 It is well understood that the FAFSA is a complex application to complete (Dynarski & Scott-Clayton, 2006), and the FAFSA’s complexity, itself, can hinder access to higher education (Bettinger et al., 2012). Therefore, this FAFSA-based requirement may hinder students from completing the AATL application process, even though AATL specifically works to encourage students and families to complete the FAFSA.
A second dimension of uncertainty relates to AATL’s academic eligibility requirements. Students who enter senior year with a GPA close to one of the eligibility thresholds may be particularly uncertain about ultimately qualifying for AATL funds, and therefore may be less inclined to apply. This general uncertainty is coupled with the fact that final academic eligibility is not determined until mid-June, after students complete high school and their final cumulative GPA is tallied. For students on the margin of academic eligibility, even if they are ultimately awarded a scholarship, the timing of that award may be too late to meaningfully influence choices about whether or where to apply to college. Although community colleges afford more flexibility, by mid-June, most 4-year institutions already will have expected students to commit for fall enrollment. For example, Georgia State University sets a due date of June 1 for intending 1st-year students to submit their intent-to-enroll form. In short, the timing with which this award is finalized implies that many students must make decisions about where to apply and enroll before being certain that they will receive AATL funding. In sum, complexity in applying, uncertainty in eligibility, and the timing of final award notification may intersect to reduce students’ likelihood of pursuing AATL funding and, in turn, diminish the chances of the funding opportunity affecting college enrollment decisions (Burland et al., 2022; Dynarski et al., 2021, 2022). Because we cannot explicitly observe how the complexity and timing of AATL’s scholarship application impacts students, we leave this for future exploration.
Policy Implications and Conclusion
If these issues outlined in the previous section are potential drivers of the modest results, we observe regarding scholarship application and receipt at the eligibility thresholds, a question that follows is whether there are programmatic remedies or policies. We recognize that not all of the potential remedies we discuss here may be possible, but they are worth consideration, nevertheless. Regarding the academic eligibility thresholds, one solution to increase student certainty would be to exclude students’ senior spring academic performance in the calculation of the GPA used to determine eligibility. Such a shift would allow students to know whether they met the academic requirements for the scholarship a semester earlier. For many students, this would be well before they decide whether or where to enroll in college. Such a move would be consistent with the fact that colleges make admissions decisions without information on students’ senior spring academic performance. Of course, some students may be made ineligible by not having their final semester included in their GPA. Future research could investigate how many students would be positively or negatively affected.
Regarding student financial need, one possibility would be to allow students to satisfy the financial eligibility requirements in a variety of ways. For example, in addition to keeping the need definitions based on FAFSA, scholarship programs could partner with school districts to designate as financially eligible those students who qualified for FRPM, as was done by Dynarski et al (2021) and Burland et al. (2022). Such steps, together, would increase students’ certainty about qualifying for funding and shift up the timing with which final eligibility is determined.
Our examination of the effects of AATL on college persistence and success among those who enroll in college suggest that programmatic changes that induce enrollment could be well worth it in terms of furthering the core goals of AATL. Students who enroll with scholarship support exhibit stronger persistence and 4-year college graduation rates. Therefore, encouraging more students to enroll could result in positive long-run outcomes. We recognize that the causal interpretation of our persistence analyses is weaker than that of the RDD, but it is strengthened by a consistent set of results across a range of specifications that account for different potential sources of omitted variables bias. Additionally, regression analysis allows us to consider students beyond the specific GPA eligibility thresholds central to the RDD analysis.
Among APS graduates who transition immediately to college, those who receive AATL funding are significantly more likely to persist for several years of college. Within the cohort that we can observe for a long enough duration, AATL scholarship recipients are more likely to earn a bachelor’s degree within 4 years. When we consider variation by student academic performance (as measured by GPA), effects are concentrated among students with GPAs in the range of 80 to 90. This is a positive and policy relevant finding in a context where many of the broadly available sources of financial aid are merit rather than need based. Some, but not all, of the students in the 80 to 90 GPA range are likely eligible for the HOPE scholarship. In contrast, effects of the AATL scholarship on persistence and completion are essentially null for students with the strongest high school academic records, many of whom likely receive generous support through the Zell Miller merit scholarship or other merit-based aid packages.
Unfortunately, we are not able shed light on the potential mechanisms through which the AATL Scholarship is affecting recipients’ college trajectories and leave this for future quantitative and qualitative research. AATL has an expressed goal of reducing the need for low-income families to borrow excessively for their children to attend college. Future work should consider how generous aid, such as the AATL funding, affects students’ borrowing, work behavior, course-taking patterns, extracurricular engagement, on- versus off-campus living status, and future employment and earnings, among other potential channels. In addition, future work should investigate the nonfinancial college success supports that AATL provides to its scholars, as this could prove to be a model for other place-based scholarship programs to provide more robust ongoing support to their own students (e.g., Page, Kehoe, et al., 2019). Digging more deeply into these areas will continue to inform policy and practice about how financial aid can most effectively be deployed to improve the postsecondary outcomes of students from low-income backgrounds.
Supplemental Material
sj-docx-1-ero-10.1177_23328584241287459 – Supplemental material for Assessing Atlanta’s Placed-Based College Scholarship
Supplemental material, sj-docx-1-ero-10.1177_23328584241287459 for Assessing Atlanta’s Placed-Based College Scholarship by Carycruz Bueno, Lindsay Page and Jonathan Smith in AERA Open
Footnotes
Acknowledgements
We would like to thank our partners Atlanta Public Schools, Achieve Atlanta and Georgia Policy Labs for their support throughout this project. We appreciate the helpful comments from earlier versions of this article from participants of Association for Public Policy Analysis and Management and Association for Education Finance and Policy Conference.
Declaration of Conflicting Interests
The author(s) declared no potential conflicts of interest with respect to the research, authorship, and/or publication of this article.
Funding
The author(s) disclosed receipt of the following financial support for the research, authorship, and/or publication of this article: We are grateful for the financial support of Achieve Atlanta. All errors and views are our own.
Notes
Authors
CARYCRUZ BUENO is an Assistant Professor of Economics at Wesleyan University. She studies how education policy can eradicate education inequality, in particular her research addresses topics such as virtual schools, school choice, teacher labor markets, college access, and student non-cognitive skills.
LINDSAY PAGE is the Annenberg Associate Professor of Education Policy at Brown University and is a faculty research fellow of the National Bureau of Economic Research. Her work focuses on quantitative methods and their application to questions regarding the effectiveness of educational policies and programs across the pre-school to postsecondary spectrum.
JONATHAN SMITH is an Associate Professor of Economics at Georgia State University and a faculty fellow with the Georgia Policy Labs and the Institute of Labor Economics (IZA). His research focuses on the behavioral and institutional factors that influence college choice and completion, along with the labor market implications.
References
Supplementary Material
Please find the following supplemental material available below.
For Open Access articles published under a Creative Commons License, all supplemental material carries the same license as the article it is associated with.
For non-Open Access articles published, all supplemental material carries a non-exclusive license, and permission requests for re-use of supplemental material or any part of supplemental material shall be sent directly to the copyright owner as specified in the copyright notice associated with the article.