
Abstract
We conducted a comprehensive, systematic review and meta-analysis on the effects of the BSCS 5E Instructional Model—and its related variants—on science, math, and motivation outcomes. The 5E Instructional Model is a framework for delivering STEM instruction that is based on constructivist learning theory; it has been used throughout the U.S. and other countries, particularly in Turkey. Despite its wide usage, no comprehensive systematic review and meta-analysis on the effects of 5E and related models has yet been conducted. Our search and screening procedures yielded 61 randomized controlled trial studies, estimating 156 effect sizes; 70% of studies met WWC standards with or without reservations. We found that the 5E instructional model resulted in improved science outcomes (g = 0.82, 95% CI [0.67, 0.97]), but a large amount of heterogeneity requires some caution (t = 0.56). We explored numerous explanations for the effect heterogeneity and provided practical recommendations.
Having origins in developmental psychology and early learning cycle research (e.g., Atkin & Karplus, 1962), BSCS Science Learning (2023) developed the BSCS 5E Instructional Model (Bybee et al., 2006) to organize and sequence science instruction and curriculum materials toward a deep understanding and long-term retention of science concepts and skills. The 5E stages (engagement, exploration, explanation, elaboration, and evaluation) are based on prior learning cycles such as that proposed by Atkin and Karplus (1962), which included the equivalent of the exploration, explanation, and elaboration phases (3Es). Under the 5E and related models, the teacher serves as a facilitator, guiding students through each “E” stage of the learning process and providing support as needed while students engage in inquiry, active learning, and reflection.
BSCS Science Learning introduced the 5E Instructional Model in 1990 (Bybee, 1990), and its use quickly expanded. Bybee et al. (2006) identified over 235,000 implemented lesson plans using the 5E model in pre-K through 12th grade, 97,000 discrete examples of universities using the 5E model in their course syllabi, 73,000 examples of 5E-based curriculum materials developed, and 131,000 posted and discrete examples of teacher education programs or resources using the 5E model. At least three U.S. states strongly endorsed the 5E model (Texas, Connecticut, and Maryland), and the model is widely used internationally, especially in Turkey (Cakir, 2017). Education professionals rely on its framework to support millions of students each year.
Several studies have shown that the model has the potential to improve science outcomes for students across various ages when implemented in place of typical “business-as-usual” instruction such as direct instruction, traditional instruction or lecture, and traditional laboratory activities. For example, Saavedra et al. (2019) found the model to be effective in elementary school, Cherry (2011) and August et al. (2009) found it to be effective in middle school, and Parveen (2018) found the model to be effective with high school students. Evaluations of the 5E model have also identified considerable variation in effectiveness across settings, implementation, and measurements. Okafor’s (2019) evaluation, for example, found the 5E model to be effective for specific mathematics outcomes such as geometry achievement. Similarly, Yilmaz et al. (2011) found the 5E model to be effective for specific science concepts, such as concepts related to genetics.
Inquiry models of instruction such as the 5E instructional model (and its variations) have been widely implemented and studied, and interest in implementing these models remains high. A comprehensive and rigorous systematic review of these studies, however, has yet to be conducted. The purpose of this synthesis, therefore, was to fill this gap and provide the field with a clearer understanding of the 5E model’s effectiveness, the heterogeneity of its effects, and what might explain the heterogeneity. We first present an overview of the 5E model and its variations, and some prior, smaller-scale reviews conducted on the model’s effects. We then describe our methods and present results, including our pre-analysis plan for conducting confirmatory and exploratory moderator analyses. We end by discussing implications for practice and next steps for researchers.
How the 5E Instructional Model Works in Practice
Each phase of the 5E model is characterized by a set of goals or practices (Table 1). The first stage of the 5E model is to engage students in the learning process by creating interest and curiosity about the topic. Teachers can use a variety of strategies to engage students, such as asking provocative questions, showing a video or image related to the topic, or conducting a short demonstration. A teacher might ask, “How do plants convert light energy into chemical energy?” or, “In plants with reduced photosynthesis, what are the consequences?” The second stage of the 5E model is to explore the topic through (usually but not prescriptively) hands-on investigations, allowing students to develop their own understanding of the concepts through experimentation and observation. Students might investigate, for example, the effects of different light intensities or wavelengths on photosynthesis by measuring the rate of oxygen production by a photosynthetic organism. The third stage of the 5E model is for students to explain the concepts and ideas introduced during the engage and explore stages. The explain stage focuses students’ attention on a particular aspect of their engagement and exploration experiences and provides opportunities for students to make connections between what they have observed and the scientific principles that underlie them, and to demonstrate their conceptual understanding and scientific practices. An explanation from the teacher or the curriculum may guide them toward the deeper understanding that is a critical part of this phase, but the explain phase is intended to be largely student-led.
Overview of the 3E/5E/7E Instructional Model

The 7E model also includes these two stages.
The 3E model typically only includes these three stages.
The last two stages are elaborate and evaluate. In the elaborate stage, teachers introduce new experiences and challenge students to develop deeper and broader understanding, gain more information, and further build skills. The evaluate stage encourages students to assess their understanding and abilities, and it provides opportunities for teachers to evaluate student progress toward achieving the educational objectives. The teacher might use traditional assessments, such as quizzes or exams, that require students to apply their knowledge to problem-solving scenarios or open-ended questions. The teacher might also use performance-based assessments such as lab reports, research papers, or multimedia presentations, which require students to synthesize and communicate their understanding of a concept in diverse contexts and formats.
Two variations of the 5E model are also included in this synthesis. First, an instructional model that includes only the explore, explain, and elaborate stages—aligning with the seminal learning cycle proposed by Atkin and Karplus (1962)—is referred to as a “3E” model. Second, subsequent to BSCS’s development and use of the 5E model in its curriculum programs, Eisenkraft (2003) proposed a 7E model that added two stages to the 5E model. These stages, elicit and extend, made evocation of students’ prior conceptions and students’ far transfer of concepts more explicit. He argued that these important stages may be neglected in mechanical or limited implementations of the 5E model. The 3E, 5E, and 7E models all build on constructivist learning theory (e.g., Vygotsky, 1962) and empirical evidence on how students learn. All three model types help students develop rich conceptual understandings and frameworks, as suggested in How People Learn (Bransford et al., 2000). Key differences between the 3E and the 5E/7E models are that the 3E model does not include an overt engage/elicit stage where students are encouraged to make explicit their existing understandings of scientific phenomena or an evaluation stage, where students continuously evaluate those understandings (i.e., metacognition). The importance of engaging prior knowledge and encouraging metacognition about that knowledge are key findings from How People Learn that the 5E/7E models directly incorporate.
Other Applications and Outcomes
Although the 5E and related models were designed and have been primarily evaluated for science education, researchers have extended their use to related domains and aspects of STEM (science, technology, engineering, and mathematics) education. Given the close connection of mathematics to science instruction, researchers have evaluated the 5E model’s effects on math achievement. Okafor (2019), for example, examined the effects of the 5E model on geometry and found significant positive effects on both math achievement and retention of geometric concepts two weeks later.
In addition, given the extensive evidence of the relationship between motivation and academic achievement, researchers have examined the 5E model’s effects on motivation (Kriegbaum et al., 2018). Within the situated expectancy value theory (SEVT) framework, efficacy has a strong relationship to performance whereas subjective task values have a strong relationship to course taking, task choices and other behaviors. As a result, researchers have examined the 5E model’s effects on several motivation outcomes, including interest in mathematics, self-efficacy in learning chemistry, and the importance of physics in daily life. Omotayo and Adeleke (2017) found a significant positive effect of the 5E model on interest in mathematics. Dindar (2012) found a significant positive effect of the 5E model on self-efficacy for learning chemistry, while controlling for pretest motivation variables including self-efficacy and the interaction of instructional model and gender. On the other hand, Güzel (2016) found no effect of the 5E model on students’ perceptions of the importance of physics in daily life. Because of these mixed results and researchers’ prior interest of the 5E model’s impact on motivational outcomes, we chose to examine motivation in addition to achievement outcomes.
Prior Reviews and the Need for a Comprehensive Synthesis
Our literature search identified several small-scale attempts to synthesize effects from 5E and related models, focused on implementations that occurred in Turkey. Anil and Batdi (2015) reviewed 14 studies, synthesizing effects only on science outcomes, and only from studies published from 2008 to 2014. Similarly, Cakir (2017) conducted a review of 31 effects on science outcomes, drawing on studies from 2006 to 2016. Both studies also synthesized multiple effect sizes from the same study without accounting for the within-study statistical dependence of those effect sizes, an outdated approach that can distort meta-analytic results and their accuracy.
Our study is the first comprehensive, rigorous systematic review and meta-analysis on the effectiveness of the 5E model and the most common related models, the 3E and 7E models. We examined the effectiveness of these models for pre-K–12 students’ STEM achievement outcomes, including tests of their subject matter knowledge, critical thinking, scientific inquiry, and other STEM-related topics and skills, and we examined both heterogeneity in effectiveness and potential sources of the heterogeneity. As a secondary outcome, we also examined the effects of the 5E model on students’ motivation to achieve in STEM-related outcome domains.
Research Questions
Our systematic review and meta-analysis focused on the following research questions:
What are the average effects of the 5E and related models on students’ science, math, and motivation outcomes?
What is the heterogeneity in effects of the 5E and related models, and how are variations in effects explained by study characteristics such as implementation, design, and student populations?
Methods
Prior to conducting the systematic review and meta-analysis, we created a review protocol that articulated the research questions, inclusion/exclusion criteria, search strategy, screening procedures, data extraction codebook, and pre-analysis plan. We followed the Campbell Collaboration’s Methodological Expectations of Campbell Collaboration Intervention Reviews checklist (The Methods Group of the Campbell Collaboration, 2019). We preregistered the protocol and the preanalysis plan on the Open Science Framework (OSF), and we also published the extracted and analytical datasets and R code (available at https://osf.io/937kg/). The published R code allows users to transform the raw dataset into the analytical dataset; reproduce all models conducted for the analyses; reproduce all results, tables, and figures presented in the main text; and reproduce all exploratory analyses and supplemental findings.
We extracted study information using MetaReviewer, a browser-based relational database software tool (Polanin et al., 2023). We stored data collected at each phase of the process (i.e., search, screening, data extraction, and effect size estimation) in MetaReviewer, which resulted in a spreadsheet documenting if and when we screened out a given citation and an automatically generated raw flat file dataset at the effect size level for analysis. We relied primarily on the R packages metafor (Viechtbauer, 2010), clubSandwich (Pustejovsky, 2022), and tidyverse (Wickham et al., 2019) to clean and preprocess data, run meta-analytic and meta-regression models, and create tables and plots. Additional packages we used to process the data can be found in our R scripts. We used the R package PRISMA2020 to create a fully reproducible PRISMA flowchart (Haddaway et al., 2023).
Inclusion/Exclusion Criteria
We selected primary research studies based on the following inclusion and exclusion criteria. First, a study must have evaluated the efficacy of a curricular enactment of a 5E or related model, including the BSCS 5E model (Bybee et al., 2006); a 7E instructional model (Eisenkraft, 2003); or a model that included at least an explore, explain, and elaborate stage, often referred to as a 3E model. In all cases, we required that the explore stage come before the explain stage (Brown, 2019). We did not consider a single 5E lesson to be an eligible intervention based on our definition of curricular enactment. Instead, we included enactments that were more comprehensive, such as a 5E structure applied to a chapter of a book, or a unit or semester of instruction. Enactments must have lasted a minimum of five class periods or 4 hours to be included.
Studies must have evaluated the effect(s) of a curricular enactment of a 5E or related model in an authentic, school-based setting. Studies of such models enacted in afterschool programs, museums, community centers, or other informal settings were excluded. Studies must have included students who were in grades pre-K through 12 during the first time point in the study. Studies must also have included a business-as-usual group; therefore, studies that contrasted two different intervention types were not eligible for inclusion. As is, unfortunately, common reporting practice in education research, all but five included studies did not describe the business-as-usual instruction, but reported business-as-usual comparison groups in studies that met our criteria included (but were not limited to) direct instruction, traditional instruction or lecture, and traditional laboratory activities.
We included studies that randomly assigned participants to a condition using a randomized controlled trial (RCT) or cluster RCT, such as studies that randomly assigned schools or classrooms to conditions. We included RCT studies regardless of the level of random assignment (e.g., student-level, classroom-level, teacher-level, or school-level assignment). We excluded studies that did not randomly assign participants (e.g., quasi-experimental designs) and that used single-case designs. We also excluded studies due to “n = 1” confounds (What Works Clearinghouse [WWC], 2022), such as when a single school was assigned to implement a 5E model or a single school served as a comparison group.
Studies must have measured an outcome in one of three outcome domains: science achievement, mathematics achievement, or motivation. Science achievement included outcomes in the following areas: general science content; individual subdomains such as life science, physical science, earth science, chemistry, or biology; and science-based skills, including cognitive skills such as critical thinking. Mathematics achievement included outcomes in the following areas: math facts, number sense, number and operations, fractions, measurement, data analysis, statistics and probability, algebra, geometry, word problems and general mathematics achievement. Motivation included constructs from SEVT (Eccles & Wigfield, 2020): intrinsic value, utility value, attainment value, and perceived cost (see the Supplemental Appendix in the online version of the journal for further description).
Finally, studies were included regardless of the country from which a study’s sample was drawn, as long as the study was written in English. Studies must have been written on or after 1990, the year in which the 5E model was first introduced (Bybee, 1990).
Systematic Search
We used multiple complementary search strategies to ensure a comprehensive review (Polanin et al., 2019a). First, we conducted a systematic search for both published and unpublished relevant studies using the following online databases: Academic Search Premier, Education Research Complete, Education Source, Education Resource Information Center (ERIC), APA PsycInfo, and SocINDEX with Full Text via EBSCO; Social Sciences Citation Index, Book Citation Index, Conference Proceedings Citation Index, Emerging Sources Citation Index via Web of Science Core Collection; Periodicals Archive Online, Periodicals Index Online, ProQuest Dissertations and Theses Global, Social Science Premium Collection: Education Collection and Social Science Database via ProQuest; and PubMed. We tailored our search string to the requirements of each database. We conducted this search twice, once in October 2020 and again in December 2021. An example of our search terms and search string are included in the Supplemental Appendix in the online version of the journal.
Second, we conducted supplemental searches of additional databases of the Social Science Research Network eLibrary, Registry of Efficacy & Effectiveness Studies (REES), Campbell Systematic Reviews, Cochrane Systematic Reviews, OECD iLibrary, International Initiative for Impact Evaluation database, and the Open Science Framework. We also searched the websites of 30 relevant organizations, such as Abt Associates, Mathematica, MDRC, RAND Corporation, RTI International, and WestEd. Finally, we conducted both forward and backward reference harvesting of all included studies.
Screening
Screening occurred in two stages. In the first stage, we used best practices for abstract screening of citations identified during the search phase (Polanin et al., 2019b). We developed an abstract screening guide and screened the abstracts using Abstrackr, a free, open-source, web-based tool (Wallace et al., 2012). All review team members screened abstracts, and each abstract was double-screened. The principal investigator and project director provided training prior to beginning screening. We reconciled disagreements throughout the process. For the second stage, we attempted to retrieve the full-text PDFs for all citations that were deemed eligible during abstract screening. For all full-text PDFs retrieved, we conducted full-text screening, again following best practices. We developed a full-text screening guide based on the inclusion/exclusion criteria, provided training to all screeners, and conducted pilot screening. All screening decisions were validated by senior review team members to ensure accuracy.
Data Extraction
We used MetaReviewer (Polanin et al., 2023) to extract information from each eligible study. We created a data extraction codebook to detail all information to be extracted from each study and uploaded it into MetaReviewer to automatically generate a coding form. Coders used the coding form to extract study-level information (e.g., details on assignment of participants to conditions, sample demographic characteristics), characteristics of the intervention and comparison conditions (e.g., stages of the 5E or related model that were implemented, alignment between intended and actual implementation of each stage), construct-level information (e.g., measurement type and timing), and summary data used to estimate effect sizes (e.g., means and standard deviations for the intervention and comparison conditions). We adopted a study quality coding system that mirrors that of the WWC Version 5.0 (WWC, 2022). Specifically, we examined study and outcome level characteristics including presence of treatment effect confounds, measure reliability, attrition, and baseline equivalence. Although all studies used a randomized design as a condition of eligibility, some studies did not provide attrition information; in those cases, we estimated bassline equivalence between the intervention and comparison condition. Once a coder finished extracting data for a study, a senior member of the research team validated each piece of extracted information.
Data Handling and Effect Size Estimation
MetaReviewer automatically generated a spreadsheet of all extracted study information. We downloaded and imported the spreadsheet into R, where we recoded and cleaned all analytical variables (see “Data & Scripts” in the OSF project page for details). We estimated all effect sizes using metafor (Viechtbauer, 2010). The majority of outcome data were continuous, so we estimated a standardized mean-difference adjusting for small-sample bias, commonly referred to as Hedges’ g (Hedges, 1981). We prioritized extracting raw, unadjusted means and standard deviations, which were the most often available summary data for baseline and outcome data. We then used the baseline data to adjust for possible selection bias by using a difference-in-difference effect size estimation procedure as outlined in the WWC Version 4.1 Procedures Handbook (WWC, 2020). When the outcome was dichotomous, we estimated the log odds ratio and transformed it into Hedges’ g using the equations suggested by the WWC (2020, p. E-7). Because some study authors assigned schools or classrooms to conditions but did not account for clustering, we estimated the effective sample size for all effect sizes, which adjusts the analytic sample size in a way that is equivalent to estimating a multilevel model (Higgins et al., 2023). Finally, based on our outlier analysis, we winsorized our effect size distribution, reducing the highest and lowest values to a maximum and minimum set of values three standard deviations from the average. As we explain below, we conducted sensitivity analyses on the nonwinsorized effects to ensure that the procedure did not have an undue influence on results.
We handled missing data using the “infer, initiate, impute” method recommended by Pigott and Polanin (2020). We first sought to limit missingness by inferring data based on the information provided. When data necessary to compute effect sizes were missing, we emailed the author directly, asking for the missing information. A small proportion of study authors returned our request: Of the 15 emails sent, 2 received responses with at least some of the information requested (13%). We elected to impute missing pretest-posttest correlations using the WWC’s suggestions (WWC, 2020). We did not conduct multiple imputation on the remainder of missing data because the dataset was on the borderline of an acceptable size.
Quantitative Synthesis of Effect Sizes
We split our included studies by outcome domain, resulting in three meta-analytic models: science, mathematics, and motivation. We used a random-effects model with robust variance estimation to account for effect size dependencies (i.e., multiple effects extracted from one study; Hedges et al., 2010). Robust variance estimation models enable synthesis of multiple effect sizes within a single study simultaneously, across the totality of studies. We implemented the relatively new approach of a correlated-hierarchical effects model, which simultaneously allows for both correlated effects (i.e., multiple measures of a single outcome domain) and hierarchical effects (i.e., effects from multiple samples within a single study). The model procedures require an implied correlation among the effect sizes, which we set at .80 based on common practices and discussion amongst our methodological advisors.
We report additional measures that help in the translation of the average effects. We estimated effect size heterogeneity via tau (τ), which measures the absolute heterogeneity across the effect sizes (Borenstein et al., 2017). We elected to report total tau, which is the sum of between-study and within-study heterogeneity, as it encompasses the full variability of the effect size data. Using tau, we estimated the 95% prediction intervals, reflecting the lower and upper values within two standard deviations. The WWC’s Improvement Index is a measure of how much we’d expect the average participant in the control group to improve if they had received the intervention; an Improvement Index of 10 suggests that the average control group member would increase their percentile ranking by 10 points (WWC, 2020).
For the science outcome domain, we conducted confirmatory and exploratory moderator analyses to explain effect heterogeneity. The confirmatory moderators of interest specified in our analysis plan included: duration of model enactment, inclusion of professional development, implementation quality (as reported), sample age, sample sex composition (percentage of students who were classified as male or female), outcome measure, and variations in the instructional model (i.e., 3E vs. 5E vs. 7E). We added country in which the evaluation occurred (i.e., United States [U.S.], Turkey, or Other) after specifying our confirmatory moderators, so this variable is treated as an exploratory moderator.
Out of concerns for confounding, and to estimate a precise effect size, we also conducted exploratory meta-regression analyses that included all the confirmatory and exploratory moderators within a single model. To assess model fit, we estimated (a) pseudo R-squared, which takes the difference in tau between the unconditional model and the conditional meta-regression model and divides it by the unconditional model tau; and (b) the likelihood ratio test, which assesses model fit across two nested models. We estimated our preferred model on the motivation outcome domain as well; we attempted to fit the model with the math outcome, but due to sample size restrictions, the model would not converge.
Finally, we conducted publication bias and sensitivity analyses. To examine publication bias, we created a contour-enhanced funnel plot, which plots the location of the effect size as a function of its standard error (Viechtbauer, 2020). Peters et al. (2008) argued that publication bias is easier to detect using this format. In these plots, the unshaded white region corresponds to p-values less than .10, the dark gray to p-values between .10 and .05, and the light gray to p-values less than .05. We also examined publication bias using a version of Egger’s regression that accounts for the effect size dependency (Rodgers & Pustjevosky, 2021), and a three-parameter selection model, which estimates the percentage of studies that were not published and adjusts the weighted average and tau accordingly (Pustejovsky & Joshi, 2023). For sensitivity analyses, we estimated the average effects without winsorization, as mentioned previously; we also estimated overall average effects for studies that had at least one confirmatory moderator missing.
Results
The PRISMA flowchart in Figure 1 presents the full results of our search, screen, and data extraction processes. Our database search resulted in 5,873 citations, and our additional search procedures resulted in 375 citations. We removed 2,895 citations identified as duplicates. Of the 2,983 remaining citations, 2,506 were screened out after abstract review, and 477 remained for full-text retrieval and review. We were able to retrieve 436 full-text PDFs. From our supplemental searches, we sought to retrieve 172 additional reports, of which we screened 152 found PDFs. Combined, we located and included 61 independent studies, from 65 reports, that met our eligibility criteria and were retained for data extraction and analysis.
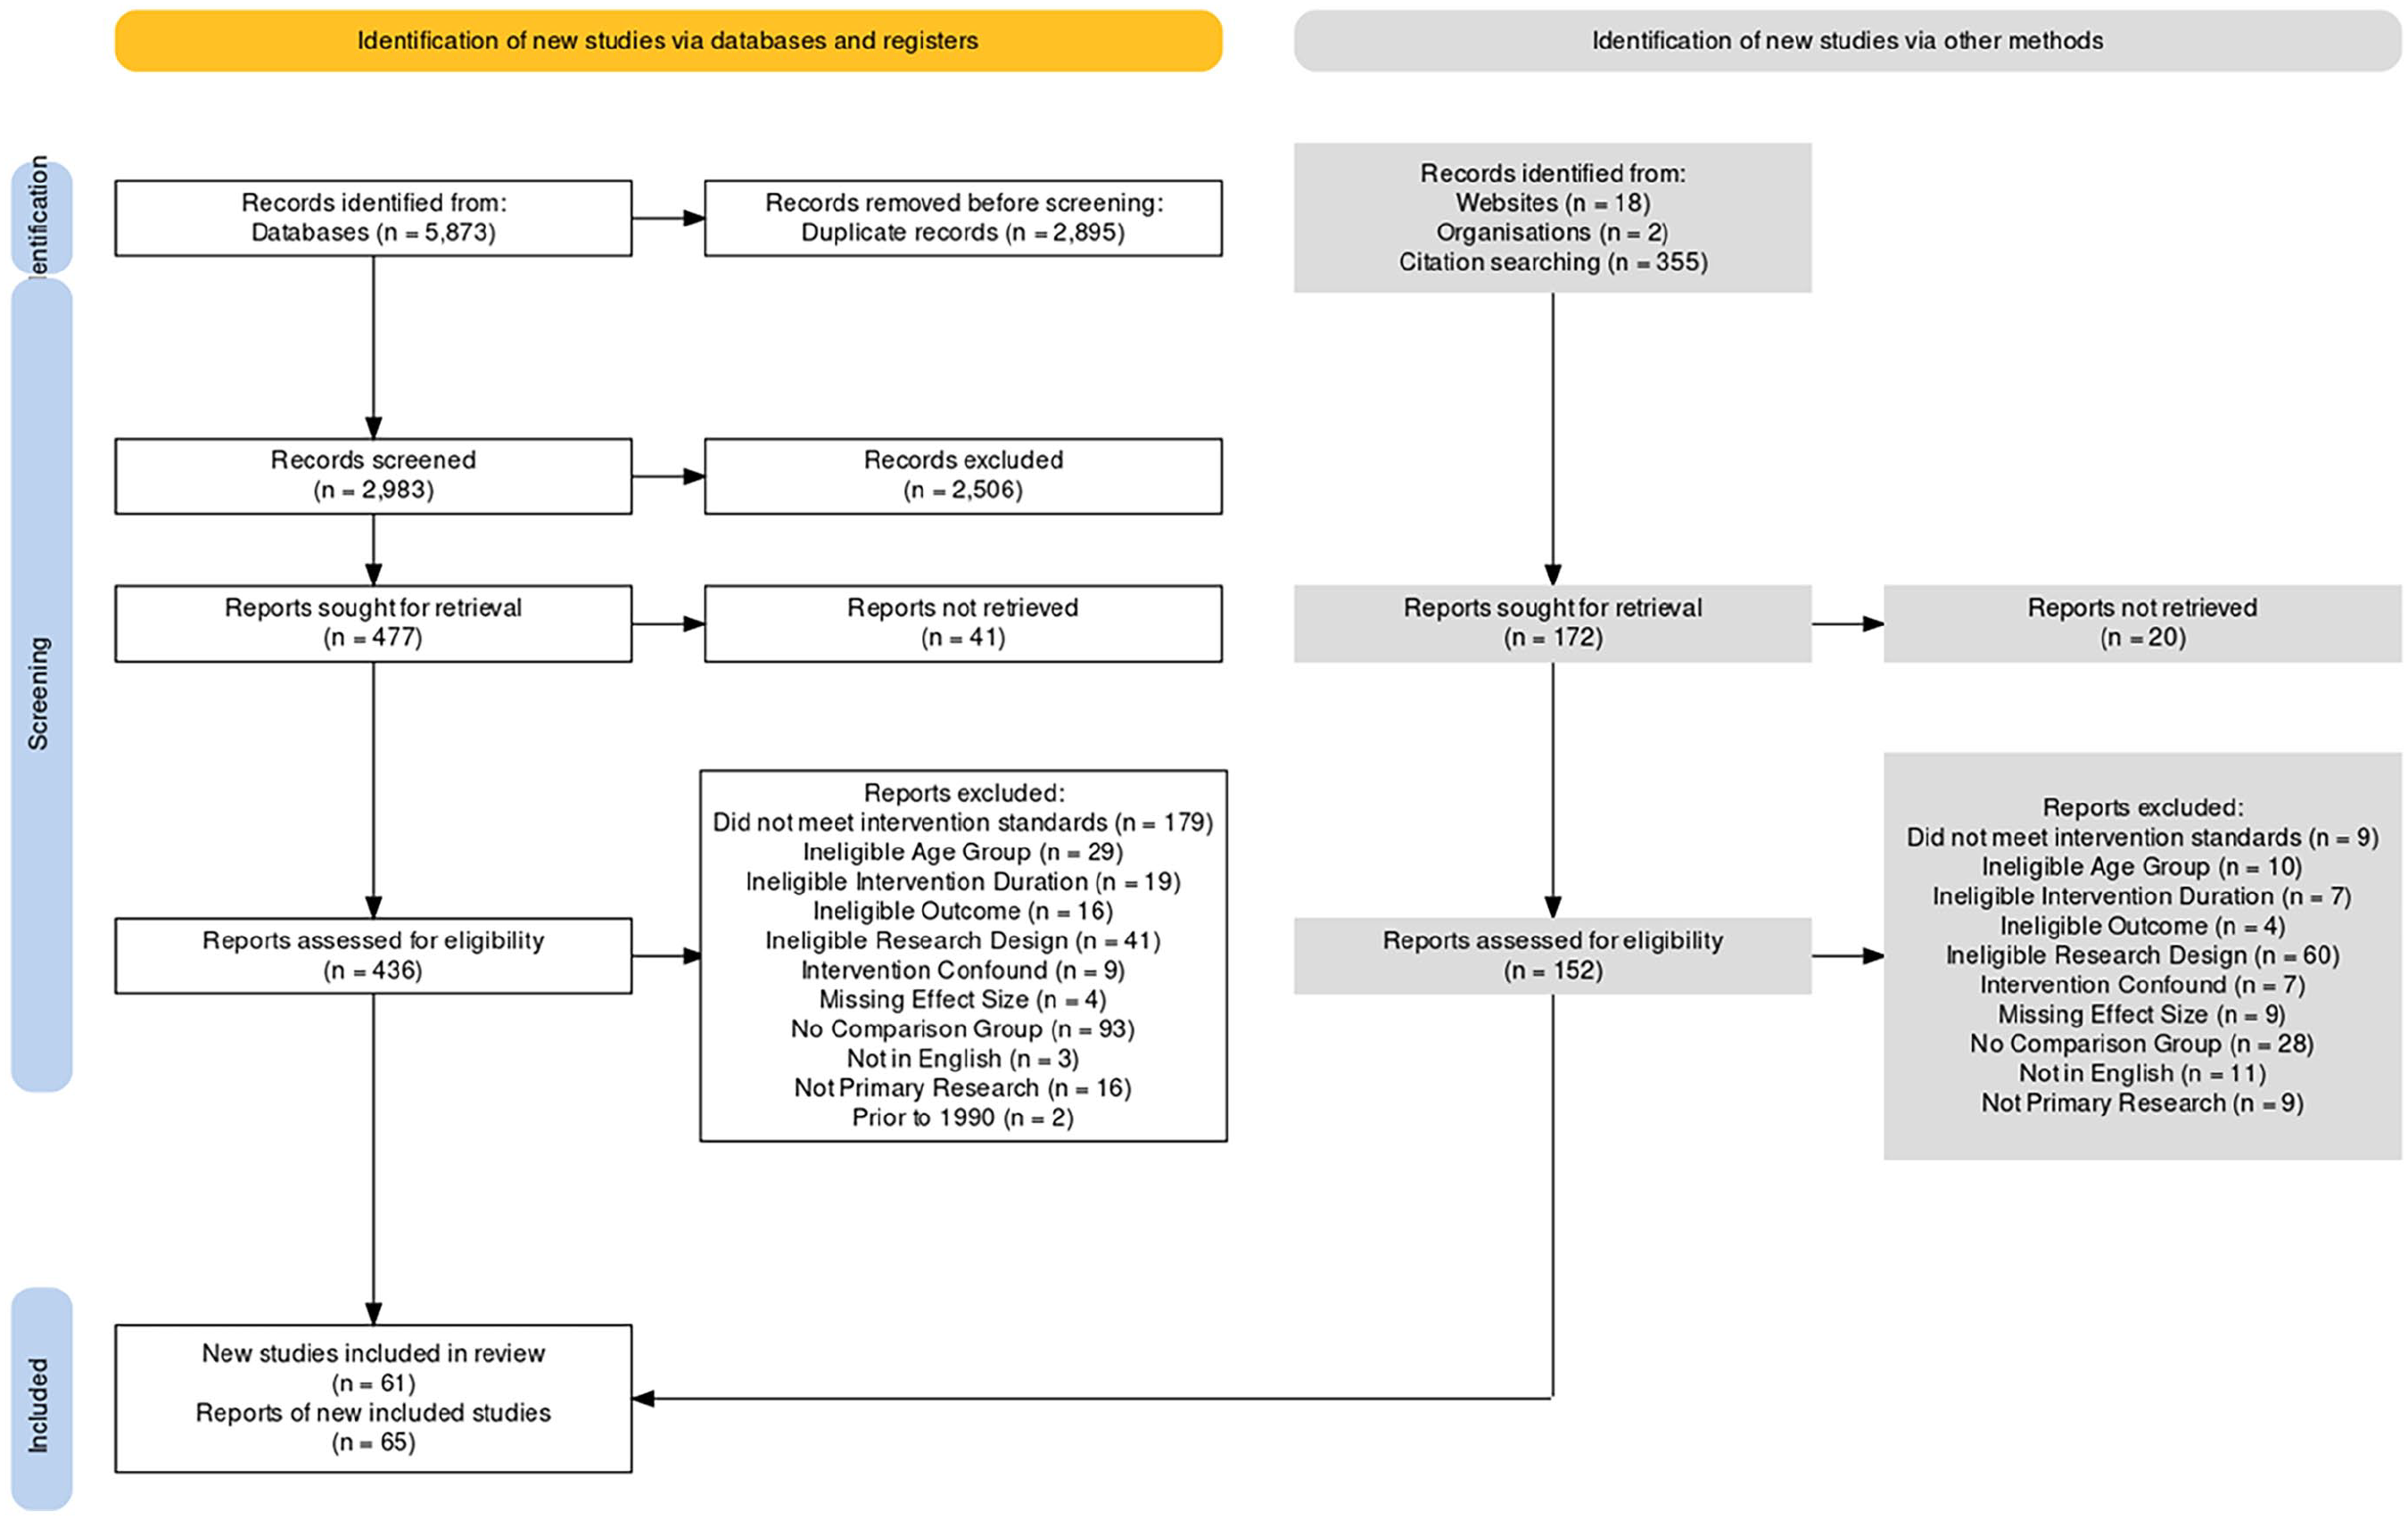
PRISMA 2020 flowchart.
Characteristics of Included Studies
Summaries of the study and effect size characteristics are presented in Table 2. A majority of the 61 studies assessed the effects of the 5E model (74%); whereas 8 studies each evaluated the effects of a 3E or 7E instructional model (13%, respectively). Most studies had at least one peer-reviewed report (74%), and the average date of publication was 2010 (SD = 5.6). Almost half of the studies were conducted in Turkey (48%), 15% were conducted in the United States, and the remainder (38%) were conducted in a different country. 1 Most studies sampled students in Grades 9 through 12 (57%). A wide range of assignment mechanisms were implemented, with a plurality assigning teachers or classrooms (within schools) to conditions (36%). Fewer than half (48%) of the implementations included a professional learning component, and the average duration of implementation was 7.7 weeks (SD = 7.1).
Study and Effect Size Characteristics

Note. IQR = interquartile range.
We also provided a description of the included studies’ effect size characteristics. Of the 156 estimated effect sizes, the majority assessed effects on science outcomes (65%), relative to math outcomes (6%) and motivation outcomes (29%). Among science achievement effects, most measured effects on physical science outcomes (33% of the total; 50% of the science domain) or life science (28% of science) outcomes. The sex composition of the samples ranged from 100% female students to 100% male students, with a plurality of studies having an even distribution (33%). For most effect sizes, the sample’s socioeconomic status was not reported (83%). A plurality of studies (40%) reported an outcome measure reliability between .67 and .77. Most measures were created by a person associated with the implementation of the instructional model or by educators delivering the instructional model (59%). The effect sizes were drawn from studies with an average sample size of 160 individuals (SD = 240).
Results of Meta-Analyses
Regarding Research Question 1, our unconditional meta-analytic models found that 5E and related instructional models have a significant positive effect on all outcomes: science (g = 0.82, SE = 0.08, 95% confidence interval [CI] [0.67, 0.97]), math (g = 0.70, SE = 0.20, 95% CI[0.31, 1.10]) and motivation (g = 0.24, SE = 0.05, 95% CI[0.14, 0.34]) (see Supplemental Table 1 in the online version of the journal). Translating these effect sizes to the WWC’s Improvement Index, a member of the control group who received the 5E model could expect to improve their science domain percentile rank by 29 points. For math, one could expect to improve their percentile rank by 26 points; for motivation, by 10 points.
The results also indicated a large amount of effect size heterogeneity within the science (τ = .56) and math domains (τ = .46); but little heterogeneity in the motivation domain (τ = .21). As a result of this significant heterogeneity, the 95% prediction interval indicates a 95% probability that the true effect of the 5E model on science outcomes was between −0.38 and 1.92 standard deviations. However, a less ambiguous assessment of the effect size distribution is the probability of positive effect. For science, the probability of positive effect is 93%, indicating that practitioners can be confident the implementation of the 5Es or related models will result in an increase in science outcomes.
Confirmatory and Exploratory Moderator Findings for the Science Outcome Domain
To address Research Question 2, we now turn to the results of the confirmatory (Table 3) and exploratory (Table 4) moderator analyses for the science outcome domain. Of the six confirmatory moderator analyses we conducted, two moderators—instructional model and outcome construct—yielded statistically significant F-statistics (Tipton & Pustejovsky, 2015). The moderator analysis results for instructional model indicated that statistically significant differences between the 3E, 5E, and 7E models (F = 5.03, p = .03). Further exploratory posthoc analyses indicated that the 7E model (g = 1.23, SE = 0.18) had statistically significantly larger effects (p < .01) than the 3E model (g = 0.42, SE = 0.15). However, the 5E model’s results also produced a large effect size (g = 0.82, SE = 0.09), but the posthoc tests indicated no statistically significant differences between the 5E model and either the 3E or the 7E models. Furthermore, a much smaller number of studies evaluated either the 3E (k = 7) or the 7E (k = 6) models on a science outcome. Confirmatory moderator analyses also indicated statistically significant findings for differences among effect sizes, based on the outcome construct levels (F = 4.47, p = .05). Posthoc analyses suggested that the differences (p < .01) lie between measures of general science (k = 6, g = 0.39, SE = 0.09) and physical science (k = 30, g = 0.90, SE = 0.11).
Moderator Analyses for Science Outcome Domain

Note. k = number of studies; m = number of effect sizes; F-statistic represents the Approximate Hotelling’s test statistics found in Tipton and Pustejovsky (2015); all variables are confirmatory except for Country and WWC rating, which we added after writing our preanalysis plan.
Indicates statistically significant differences between the levels (p < .01).
No studies reported an intervention length of 4–5 months.
Exploratory Meta-Regression Model on Science Outcome Domain
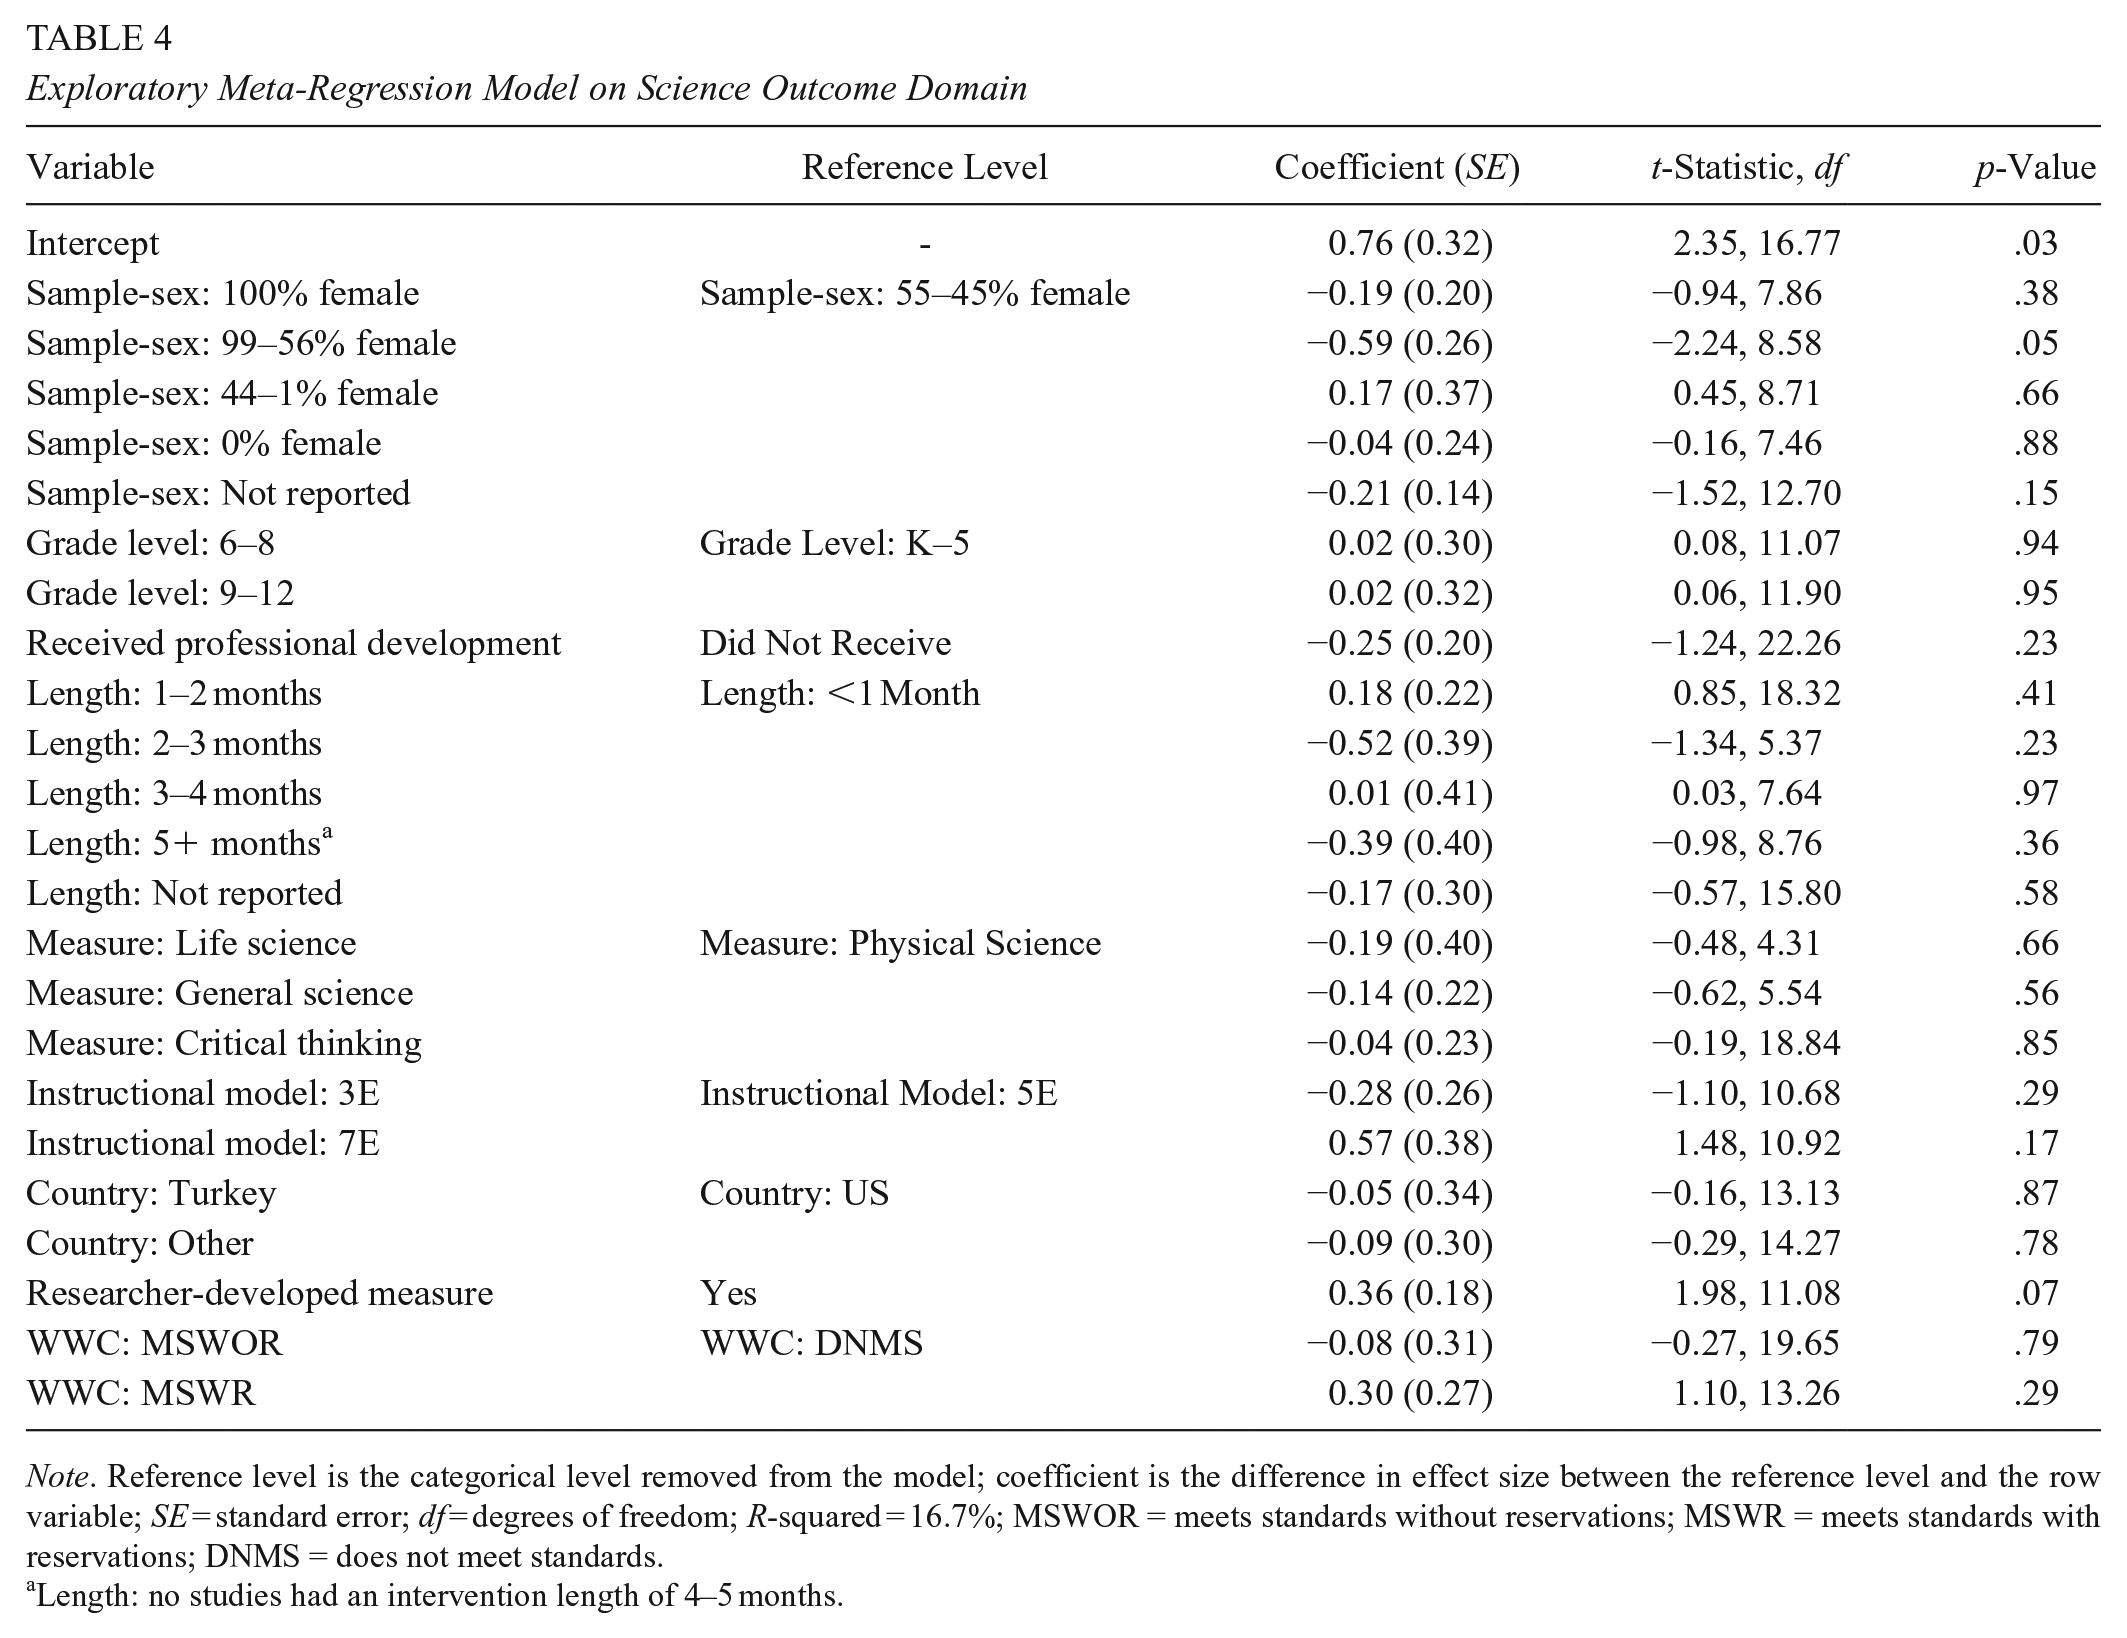
Note. Reference level is the categorical level removed from the model; coefficient is the difference in effect size between the reference level and the row variable; SE = standard error; df = degrees of freedom; R-squared = 16.7%; MSWOR = meets standards without reservations; MSWR = meets standards with reservations; DNMS = does not meet standards.
Length: no studies had an intervention length of 4–5 months.
Our additional exploratory moderator analysis of differences by country in which the evaluation took place also revealed statistically significant differences in effect sizes between studies conducted in the U.S., Turkey, or another country (F = 3.51, p = .03). Further posthoc analyses indicated that the significant difference (p < .01) was between studies conducted in the U.S. (g = 0.46, SE = 0.13) and Turkey (g = 0.96, SE = 0.11).
Before turning to our exploratory meta-regression analyses, we deemed it necessary to conduct a descriptive analysis to better understand the moderator results for instructional model (3E/5E/7E) and for country of evaluation (see Supplemental Tables 4a and 4b in the online version of the journal). Our descriptive analysis of country by variable revealed that, of the six moderator variables we tested, four had chi-square results of p < .01, indicating the distribution of characteristics was not even across countries. Relative to the other countries, U.S. studies more often included students in Grades K–5. Interestingly, we found few other stark differences across the countries of evaluation. Our analyses of instructional model crossed with other study characteristics also revealed that four of the six characteristics had uneven distributions across the three instructional models. Perhaps most strikingly, these results revealed that no eligible studies evaluated the 7Es (a) within a U.S. context, (b) with a life science achievement measure, or (c) using a scale-up approach with more than three schools per condition.
Our moderator and descriptive analyses indicated that we needed to further explore how and why effects vary. Recognizing that the unique relationship between a study characteristic and its associated effect sizes can be confounded by other study characteristics, and wanting to create a precise estimate of our average effect for the 5E model, we elected to conduct a series of exploratory meta-regression analyses. We present results from three models: (1) all confirmatory and exploratory variables, (2) all confirmatory and exploratory variables as well as a 3E/5E/7E model by country interaction term, and (3) all variables extracted with sufficient (nonmissing) information. A comparison of Model 1 to Model 2, using a likelihood-ratio test (Viechtbauer, 2023) of nested models, indicated that Model 2’s fit was not statistically significantly better relative to Model 1 (likelihood ratio test [LRT] = 4.87, df = 3, p = .18). The fit statistics for Model 3 indicated poor fit, likely due to overfitting. We therefore discuss the results of the more parsimonious and translatable Model 1 (Table 4), while providing the results of Models 2 and 3 in Supplemental Tables 2 and 3 in the online version of the journal.
The results of meta-regression Model 1 (Table 4) revealed several findings of interest. First, only one variable had a statistically significant relationship with the size of the effect: the percentage of female students in the sample. Specifically, effects differed significantly for samples that were comprised of a majority of female students (56–99%) compared to samples that had an even distribution of male and female students (55–45% female students; b = −0.59, SE = 0.26, p = .05). Samples that were comprised of 100% female students also had smaller effects, but the difference was smaller, and the results were not statistically significant (b = −0.19, SE = 0.20, p = .38). There are multiple possible interpretations of this finding. For example, studies of 7E implementations and studies focusing on Grades 9–12 were overrepresented in Turkey and tended to have higher effect sizes, but these studies also had few effects from samples with majority-female students; it could be the case that fewer female students in Turkey took science courses in which the most effective implementations took place, while female students in the U.S. took science courses in which less effective implementations took place (i.e., the results are driven by the effectiveness of the implementation in the courses students found themselves taking, rather than the gender of the students in those courses). Alternately, it could be that science performance was already higher among female students, so there was less room for improvement in classes with more of these students. More studies are needed to disentangle these variables.
Two other results are of interest. Second, our meta-regression model results indicated that studies in Turkey and other-non-U.S. and non-Turkish countries would have consistently lower effects relative to U.S. studies; however, neither of the coefficients were statistically significant (p > .05), and the coefficients were considerably smaller compared to the bivariate, exploratory moderator analyses presented in Table 3. Third, as others have found (Wolf & Harbatkin, 2023), findings from measures that researchers developed had larger effects compared to findings from standardized measures (b = 0.37, SE = 0.18); the results were not statistically significant (p = .07) but clearly aligned with the historical trend.
Finally, coefficients for the 3E/5E/7E model types also failed to reach statistical significance (p > .05). However, the coefficients remained consistent with the bivariate findings: Evaluations of 7E models found larger effects relative to evaluations of 5E models, and evaluations of 5E models found larger effects relative to evaluations of 3E models. Meta-regression Model 1 explained a considerable amount of heterogeneity (R2 = 36.6%), especially relative to other large-scale, rigorous meta-analyses of STEM outcomes published recently (Williams et al., 2022).
Findings for Math Outcome Domain
Given the small number of studies identified as eligible for inclusion that examined a math outcome (k = 6), we elected not to conduct confirmatory moderator analyses in the math outcome domain. We attempted to run the same exploratory meta-regression model used for the science outcome domain, but the model would not converge properly and produced nonsensical results. As a result, we elected not to present those findings here. Interested readers can access the analyses via the statistical scripts published on our OSF project page.
Findings for Motivation Outcome Domain
We did not plan to conduct confirmatory moderator analyses for the motivation outcome domain because it was a supplementary outcome, but we did conduct exploratory meta-regression analyses. Given the small number of studies and effect sizes available, we were concerned with overfitting the model to the data. We therefore elected to run two models: (1) a full model with the same covariates as the final science domain (Supplemental Table 5 in the online version of the journal) and (2) a reduced model (Supplemental Table 6 in the online version of the journal) in which only covariates that had a statistically significant relationship (p < .05) were retained. The results indicated that the full model likely overfit the data because the intercept was outside the bounds of the smallest effect (b = −0.57, SE = 0.31). Comparing the two models, the reduced model had a smaller absolute Akaiki Information Criterion (AIC) (Model 1: −7.62; Model 2: 0.51) and had a larger R2 value (Model 1: 56.0%; Model 2: 68.9%). Taken together, we elected to focus on the results from the reduced model.
Several findings from the reduced model are noteworthy. The results indicated that students in Grades 9–12 benefited more in motivation from the 5E model relative to students in Grades K–5 (b = 0.07, SE = 0.09, p = .43). Relative to the 5E model, implementations of the 7E model resulted in greater motivation (b = 0.89, SE = 0.11, p = .01). Compared to effects on intrinsic motivation, the effects on perceived cost were significantly smaller (b = −0.47, SE = 0.07, p = .01). The cost measures all focused on anxiety, falling within the psychological cost subcomponent of the perceived cost construct (Eccles & Wigfield, 2020; Flake et al., 2015). Enactments of the instructional models that lasted at least 1 month had greater effects on motivation than did shorter enactments (1–2 months: b = 0.28, SE = 0.09, p = .03; 5 months or greater: b = 0.39, SE = 0.13, p = 0.02; 3–4 months: not statistically significant but large in magnitude [0.30]).
Publication Bias and Sensitivity Analysis Results
We conducted three publication bias analyses on the science outcome domain. The first was to create a contour-enhanced funnel plot (Supplemental Figure 1 in the online version of the journal). Our visual inspection suggested that, in addition to few studies showing negative results, there may be some evidence of publication bias due to small sample sizes. However, when we used Egger’s regression with a correlated and hierarchical effects (CHE) meta-analytic model accounting for effect size dependency, the results revealed a nonsignificant relationship between the two variables, indicating publication bias was likely not observed (Supplemental Tables 7 and 8 in the online version of the journal). The third publication bias analysis, using a selection model that also accounts for effect size dependency, estimated the percentage of studies that were censored due to nonsignificance. The results again revealed that publication bias was likely not observed (δ = 0.98, 95% CI[0.52, 1.85]). The selection-adjusted meta-analytic average did not change from the unconditional meta-analytic average, but the estimate of tau did increase. This means that, if selection were an issue, it would be likely to increase the effect size heterogeneity but not the average effect. Although it appears that the data is skewed to positive results, our efforts to retrieve unpublished studies, combined with the totality of publication bias analyses, suggested that publication bias should not completely limit our interpretation of the results. Nevertheless, we must urge some caution and, as we note in the discussion, err on the side of the smaller magnitude of an effect.
Finally, we conducted sensitivity analyses to ensure robustness to analytic decisions we made (Supplemental Table 9 in the online version of the journal). We reanalyzed our unconditional meta-analytic models with nonwinsorized effect sizes. For each of the three outcome domains, the results were nearly identical, save for a small difference in the motivation outcome domain (g winsorized = 0.24 vs. g nonwinsorized = 0.29). We also examined differences in average effects for studies that had at least one piece of confirmatory information missing. For science, studies without missing information had slightly larger average effects (g with missing = 0.75 vs. g without missing = 0.86). For motivation, the results were identical. For math, however, we found that studies with at least some missing information had effects nearly three times as large (g with missing = 1.09 vs. g without missing = 0.38). We urge some caution when interpreting the math outcome results, as the average effect may be smaller in practice than what we found from the unconditional results. Overall, and for our science analyses in particular, however, our results are robust to analytic decisions, and we are confident in the main results presented.
Discussion
The overall findings revealed that the 5E and related models are effective for improving STEM education, in both science and math. Although the average instructional model lasted for 7.7 weeks, our results indicated that the return on this investment of time could be substantial: the probability of a positive impact is as high as 93%. Readers from the U.S. concerned about the mix of results from across the world might also take comfort in the fact that the average effect from U.S.-based studies was substantial (g = 0.46), translating to a percentile rank increase of 18 points on the WWC Improvement Index. Based on these results, we posit that future implementations of the 5E model are likely to have positive impacts on students’ science understanding.
We must urge readers to use caution, however, when considering variants of the 5E model. Although the six evaluations of the 7E model are certainly sufficient to draw some conclusions, we are concerned by the fact that none of the evaluations took place in the U.S., and only one evaluation took place outside of Turkey. Studies conducted in Turkey tended to measure specific and narrow science outcomes, include fewer female students, and use smaller individual and clustered samples. Any of these aspects could have resulted in higher average effects, especially in light of our overall finding that evaluations measuring broad general science achievement tended to report smaller effects relative to other, more specific outcome constructs. Of course, the 7E instructional model could have produced such large effects. We are simply less confident in suggesting their use without further and more varied research, and we would not necessarily expect such large effects as we have found to generalize to a larger set of studies.
Similar caution, for different reasons, is warranted when considering the use of the 3E instructional model. Our results indicated that the 3E instructional model produced smaller effects, on average, compared to the 5E and 7E models. Although the follow-up meta-regression analyses no longer indicated a statistically significant difference, the coefficient remained notably smaller (b = −0.16, SE = 0.24). As alluded to above, we hypothesize that this is likely due to the 3E model’s lack of overt attention to eliciting students’ preconceptions and encouraging metacognition, both of which are teaching strategies with substantial empirical support (e.g., National Research Council [NRC], 2000).
Implications for Practice and Programmatic Decisions
Given that the overall meta-analytic results demonstrated a positive significant effect on all outcomes, educators can consider the 5E and related models as effective instructional models for improving science outcomes. Further, there is evidence that the 5E and 7E models may consistently produce larger positive effects than that of 3E models. These two findings have implications for programmatic decisions in a time when there is rapid development of new instructional materials for science, based on the 5E model or other instructional models.
One such new curriculum development initiative that does not specifically use the 5E model is OpenSciEd (2023), an organization of expert science educators and curriculum developers who are generating science curriculum materials aligned with the Next Generation Science Standards (NGSS Lead States, 2013). These materials are being developed with an instructional model that features student-centered formulation of questions, investigations, and problem-solving and is driven by anchoring phenomena that are intended to engage, puzzle, motivate, and raise questions based on students’ prior knowledge (OpenSciEd, 2023). As additional OpenSciEd or similar materials are developed, it is imperative that subsequent research around these materials include efficacy studies that not only examine the impact of the instructional model when implemented strictly as intended, but also the effectiveness of variations in the number or sequence of stages, or implementation variations. Then, an important longer-range goal would be to conduct meta-analyses of the effects observed in these efficacy studies.
Limitations
Several limitations of this systematic review and meta-analysis are worth noting. First, we limited the eligibility of studies to those using a random assignment design. We did so out of practical concerns (i.e., resource burden) and validity concerns (i.e., quasi-experimental designs studies in this field tended to be of lower quality and suffer from selection bias). The exclusion of quasi-experimental design studies limits the corpus of studies and therefore decreases our statistical power and our ability to generalize. We believe that the corpus used for this synthesis, however, is of high quality, and the results are conservative but trustworthy.
Second, as is frequently lamented by meta-analysts, standard reporting practices in education research often do not provide a description of the comparison condition beyond “business-as-usual.” In almost all studies in this synthesis, study authors failed to report information about the comparison condition; only five studies, or 8% of our sample, provided any descriptive information about the comparison condition. To provide some context for what the counterfactual to 5E instruction may look like, however, we relay the most comprehensive reporting of the comparison condition. Sadi and Çakiroğlu (2012) documented the following about their comparison condition classrooms: In the control group, expository instruction was given. Teacher-centered instruction was applied and students were generally taught with a note taking strategy. Teachers gave important concepts in an organized structure and wrote notes on the chalkboard about the definition of major circulatory system concepts as stated in the biology textbook. Students mainly listened to their teacher and took notes from the chalkboard throughout the lesson. The teacher generally focused only on the human circulatory system and did not make any associations with other related issues such as the respiratory, digestive, excretory etc. systems. The teacher used some pictures, diagrams and maps about the structure of the heart, blood vessels and pulmonary and systematic circulation. Students followed those visual aids. After completing the topic, the teacher gave students adequate time to ask questions about the subject. Students discussed the concepts under the teacher’s guidance and the teacher re-explained any subject which wasn’t understood. The teacher handed out worksheets for the rest of the lesson. (p. 2004)
We urge primary researchers in this and other fields to make it standard practice to report this level of detail about their comparison conditions. For our current study, this explanation likely approximates a typical “business-as-usual” condition, although we are limited by the lack of information in most studies.
Third, many of the studies were missing fidelity of implementation information, so much so that we were not able to consider it as a substantive moderator. The 5E instructional model is one that relies on teachers’ willingness to implement it with fidelity; so without this information, it is difficult to understand if some of the variation seen in effectiveness is due to lack of fidelity.
Fourth, the confounding of study characteristics, particularly the country of the evaluation, the percentage of male or female students in the sample, and the breadth of the measured science constructs, call into question how much we can truly say that one variable is causing an increase or decrease in the instructional models’ effectiveness. All three of these variables, and likely several others, influence the effectiveness of the model in related ways. Future research with additional evaluations will be required, preferably with built-in variation around these mechanisms, before a definitive answer can be reached.
Conclusions
This systematic review and meta-analysis demonstrated the effectiveness of instructional models based on the 5E model and its variants, when compared with largely didactic instruction. Although this study showed evidence that 5E/7E models produced larger effects than 3E models, possibly due to the 5E/7Es’ overt attention to eliciting prior conceptions and encouraging student metacognition, the effectiveness of even 3E models confirms important features of the explore, explain, and elaborate stages. That is, our findings confirm the importance of students (a) actively exploring scientific phenomena, prior to being introduced to scientific explanations, (b) developing their own explorations based on evidence, and (c) applying their evolving explanations to new and novel situations. The findings of this study provide support for the adoption of new or existing 5E-based instructional materials.
Supplemental Material
sj-docx-1-ero-10.1177_23328584241269866 – Supplemental material for Effects of the 5E Instructional Model: A Systematic Review and Meta-Analysis
Supplemental material, sj-docx-1-ero-10.1177_23328584241269866 for Effects of the 5E Instructional Model: A Systematic Review and Meta-Analysis by Joshua R. Polanin, Megan Austin, Joseph A. Taylor, Rebecca Rose Steingut, Melissa A. Rodgers and Ryan Williams in AERA Open
Footnotes
Acknowledgements
We thank Crystal Aguilera, Katelyn Caton, Danielle Ferguson, Oluchi Ozuzu, Christen Park, and Wen Zhuang for their research assistance. We also thank Roger Bybee, Janet Carlson, and Arthur Eisenkraft for their support throughout the synthesis process.
Declaration of Conflicting Interests
The author(s) declared the following potential conflicts of interest with respect to the research, authorship, and/or publication of this article: Dr. Taylor was previously employed by BSCS and authored several articles included in the sample. He was not involved in the coding of these papers and did not participate directly in the analysis of the results, serving as an advisor to the process instead.
Funding
The author(s) disclosed receipt of the following financial support for the research, authorship, and/or publication of this article: This study was funded by the National Science Foundation (Award 2000672).
Notes
Authors
JOSHUA R. POLANIN is a principal researcher at the American Institutes for Research, 1400 Crystal Drive, 10th Floor, Arlington, VA 22202;
MEGAN AUSTIN is a principal researcher at the American Institutes for Research;
JOSEPH A. TAYLOR is a principal researcher at the American Institutes for Research and an associate professor at the University of Colorado, Colorado Springs;
REBECCA ROSE STEINGUT is a researcher working in the Education Systems and Policy, Human Services Division at the American Institutes for Research;
MELISSA A. RODGERS is a researcher at the American Institutes for Research;
RYAN WILLIAMS is a principal researcher at the American Institutes for Research with expertise in causal inference methods and meta-analysis;
References
Supplementary Material
Please find the following supplemental material available below.
For Open Access articles published under a Creative Commons License, all supplemental material carries the same license as the article it is associated with.
For non-Open Access articles published, all supplemental material carries a non-exclusive license, and permission requests for re-use of supplemental material or any part of supplemental material shall be sent directly to the copyright owner as specified in the copyright notice associated with the article.