
Abstract
This study examines the impact of an online math learning program on third through fifth grade math achievement in Louisiana. Employing Zearn Math usage metrics and administrative data from the Louisiana Department of Education, the results indicate that grade levels that programmatically used Zearn Math scored, on average, about .03 standard deviation units higher on Louisiana’s statewide math assessment. A placebo test using English-language arts scores and several robustness checks suggests that this may be an underestimate of the true effect. These findings come at a crucial time because pandemic-related school closures have led to a 20-fold increase in public school spending on Zearn-related materials between July 2019 and July 2021, and its presence continues to expand across the nation.
Curriculum choice has long been touted as a low-cost, quick, and easy way to raise student achievement and to alleviate income-based achievement gaps (Boser et al., 2015). Some researchers have even argued that a substantial share of the gap in math performance between economically advantaged and disadvantaged students is related to curriculum inequalities (Schmidt et al., 2015). As such, states such as California, Louisiana, Tennessee, and others have made it part of their primary academic strategies to provide teachers with high-quality instructional materials. Many of these states have allocated immense resources to vet instructional materials through rigorous review processes to support administrators in their selections. However, these reviews and rankings are often based primarily on alignment with the state’s content standards rather than on instructional quality or efficacy in improving student outcomes. Moreover, research on curriculum adoption processes indicates that administrators rarely consider external evaluation sources when making their selections (Polikoff et al., 2020). This could be due, in part, to the fact that rigorous efficacy studies on specific curricular materials are scarce (Koedel et al., 2017), making it challenging for administrators to make holistic decisions based on both alignment and effectiveness.
Research pertaining to technology-based curricula is even more limited despite a drastic shift in the curriculum market toward digital resources (Otten et al., 2019). Nearly half of the 12 elementary math curricula that have been reviewed by EdReports now have a comprehensive digital offering, including enVision Math, Eureka Math, HMH Into Math, i-Ready, and Zearn. Of these five, the What Works Clearinghouse—a repository of education research—only lists efficacy studies for three, and none of those studies were conducted recently enough to reflect the relatively newly developed digital formats of the curricula. Instead, the limited studies that do exist on these programs tend to be developer-commissioned studies, which may suffer from publication bias or lack external validity (Wolf et al., 2020).
This study aims to alleviate this gap in the literature by independently evaluating one such technology-based elementary math curriculum, Zearn Math. Despite its recognition on several states’ lists of high-quality instructional materials, Zearn Math has not yet been subjected to a rigorous test of its impact on student achievement. This work also contributes to the larger body of literature on blended learning—a pedagogic approach that combines teacher instruction with digital learning—which suggests that blended learning holds potential to improve student outcomes through greater personalized learning and engagement (Means et al., 2010).
Background
Although the COVID-19 pandemic undoubtedly has ignited discourse around hybrid and online learning, blended learning has been evolving as a subject of educational innovation for decades. Advocates of integrated digital learning argue that it allows teachers to personalize instruction to meet the diverse needs of their students (Tucker, 2012), increases student engagement, and modernizes the traditional classroom instructional model (Christensen et al., 2013). In elementary schools, the rotational model is the most prevalently applied form of blended learning, wherein students cycle between different learning stations, allowing for varied instructional methods and activities, including online learning tasks (Horn & Staker, 2014). Studies have documented that the rotational model supports the benefits associated with smaller group instruction—a cornerstone of the small-class-size literature—while being feasible to implement without significant changes to existing school resources or processes (Christensen et al., 2013).
Reflecting the evidence on blended learning for young students, Zearn Math combines curricular materials for in-person instruction with corresponding digital lessons based on the concrete/pictorial/abstract pedagogic strategy to support teachers in a rotational model. The recommended implementation begins with a teacher-led whole-class fluency or word-problem activity, after which students rotate between two stations: working independently on Zearn Math digital lessons or working with the teacher in a smaller group setting (Zearn, n.d.). Digital lessons are comprised of fluency practice, concept development, and application work that students complete at their own pace on a personal device. Software-based prompts remind students to use corresponding paper student notes throughout the lesson and to complete the paper exit ticket at the end to support paper-and-pencil transfer. Students in the teacher-led smaller group work with concrete manipulatives and practice explaining their reasoning. Importantly, the core content for each lesson is delivered during the digital component of the suggested math block.
This is the first well-powered, causal evaluation of Zearn Math. The limited prior research on the program was conducted internally, employed noncausal methods, or examined different outcomes. In the most comprehensive external study to date, Morrison et al. (2019) employed a mixed-methods evaluation design, gathering data from 15 elementary schools that implemented Zearn Math in a large, urban school district. Qualitatively, the authors found that administrators, students, and teachers had very positive perceptions of Zearn Math. However, differences in achievement gains between the treated and comparison samples were found to be not significant after controlling for several student-level variables. The authors attribute this in part to barriers to implementation, particularly a lack of support from the administration, insufficient technology, and shortened math blocks resulting in students spending less than half the recommended time on the program.
This study focuses on the impact of Zearn Math in Louisiana, where various contextual factors made it a prime setting for the program to proliferate across the state. For one, portions of Zearn Math are derivative of the Eureka Math or EngageNY (ENY) curriculum—an open-source curriculum written to align with the Common Core State Standards—and the K–5 lessons follow the same scope and sequence (Zearn, 2021). According to a 2016–2017 survey of a sample of schools in six states conducted by Blazar et al. (2019), nearly 15% of schools reported using ENY, which constituted the second highest market share of mathematics textbooks after enVision. However, in Louisiana, nearly 60% of schools reported using ENY, four times as many as the next most prevalent curriculum in the state, likely due to the incentives schools are given to use a highly rated curriculum. Despite ENY’s popularity, it is also the curriculum most frequently described as being too hard and not user friendly (Blazar et al., 2019). Eighty-eight percent of teachers from the schools using ENY reported that they supplement or substitute parts of the curriculum with other resources. It is possible that Zearn Math’s rapid growth can be attributed in part to ENY’s preexisting reach in the elementary math curriculum market and its potential to alleviate ENY’s implementation challenges. In Louisiana, this was likely further amplified by the Louisiana Department of Education (LDOE) deeming Zearn Math a Tier 1 curriculum in 2016 (LDOE, 2016). Administrative buy-in, perfect alignment with the existing curriculum, and the pandemic-related push toward digital resources may have cleared the way for the program’s expansion across the state. In the 2018–2019 school year, nearly 80% of LDOE elementary schools had some degree of activity on the online platform, of which more than one-fourth consistently used it throughout the school year.
Although Louisiana has a particularly high concentration of schools that programmatically use Zearn Math, its saliency is not limited to the state. According to a nationally representative survey, more than one-tenth of elementary school educators regularly implemented Zearn Math in the 2019–2020 school year (Doan et al., 2020). Recent trends in spending suggest that the use of Zearn Math has increased markedly since then. According to purchase-order data from GovSpend (2022), Louisiana public schools spent twice as much on Zearn-related materials in July 2021 than in July 2019. Over the same time period, the growth in sales across the United States was nearly 20-fold. Given the immense national investment in the program, it is imperative that we understand its impact on student achievement.
Present Study
In this quasi-experimental study, I employ proprietary data to measure Zearn Math’s causal impact on third, fourth, and fifth grade students’ scores on the Louisiana state math assessment, the Louisiana Educational Assessment Program (LEAP) 2025. I find evidence that programmatic usage of Zearn Math increased students’ scores by .03 standard deviation units, on average. I probe these results by performing a placebo test with LEAP 2025 English-language arts (ELA) outcomes and find marginally significant negative impacts of Zearn Math on ELA scores, suggesting that the effects on math achievement could be understated. Several checks, including a treatment sensitivity analysis and using a treatment heterogeneity–robust estimator, further indicate that this is a conservative estimate of the true effect. These results also align with the singular prior external efficacy study on Zearn Math, which showed a similar, although not statistically significant, effect size of .024 (Morrison et al., 2019).
Using conventional benchmarks, the effect of Zearn Math found here would be considered a small effect (Cohen, 1988). However, modern literature on interpreting effect sizes notes the importance of taking into account the outcome measure, scale of the implementation, and other contextual factors (Hill et al., 2008; Kraft, 2020). Specifically, when using widespread standardized tests such as the LEAP 2025 ELA assessment in Louisiana, observed effect sizes tend to be substantially smaller than those from tests tailored by researchers, and studies involving more than 2,000 students usually report effects several times smaller than those with fewer than 100 students (Kraft, 2020). Notably, Kraft (2020) notes a .03 median effect size across large-scale causal studies of pre-K–12 education interventions with standardized achievement outcomes, comparable to the findings here.
Still, the estimated effect is at the lower end of the range of estimates documented in similar curriculum-based studies, which have been between .05 and .17 standard deviations (Koedel et al., 2017). As described earlier, this could be a symptom of the Louisiana context. For one, there is a stark congruence between Zearn Math and the most prevalent curricula being implemented across Louisiana as well as a high possibility that Zearn Math is being used supplementarily by schools that may not have adopted the program for core instruction. Furthermore, 95% of Louisiana schools use just one of four top-rated math curricula, all of which are aligned with the same standards (Blazar et al., 2019). These unique factors could result in a weak treatment–control contrast, leading to relatively modest estimates of the effect of programmatic usage. I recommend that future research further explore the mechanisms driving these effects as well as potential heterogeneous impacts based on student and school characteristics that may be relevant to decision makers facing a variety of implementation contexts.
The rest of this paper is organized as follows. The next section describes my data sources and how I designate a grade level as having used Zearn Math programmatically or not. I then present the empirical models I use to estimate the impact of Zearn Math on math scores followed by the resulting estimates. In the four subsequent sections, I probe my main findings in several ways. First, I present robustness checks assessing the validity of my primary estimation method. Next, I perform a placebo test using ELA scores as the outcome. Following this, I describe the sensitivity of my findings to alternative definitions of treatment, and then I redefine treatment to estimate the marginal impact of each additional day of using Zearn Math. The final section concludes with suggestions for future research.
Data
Sources
Data for this project were obtained from the LDOE and Zearn. The LDOE provided average third, fourth, and fifth grade LEAP 2025 math and ELA-scaled scores for each school grade for the school years 2014–2015 through 2018–2019. LEAP 2025 refers to the state’s set of standardized assessments for students in grades 3–12. They are designed to measure students’ knowledge and skills in ELA, mathematics, science, and social studies and are aligned with the state’s academic standards, the Louisiana Student Standards. According to Zearn, the Zearn Math curricular materials are fully aligned with the Louisiana Student Standards for Mathematics (Zearn, 2019) and thus the corresponding assessments. One limitation may be that the available achievement data from the LDOE are grade-level aggregates. However, because curricular adoption often occurs at the school or district level, we may not expect variation at a more granular level. In fact, Table 1 shows that most schools that programmatically used Zearn Math, used it in multiple grades. Still, it is possible that there was implementation variation at the classroom or student level that is not reflected in this analysis.
Descriptive Statistics

Notes. Panel A includes all LDOE schools with at least one valid third through fifth grade mean scaled score and demographic data. Panel B is the subset of schools that used Zearn Math programmatically (at least 50% of students using for 50% of required school days) in the given year and does not account for students in those grades who may have used Zearn Math historically. School demographic characteristics are enrollment-weighted averages of school-year data. Standardized test scores are weighted by the number of students tested. They are not equal to zero in panel A because they are standardized using the student-level mean and standard deviations by year and grade, and grade levels do not necessarily have an equal number of students testing. Baseline test scores are the average third and fourth grade scores from the prior year for the fourth and fifth grade cohorts in each year, respectively. End-of-year scores are the average for third through fifth graders in the given year.
I standardize the LEAP 2025 math and ELA scaled scores by grade and year using student-level means and standard deviations for each grade from the LEAP 2025 technical reports to account for potential changes in the assessment over time and differences in the distribution of scores by grade level. By using the student-level means and standard deviations to standardize scores, the resulting estimated effect sizes are in student-level standard deviation units and comparable to commonly reported effect sizes in the literature. For the grades and years in which the state reported only the means and standard deviations separately for the computer- and paper-based administrations of the test, I use the statistics for the paper-based assessment, which reflect more than 95% of test takers. Finally, I obtained school-level demographic data and grade-level enrollment data from the state’s publicly available sources.
Zearn provided grade-level usage data, including the average number of students who were active on the online platform, the average number of digital lessons completed per student, and the average number of minutes, days, and weeks students logged on during the 2016–2017 through 2018–2019 school years. These are the first 3 years in which Zearn captured digital usage as well the first years in which Zearn Math was an approved curriculum in Louisiana.
Treatment Classification
To exclude cases of casual use (e.g., an individual teacher experimenting with the program for a few lessons), I define a treatment threshold for when a grade level is considered to have been using the program programmatically. Specifically, in the main results, I define programmatic usage as at least 50% of enrolled students in a school-grade-year using the digital component of Zearn Math for at least 50% of the number of state-required school days (i.e., 84 days). Importantly, I do not use the number of lessons completed in my metric for programmatic usage due to endogeneity with the outcome in that lesson completion and math scores are inherently both measures of math knowledge. For instance, even though time on the program and lesson completion are positively correlated among all the grades that programmatically used Zearn Math, those with higher baseline scores were more likely to complete more lessons but spent marginally less time using the program relative to those with lower baseline scores (see Figure 1).

Association between Zearn Math time and lesson completion by baseline math score.
Table 1 summarizes the complete analysis sample, which is comprised of the third through fifth grades in Louisiana public and charter schools from the school years 2014–2015 through 2018–2019 with scores on the LEAP 2025 math assessment. Panel A includes all the LDOE schools in the dataset. Panel B includes the subset of school grades that used Zearn Math programmatically in each year. Despite the lack of random assignment to the program, the schools that used Zearn Math are similar to the state overall across the available characteristics. A more formal test for these differences is presented in Table 2. Column (3) reports the 2015–2016 differences in mean characteristics across the school grades that never programmatically implemented Zearn Math and those that did in at least 1 year between 2016–2017 and 2018–2019. There are small differences in characteristics between the two groups, but even in cases where those differences are statistically significant, they are substantively small. Overall, the descriptive statistics in Table 1 and the balance tests in Table 2 are not suggestive of an observable distinction between the grades that did and did not use Zearn Math programmatically, especially given the equivalence in average baseline achievement.
Pre-implementation Comparison Between Zearn Math and Non–Zearn Math Grades

Notes. Statistical significance is indicated as *p < .10; **p < .05; ***p < .01 using school clustered standard errors. All estimates are weighted by enrollment. Columns (1) and (2) show the 2015–2016 (pre-implementation) characteristics for grade levels that never programmatically used Zearn Math in any year between 2016–2017 and 2018–2019 and used in at least 1 year, respectively.
Table 3 outlines the degree of usage among treated grades. As reported in column (4), on average, 97% of the enrolled students in each grade were active on the online platform across all years. Further, students were active for ~80% of the school year (based on a 35- to 40-week year) and completed an average of 82 digital lessons (corresponding to about two-thirds of Zearn Math’s online curriculum in each grade). In contrast, grades classified as not having programmatically used Zearn Math completed an average of five digital lessons. This suggests a material distinction between the way in which these two groups were interacting with the program. Table 4 highlights this contrast based on several usage metrics. Columns (1) and (2) show the Zearn Math mean usage metrics for the grades classified as being treated and comparison grades, respectively. Column (3) shows the same metrics for comparison grades excluding those that had no presence at all on the online platform. Importantly, column (3) suggests that, on average, even those school-grade-years that were using the program but did not meet the treatment threshold do not appear to have been using Zearn Math as their core curriculum. These descriptive statistics are encouraging indications that the treatment classification is differentiating grades that used Zearn Math programmatically versus not. Later, I provide additional details on the treatment contrast and consider the robustness of my main findings to alternative definitions of programmatic usage.
Average Zearn Math Programmatic Usage
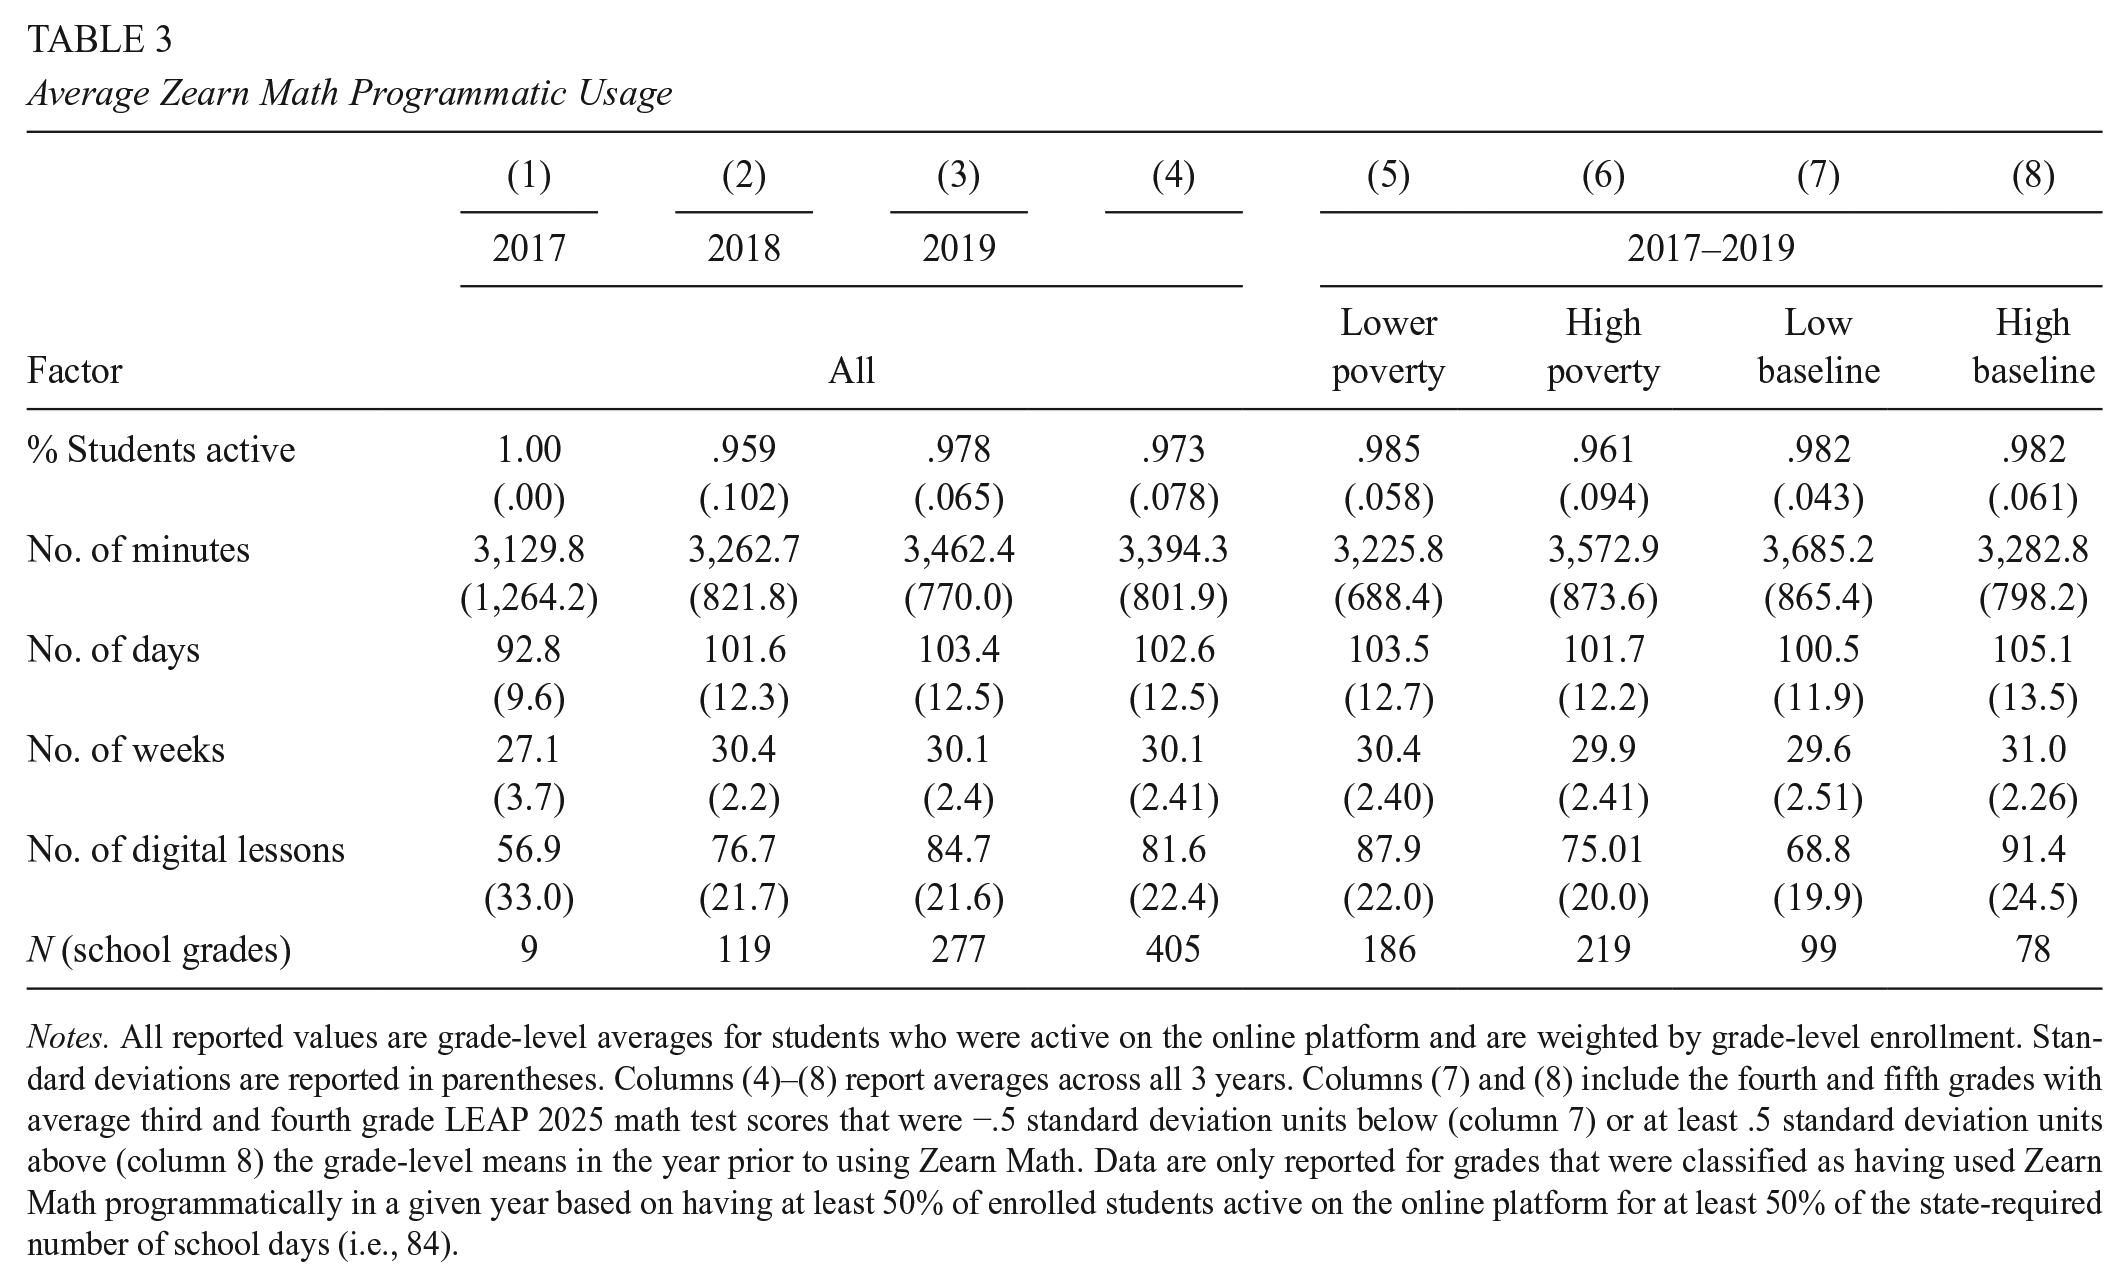
Notes. All reported values are grade-level averages for students who were active on the online platform and are weighted by grade-level enrollment. Standard deviations are reported in parentheses. Columns (4)–(8) report averages across all 3 years. Columns (7) and (8) include the fourth and fifth grades with average third and fourth grade LEAP 2025 math test scores that were −.5 standard deviation units below (column 7) or at least .5 standard deviation units above (column 8) the grade-level means in the year prior to using Zearn Math. Data are only reported for grades that were classified as having used Zearn Math programmatically in a given year based on having at least 50% of enrolled students active on the online platform for at least 50% of the state-required number of school days (i.e., 84).
Average Zearn Math Usage Among Treated and Comparison Grades

Notes. All averages are weighted by enrollment. Column (3) includes all school-grade-years that did not meet the treatment threshold of having at least 50% of students active on Zearn Math’s online platform for at least 50% of the school year but had at least one student use the program for a nonzero amount of time.
While the metrics in Table 3 are suggestive of programmatic usage among the treated grades, there was still variation in the time students spent using the online program. Figure 2 is the distribution of average minutes per week students in each grade spent on the digital component of Zearn Math and shows a range of around 60–190minutes per week. Columns (5)–(8) of Table 3 report that grades in high-poverty schools or with lower average baseline math scores spent slightly more time on Zearn Math than grades in lower-poverty schools or schools with higher average baseline math scores. It is worth noting that grades in lower-poverty schools or schools with higher average baseline scores completed more lessons, on average. Figure 1 further highlights this positive relationship between lesson completion and baseline scores and shows that, overall, grades that spent more time on Zearn Math completed more of the online content.

Average minutes per week on Zearn Math per active student.
Empirical Approach
The main challenge in estimating the effect of the program on student achievement is that schools that adopted Zearn Math may differ in both observable and unobservable ways from those that did not. For example, the schools that were first to adopt Zearn Math may have had teachers who were more focused on curriculum quality or more motivated to try a new curriculum. A simple comparison of outcomes between grades that used Zearn Math and those that did not could yield biased estimates of the impact because of unobserved factors such as teacher motivation that may be associated with both curricular adoption and achievement. To address these potential sources of omitted variable bias, I fit the following models, which include controls for school by grade and grade by year:


The outcome of interest, Score, represents the mean standardized math score for school s and grade g in year t. In model (1), Zearn is a dichotomous variable indicating whether grade g in school s in year t used Zearn Math. In models (2) and (3), I account for the fact that students in some grades may have programmatically used Zearn Math in previous years and grades. ZearnYears represents the number of years in which the cohort of students in grade g in school s would have used Zearn Math as of year t, corresponding to column (4) in Table 5. For example, if students in school s first used Zearn Math as fourth graders in 2018 and then as fifth graders in 2019, the total number of years the 2019 fifth grade cohort would be considered as having been treated for 2 years as of 2019. Similarly, if students in school s used Zearn Math as third graders in 2018 but not as fourth graders in 2019, the total number of years the 2019 fourth grade cohort would have been treated is 1 year as of 2019. This specification no longer assumes that any gains from Zearn Math would disappear if it stopped being implemented or if a cohort of students fell out of the programmatic usage classification in a later year. It also prevents cohorts of students who were previously exposed to Zearn Math from being included in the comparison group. In model (3), I further allow for each additional year of Zearn Math exposure to have a nonlinear association with math scores by creating indicator variables for the number of years grade g in school s would have used Zearn Math as of year t.
Cohort Exposure of Zearn Math

Notes. Column (5) is the number of school-grade-years in which students would have used Zearn Math in the years indicated by columns (1)–(3) and the number of years indicated by column (4). School-grade-years in each row are not mutually exclusive cohorts of students. For example, a cohort of students who used Zearn Math in 2017 for the first time as third graders and then did not use it in 2018 and 2019 as fourth and fifth graders would be included in rows A, B, and C. In row A, the cohort would be included as the 2017 third grade cohort using only in year t (2017); in row B, the cohort would be included as the 2018 fourth grade cohort having only used in year t – 1 (i.e., 2017), and so forth. There was one school-grade-year that used Zearn Math for 3 years (i.e., in third, fourth, and fifth grades) that is dropped from the analysis to avoid drawing inferences from a single observation. Findings are not sensitive to the inclusion of this observation.
All models include school-by-grade fixed effects µsg, so identification of the estimate of the impact of Zearn Math is being driven by within-school-grade differences in usage. In other words, relative student achievement at a given school and grade is measured against the relative student achievement in the same school and grade in years when it did or did not use Zearn Math (model 1) or used Zearn Math for a different number of years (models 2 and 3). Table 5 highlights this variation in usage that is being leveraged for identification. For example, the treated units included in model (1) correspond to the 401 school grades in rows A and D, which programmatically used Zearn Math in 1 or 2 years and did not use Zearn Math in other years. Thus, the estimated treatment effect is based on the comparison of outcomes in the year(s) that the school grade did use the program against the year(s) that it did not. These fixed effects eliminate sources of omitted variable bias originating from differences across school grades that are constant over time and may be associated with curricular decisions. For example, they would account for a given school having particularly effective third grade teachers or if the neighborhoods assigned to a school were consistently more or less economically disadvantaged.
I also include grade-by-year fixed effects
This type of estimation method, which measures the effect of a treatment (here, programmatic use of Zearn Math) on an outcome (math achievement) and includes time and unit fixed effects, produces what is technically known as a two-way fixed-effect (TWFE) estimator. Recent literature has shown that the TWFE estimator corresponds to a weighted sum of the average treatment effects in each unit and time. This becomes problematic if there are heterogeneous treatment effects across units or over time (Borusyak et al., 2024; de Chaisemartin & D’Haultfaœuille, 2020), which could result in negative weights and a biased estimate. In a later section I show that the diagnostic tools that researchers have recently developed to identify this source of bias suggest that it is not driving my main findings. I also offer a robustness check using the estimator proposed by de Chaisematin and D’Haultfœuille (2022a), which takes into account heterogeneous treatment effects and is not subject to the concern of negative weights. In short, the results are qualitatively similar and even more precisely estimated.
Main Findings
Table 6 shows the main results from fitting models (1)–(3). The estimate on Zearn in column (1) implies that programmatic use of Zearn Math led to an average increase in math of .034 student-level standard deviation units relative to years in which that school grade did not use Zearn Math programmatically. This estimate, however, does not account for the fact that some students would have used Zearn Math in a previous grade level in a previous year at their school. If the effect of using Zearn Math is positive and compounding or persistent in later years, then this may be an under- or overestimate of using Zearn Math for 1 year. For example, the estimate may be too high if the students who used Zearn Math in year t also used Zearn Math in a previous grade level in a previous year such that the 1-year estimate is in fact a multiple-year effect of using the program. The estimate also could be too low if the students who used Zearn Math in year t are being compared with students who did not use the program in year t but did use it in a previous grade level in a previous year such that the comparison cohort scores are inflated by historical use of the program.
Impact Estimates of Zearn Math on LEAP 2025 Math Scores

Notes. School clustered standard errors are in parentheses (*p < .10; **p < .05; ***p < 0.01). All estimates are calculated with school-grade and grade-year fixed effects weighted by the number of students tested and include controls for school-year student composition by gender, race/ethnicity, LEP, high poverty, and enrollment. Column (4) also includes a control for standardized LEAP 2025 ELA scores. About 10% of the school-grade-year observations have fewer than 5 years of data. Limiting the sample to a balanced panel does not change the findings.
Columns (2) and (3) aim to adjust for this potential cohort exposure by measuring the impact of each year that students in a particular school grade used Zearn Math. In column (2), the estimate on ZearnYears implies that each year that students would have used Zearn Math programmatically led to a .027 standard deviation increase in math scores, on average. For example, a fifth grade cohort that used Zearn Math for the first time as fourth graders and then again as fifth graders is estimated to have math scores that are an average of about .06 standard deviations higher relative to fifth grade cohorts in other years at the school who had never used Zearn Math programmatically. It should be mentioned that this type of cohort-level analysis, while correcting for students’ past exposure to Zearn Math, assumes by design that students are not moving schools. Previous research shows that Louisiana’s nonstructural student mobility rate in K–8 is around 15% (Maroulis et al., 2016), which may be biasing the estimated impact of Zearn Math toward zero.
Column (3) disaggregates the effect of having used Zearn Math for 1 versus 2 years. The estimate on Years1 indicates that having used Zearn Math for 1 of the past 3 years improved math scores by ~.029 standard deviation units, on average. Having used the program for 2 of the past 3 years improved math scores by an average of ~.048 standard deviation units, although this estimate is not statistically significant at conventional levels. Although it is possible that the impact of Zearn Math diminishes after the first year, I also cannot reject that the effect of years of use is linear.
Table 7 considers potential heterogeneity in the impact of using Zearn Math. Column (1) presents results from fitting model (1) with an additional interaction term, Zearn × HighPoverty, that allows me to estimate whether there was a differential impact in low- versus high-poverty schools. Following the convention laid out by the National School Lunch Program (National Center for Education Statistics, 2022), a school is categorized as high poverty if it had 75% or more students classified as economically disadvantaged. The negative estimate on the interaction term would indicate that the program had a bigger impact in lower-poverty schools, but again, the data are not sufficient to conclude that there was a differential impact based on school-level poverty. Column (2) similarly considers variation in the estimated impact by grade level by fitting model (1) with an interaction term, Zearn × Grade. Although the individual parameters are estimated less precisely than the average pooled effect for all grades, they are qualitatively similar, ranging from .20 to .52 standard deviations, and are not suggestive of a differential impact by grade level controlling for school.
Heterogeneity Analysis
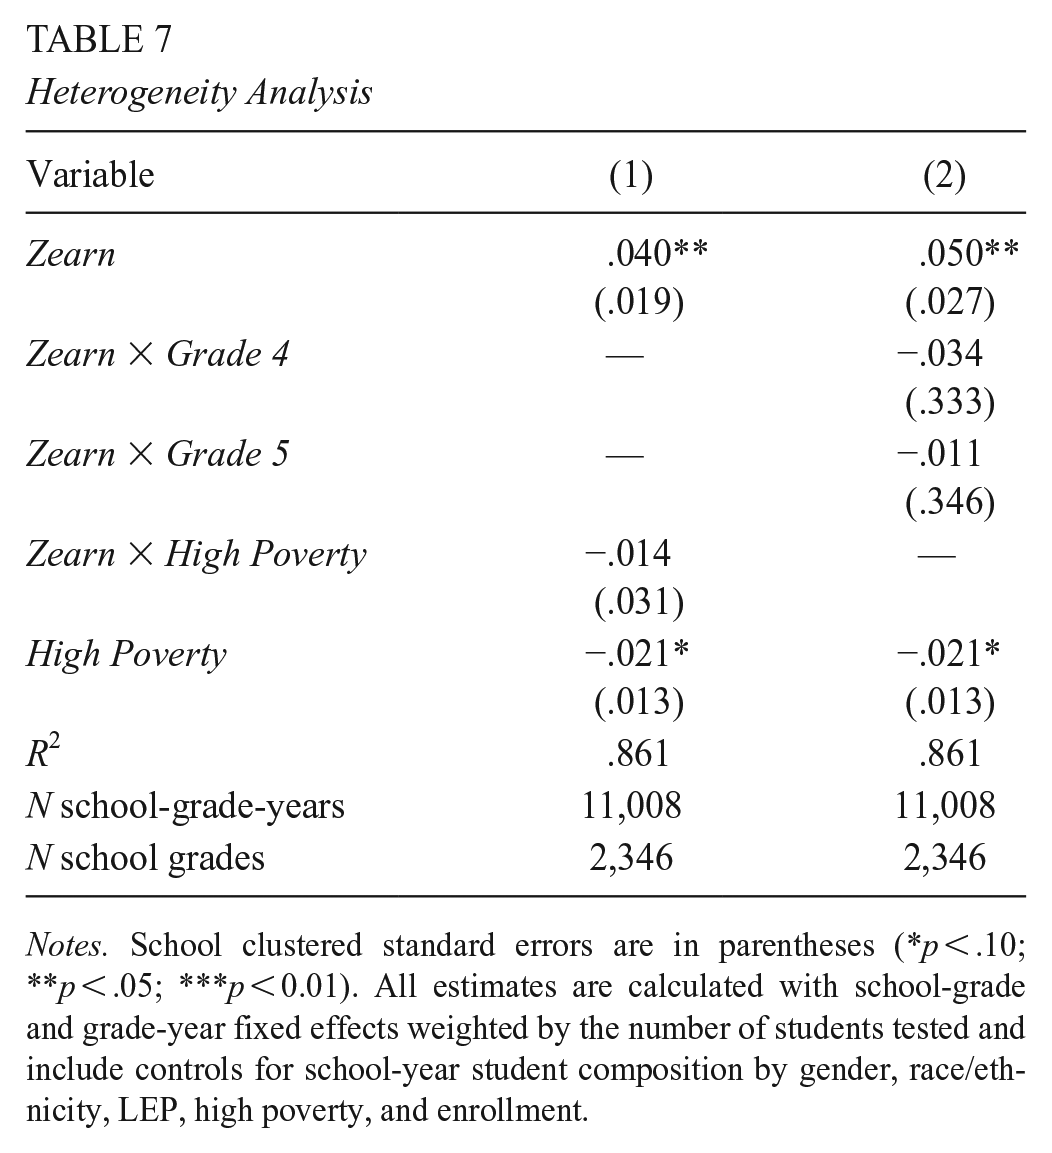
Notes. School clustered standard errors are in parentheses (*p < .10; **p < .05; ***p < 0.01). All estimates are calculated with school-grade and grade-year fixed effects weighted by the number of students tested and include controls for school-year student composition by gender, race/ethnicity, LEP, high poverty, and enrollment.
Taken together, the evidence suggests that using Zearn Math increased mean LEAP 2025 math scores in the year in which it was used. Further, there may be some additional gains from multiple years of usage, though these are more ambiguous, in part due to the small sample of school grades that used Zearn Math for multiple years relative to the estimated effect size.
Robustness
The design in this setting is particularly susceptible to the form of bias identified by the recent TWFE literature because grade levels were adopting Zearn Math in different years (de Chaisemartin & D’Haultfœuille, 2020; Goodman-Bacon, 2021). Moreover, models (2) and (3) account for cohort exposure to the program (i.e., if the students in a particular school-grade-year used Zearn Math in the prior grade and year), but by design, school grades can still switch in and out of treatment over time. For example, if fourth graders in school s programmatically used Zearn Math in 2018 but the new cohort of fourth graders in 2019 did not use it programmatically or did not use at all, fourth grade at school s would be considered treated in 2018 and untreated in 2019. Especially in more complicated designs such as this, the internal validity of standard TWFE estimator rests on two assumptions: parallel trends and that the treatment effect is constant between groups and over time (de Chaisemartin & D’Haultfœuille, 2022a).
The parallel trends assumption requires that, in the absence of Zearn Math, grades that did and did not use Zearn Math would have experienced the same trends in average math scores. Although this assumption cannot, by definition, be tested directly, comparing the pretreatment trends, as presented in Figure 3, can offer support that the parallel trends assumption is plausible. The figure shows the unconditional weighted average standardized math score over time by treatment groups, which align to when school grades adopted Zearn Math, separating out grades that switched in and out of treatment. The numbers in parentheses indicate the number of school grades in each group, and the more transparent lines correspond to smaller groups. Although I am limited by the short time frame of available data, the figure shows that the trends in outcome follow a very similar trajectory in the pretreatment years for the larger groups.

Average weighted standardized math score by treatment status.
Nevertheless, in an empirical setting such as this, where treatment groups differ considerably in size and were adopting the program at different points in time, there is the potential for the weights to be negative due to heterogeneous treatment effects, which can induce bias in the estimator (de Chaisemartin & D’Haultfœuille, 2020; Goodman-Bacon, 2021). To assuage concerns about a biased TWFE estimator, I follow the simple diagnostics presented by Jakiela (2021) to show that this source of bias is unlikely to be driving my main findings. As a robustness check, I present the estimator proposed by de Chaisemartin and D’Haultfœuille (2022a), which is robust to heterogeneous treatment effects and a nonstaggered design (in which groups can switch in and out of treatment).
Figure 4 plots the weights placed on school-grade-year-level observations in calculating the TWFE estimate. These weights are proportional to the residuals from a regression of the treatment indicator (Zearn) on the set of school-grade and grade-year fixed effects. Reassuringly, only two of the 401 treated school-grade-year observations (in blue) receive negative weight in the estimation of the treatment effect. Thus, it is unlikely that negatively weighted observations are driving the results. Still, even TWFE estimates that do not rely on negative weighting should be interpreted with caution if treatment effects are heterogeneous (Baker et al., 2022; Sun & Abraham, 2021). As outlined in Jakiela (2021), if the homogeneous treatment assumption holds, the residualized outcome should be a linear function of the residualized treatment, and the slope should not differ between the treated grades and the comparison grades. I test this assumption directly in Figure 5. The local polynomial regressions suggest that the relationships between the residualized outcome and the residualized treatment are not perfectly linear, particularly near the extremes. Further, the slopes are not the same for the treatment (in pink) and comparison (in blue) groups, which would suggest that the homogeneous treatment assumption may be violated.

Two-way fixed effects weights by treatment status.

Association between residualized outcome and residualized treatment.
Recently, researchers have developed a range of estimators to address negatively weighted observations or evidence of treatment effect heterogeneity. According to de Chaisemartin and D’Haultfœuille (2022b), when there is a binary, nonstaggered treatment, the heterogeneity-robust estimator proposed by de Chaisemartin and D’Haultfœuille (2022a) is the most applicable. In Figure 6, I present the results from the authors’ treatment estimator (at t = 0) along with placebo estimators (at t = −1 to t = −3). These placebo estimates test the parallel trends assumption by comparing the outcome trends of grades that switched from untreated to treated to nonswitchers before the switchers switch. The placebo estimates are all close to zero, providing further evidence that the parallel trends assumption is met. Moreover, the estimated treatment effect is .042—qualitatively similar to the corresponding TWFE estimate of .034 based on model (1)—and is even more precisely estimated. It is important to note that the de Chaisemartin and D’Haultfœuille estimate should be interpreted as the effect of a school grade programmatically using Zearn Math for the first time (rather than the average treatment effect of any switches from not using to using programmatically.) In sum, these tests provide reassurance that the parallel trends assumption holds and that any potential bias due to heterogeneous treatment effects is not materially affecting the main results.
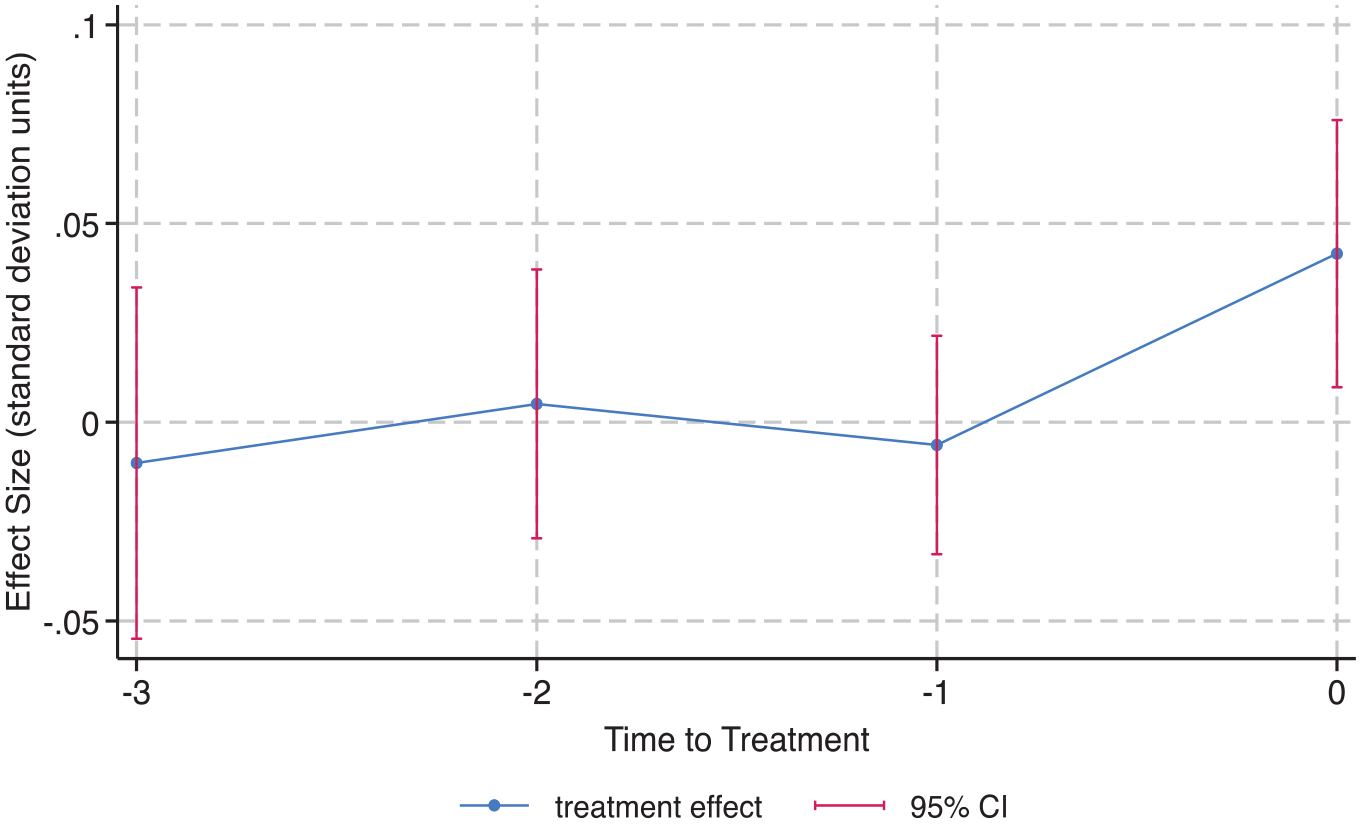
Robustness to heterogeneous treatment effects.
Placebo Test
To assess the possibility of selection bias in the estimate of the effect of Zearn Math on math scores, I check for an effect of Zearn Math on ELA outcomes. This type of placebo test is most informative if we assume that using Zearn Math would not impact ELA scores, whereas any unobservable characteristics differentiating schools that did and did not implement Zearn Math would be associated with overall achievement.
Table 8 shows the results from fitting models (1)–(3), but with the outcome, Score, being the mean standardized ELA score for school s and grade g in year t. Across all specifications, I find marginally significant negative impacts on ELA outcomes. For example, in column (2), the estimate on ZearnYears suggests that each year that students use Zearn Math is associated with a .022 standard deviation decline in ELA scores, on average. This is statistically similar, in terms of magnitude, to the analogous positive effect on math scores shown in column (2) of Table 6.
Placebo Tests using LEAP 2025 ELA Scores

Notes. School clustered standard errors are in parentheses (*p < .10; **p < .05; ***p < 0.01). All estimates are calculated with school-grade and grade-year fixed effects, weighted by the number of students tested, and include controls for school-year student composition by gender, race/ethnicity, LEP, high poverty, and enrollment.
One possible explanation is that there was a reallocation of resources toward math instruction and away from other subjects among schools that implemented Zearn Math. The limited information available provides mixed evidence on whether these schools were indeed spending more time on math and crowding out ELA. On the one hand, students in grade levels that programmatically used Zearn Math spent 113.minutes per week completing digital lessons (see Table 3). This is in line with the publisher’s 120.minutes per week recommendation. Assuming that teachers also were spending the recommended time on live instruction, this corresponds to about 5 hours of total math instruction per week. In 2015, a nationally representative sample of fourth grade teachers reported that they spent an average of 5–7.hours on math instruction per week (NAEP, 2015). While only suggestive, this provides some indication that teachers implementing Zearn Math were not spending a disproportionate amount of time teaching math. This is further supported by the fact that minutes spent on Zearn Math’s digital lessons is not predictive of ELA outcomes (see column 4 of Table 8).
On the other hand, although not statistically significant, the coefficient on minutes per day spent on Zearn Math is negative (−.0002). Multiplying this coefficient by the standard deviation of minutes for the sample (22.3) suggests that a one-standard-deviation increase in the average minutes per day spent on Zearn is associated with a .004 standard deviation unit decrease in ELA outcomes. Although this estimate is small and not statistically significant, it is also not negligible, especially considering the moderate magnitude of the main effect.
Alternatively, the ELA results may be indicative of negative selection bias. That is, there may be unobservable characteristics that differentiate schools that implemented Zearn Math from those that did not that are negatively associated with student achievement. In this case, the estimated effect of Zearn Math on math outcomes found here could be understated. Although the parallel trends analysis does not indicate that schools adopted Zearn Math in response to any ongoing decline in math scores, there may be some unobservable characteristic that is associated with both ELA scores and Zearn Math adoption that is biasing the main results. I first probe this by controlling for ELA scores, which effectively allows the dependent variable to be the difference between math and ELA scores, while letting the coefficient on ELA scores vary. Column (4) in Table 6 presents these results. The estimate on Zearn in column (4) parallels the estimate using model (1) (column 1) but with an additional control variable for standardized LEAP 2025 ELA scores. As shown, the estimate from this model of .051 is both bigger in magnitude and more precisely estimated than the main estimate. This result is in line with negative selection reflected in the ELA scores that could be driving an underestimation of the impact of Zearn Math on math achievement but also could be interpreted as evidence of a redistribution of inputs away from ELA instruction, as discussed earlier.
These findings, along with the results in Table 8, are also consistent with potential negative selection based on the difference in math and ELA scores. In Table 2, we can see that, before implementation, grades that later adopted Zearn Math had marginally higher math scores than their ELA scores relative to grades that did not adopt the program. This initial difference is not inherently problematic due to the fixed effects for schools in the analysis, which would account for any constant differences in achievement levels over time. However, there could be a concern if the schools that adopted Zearn Math were already experiencing a decline in ELA scores prior to the program’s adoption, indicating a changing pattern of achievement over time rather than a fixed difference. To explore this further, I examine the pre-implementation trends in ELA outcomes, as shown in Figure 7. A few trends are worth noting. First, there is much more year-to-year fluctuation in ELA scores across the state compared with math scores (see Figure 3). Second, the larger treatment groups display similar preintervention ELA score trends to grades that never adopted Zearn Math. For instance, the grades that implemented Zearn Math in 2018 and 2019 followed a similar score pattern from 2015 through 2017 to the grades that never adopted the program. However, these grades show a slight decline in ELA achievement compared with schools that never used the program in 2018 and 2019. This suggests a potential crowding out of ELA inputs that coincides with the implementation of Zearn Math. This trend could be attributed to an adjustment period for teachers new to the program, particularly in elementary schools where teachers are responsible for multiple subjects, or a shift in focus toward math at the school level.

Average weighted standardized ELA score by treatment status.
Treatment Sensitivity
The focus of this study is to examine the impact of Zearn Math when used programmatically, that is, when it is implemented as the comprehensive or core elementary mathematics curriculum for a grade rather than as a supplementary material along with another curriculum. Without administrative data on curriculum choice, I leverage the proportion of students in a grade who used Zearn Math and the number of days the program was used as indicators that Zearn Math was the primary source of math instruction for students. Specifically, I use 50% of both metrics as the threshold for a grade level to be considered “treated” or having used Zearn Math in a programmatic way.
As described previously, treated grades completed about two-thirds of the program’s digital curriculum, whereas the comparison grades completed around 5%–10% of the grade-level content (depending on whether grades that did not use the program at all are included in the calculation.) Still, there is significant variation in the degree of usage among the comparison grades. Figure 8 shows the school-grade-years that were categorized as having used Zearn Math in a programmatic way (pink squares) and those that were not (blue hollow circles) based on the two treatment classification metrics. We can see, particularly by the dots on the far right, that there are a number of grades at the margin of the treatment threshold. This is further exemplified in Figures 9 and 10, which show the treatment classifications of each school-grade-year along the distribution of each measure. Figure 9 again shows that the distribution for the average number of days students were active on the platform is continuous through the treatment cutoff of 84.days, so there are grades with significant usage that fall into the comparison group. Although Figure 10 shows a bimodal distribution for the percent of students who were active online, there are many grades in which all, or nearly all, of the students in the grade were using Zearn Math but fall into the comparison group because they were not it using throughout the school year.

Treatment classification of school-grade-year observations.

Average days active on Zearn Math by treatment status.
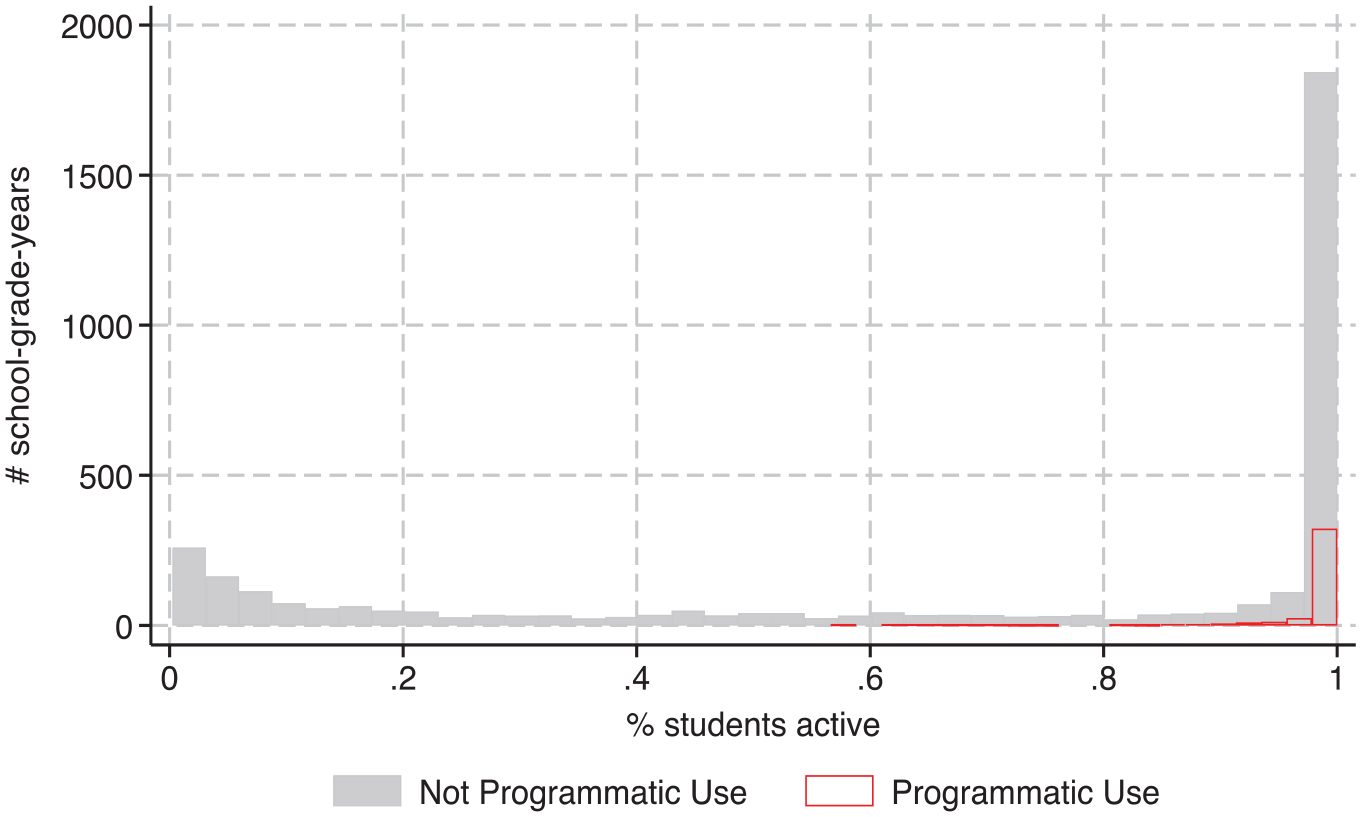
Percent of students active on Zearn Math by treatment status.
The fact that the comparison group includes grades that were using Zearn Math could be interpreted to mean that the estimated effect found here is an underestimate of the impact of programmatic use of the program. In other words, in a setting in which programmatic use of Zearn Math was being compared with no use, rather than some use, we may observe larger effects of the program. Nevertheless, because there are grades at the margin of the treatment threshold, this calls into question the sensitivity of my main findings to alternative definitions of programmatic usage, which I address in this section.
Figure 11 presents estimated effects of Zearn Math using my primary specification (model 1) and varying treatment cutoffs. In short, Figure 11 shows that my findings are not sensitive to alternative definitions of programmatic usage. For example, the estimated effects when treatment is defined as 30% or 70% of students active on Zearn Math for at least half the school year are not statistically differentiable from each other nor from the main estimated effect (in green). This is likely due to the bimodal distribution for the percent of students active metric (see Figure 10) such that shifting the treatment threshold does not materially change the average Zearn usage among treated grades.
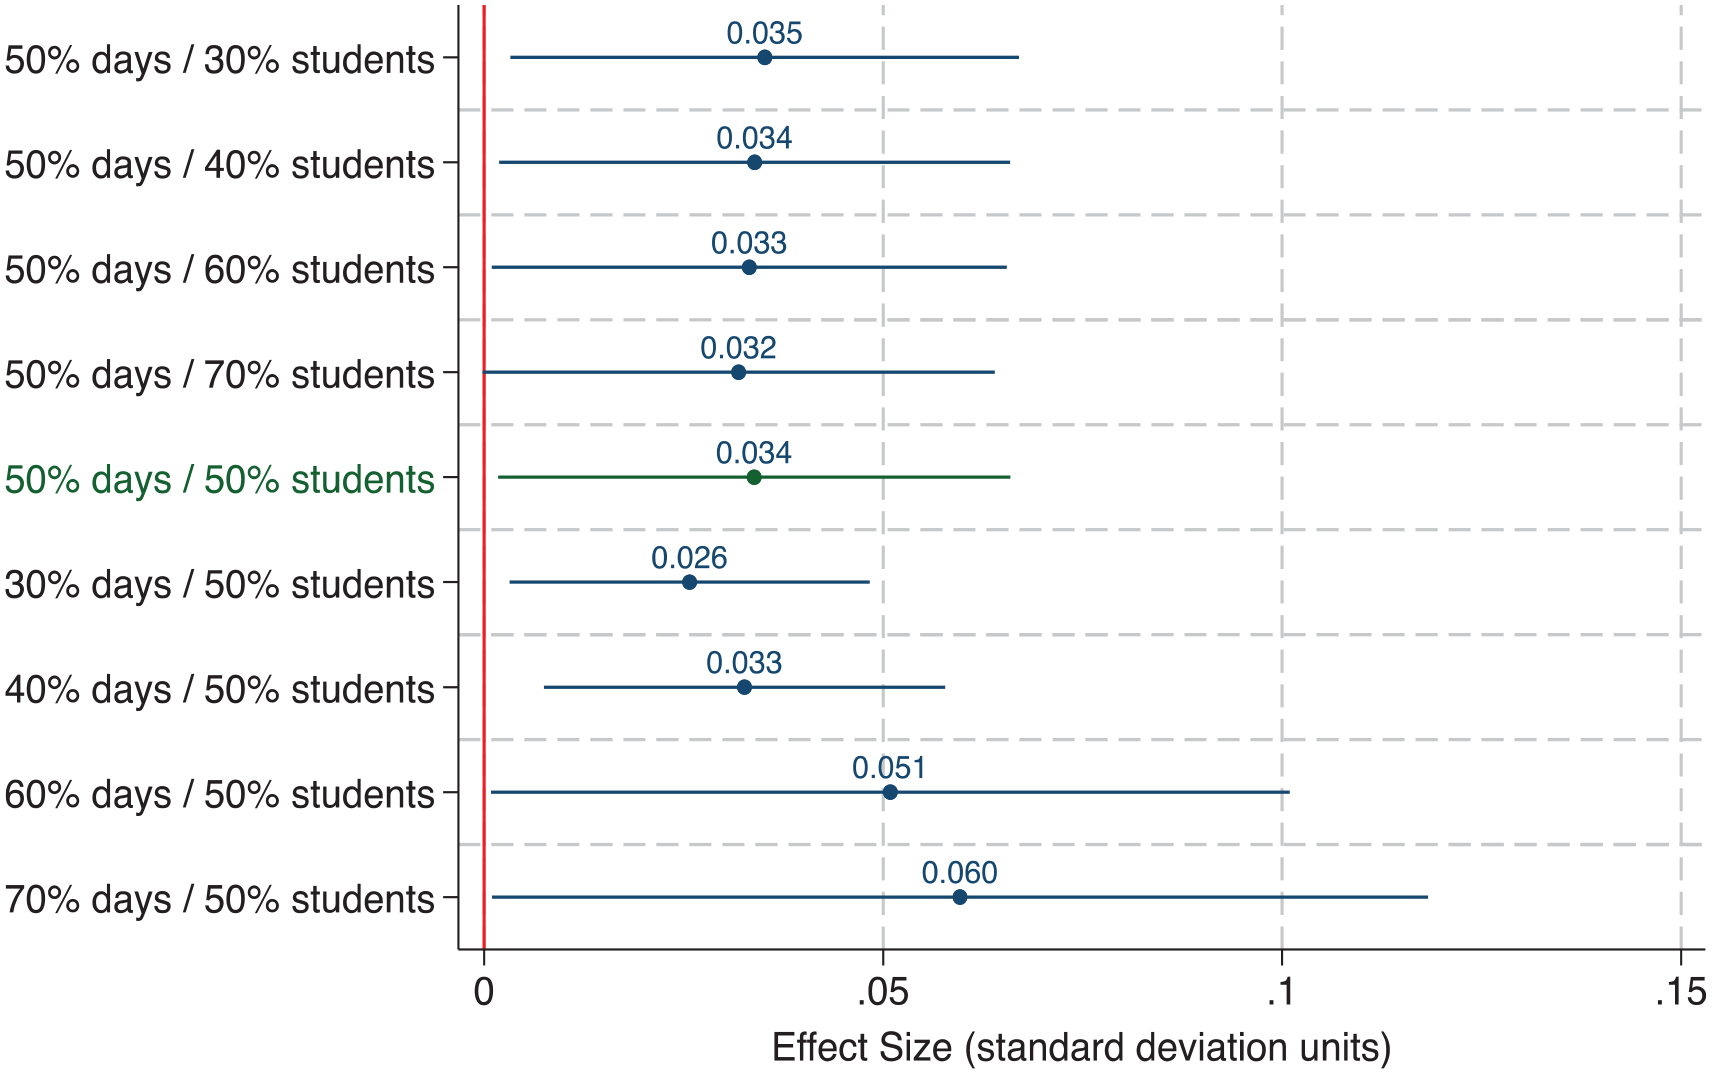
Sensitivity to alternative treatment thresholds.
Varying the treatment threshold along the other metric—the average number of days students were active on Zearn—presents a noteworthy trend. The estimated effects on the bottom half of Figure 11 suggest that, on average, more days spent on Zearn Math is associated with higher math scores such that even grades that were using the program supplementally with their existing math curricula may have seen achievement gains relative to those who did not use it at all. To explore this further, I extend my primary analysis by presenting a more nuanced treatment variable in the next section.
Extension
Given that Zearn Math is highly compatible with Louisiana’s most prevalent traditional elementary mathematics curriculum, ENY, it seems reasonable that many grades may have been implementing Zearn Math as a supplementary resource along with ENY rather than replacing it as their core curriculum. This would explain the large number of grades that were using the program with a majority of their students but only sporadically in terms of the number of days, as indicated by the number of observations on the far right of Figure 8. To address program use among these grades, I estimate the following:

where Program is a dichotomous variable indicating whether grade g in school s in year t programmatically used Zearn Math (corresponding to Zearn in models 1–3), and Supplement is a dichotomous variable indicating whether grade g in school s in year t supplementally used Zearn Math. Consistent with my primary definition of programmatic use, I define supplementary use as at least 50% of enrolled students in a school-grade-year being present on using the digital component of Zearn Math for fewer than 84.days, on average.
I can also leverage the continuous nature of the average days on Zearn Math measure (see Figure 9) to estimate the impact of an even more nuanced measure of treatment. Specifically, I can estimate the marginal effect of each additional day of using the program employing the following model:

where Days is the average number of days that students in grade g in school s in year t were present on the digital component of Zearn Math, Student50 is an indicator variable equal to 1 if at least 50% of enrolled students in the school-grade-year were active on the platform, and
Table 9 presents the results from fitting models (4) and (5). The coefficient on Program in column (1) shows that the estimated impact of programmatically using Zearn Math relative to not using it programmatically or supplementally is .035 standard deviation units, which is statistically indistinguishable from the results shown in Table 6. On average, students in the supplemental group used the digital component of Zearn Math for 30.days and completed 18 lessons. This amounts to ~15%–20% of the school year and of a grade level’s content, which is about a quarter of the average usage I observe among programmatically using grades. Although the coefficient on Supplement of .003 is not statistically significant, I cannot reject that the effect of days of use is linear. Model (5) tests this directly. Column (2) of Table 9 shows that, among the grades that had a majority of students using Zearn Math, there is a linear association between the number of days they spent on the program and their math scores. Specifically, the coefficient on the interaction term of .0004 suggests that completing grade-level content (~120 digital lessons, one lesson per day, as recommended by the publishers) is associated with .05 standard deviation units higher math scores. These findings are in line with the main findings presented earlier and also suggest that using Zearn Math as the core curriculum is more effective than using it as a supplemental resource.
Marginal Treatment Effects

Notes. School clustered standard errors are in parentheses (*p < .10; **p < .05; ***p < 0.01). All estimates are calculated with school-grade and grade-year fixed effects, weighted by the number of students tested, and include controls for school-year student composition by gender, race/ethnicity, LEP, high poverty, and enrollment. The coefficients on Program and Supplement are the estimated impact of using Zearn Math programmatically (50% of students in a school-grade-year using the program for at least 50% of school days) and supplementally (50% of students in a school-grade-year using the program for fewer than 50% of school days). The coefficient on Days × Student50 gives the marginal impact of each additional day spent on Zearn Math among school-grade-year observations that had at least 50% of students on the program.
Conclusion
This work comes at a critical time when pandemic-related school closures have hastened the reliance on technology-based materials, dramatically expanding Zearn Math’s presence across Louisiana and the nation. As our educational system continues to lean on remote or hybrid learning environments, it is imperative that we understand what resources effectively support student learning and growth.
To that end, there is more work to be done. I find evidence that consistent usage of Zearn Math led to higher math achievement, but the modest estimated effect sizes and the potential for heterogeneous impacts across student subgroups, unmeasured variation at the student or classroom level, or resource allocation across subjects warrant additional research. Moreover, a single study cannot address the diversity of educational environments in which curricula are implemented. The curriculum context in Louisiana suggests that the effects found here may reflect the marginal benefit of using Zearn Math instead of, or possibly in addition to, ENY. It is possible that the program would perform differently in different contexts, especially given the mixed evidence on the impact of curricular choice on student learning (see, e.g., Blazar et al., 2019; Kane et al., 2016). It may be that benefits of specific curricula emerge when they are implemented with more administrative support, more intensive usage, or more targeted teacher training.
In this regard, several key factors are worth noting about the generalizability of these findings. On the one hand, the study’s quasi-experimental approach to assessing Zearn Math’s impact may be more reflective of real-world conditions compared with a randomized controlled trial in which various stakeholders may be incentivized to ensure fidelity. On the other hand, the main treatment effect is based on having used the program for a substantial amount of time, and there may have been setting-specific factors that facilitated such extensive adoption that may not apply in all contexts. Still, the evidence suggests that more use translates to better outcomes, offering a promising baseline for evaluating the program’s impact at differing levels of usage. Future research should examine whether the program has been advantageous over existing curricula across multiple implementation factors and consider additional contexts to diversify the business-as-usual practices that Zearn Math is being measured against.
Footnotes
Acknowledgements
This paper is part of my PhD dissertation. I thank Tom Kane, Doug Staiger, and Jimmy Kim for their generous advice and guidance as well as five anonymous referees for their helpful comments. Financial support from the Harvard Griffin GSAS Dissertation Completion Fellowship and the Overdeck Family Foundation is gratefully acknowledged.
Declaration of Conflicting Interests
The author declared the following potential conflicts of interest with respect to the research, authorship, and/or publication of this article: The author is a former employee of Zearn with no financial stake in the organization and a former research fellow with the Louisiana Department of Education.
Funding
The author disclosed receipt of the following financial support for the research, authorship, and/or publication of this article: The research reported here was supported in part by a training grant from the Institute of Education Sciences (R305B150010). Opinions expressed do not represent the views of the U.S. Department of Education. Additional financial support from the Harvard Griffin GSAS Dissertation Completion Fellowship and the Overdeck Family Foundation is gratefully acknowledged.
Author
SHIRIN HASHIM (