
Abstract
Law schools are held accountable on many fronts to achieve and maintain high bar passage rates. While the course of legal education itself, along with various interventions, is a key driver of bar exam performance, Bahadur et al. (2021) suggests that obscure institutional practices might be inflating institutional bar passage performance. Such practices could include recruitment and admission of transfer students and academic attrition. We examine this hypothesis to assess the influence of both attrition and transfer on law schools’ bar passage differential using fixed-effects and between-within models. We also utilize Poisson regression to explore the effect of geographical proximity to other law schools on transfer rates. We find that, on average, neither attrition nor transfer activity substantively affect bar passage performance, and that although geographic proximity to other schools is related to transfer rates, this relationship does not result in notable differences in bar passage.
Keywords
Introduction
Since 2017, several studies in legal education have either heralded silver-bullet bar preparation interventions or used regression analysis to distinguish law schools that overperform or underperform in terms of bar passage rates (Johns, 2018; Kinsler, 2021, 2023; Kinsler & Hudson, 2017; Kinsler & Usman, 2018; Ruiz, 2020; Ryan & Muller, 2023; Schulze, 2018). Until recently, these studies went largely unchallenged. In 2021, Bahadur et al. argued that some schools manipulate their bar passage rates through the attrition and transfer of students—a process that, therefore, inexorably alters the composition of law school cohorts. As a result, a school’s low or high pass rate is not driven by “pedagogy but rather prestidigitation. When law schools manipulate their matriculant pools via academic attrition and transfer, that sleight of hand improves their bar performance rates” (Bahadur et al., 2021, p. 2).
This open question is an important one—are some law schools unfairly rewarded or are some programmatic interventions incorrectly labeled effective when law school attrition and transfer processes are due the credit? This debate has become contentious and the Bahadur et al. article has been downloaded nearly 600 times and widely discussed in online forums. The emotional response is understandable among administrators, faculty, and staff—positions are at stake.
If research proclaims a silver bullet intervention or that one school overperforms relative to another, then administrators may pressure their departments to implement the same program or restructure existing programs to align with the offerings of overperforming schools, all with the expectation of the same stellar results. Should they not be achieved, jobs would be in jeopardy. In fact, most academic and support staff—those charged with implementing many of these programs and actually interacting with students at risk of failing the bar exam—are not faculty members and do not have the protection of tenure. But if the research is flawed and the results therefore unreliable, achieving such a target is a Sisyphean task.
This debate, however, ignores those that are most harmed—the students. If it were true that schools manipulate their bar passage rates, particularly via attrition, students enrolled at these institutions would be more likely to be dismissed than given the academic support and encouragement that might otherwise help them be successful on the bar exam and in the profession. The financial costs to students alone would be substantial—tuition and fees for one semester of law school alone can cost 25,000 dollars (AccessLex Institute, 2022).
The degree of contention in the debate, the lack of peer review in this area of scholarship, and the high stakes for law students and faculty justify a rigorous and objective examination of Bahadur et al.’s supposition. As such, we explore three important questions:
On average, to what extent do attrition, transfer-in, and transfer-out rates affect institutional first-time bar passage? (RQ1)
Does transfer activity vary by institutions’ geographic proximity to other law schools with higher or lower rankings? And, if so, how? (RQ2)
Are the effects of attrition and transfer rates on institutional first-time bar passage rates moderated by whether a law school is near others with higher or lower rankings? (RQ3)
Although the outcome (bar passage) is unique to law schools, the concerns underpinning this research are not. Whenever schools have control over who they enroll, there is a chance that individuals may bear the consequences for the benefit of the institution (in this case, a better ranking).
Background
Predicting first-time bar passage rates, whether for students or for schools, is tricky business. Bar passage is driven by a complex network of factors and their interplay, including those at the administrative level, within the classroom, and at home, as well as those intrinsic to test takers themselves (for example, their level of comfort with taking standardized tests, particularly those with professional and financial ramifications).
Given that bar passage is the result of a complex interweaving of factors at both the student and school level, it is critical to recognize that any single factor undoubtedly moves in tandem with others. This makes it difficult to disentangle what is responsible for an individual’s bar exam performance nonetheless a school’s changing bar passage rate.
Despite its labyrinthine nature, the American Bar Ass-ociation (ABA) considers bar exam performance “likely the single best outcome measure to consider in assessing wh-ether a law school is maintaining a ‘rigorous program of legal education’” and “one of the critical pieces of consumer information that prospective law students should consider in deciding where to study law” (American Bar Association Section of Legal Education and Admissions to the Bar, 2019, p. 1). Consequently, there are strong regulatory and financial incentives tied to bar passage.
Therefore, conducting research on student-level and school-level bar passage outcomes is critical in helping both law students (prospective and current) and law schools, despite the inherent complexities in doing so. Its complexity should not suggest forgoing this important avenue of research but instead should signal the need for considerable care (and proper transparency when discussing results) to potential confounding factors and imperfections in the available data.
The body of empirical research on the topic is developing. (It is worth noting that much of this literature, including that mentioned throughout this article, has been and continues to be published in law reviews—which are run by students without statistical training—and therefore without the benefit of peer review.) Earlier research on the topic tended to rely solely on school-level LSAT scores and undergraduate GPA (UGPA) to explain and predict variation in bar passage. (See, for example, Kinsler, 2021; Kinsler & Hudson, 2017; Kinsler & Usman, 2018; and Ryan, 2019.) Or it uses LSAT score and UGPA as control variables for studies exploring the effectiveness of particular interventions. (We have work underway that may suggest that this practice is ill-advised given that the relationships between these preadmission variables and bar passage is substantially mediated by law school performance; in other words, LSAT score and UGPA may not be actually controlling for much of anything.) More recently, researchers have been increasingly cognizant of potential confounding in these relationships, recognizing that relying only on LSAT scores and UGPA ignores the inherent complexity of the factors driving school pass rates (Ryan & Muller, 2023; Ryan et al., 2021).
How Attrition and Transfer Rates Might Affect Bar Passage
Bahadur et al. (2021) present a novel hypothesis for what might be contributing to institutional first-time bar exam performance (at least at some schools). Their supposition is that high rates of attrition and transfer student matriculation (bringing in more students from other law schools) lead to better bar passage rates and vice versa.
Attrition
Law school attrition can occur in two forms: (1) students are dismissed for failing to meet academic standards (academic attrition), which vary by school, and (2) students withdraw themselves from law school based on their own reasons or are withdrawn for violating a school’s code of conduct or other infraction not related to academic standards (other attrition). Whatever the cause, attrition is typically defined as any case where a student withdraws from one law school and does not enroll in another.
Traditionally, research on attrition has focused on examining its causes, including academic performance (e.g., Spady, 1970), intellectual development (Tinto, 1975), integration with peers and the institution (Spady, 1970; Tinto, 1975), and external finances and support systems (Bean & Metzner, 1985).
Far from considering attrition as the culmination of forces driving imperfect academic performance, Bahadur et al. (2021) posit that it is partly driven by (at least some) schools’ calculation that their ranking or accreditation will be improved by increasing the number of students they dismiss for academic performance.
Recent literature on student bar exam performance has found that first-semester and first-year (1L) law school GPA (LGPA) are strong predictors of later bar exam performance (Taylor et al., 2021). Therefore, academically attriting students with early LGPAs below a particular threshold is in effect dismissing students with lower probabilities of first-time bar passage. Consequently, Bahadur et al.’s argument that a school’s bar passage rate increases due to greater academic attrition may have some justification.
Additionally, Bahadur et al. (2021) contend that rather than use attrition as a last resort, schools could use it as a tool to improve their overall rate, unnecessarily dismissing potentially large numbers of 1L-students with LGPAs below a pre-established threshold (p. 155). This can occur despite outside pressures facing students that could negatively affect their academic performance—including familial or caregiving responsibilities, financial struggles, disabilities, or even experiences of racial discrimination (Feingold & Souza, 2013; Guthrie & Lamm, 2019; Nelson et al., 2019; Ryan, 2020).
It is important to consider that Bahadur et al.’s supposition does not address the fact that some institutions take chances on students that have lower entering academic credentials. Typically, institutions do this to expand access to applicants who have been historically shut out of law school. To the extent that preadmission indicators predict early academic performance in law school, it should not be surprising if these schools dismiss more students than others in pursuit of their mission to broaden access to legal education. Many of the students that are admitted with this goal in mind thrive in law school when provided the opportunity, one that might otherwise have not been afforded to them. Accordingly, higher rates of attrition should not necessarily be construed as a “sleight of hand.” It is also important to note Bahadur et al. assume that all students who attrit would ultimately fail the bar exam. Such an assumption, we believe, is questionable.
Transfer
Law school transfer occurs when a law student elects to withdraw from one school in order to attend another, typically following the first year. As such, student transfer should be viewed through the lens of both the school that loses the student and the one that gains them.
Bahadur et al. suppose that those students who elect to transfer have relatively higher 1L LGPAs than those that do not transfer, which in turn enables them to transfer to more selective institutions (what they refer to as “transferring up”). Given the scholarship on the strong relationship between early academic performance and first-time bar success (e.g., Taylor et al., 2021), the authors therefore contend that the transferring students are those that have greater odds of passing the bar exam on their first attempt. As such, the original school would be losing a future bar taker with a higher probability of first-time bar passage while the receiving school would be gaining such a student. When bar passage rates are reported by the ABA, the originating school receives no credit or recognition for its investment in teaching the foundational substantive courses that are part of the first-year curriculum and tested on the bar exam; on the other hand, the receiving school receives full credit without the expenditure of resources on that student’s formative 1L year.
Using data that we have collected through various research projects, we find that, on average, transfer students indeed have higher first-semester (M = 3.46, SD = 0.39) and first-year LGPAs (M = 3.45, SD = 0.38) than nontransfer students (M = 3.15, SD = 0.51 and M = 3.13, SD = 0.48 respectively).
Other scholars have suggested a similar pattern, though for different reasons (e.g., Price & Star, 2013). Before recent changes to the methodology (Hartocollis, 2023), only first-year students’ scores were included in schools’ U.S. News rankings, meaning that if a school accepted their applicants with the highest UGPAs or LSAT scores, their ranking could increase, regardless of whether these students later attrited or transferred to another school. It also means that students who were not initially accepted and may have lower UGPA or LSAT scores could transfer to a higher tier institution, without affecting the overall rank of that school. Regardless, multiple scholars have now suggested that a primary purpose for manipulation of attrition and transfer rates has to do with improving a schools’ ranking, which attracts law students to the school, increasing revenue or at the very least compensating for lost revenue from students who transferred out (Bahadur et al., 2021; Price & Star, 2013).
Looking at transfers nationally, schools with lower median LSAT scores and lower U.S. News & World Report rankings do tend to lose more students to transfer, with those students typically enrolling at institutions with higher rankings and median LSAT scores. But the number of annual transfers is quite low, on average.
Notwithstanding, pigeonholing the cause of student transfers as “transferring up” and a means for law schools to “manipulate bar passage rates” ignores the agency that students have in determining where to enroll and for what reason. Although not as widely considered in legal education, student choice theory is well documented in K–12 and higher education. In general, this research establishes that students select an institution based on their priorities and needs. Most commonly this includes consideration of the reputation of the institution, location, cost, and quality of the teaching (Agronow & Hengstler, 1995; Briggs, 2006; Broekemier & Sheshadri, 2000; Canale et al., 1996; Chapman, 1981; Coccari & Javalgi, 1995). For example, a student with high financial need may select an institution based on financial aid packages or scholarship opportunities. The only study to our knowledge that investigates student choice in law school largely echoes the broader literature but notes that student priorities vary slightly by the type of law school (e.g., private vs. public; Ryan, 2020). Beyond the established literature, bar passage and subsequent career opportunities play a large role in law school selection (Ryan, 2020). Thus, students could decide to transfer if given the opportunity to switch to a school where graduates have better outcomes. Conversely, Tinto’s (1975) theoretical model suggests that students could transfer if they do not feel socially or academically integrated into the school (Getzlaf et al., 1984).
Hence, student choice research suggests that students act in their best interests, including whether to transfer from one school to another. These decisions are driven by myriad reasons, many of which are unrelated to the comparative rankings of two particular law schools. In many cases, this may ultimately result in movement from a lower-ranking to a higher-ranking school, but this should not be taken, on its own, as an indication of strategic or underhanded transfer practices.
Changing Cohort Characteristics
Taken in tandem, dismissing many struggling students and transferring in the high-performing students from lower-ranked schools may, according to Bahadur et al., mean that some schools are unfairly receiving credit for outstanding bar passage outcomes that exceed jurisdictional averages and/or erroneously attributing this to exceptional academic and bar success programming (e.g., they figured out the “secret sauce”). (For example, see Kinsler & Hudson, 2017; Ruiz, 2020; and Ryan & Muller, 2023.) They argue that this success should actually be attributed to the effect attrition and transfer policies have in altering the composition of a school’s cohort, particularly in terms of its median LSAT scores and UGPA.
In Figure 1, we illustrate three hypothetical scenarios under which dismissing and transferring students might affect the median LSAT score and UGPA of a law school’s cohort.
Left, a school behaves as Bahadur et al. propose, both attriting and transferring in a sizable number of students.
Center, a school that neither attrits nor transfers more than the average number of students.
Right, a school that attrits few students but loses many students to transfer.
Although the composition of a law school’s cohort may change, in terms of its median preadmission characteristics, Farley et al. (2019) find that LSAT score and UGPA are only weakly associated with bar passage. Therefore, any change to bar passage rates stemming from this change in cohort characteristics would likely be small.

As a result of attrition, transfer in, and transfer out, the median LSAT and UGPA of a cohort could change.
Methods
Data
We use data disclosed and publicly available in accordance with ABA Standard 509, capturing myriad student and institutional characteristics. These data are self-reported annually to the ABA by accredited institutions, with publicly available data going back to 2011. Our sample includes all ABA-accredited law schools (as of February 2021), except for those schools located in Puerto Rico, as its bar exam contains an English proficiency component, which renders it sufficiently dissimilar to the remaining jurisdictions.
In addition, we dropped Marquette University School of Law and the University of Wisconsin Law School, because their graduates are admitted to the Wisconsin bar without taking the bar exam. These schools, therefore, have bar passage rates of 100 percent and are not of interest when investigating outcomes related to bar passage.
We use data for student cohorts entering law school between 2013 through 2016 and assume the typical three years to graduation. Thus, in our sample, students would have graduated and taken the bar exam between 2016 and 2019. 1
Our primary outcome variable is the first-time bar exam passage differential of each law school (hereafter “pass differential”), which is calculated by differencing:
a school’s average first-time pass rate across all jurisdictions in which its students took the bar exam for the first time, weighted according to the proportion of its students who sat for the exam in each jurisdiction, and
an average of the jurisdictional first-time pass rates of these jurisdictions, applying the same weights indicated previously. (See Box A.1 for an illustration.)
This preference to use pass differential over pass rate is due in large part to the fact that each jurisdiction sets its own cut score, the minimum exam score needed to pass the bar, which has led to variation in what score constitutes minimum competence throughout the country. For example, California’s high cut score makes it one of the most difficult jurisdictions in the country, which has produced some controversy (Hunter, 2020). To account for this, rather than use first-time bar passage rate, we use pass differential, as described previously.
An additional benefit of bar passage differential is its distribution. Bar passage differential can take any value at, above, or below zero. In our sample, it ranges −0.44 to 0.27. On the other hand, school-level bar passage rates are theoretically bound at 0 and 1 and, in practice, are heavily clustered above the 75–80% mark, meaning a traditional logistic regression model might produce biased estimates given its restricted range. Although this could be modeled with generalized linear models other than logistic regression (e.g., using counts and offsets with Poisson or negative binomial methods), the method to calculate bar passage differential makes it better suited for our analyses.
Our primary variables of interest are law schools’ attrition and transfer-out and transfer-in rates. Our null hypothesis is that there will be no relationship between these variables and pass differentials. To reject, we would need evidence that indicates a statistically and practically significant relationship between a school’s pass differential and its attrition, transfer-out rates, and transfer-in rates. Furthermore, the relationships with pass differential should be positive for attrition and transfer-in rates and negative for transfer-out rates.
When calculating transfer rates, we remove from each school those students who entered as a result of a school closing (for example, Indiana Tech Law School and Arizona Summit Law School, which closed in 2017 and 2018, respectively). Thus, the transfer figures we use should reflect typical annual transfers between schools.
To address RQ2, we use the counts of transfers in and transfers out as the outcome variables. We then examine whether transfer markets—geographic areas of high transfer activity between law schools—predict higher transfer activity, even when including controls that account for other factors associated with attrition and transfers. This research question allows us to determine if simply being near several high-ranked schools influences transfer activity independent of other factors associated with transfers in and out.
For RQ3, we explore whether proximity to other law schools moderates the effects of attrition and transfer rates on pass differential. Specifically, we investigate the extent to which schools might be clustered regionally in such a way that they gain or lose students to nearby schools. For example, a middle-ranked law school in a sparsely populated area like North Dakota will have few law schools nearby, so high performers looking to transfer to a higher-ranked school after their first year may be less likely to transfer simply because of the geographic distance. On the other hand, a school in the Northeast region is more likely to be within proximity to another law school, particularly one with a higher ranking, and is, therefore, more likely to appeal to high-performing students. Hence, this would make transferring more practical in terms of logistics and geographic preference.
For RQ1 and RQ3, accounting for schools’ median LSAT scores and UGPAs is important given those variables’ relationships with bar passage. Failing to account for these variables would produce results that are unreliable and biased if they also happen to be correlated with the explanatory variables (e.g., transfer or attrition rates). Moreover, to capture a wider range of these variables, we create an index that combines a school’s 25th, 50th, and 75th percentile LSAT scores and UGPAs. This is constructed by converting the 25th, 50th, and 75th percentile LSAT scores and UGPA into a proportion (total points out of a possible 180 for LSAT score and 4.0 for UGPA). We then regressed our outcome by these combined variables. We compared the relative size of the coefficients, using the relative size to weight the variables before adding them and scaling the weighted sum to range between 0 and 1. The result is a more comprehensive measure of a school’s entering students (our approach is an adapted version of that developed by Ryan and Muller, 2023). We also consider a wide range of additional control variables, as described in appendix Table A.3.
Models
We employ similar approaches to investigate RQ1 and RQ3, both of which use pass differential as the outcome of interest. (See appendix Table A.2.) RQ2, on the other hand, uses transfer-in and transfer-out counts as the outcomes. (For the formulas we employ, see Analytical Appendix.) In all cases, the models we present were chosen according to model fit using Bayesian information criterion (BIC) and Akaike information criterion (AIC) values, as well as theoretical considerations. The preferred model is the one that (1) aligns most with the predictors that are theoretically justified and (2) produces the smallest errors with the fewest variables such that the model is not overfitted.
RQ1
To explore the extent to which attrition and transfer rates affect pass differential, we employ a fixed effects approach. This allows us to compare how changes in each school’s attrition, transfer-in, and transfer-out rates relate to its respective changes in pass differential over the period 2013 to 2016. In essence, we are testing whether a particular law school’s bar pass rate increases in years in which it attrited more students than average, holding all else constant.
These individual results are averaged across the 189 schools to arrive at the estimated effect attrition and transfer rates each have on pass differential overall. This approach allows us to control for those factors that do not change (or change very little) over time at law schools—for example, the school’s geographic location, the size of its student body, and the cost of attendance. However, the available data cannot account for programmatic changes that occur at these schools—for example, if a school implements a new academic support program during the study period. If this were to happen and the school were to also significantly increase or decrease its attrition or transfer rates, then the size of the effect of attrition or transfer on bar passage differential might be inflated or deflated. Nonetheless, because the estimates are averaged across 189 schools, the likelihood is low that the bias would be sizable and practically important.
For RQ1, we use a fixed effect linear model (using the R package plm [Croissant & Millo, 2008]), which examines how attrition and transfers affect first-time pass differential, holding constant several time-varying control variables. This method allows us to compare each school to itself and account for changes in the school’s enrollment, section size, and other factors. Since we are comparing schools to themselves, we are therefore able to account for peculiarities that exist across jurisdictions. We also interact attrition rate and transfer rate, a decision predicated on Bahadur et al.’s supposition that attrition and net-transfer rates co-vary at the top 15 schools from Kinsler’s rankings (Kinsler & Usman, 2018). Indeed, we do find that the model better fits the data when this interaction is included.
RQ2
Our second set of models examines whether geographic proximity to law schools with a higher (or lower) rank influences transfer activity. It is plausible that, aside from all other factors that may impact transfer activity, being located near a higher-ranking law school makes a given school more likely to lose students to that higher-ranked school, since the transfer would presumably involve less of a logistical challenge for the student. Put simply, if a student attends law school in Chicago, it is easier for that student to move to another location in Chicago than it would be to move to California—especially if transferring to another Chicago law school does not necessitate the student changing their living location at all.
To operationalize geographic proximity to other schools, we create a transfer index variable by grouping each school into 1 of 22 regions using its geographic coordinates. Employing a 100-kilometer radius around each school, we identify schools with overlapping circles to be part of the same region. We also made minor adjustments after the fact, when necessary, 2 and some schools do not fall into a geographic market with any other schools.
Within each of these regions, we assigned each school its U.S. News ranking for a given year and calculated the difference between the total number of schools and the number of schools with a lower ranking in a given year. Schools that were not assigned to a region were assigned the average index value for the given year (because this variable was standardized within each year with mean 0 and SD 1, the value is 0). As such, higher transfer index values mean that the school has a higher U.S. News ranking relative to the schools within a 100 km radius.
We use mixed effects Poisson regression to model the counts of students transferring into and out of a law school conditional on its transfer index, while including an offset for the number of first-year enrolled students. The offset is intended to control for variation in the counts of transfers that might be expected due to differences in enrollment from one school to another (under normal circumstances, we would expect a school that enrolls 500 students to have more transfer activity than one with 100 students). We include several covariates to account for potential confounding.
RQ3
Our third set of models investigates whether a school’s transfer index might moderate the effects of attrition and transfer activity on bar passage differential. Since a school’s transfer index is fixed (time invariant), our standard fixed effects approach would not allow us to investigate its role in the relationships between pass differential and attrition and transfer rates. We, therefore, utilize a between-within model (sometimes referred to as adaptive centering with random effects), which separates the effect of any time-varying variables (i.e., attrition, transfer-in rates, and transfer-out rates) into both a within-school estimate and a between-school estimate (Allison, 2009; Raudenbush, 2009).
The resulting within-school estimate is similar to that obtained in the first model; it compares changes in a school’s attrition and transfer rates to changes in its first-time pass differential. The between-school estimate is an estimate of how differences in each school’s average attrition and transfer rates relate to differences in its first-time pass differential. In practical terms, this means we separate our explanatory variables into (1) an average for each school (between-school component), across the years in our sample, and (2) the difference between the school’s average and its attrition or transfer rate in a given year (within-school component). By splitting the estimate, we are therefore able to introduce and explore how a variable that does not change over time interacts in the model. (See appendix Table A.2.)
Findings
The initial phase of investigating our hypotheses is to examine whether relationships exist between a school’s att-rition and transfer rates and both its pass differential and LSAT/UGPA index score.
At first glance, there does appear to be a relationship between a school’s first-time pass differential and its rates of attrition and transfer (see Figure 2). Furthermore, there is evidence of a relationship (albeit curvilinear for transfer-in rates) between a school’s median LSAT/UGPA index score and both its attrition and transfer rates.
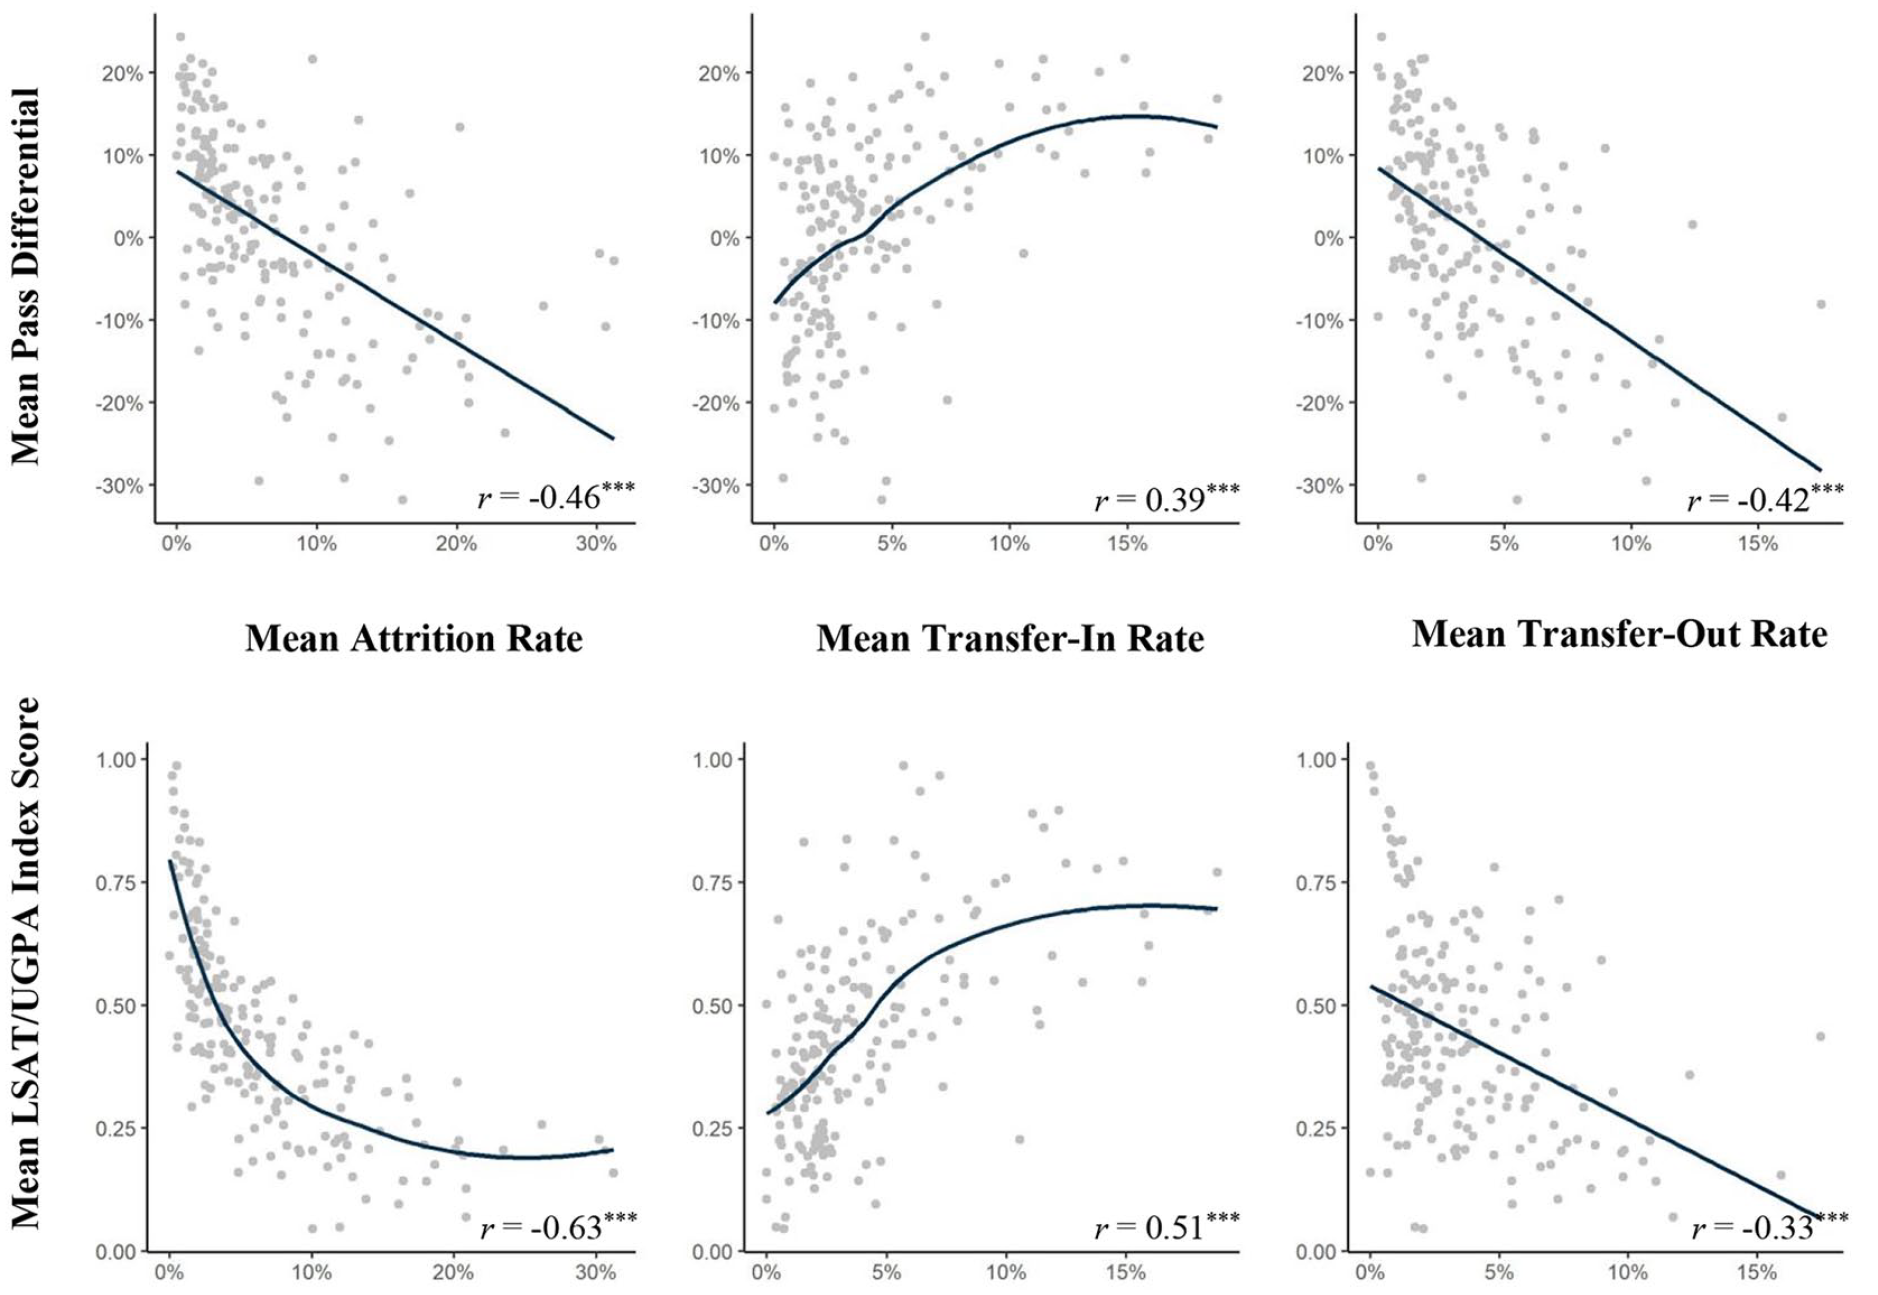
Attrition and transfer-out rates are negatively associated with pass differential and LSAT/UGPA Index score and positively for transfer-in rates.
Moreover, the number of students attriting and transferring is not inconsequential. On average, from 2011 to 2020, the number of 1L law students attriting and transferring was approximately 33,000 (8.4 percent of total JD enrollment for the period) and 18,000 (4.9 percent), respectively. This suggests that although a minority, these students represent a significant proportion of the total law school student population. On a per-school basis, out of an average of 186 first-year students (standard deviation [SD] = 94, IQR = 108), the typical school attrits 12 students (SD = 13.6, IQR = 12), transfers in 10 students (SD = 15, IQR = 9), and transfers out 8 students (SD = 10.6, IQR = 8) per annum. Furthermore, lower-ranked schools lose more students than they gain via transfer, and conversely, higher-ranked schools bring in more students than they lose. (See Transfer Markets for a larger discussion of student transfers.)
Thus, it seems that attrition and transfer rates might be confounding variables in Kinsler (2021) and Kinsler and Usman’s (2018) models and therefore that Bahadur et al.’s hypothesis deserves further investigation.
Attrition and Transfer Rates
Figure 3 illustrates the relationships between bar passage differential and attrition, transfer-in rates, and transfer-out rates, with their respective confidence intervals. On average, we find that bar passage differential changes only slightly when a school’s attrition, transfer-in rates, or transfer-out rates change. None of the effects are statistically significant (for attrition, only the second order term is statistically significant, and thus we cannot consider the full effect of attrition rate on pass differential to be significant).
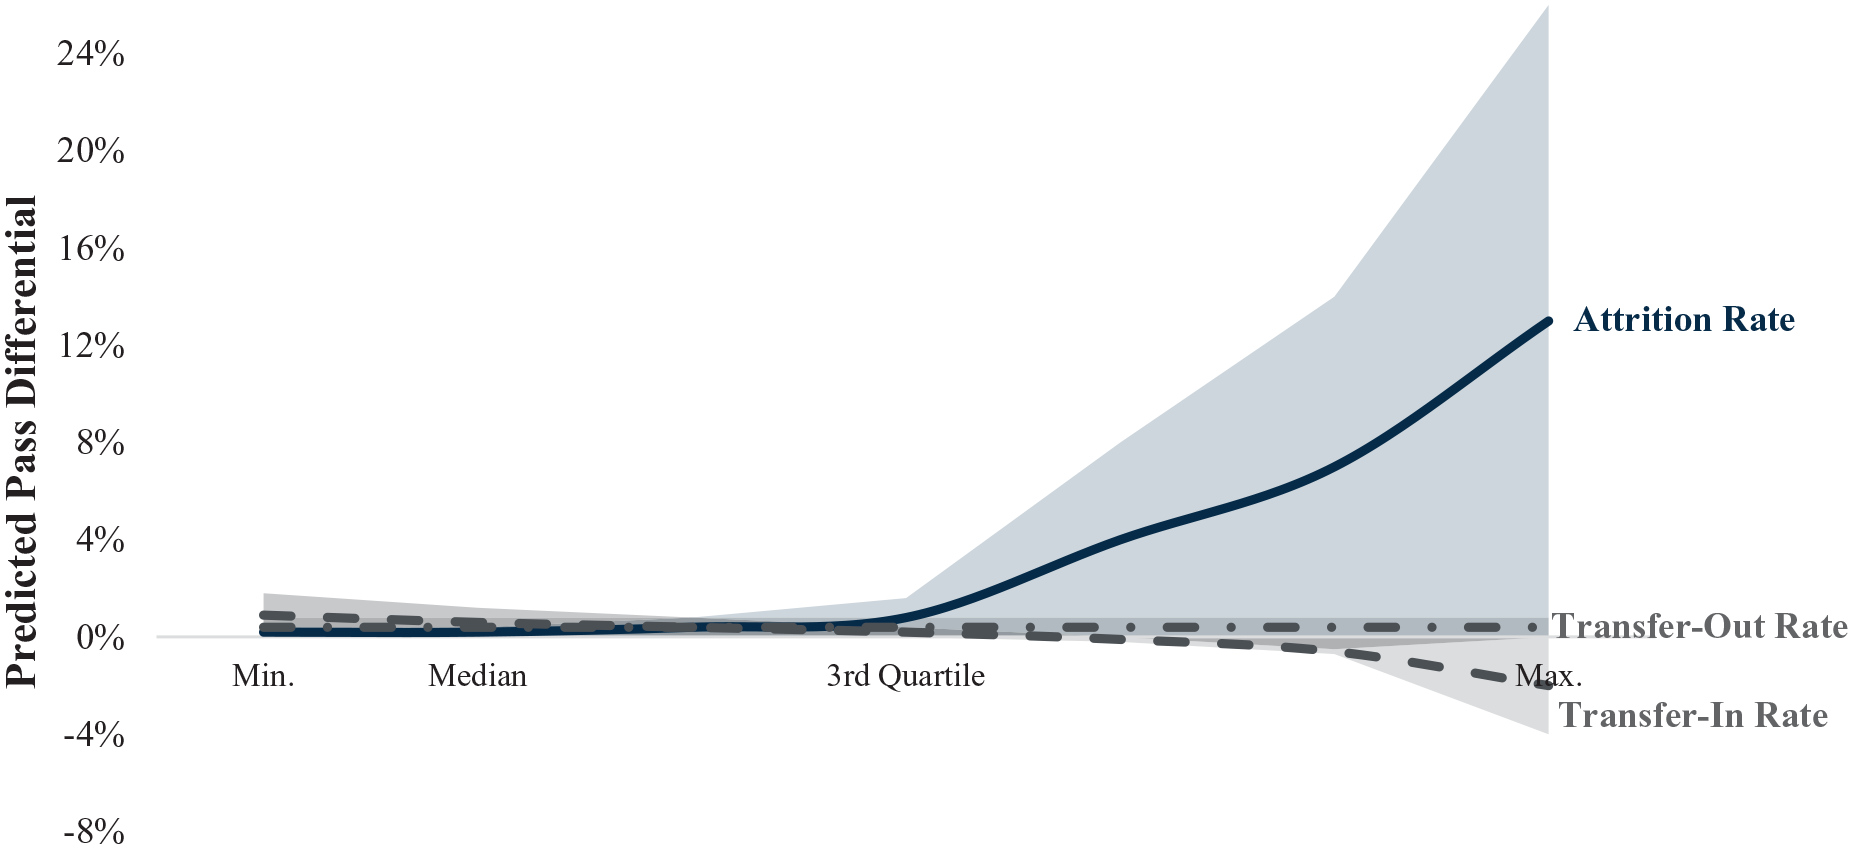
On average, a school’s pass differential is affected only when its attrition rate increase exceeds 2 standard deviations; it is largely unaffected by changes to its transfer-in or transfer-out rates.
Although the size of the exact effect will vary by school, on average, a school that increases its academic attrition rate by 7 percentage points (1 SD) would be predicted to see no change in its bar passage differential; a school that increases its academic attrition by 14 percentage points would be predicted to see a 0.02-point change in its pass differential.
Uncommonly large increases in attrition rates are an exception to the overall picture. For example, a school whose attrition rate increases by 28 percentage points would be predicted to see a 0.07-point increase in pass differential (a little more than a half SD unit of pass differential).
The relationship between changes to a school’s transfer-in rates and its pass differential is negative, albeit considerably weaker than that of attrition. A school that increases its transfer-in rate by 4 percentage points (1 SD) would be predicted to see a 0.01-point reduction in its bar passage differential, and should it increase its transfer-in rate by 12 percentage points, it would be predicted to see a 0.02-point decrease in pass differential.
There does not appear to be a relationship between changes in a school’s transfer-out rates and its pass differential. A 1-SD change (approximately 4 percentage points) predicts no change in pass differential. Even an increase from the minimum (0 percent) to the maximum (32 percent) predicts less than a one-tenth percentage-point decrease in pass differential.
Potential Moderating Effects of Transfer-In and Attrition
Despite the small effects of attrition and transfer-in rates on pass differential, we consider whether attrition rates might moderate transfer-in rates—and vice versa. We explore this possibility by interacting attrition and transfer-in rates. We find that adding this interaction to the model improves mo-del fit to a small degree.
As shown in Figure 4, for schools with average or above-average attrition, an increase in transfer-in rates is positively associated with pass differential. For a school with an attrition rate of 7 percent (the mean) or 14 percent (1 SD above the mean; the solid blue line), we predict that a 4-percentage-point increase in transfer-in rate would yield a 0.01- and 0.02-point increase in bar passage differential, respectively. For a school with no attrition, we would expect the 4-percentage-point increase in transfer-in rate to decrease its pass differential by 0.01 points.

Transfer-in rates more negatively affect pass differential for schools with below-average attrition rates.
As shown in Figure 5, there are interesting changes in the direction of effect of transfer-in rate given attrition rate. For schools with below-average transfer-in rates, the effect of greater attrition on bar passage differential is negative at first but turns positive as increases in attrition rates exceed 12 percent. For example, an increase in attrition of 7 percentage points is predicted to attain a 0.01-point decrease in pass differential, whereas an increase in attrition of 21 percent is predicted to increase pass differential by 0.02 points.
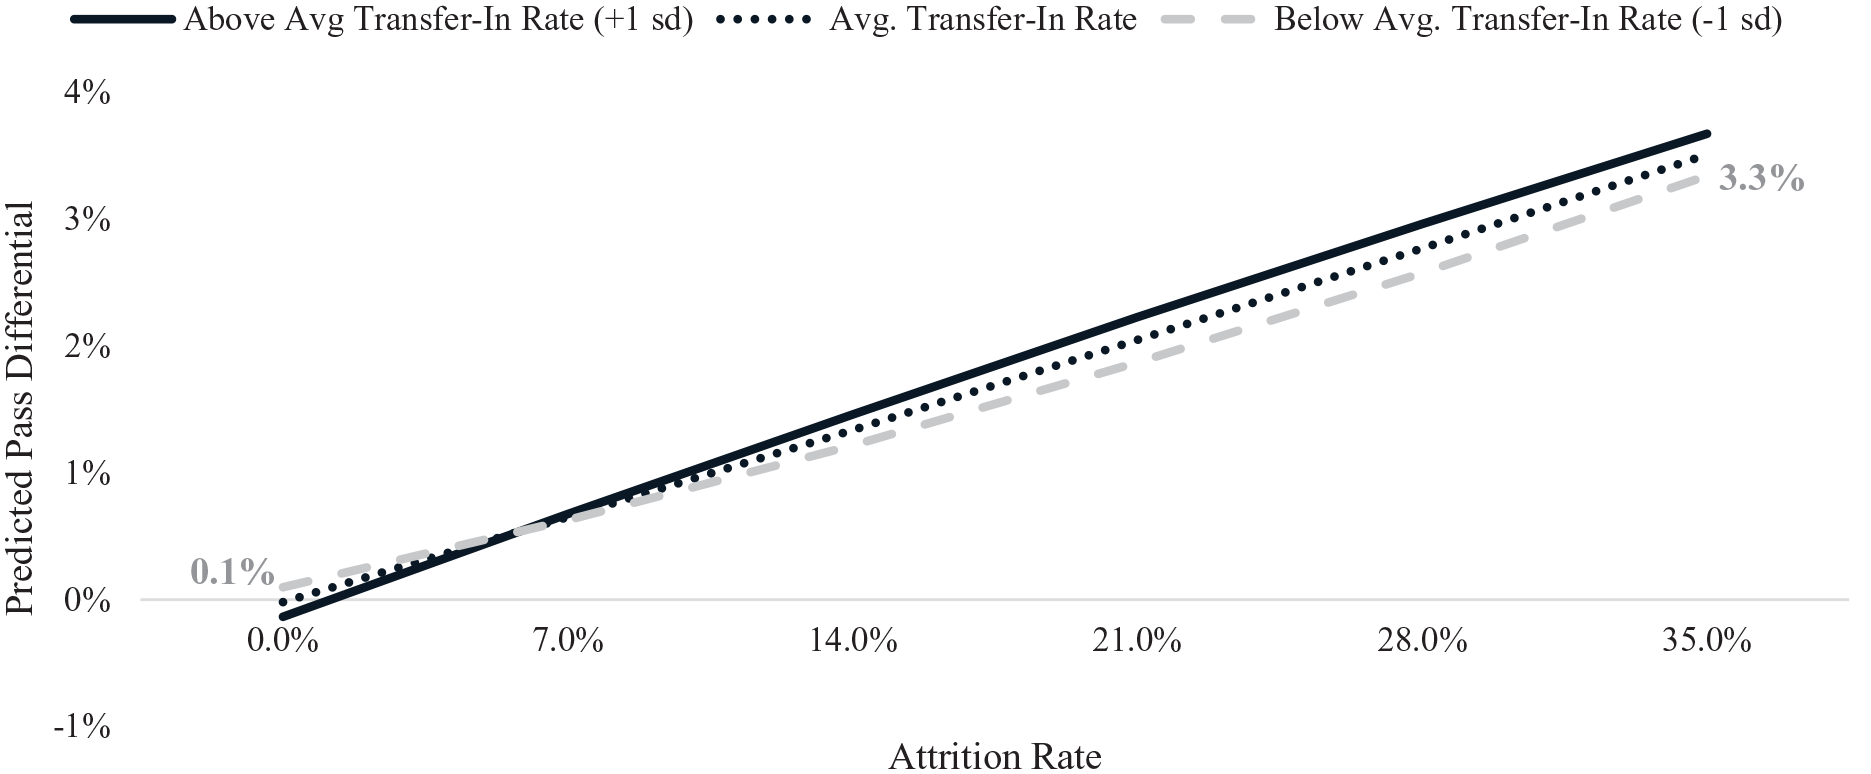
Attrition rates more positively affect pass differential for schools with average and above-average transfer-in rates.
For schools with average transfer-in rates, the relationship between attrition and pass differential is more linear. Schools with average transfer-in rates that increase their attrition rates by 7 or 14 percentage points would be predicted to achieve an increase in bar passage differential of 0.01 and 0.02 points, respectively.
For schools with above-average transfer-in rates, increases in attrition up to approximately 21 percentage points are associated with increases in pass differential; after that point, any additional increases in attrition yield no further gains or decreases in pass differential. For schools with above-average transfer-in rates, an increase in attrition rate of 7 or 14 percentage points is associated with a 0.03- or 0.05-point increase in pass differential.
Transfer Markets
At a national level, schools with lower median LSATs and lower U.S. News rankings tend to lose more students to transfer, with those students typically enrolling at institutions with higher median LSAT scores and rankings. Conversely, those schools with the highest median LSAT scores almost exclusively have the lowest (or, in many cases, zero) transfer-out rates.
Moreover, transfer rates do appear to be related to the geographic location of a law school to some extent. Most notable is the geographic clustering of students transferring into schools in Washington, D.C., and the Georgia-Florida region of the southeast (see Figure 6). Also, Arizona saw some of the highest transfer-in rates of any jurisdiction in the country during our study period, possibly due to the closure of Arizona Summit Law School (we therefore exclude Arizona Summit and other restructured or closed institutions from our models). Transfers out also cluster in the Mid-Atlantic and southeast regions, with Florida, South Carolina, Delaware, and the District of Columbia seeing the highest transfer-out rates.

Transfer activity is more concentrated in some states and regions.
Examining some of these hotspots at a more granular level, it appears that many transfers occur in-region, although the proportion varies. For example, in Chicago, 67% of transfer students left the region; in the Los Angeles region, 51%; in Florida, 30%. Florida is somewhat of an outlier, which may be attributable to the fact that the jurisdiction has its own bar exam and does not offer reciprocity with any others. The regions where this pattern of in-region movement appears to be most notable are Chicago, the District of Columbia, Florida, Los Angeles, New England, and Texas.
For example, many students in Chicago transfer to other Chicago schools; Northwestern Law, a nationally renowned law school, sees nearly half of its transfer students coming from other Chicago schools. Figure 7 illustrates, for each school in the Chicago, District of Columbia, and Los Angeles regions, the origins and destinations of student transfer. Although many students transfer to a school within the same region, more than half transfer outside it.

Within some regions, many transfer students stay within region, transferring to higher-ranked schools.
Those that left the Chicago market transferred to a geographically diverse group of schools. For example, students transferring from the University of Chicago went to Columbia University, Harvard University, New York University, Stanford University, or Yale University. Likewise, those transferring out of John Marshall Law School (a school regionally located in proximity to others with higher U.S. News rankings) did so to attend an equally geographically diverse group of schools, including American University, Georgetown University, University of Notre Dame, and Washington University. The dispersion of students to such geographically diverse law schools might suggest that a good deal of the transfer activity is driven by more than just “transferring up.” It might also suggest that students are indeed seeking to “transfer up” given the destinations of John Marshall Law School’s transfer students. Or, it might suggest some combination of the two. Given the available data, we are unable to discern the driving force behind students’ decisions. (We have developed an interactive map that, for each school, details where and whence its students transfer. It is available at https://accesslex.shinyapps.io/law_student_transfer_pathways/.)
Transfer Index Effects on Transfer Rates
We find that the higher the transfer index value, the more likely a school is to transfer in students and less likely to transfer out students, holding each school’s LSAT-UGPA index constant. In terms of incidence rate ratios, a one-point increase in transfer index is associated with a 92 percent increase in a school’s transfer-in rate and a 32 percent decrease in transfer-out rate.
Thus, overall location in close proximity to other schools appears to favor higher-ranked schools by increasing the number of students transferring into the institution while decreasing the number transferring out.
Transfer Market Moderation
Up to this point, when exploring the relationship between bar passage differential and attrition and transfer rates, we have used a fixed effects approach to model within-school variation. This approach is useful but conditions out anything about a school that does not change over time (i.e., its geographic location, [largely] its ranking, and the proximity of other schools). The variation in transfer market index is one such time-invariant variable. Thus, we adopt a between-within modeling approach to explore the extent to which the effect of being in a more active transfer market influences the effects of changes in transfer-in and attrition rates on pass differential (note: AIC and BIC values preferred the between-within model to a partial pooling or random effects model). We include the transfer index variable in one model as a separate term only and in another as an interaction term. Model diagnostics strongly prefer the model without interaction terms.
On average, we find that transfer market index (i.e., the proximity of one law school to others with higher, lower, or similar rankings) has little influence on the relationship between a school’s attrition or transfer-in rate and its bar passage differential. Indeed, the coefficients and standard errors are largely the same with or without the transfer market index.
Discussion
Among the majority of schools, variation in a school’s rates of attrition and transfer does not appear to meaningfully affect its pass differential. Schools typically experience year-to-year variation in all three rates, especially schools with relatively small cohorts in which changes of only a few students attriting or transferring can produce a noticeable shift in attrition and transfer rates. Although attrition and transfer can still create harm and benefit, the lack of a strong relationship between these factors and institutional bar passage suggests that law schools carry out their attrition and transfer policies in good faith.
The pass differential for schools with high attrition rates decreases as the transfer-in rate increases, and the effect of higher attrition for schools with above-average transfer-in rates is negligible. Although this moderating effect exists on average across all law schools examined, it runs contrary to our expectations and fails to achieve a level of practical importance.
With respect to transfer index, we find that a school’s proximity to others and its relative ranking among this group of regional peers influences the number of students transferring both in and out. This relationship does not, however, appear to moderate or alter the effect of changes in a school’s attrition or transfer-in or transfer-out rates on its pass differential. Again, this finding does not support our expectations that schools with above-average transfer index values would benefit more from higher attrition and transfer-in rates.
We also look descriptively at those schools with above-average (1) attrition rates, (2) transfer-in rates, and (3) transfer index values. Only two schools meet these criteria: Florida International University (FIU) and Seton Hall University. Both schools are mentioned prominently in the work of Bahadur et al. (2021) and Kinsler and Usman (2018). Kinsler (2021) ranks FIU second overall and Seton Hall University thirteenth.
Looking more broadly, nine schools (FIU, Seton Hall University, and seven others; see Table 1) have both above-average transfer-in rates and above-average attrition rates. The majority of the schools in Table 1 either award degrees to minority candidates at a higher-than-average rate, enroll more part-time students than average, or have a more racially diverse faculty. Most notably, FIU encompasses all of these. This may suggest that these schools are “mission-driven,” meaning they consciously admit underrepresented students at higher rates, including those with lower LSAT scores who are less likely to pass the bar exam, in order to broaden access to legal education and the profession. This is not to say that underrepresented students should generally be expected to perform poorly on the bar; it is an acknowledgment of extant evidence that underrepresented minority students have lower odds of passing the bar exam (see, e.g., American Bar Association, 2021; Taylor et al., 2021). It is unlikely that these lower odds are attributable to students’ race but, rather, due to injustices imparted on underrepresented students caused by systemic racial and economic inequality at all levels of education (e.g., Carter & Welner, 2013; Chetty & Hendren, 2018; Jones & Nichols, 2020; Parrish & Hikido, 1998). Regardless, the bar passage disparity is a barrier that encourages some law schools to admit students of color at lower rates.
Comparison of Nine Schools with Higher-Than-Average Attrition and Transfer-In Rates

School was identified as a top 15 school by Kinsler (2021).
School was identified as a bottom 15 school by Kinsler (2021).
Combining our statistical results with a descriptive look at those schools with average or above- average attrition and transfer-in rates, we find no evidence that, on a national scale, leveraging attrition and transfer rates bolsters bar performance. This may indicate that student choice is driving transfers in and out of law schools. In line with the literature, students could simply choose to change based on personal reasons or increased opportunities available in different programs (e.g., Ryan, 2020). Attrition, on the other hand, is likely driven by a law school’s academic performance requirements. If law schools are using attrition to try and increase their bar passage rate (or their overall rank), it is not a very effective strategy. If anything, attriting struggling students in their first year robs them of an opportunity to improve. Burgeoning research in education suggests that students who are appropriately challenged and supported can do as well as students who enter school with higher credentials (e.g., Fischer & Massey, 2007).
Limitations
This research relies upon publicly available data that is reported annually to the ABA by each accredited law school. Since the data is self-reported, there are occasionally inconsistencies in the data, which are likely the result of simple data entry errors. In rare cases, intentional misreporting has been alleged. For example, in a March 2022 New York Times article, a professor at Columbia University challenged the school’s undergraduate U.S. News ranking, charging the university with manipulating data to increase its ranking. Moreover, in 2021, a former dean of Temple University’s business school was convicted of intentionally misreporting data in order to improve the school’s ranking and revenue.
We have taken great care to identify and correct any observed abnormalities. We find no evidence of manipulation in the data we use in this analysis. Notwithstanding, one common error we observed involves the reporting of attrition and transfer rates. Schools often adjust attrition rates reported for previous years to account for changes in their first-year class sizes. Considering this, we calculate the attrition and transfer rates for each school using their reported enrollment, attrition, and transfer counts rather than relying on the reported rate values.
Schools may also misreport attrition, attributing what should be first-year attrition to the second year. We have carefully examined the dataset and corrected those instances where this error was apparent. This is tricky, however, as academic attrition policies vary widely across institutions, with some placing students on academic probation following the first year and then attriting them only after they fail to meet a required benchmark in the third or fourth semester. Thus, a large number of second-year transfers may not necessarily indicate a data entry error.
We also exclude data for graduates who took the bar exam in 2020 or 2021. Although this allows us to avoid issues related to inconsistency with the bar exam due to the various adjustments and alterations in response to the COVID-19 pandemic, the downside is that we do not capture more recent changes in enrollment trends (e.g., increased admission rates for women, increases in matriculation).
Conclusion
Some researchers have expressed concerns that certain schools use their attrition and transfer policies to inflate bar passage rates (Bahadur et al., 2021), an interesting thesis worthy of attention considering the implications for academic and bar success professionals whose efforts to prepare law students for the bar exam could be undermined if certain institutions are found to take shortcuts to bar passage improvement. However, our findings do not indicate that this is happening on a national scale. Although changes in attrition rates are positively associated with changes in pass differential, on average, changes in transfer-in and transfer-out rates are negligibly associated.
Some actors in legal education have proposed that lower-ranked schools face undue difficulty complying with ABA accreditation standards because they are vulnerable to losing their top performers to higher-ranked schools via transfer (e.g., Garcia et al., 2016; Society of American Law Teachers, 2019). Given that lower-ranked schools are inherently more vulnerable to being harmed by this dynamic, some have suggested that a type of credit-sharing or acknowledgment of transfer students’ original law school in bar passage statistics is in order (Garcia et al., 2016; Society of American Law Teachers, 2019). The ABA also acknowledges in its Standard 316 Guidance Memo that some students may transfer out of a school and pass the bar exam as a graduate of another law school, and it enables noncompliant institutions to use evidence of such trends to demonstrate “good cause” to extend the time they are given to reenter compliance with the Standard (American Bar Association Section of Legal Education and Admissions to the Bar, 2019, p. 3).
Our results suggest that, on average, changes in a school’s transfer-out rates generally do not significantly harm its pass differentials, nor do changes in its transfer-in rates significantly bolster pass differentials. Nonetheless, law schools that fall only a percentage point short of the 75 percent benchmark may use our results to show that there is a high probability that losing students to transfer reduced their passage rate just enough to fall out of compliance. This argument is likely effective for schools with smaller cohort sizes, as a relatively small difference in the number of students passing the bar has a greater impact on their overall passage rate.
Supplemental Material
sj-docx-1-ero-10.1177_23328584231214526 – Supplemental material for Are Law Schools Cream-Skimming to Bolster Their Bar Exam Pass Rates? A Multilevel Regression Approach to Estimate How Attrition and Transfer Rates Affect Bar Passage
Supplemental material, sj-docx-1-ero-10.1177_23328584231214526 for Are Law Schools Cream-Skimming to Bolster Their Bar Exam Pass Rates? A Multilevel Regression Approach to Estimate How Attrition and Transfer Rates Affect Bar Passage by Jason M. Scott, Joshua L. Jackson and Andrea M. Pals in AERA Open
Footnotes
Declaration of Conflicting Interests
The author(s) declared no potential conflicts of interest with respect to the research, authorship, and/or publication of this article.
Funding
The author(s) received no financial support for the research, authorship, and/or publication of this article.
Supplemental Material
Supplemental material for this article is available online.
Notes
Authors
JASON SCOTT is director of research at AccessLex Institute, 10 North High Street Suite 400, West Chester, PA 19380; email:
JOSHUA JACKSON is criminal justice research manager at Arnold Ventures, 1776 I St. NW, Washington, DC; email:
ANDREA M. PALS is a senior research analyst at AccessLex Institute, 10 North High Street Suite 400, West Chester, PA 19380; email:
References
Supplementary Material
Please find the following supplemental material available below.
For Open Access articles published under a Creative Commons License, all supplemental material carries the same license as the article it is associated with.
For non-Open Access articles published, all supplemental material carries a non-exclusive license, and permission requests for re-use of supplemental material or any part of supplemental material shall be sent directly to the copyright owner as specified in the copyright notice associated with the article.