
Abstract
Holistic admissions practices require evaluating an applicant’s credentials in light of the opportunities available in their high school context. High school grades, test scores, and course taking are clearly related to college grades, retention, and graduation. But does performance in high school context also relate to college success? Building a unique dataset of 2.3 million students in a Midwestern state, we find that contextualized indicators of high school grades and standardized tests are strongly associated with student success in college, validating their use in holistic admissions. Contextualized grades have a stronger and more consistent association with college success than contextualized test scores, and may be most helpful at test-optional, test-free, and broader-access colleges that have yet to adopt holistic admissions practices.
Keywords
Higher education is a crucial driver of upward social mobility. Without a college degree, students from the lowest quintile of the national income distribution have a 45% chance of staying at the bottom, and a mere 5% chance of moving to the top quintile; with a college degree, similar students enjoy a 50% increase in the chances of moving out of the bottom quintile, and a four-time increase in chances of rising to the top quintile (Isaacs et al., 2008). Yet, access to high-quality higher education remains highly stratified along socioeconomic lines (Bastedo & Jaquette, 2011; Dynarski et al., 2021). Researchers frequently describe the undergraduate admissions practices of selective colleges as a “black box” (Rubin & González Canché, 2019). At once, this label captures not only the classified nature of what occurs behind closed doors, but also the ambiguity of holistic review criteria and its associated gatekeeping practices (Rosinger et al., 2021). Indeed, although some form of holistic review is near-ubiquitous throughout the selective admissions sector (Coleman & Keith, 2018; Lucido, 2015), its application varies within and across institutions; evidence suggests that while some admissions officers account for the opportunities an applicant has in their high school and neighborhood—which constitutes holistic review in its purest form (Coleman & Keith, 2018)—others simply read an applicant’s whole file (Bastedo et al., 2018).
However, admissions officers who evaluate an applicant based on measures of “contextualized” high school performance as opposed to “raw” performance—for example, by considering an applicant’s grade-point average (GPA) and standardized test scores in relation to others at their high school—are more likely to admit low-SES students (Bastedo & Bowman, 2017; Bastedo et al., 2018). Given that the proportion of low-income students at selective colleges has not increased since the 1970s (Bastedo & Jaquette, 2011), growth among students of color remains stagnant (Posselt et al., 2012), and degrees from highly selective colleges serve as agents of social mobility for those from low-SES backgrounds (Chetty et al., 2020; Dale & Krueger, 2014), this is welcome news. Evaluating student achievement in context aims to level the playing field among different applicants, who are coming from starkly different high schools, neighborhoods, and family backgrounds. By doing so, contextualized evaluation of high school performance seeks to make the admissions process more equitable by accounting for the varying levels of resources available to them. Contextualized holistic review avoids penalizing students from lower-resourced backgrounds if they have made the most of the opportunities made available to them. More importantly, it identifies highly talented students who have the potential to succeed and thrive in college.
Yet, research suggests that contextualized review has been adopted at a minority of colleges and mostly at selective colleges (Bastedo et al., 2018). This limited adoption may result from an undeveloped knowledge base on how students’ contextualized performance relates to their success in college, such as first-year GPA, retention, and graduation. Furthermore, even if using such contextualization practices, the high school information provided to admissions officers may be insufficient to allow for appropriate contextualization (Gaertner & Hart, 2013; Nicola, 2021). As a result, initiatives like the College Board’s Landscape initiative, adopted by over 180 selective colleges and scholarship programs, seek to provide more robust data on high schools and neighborhoods for use in holistic admissions processes (College Board, 2021). Contextualization of high school grades, in particular, will be crucial to holistic review in admissions offices that are test-optional and test-free, whose numbers have increased enormously during the COVID-19 pandemic. Before the pandemic, approximately 50% of 4-year institutions adopted test-optional policies; an additional 30% of 4-year institutions transitioned to test optional during 2020, temporarily or permanently (ACT, 2021). More than 1,800 of the 2,330 accredited 4-year colleges and universities in the United States do not require ACT/SAT scores from all or some of their fall 2023 applicants (FairTest, 2022).
To better inform the adoption of contextualized, holistic admissions practices, we aim to better understand students’ academic achievements in consideration of their high school environment. Using a unique dataset drawn from all high schools and 4-year public colleges and universities in a Midwestern state, drawing on data from 2.3 million students, we find that contextualized indicators of high school GPA and standardized tests are strongly associated with student success in college, validating their use in holistic admissions. Importantly, raw indicators of grades and tests often have slightly larger effect sizes than corresponding contextualized indicators, and can still play an important role in holistic evaluation. In addition, we find that contextualized grades have a stronger and more consistent association with college success than contextualized test scores, and may be most helpful at test-optional, test-free, and broader-access colleges.
The Importance of High School Context in College Admissions
Almost 7 decades after the Supreme Court abolished segregated schools in Brown v. Board of Education of Topeka, de facto segregation in American high schools persists (Clotfelter, 2004; Palardy, 2013; Reardon, 2011; Siegel-Hawley, 2013). School segregation along racial/ethnic lines has worsened over the past few decades (Frankenberg et al., 2019). With home values tied to property taxes (Chiodo et al., 2010) which, in turn, finance schools in the district (Ryan, 2010), lower-SES families are often barred from access to highly resourced schools (Shapiro, 2004; Siegel-Hawley, 2013). Students of different races, ethnicities, and socioeconomic backgrounds thus often grow and learn in high schools offering vastly different educational opportunities (Palardy, 2013).
Klugman (2012) sees differences in educational opportunity among high schools as stemming from respective schools’ programmatic, pedagogical, and social resources. In terms of programmatic resources, schools across the country vary in the quantity and quality of their curricular and extracurricular program offerings (Iatarola et al., 2011; Stearns & Glennie, 2010; Venezia & Kirst, 2005; Weis et al., 2014). Despite admissions officers consistently ranking advanced college-level coursework (i.e., Advanced Placement and International Baccalaureate courses) as a top consideration in college admissions (Clinedinst, 2019), majority low-income or minority-serving schools often have reduced access to these rigorous courses (Iatarola et al., 2011; Venezia & Kirst, 2005). The same applies to extracurricular program offerings: While extracurricular activities are yet another opportunity for students to distinguish themselves in college admissions (Stevens, 2007), the number and types of available extracurricular activities are closely linked to school poverty levels (Stearns & Glennie, 2010).
This situation is further exacerbated by gaps in different high schools’ pedagogical resources. Low-income, racial/ethnic minority students are concentrated in over-crowded, low-resourced schools with high student-to-teacher ratios: teachers and mentors who can motivate and guide students through choosing and successfully completing coursework are thus spread thin (Klugman, 2012). The dearth of pedagogical guidance extends to the college application process, with underrepresented students significantly less likely to access timely and tailored college counseling (Attewell & Domina, 2008; McDonough, 2005; Perna et al., 2008).
High schools are also characterized by disparities in social resources: Wealthy, predominantly white feeder schools have strong networks with elite colleges and universities (Glasener, 2021; Wolniak & Engberg, 2007). These institutions strategically target feeder schools when recruiting students (Salazar et al., 2021), and have developed trusting relationships with feeder school college counselors that influence admissions outcomes in ways that benefit students from these particular schools (Glasener, 2021; Stevens, 2007).
Contextualized Measures in Practice
While higher education institutions themselves cannot fundamentally change educational inequalities experienced by students in their pre-college years, holistic review in its purest form—defined as evaluating students using contextualized measures of performance—seeks to promote more equitable assessment of student merit by evaluating student achievement in light of the quality of educational opportunity provided to students within their own family, high school, and neighborhood context (Coleman & Keith, 2018). Recent research suggests that using this method of evaluation in college admissions increases the socioeconomic diversity of student admits. Gaertner and Hart (2013), for example, conducted a simulation study with data from the University of Colorado and found that incorporating information on levels of socioeconomic disadvantage—as opposed to solely raw measures of achievement—resulted in more low-income and minoritized students gaining admission. Bleemer (2023) found that implementing holistic review increased minoritized student enrollment at the University of California by about 7%.
Using a completely different study design, Bastedo et al. (2018) found that admissions officers espousing the principle of contextualized holistic review were significantly more likely, in a simulation, to admit a low-SES applicant from an underserved high school when provided with detailed information on high school context. Admissions officers were also more likely to admit a low-SES applicant when provided with contextualized measures of his or her standardized test score, such as how well the student performed on the test relative to his or her own high school peers (Bastedo et al., 2018). Similar results were found in two field experiments using historical college applications from participating admissions officers’ own institutions (Bastedo et al., 2021) as well as in real time, high stakes admissions decisions (Mabel et al., 2022). This benefit of using contextualized holistic review has been identified not only at selective institutions, but also at moderately selective institutions serving more than half of the college-going population (Gaertner & Hart, 2013).
While not necessarily introduced for the purpose of evaluating students in context, several admissions policies and practices have—either intentionally or unintentionally—allowed for some form of contextualized evaluation of student achievement. For example, class rank historically served as a useful data point that helped admissions officers judge a student’s academic performance in context (Balingit, 2015). High schools across the country are increasingly eliminating class rank, however, citing concerns that the metric fuels unhealthy competition among students, and detracts from meaningful learning by incentivizing students to take courses that boost their GPA. The importance admissions officers attach to class rank has thus fallen dramatically over the past decade, with only 9% of admissions officers surveyed by the National Association for College Admissions Counseling responding that they attributed “considerable importance” to class rank when making admissions decisions (Clinedinst, 2019).
Another admissions practice that—somewhat unintentionally—incorporates evaluation of high school performance in context are percent plans. True to their name, percent plans guarantee that a certain percentage of top-performing students at each high school will be admitted into a state public college or university (Klasik & Cortes, 2022). The uniform admission law, commonly known in Texas as the Top Ten Percent Plan, was built upon the rationale that the top students at each Texas high school should be given the opportunity to attend the state’s best universities—at a time when the large majority of applicants to the state’s flagship universities came from suburban high schools (Niu & Tienda, 2010). Only Texas guarantees eligible students access to its most selective public institutions, unlike California and Florida, which guarantee eligible students admission to a state university, but not necessarily of the student’s choice (Cortes & Lincove, 2016; Horn et al., 2003). The exact percentage of top students from each high school who are eligible for admission now vary among different campuses within the University of Texas system, with the University of Texas at Austin, for example, having lowered its threshold to the top 6% of each high school class. In the absence of direct empirical evidence on the effect of using contextualized measures of high school performance on admissions and college success, the literature on the effectiveness of Texas percent plans thus provides valuable insights.
Regarding the effect Texas “Percent Plans” have had on admission, many studies show that, in the long run, the policy failed to increase the pool of high schools from which Texas flagships admitted students. Klasik and Cortes (2022), for example, by analyzing 18 years’ worth of Texas high school students applying to state flagships, argue that students from traditional feeder high schools on flagship campuses continue to dwarf the population of students from other high schools. Along similar lines, studies also highlight that the seeming increase in students’ racial/ethnic diversity after the Percent Plan can be misleading. After considering the surge in the number of Latinx students in the Texas high school graduate population, Flores and Park (2013) found that the Percent Plan had but minimal effect on increasing college access for Latinx students. These studies, along with many others (e.g., Fletcher & Mayer, 2014; Long & Tienda, 2008), conclude that the purported benefits of percent plans in securing student diversity appear to be overstated.
The literature has also examined how admitting by class rank affects the quality of college admits. Critics, mostly through media outlets, have claimed that the Percent Plan unfairly privileges high-achieving students from less competitive high schools at the expense of better-prepared students from more competitive high schools (e.g., McKinley, 2009). Empirical studies, however, have found little support for these claims. Niu and Tienda (2010), for instance, used 1990–2003 administrative data from the University of Texas at Austin to show that while top decile students from low-SES high schools were admitted with lower average standardized test scores than their lower-ranked peers from more competitive feeder high schools, these students showed comparable or even better performance on various college success indicators upon being admitted. Not only did these students consistently score higher freshman and 4-year cumulative GPAs than their lower-ranked peers from feeder or affluent high schools, they were also consistently less likely to drop out after freshman year. Niu and Tienda (2012) further examined the relative influence of high school class rank and standardized tests in predicting college success, this time drawing upon administrative data for five Texas universities of differing selectivity, and found that class rank is a stronger predictor of college GPA, retention, and graduation. Fletcher and Mayer (2014), using more expansive data from both Texas A&M and the University of Texas at Austin, also failed to find evidence supporting criticisms that the Percent Plan resulted in admitting students who were underprepared for college.
Improved contextualized data has been recently provided on a national level, through data dashboards ported directly to admissions offices. Landscape—a dashboard-type tool provided by the College Board—was specifically designed to better implement contextualized, holistic review in a more systematic, consistent manner. Prior to the introduction of Landscape, the primary route through which admissions officers gleaned information on context was through high school profiles (Nicola, 2021). However, high school profiles have no standardized format and are not always required by higher education institutions: This meant that admissions officers lacked high school information on approximately 25% of college applications. Public and majority low-income student-serving schools, in particular, were less likely to provide key contextual information that admissions officers were interested in (NACAC, 2020). Landscape, on the other hand, provides indicators of a student’s high school and neighborhood context in a standardized format, to supply time- and resource-constrained admissions officers with consistent, easily digestible information on the context behind each student’s application. An early simulation experiment with eight pilot universities found that, in a low-stakes study environment, these institutions admitted more low-income, non-feeder school students when incorporating context indicators into their admissions decisions (Bastedo et al., 2021). Mabel et al. (2022) follow up on these results by using administrative admissions records from 3,791,026 college applicants from 43 Landscape pilot institutions, collected over four admissions cycles (three before the implementation of Landscape, and one in the first year of implementation). The authors found that when colleges were provided with standardized information through Landscape, applicants from the most disadvantaged school and neighborhood contexts experienced a 5 percentage point increase in probability of admission when compared to similar applicants in the prior year (Mabel et al., 2022). Enrollment did not increase, however, suggesting that institutions have further work to do in yielding the more diverse classes they have admitted.
Although we have some indication of how contextualized measures affect admissions outcomes for underrepresented students, we know comparatively less about how students admitted using contextualized measures perform in college once admitted. The large number of studies examining the link between high school performance and college success (Atkinson & Geiser, 2009; Hoffman & Lowitzki, 2005; Sawyer, 2013; Zwick & Sklar, 2005) provide limited insight into this matter, as most tend to operationalize high school performance as raw achievement (e.g., raw high school GPA, raw SAT scores) rather than student achievement in relation to peers at the same high school (e.g., high school class rank, contextualized SAT scores). However, existing studies that do account for contextualized performance suggest a positive relationship. The aforementioned Texas Percent Plan studies, for example, show that students who outperformed their peers in the context of their own high schools (i.e., ranked in the top 10%) showed comparable, or even better, college performance compared to their lower-ranking peers from more selective feeder schools (Niu & Tienda, 2010). Another study from an Ivy League institution found that high school class rank was positively associated with college GPA, above and beyond raw high school GPA and standardized tests (Baron & Norman, 1992), and a study from a less selective public research university yielded similar results (Cohn et al., 2004). High school class rank has also been found, in one study at least, to be positively associated with college retention and graduation (Wohlgemuth et al., 2007). The literature examining the link between college success and rigorous course-taking in high school—yet another measure of contextualized high school performance—presents a similar picture. While studies are more divided on whether taking rigorous courses in high school improves students’ college admissions outcomes (Attewell & Domina, 2008; Bastedo et al., 2016; Karp et al., 2007), those examining the link between (1) taking rigorous, upper-level courses such as AP, honors, and dual enrollment in high school and (2) college success indicators including college GPA, retention, and graduation, consistently suggest a positive relationship (Adelman, 2006; Karp et al., 2007; Long et al., 2012; Karp et al., 2007; Mattern et al., 2013). Long et al. (2012), for example, found that taking rigorous courses in Florida high schools raised students’ college GPA and likelihood of graduating within 4 years—a finding also backed by studies from Texas (Radunzel et al., 2014) and Florida (Karp et al., 2007). Ackerman et al. (2013) further demonstrate that while participating in high school AP programs had an overall positive association with college GPA, this relationship was not linear. The authors found that Georgia Tech students who participated in AP courses and ultimately achieved a qualifying score not only earned higher college GPAs, but also took more challenging college courses, and graduated at higher rates with shorter time-to-degree.
Use of High School Performance Indicators in Admissions Decisions
The literature examining the link between high school performance and college success has mostly done so by testing the validity of various measures of interest (e.g., raw high school GPA, standardized test scores) as predictors of college achievement, and evaluating the usefulness of each measure in terms of how strongly they are correlated with and/or predict the dependent variable of interest (Kobrin et al., 2008). However, a number of studies caution that defining the usefulness of a predictor solely in terms of the strength of its correlation with a dependent variable of interest can be misleading (Sawyer, 2013; Zwick, 2013): While correlations are undoubtedly important, they may also mask a more layered understanding of relationships of interest if interpreted without appropriate information on the context in which they were derived. Zwick and Himelfarb (2011), for example, found that using raw high school GPA scores alone as a predictor yields misleadingly high predicted first-year college GPA for students from lower-achieving high schools, compared to their peers from higher-achieving high schools. They attributed this systematic prediction error to the fact that raw measures fail to account for differences in educational contexts among high- and low-performing high schools, which in turn leads to errors in predicting college performance for specific student subgroups.
The Standards for Educational and Psychological Testing (2014), jointly released by the American Educational Research Association, the American Psychological Ass-ociation, and the National Council on Measurement in Education, also call for a more comprehensive assessment of raw measures. When characterizing one’s competence or attitudes, the Standards recommend that “multiple sources of information should be used, alternative explanations for test performance should be considered, and the professional judgment of someone familiar with the test should be brought to bear on the decision” (p. 71). The Standards underscore the importance of considering students’ “opportunity to learn” while evaluate their academic performance, to avoid “misdiagnoses, inappropriate placements and/or services, and unintended negative consequences” (p. 71). According to the Standards, additional measures that address students’ learning opportunities and achievement in their educational contexts should be considered in addition to raw credentials that were traditionally used in admissions.
There are further reasons to support why the usefulness of a selection variable for admission to college, like raw GPA or test scores, should not be defined solely on the strength of its correlation to college success outcomes. Sawyer (2013) highlights that correlations are in effect simply the variance in an outcome variable that is explained by another variable of interest, and persuasively argues that admissions officers in real world settings do not consider explained variance in college performance—however defined—as their only guiding principle in deciding which students to admit. In a holistic admissions process, while admissions officers aim to identify students who will have academic success, they also seek to identify applicants who display high potential to contribute to and benefit from attending their institution, even if these students may not necessarily be the highest performing in terms of raw achievement. This body of research thus highlights the need to take a more comprehensive view of the validity of predictors when evaluating their relative importance for evaluation in admissions.
Building upon this literature, our study examines whether contextualized measures of high school performance are associated with meaningful measures of college success. Specifically, we examine the following research questions: (1) Is there a relationship between contextualized measures of high school performance (operationalized as high school GPA and standardized test scores) and college success? (2) Is there a relationship between “maxing out” high school curriculum opportunities (taking a high school’s most rigorous courses) and college success?
Data and Methods
Our data are drawn from a medium-sized Midwestern state’s Department of Education database (DOE). The data are provided by three separate sources: (1) all public high schools within the state, (2) the state’s ACT test database, and (3) the state’s fifteen public universities. The high school dataset includes information such as courses and associated instructors, grades, credits, and course type, as well as demographics. Overall, the high school data have over 27 million observations for over 2.3 million high school students. The ACT Test database includes scores for all ACT sections and subsections. The university data are similar to the high school data. They include all information normally seen on a student’s transcript, such as course information, grades, choice of major, enrollment status, and demographic information, including a Pell Grant indicator, which we use to proxy for low-income status.
This state was chosen because the DOE not only collected all high school transcripts for students graduating from public high schools from 2010 to 2015, they also mandated the ACT for all high school juniors during this time period. This allowed us to construct contextualized high school performance measures otherwise unavailable in any national dataset, as ACT and College Board will not, by policy, provide average test scores by high school. Furthermore, because the state also collects transcript data from all public universities within the state, we could match students’ high school records to their college records.
The high school data contained raw records from each school and revealed significant variability across institutions and across years within the same institution. We followed a strict, intensive protocol to clean the high school data due to these inconsistencies and dropped 32% of schools accounting for 20% of high school graduates. Analysis showed that many of these were alternative high schools or failed charter schools. Given the time and strenuous cleaning process used for schools with adequate data, we are confident that the data in our study are comparable across high schools and years within the same high school.
Sample
To be included in the final dataset, a student needed their first 3 years of transcript data in the high school database, which we used to calculate high school GPA. The high school GPA variable we used in this paper was not weighted for honors and AP coursework. We constructed this GPA figure (their complete grades through their junior year of high school) specifically to mimic the data point most admissions counselors use during application review. Likewise, the student must also have attended a public university within their home state. Complete matched records were found for 77,804 students, who were 75% of in-state, first-year students in public records available for each institution. While the 25% missing rate may seem high, this missing rate includes students who attended private high schools, who account for 10% of total high school graduates (NCES, 2017). Concurrent analyses with exact administrative data from one institution indicate the data are missing at random and did not influence the demographic makeup of the sample. Descriptive statistics for the sample are in Tables 1 and 2.
Descriptive Statistics of Sample—Demographics (N = 77,804)

4-year graduation rate includes two of the three cohorts.
Descriptive Statistics of Sample—High School Demographics and Performance (N = 77,804)

Contextualized variables are in standard deviation units.
Variables
Several dependent variables were used to assess college outcomes, including first-year GPA, first-year retention, and 4-year graduation. First-year GPA is the grade point average of a student prior to their second fall term. First-year retention is a binary variable indicating whether a student was enrolled during the fall term of their second year.
A number of metrics were used to measure high school performance, including high school GPA and ACT scores. Raw high school GPA is measured as the grade point average for the first 3 years of high school coursework. Further, grades are not weighted for honors and AP coursework, and all are rounded to the nearest letter grade. For each of these raw performance metrics of GPA and ACT, we created a contextualized score. This is equal to the raw score minus the median score at a student’s high school, divided by the standard deviation of the score at the school. Thus, the contextualized high school GPA measures how far a student is from the median student in their high school.
The final set of independent variables relate to course selection and rigor. We created an ordinal scale that corresponds to course progression in high school: This scale adds one point for each additional course per year taken in math, science, or English, and one additional point for potential AP enrollment, up to five total potential points for each subject. Contextualized measures were also created for math, science, and English course selection measures, respectively: These measures show how far (in standard deviations) a student progressed in math, science, and English offered by their school. The contextualized score for English curriculum rigor, for example, takes a student’s maximum value for English course level, divides this by the maximum value of English course level offered within the student’s school, and then standardizes this value. All the contextualized measures were created based on (and are thus relative to) all students graduating from a given high school in a given year for whom we had transcript data and test scores.
Analytic Strategy
We used a combination of ordinary least squares (continuous dependent variables) and logistic regression models (binary dependent variables) with separate fixed effects for student college major, institution, and college cohort, as well as institution by cohort fixed effects (Long, 1997). Adding these fixed effects will prevent unobserved variation at institution-level, college cohort-level, major-level, and institution by cohort-level, from biasing the estimates. For instance, we believe that major fixed effects could account for (and take out) the variability due to students’ selection of their major, required GPAs to get into a major, and/or different grading practices between majors. We also control for student characteristics of gender, race/ethnicity, and Pell status, as well as a set of school- and district-level covariates, such as expenditures per full-time enrolled (FTE) student at the district level, percent of students of color, percent of free and reduced-cost lunch students at the school level, and high school urbanicity.
For linear regression models:

where DVi is the continuous dependent variable of interest, namely first-year GPA for student i. IVi is the independent variable of interest, Di is a vector of demographic covariates, Si is a vector of high school covariates, FEi is a set of fixed effects, and εi is the error term. To interpret the effect of independent variables in each model, and for comparability across models, partial eta squared was calculated. This represents the amount of variation in the outcome that a single variable can explain in the model.
For logistic regression models:

where DVi is the dichotomous dependent variable of interest, which include first-year retention, and 4-year graduation outcomes for student i. IVi is the independent variable of interest, Di is a vector of demographic covariates, and Si is a vector of high school covariates, and FEi is a set of fixed effects. As partial eta squared effect sizes cannot be computed for logistic regression models like they can be for linear models, we chose to run a linear model with the dichotomous outcome variables to estimate a partial eta squared for effect size.
For each combination of our independent and dependent variables of interest, we ran an overall model for all institutions, as well as within-institution models for each institution at a time. We also ran a model including all contextualized measures of high school performance, and another model including all raw measures of high school performance. We then proceeded to calculate the Variance Inflation Factor (VIF) in each of these respective models, to measure the amount of multicollinearity in regressions. Both models displayed VIFs over 20, indicating that the independent variables correlate at high levels. Considering that VIFs exceeding 10 signal serious multicollinearity problems, we decided against adding these models to our final results. Because we have a range of public institutions—from selective state flagship to broader-access institutions—we are able to observe how estimates for relationships between raw and contextualized high school performance and college success might differ among institutions.
Limitations
Because there have been limited studies of contextualized constructs in predicting college success or admissions outcomes, we considered many potential methods of operationalizing these constructs using our available transcript and test score data. Each of these alternatives yielded similar results in our models. Nonetheless, there could be other constructs created to test contextualized measures (e.g., Bastedo et al., 2016), which could potentially yield differing results. Given the importance of these measures to admissions work, further work on testing the reliability and validity of alternative conceptualizations is warranted.
This study uses a set of fixed effects to improve the accuracy of our estimates of the relationship between admissions metrics and causal outcomes. However, our analysis should be interpreted as largely correlational, not causal. This study does not provide definitive proof of a relationship between incoming measures, such as raw and contextualized GPA and college success, but it does, in some cases, show strong associations.
Another issue for drawing causal inference is the potential endogenous selection bias that arises because our sample conditions on students who have “succeeded” by enrolling in college. Endogenous selection bias stems from direct conditioning on the outcome variable, a post-outcome variable, a post-treatment variable, and/or a pre-treatment variable, and has been highlighted as a core problem inhibiting researchers from drawing causal inferences (Elwert & Winship, 2014). It is technically possible to avoid endogenous sample selection bias by not conditioning on post-treatment variables; however, addressing this issue can be challenging in practice—especially when conditioning is implicitly embedded in the data collection process, as is the case of this paper.
That said, in the absence of a direct policy change that would allow for a quasi-experimental study, and considering the obvious ethical and legal concerns that prevent institutions from advancing randomized controlled trials, we believe our results represent the most appropriate format from which to evaluate contextualized admissions. At present, we are unaware of a similar quantitative, large-scale, state-wide study considering the relationship between contextualized achievement relative to high school peers and college success outcomes.
Finally, admissions is not equivalent to enrollment. Mabel et al. (2022), for example, using real-world administrative data, show that while incorporating information on student context increased the probability of admission for students from disadvantaged backgrounds, the probability of these students enrolling in their admitted institution was unchanged. While contextualized indicators may help admissions officers craft a diverse class, future studies should examine how to increase student yield.
Results
Table 3 shows the summary of our findings, which demonstrate the overall relationship between our independent and dependent variables of interest for all 15 institutions. In general, contextualized high school performance (i.e., contextualized GPA, contextualized test scores, and contextualized curriculum rigor) is significantly associated with indicators of college success (i.e., first-year college GPA, first-year retention, and 4-year graduation). The overall estimates for all institutions show that both raw and contextualized high school GPA have the strongest association with all outcomes (as indicated by the largest effect sizes), followed by ACT scores, and curriculum rigor subject levels.
Summary of Findings

Note. Each coefficient (odds ratio) and effect size represent an individual linear (logistic) regression model with all covariates and fixed effects. Adj. = Adjusted; HS GPA = High School Grade Point Average; OR = Odds Ratio.
p < .001, **p < .01, *p < .05.
Across all institutions, contextualized high school GPA has the largest effect sizes when the outcome is college GPA, followed by graduation within 4 years, followed by retention after 1 year. We also observe similar trends for other independent variables, that is, both raw and contextualized measures of high school performance show the strongest correlation with college GPA, followed by 4-year graduation, and have the weakest relationship with retention after the first year.
For Tables 4 to 12, “Total” shows the overall estimate (coefficient/odds ratio and effect sizes) for all 15 institutions, corresponding with the estimates in Table 3. Tables 4 to 12 further display the estimates from within-institution models (from institutions A to O) and add important information that was not captured by the overall estimates. For instance, high school GPA and ACT scores are not significantly associated with first-year retention at a few institutions within our sample, although the overall estimate indicates a significant relationship. Similarly, both raw and contextualized math, science, and English curriculum rigor measures are generally associated with college GPA at a statistically significant level, but they are not significantly associated with retention and graduation at some universities in our sample.
Coefficient and Effect Sizes for High School GPA Variables and First-Year College GPA

Note. Each coefficient/effect size represents an individual linear regression model with all covariates and fixed effects. Inst. = institution.
p < .001, ** p < .01, * p < .05.
Coefficient and Effect Sizes for High School ACT Composite Variables and First-Year College GPA

Notes: Each coefficient/effect size represents an individual linear regression model with all covariates and fixed effects. Inst. = institution.
p < .001, ** p < .01, * p < .05.
Coefficient and Effect Sizes for High School English Curriculum Rigor Levels and First-Year College GPA

Note. Each coefficient/effect size represents an individual linear regression model with all covariates and fixed effects. Inst. = institution.
p < .001, ** p < .01, * p < .05.
Coefficient and Effect Sizes for High School Math Curriculum Rigor Levels and First-Year College GPA

Note. Each coefficient/effect size represents an individual linear regression model with all covariates and fixed effects. Inst. = institution.
p < .001, ** p < .01, * p < .05.
Coefficient and Effect Sizes for High School Science Curriculum Rigor Levels and First-Year College GPA

Note. Each coefficient/effect size represents an individual linear regression model with all covariates and fixed effects. Inst. = institution.
p < .001, ** p < .01, * p < .05.
Odds Ratios and Effect Sizes for High School GPA and First-Year Retention

Note. Each odds ratio/effect size represents an individual logistic regression model with all covariates and fixed effects. Inst. = institution.
p < .001, ** p < .01, * p < .05.
Odds Ratios and Effect Sizes for ACT Composite Variables and First-Year Retention

Note. Each odds ratio/effect size represents an individual logistic regression model with all covariates and fixed effects. Inst. = institution.
p < .001, ** p < .01, * p < .05.
Odds Ratios and Effect Sizes for High School GPA and 4-Year Graduation
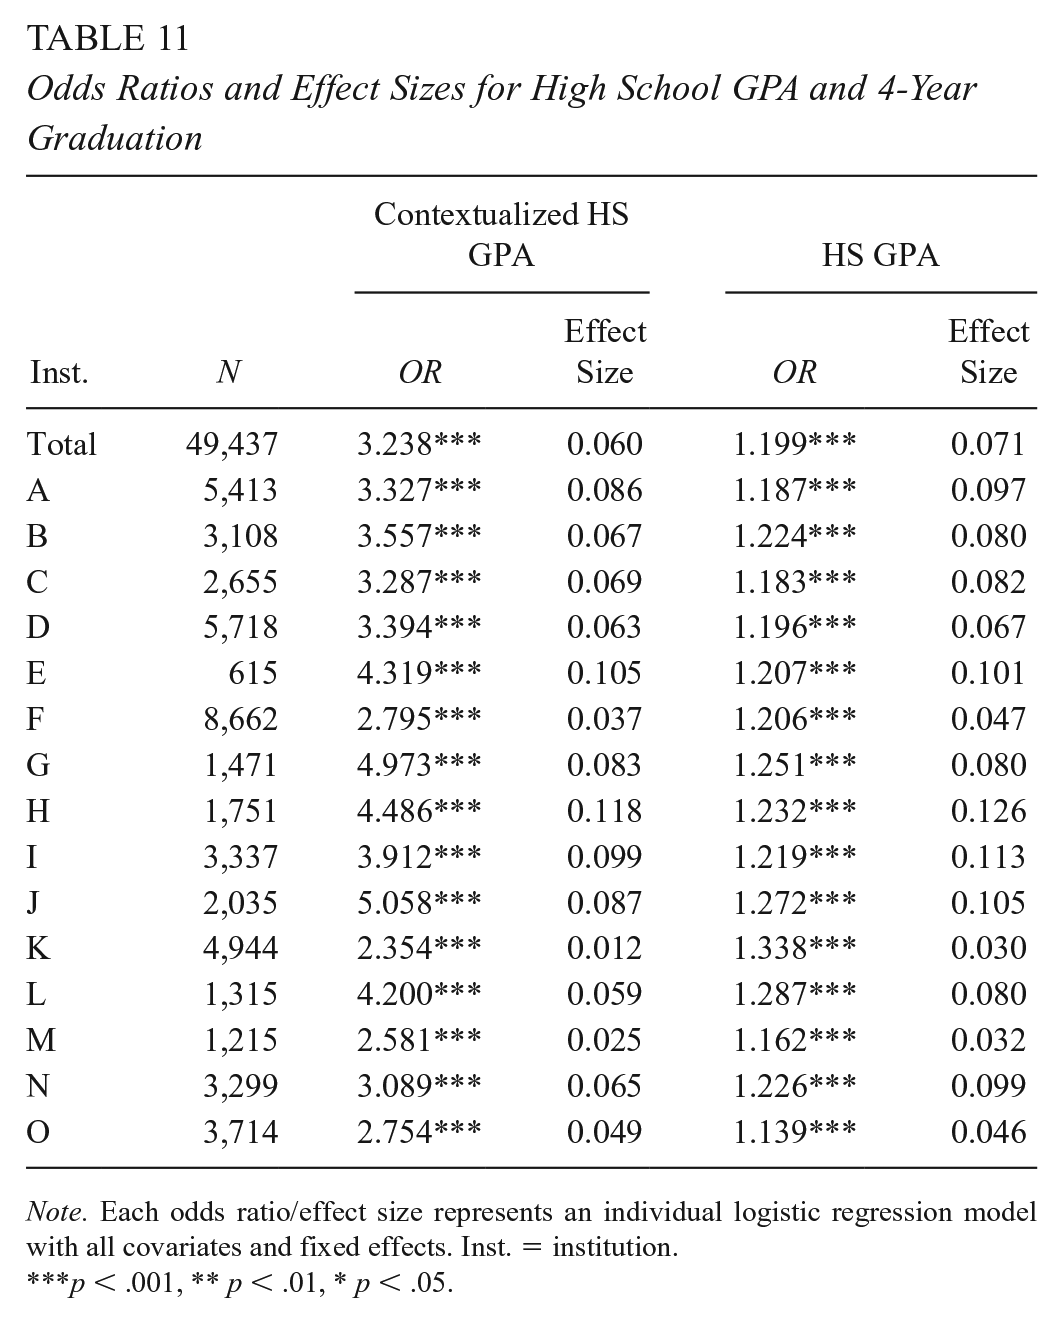
Note. Each odds ratio/effect size represents an individual logistic regression model with all covariates and fixed effects. Inst. = institution.
p < .001, ** p < .01, * p < .05.
Odds Ratios and Effect Sizes for ACT Composite Variables and 4-Year Graduation

Note. Each odds ratio/effect size represents an individual logistic regression model with all covariates and fixed effects. Inst. = institution.
p < .001, ** p < .01, * p < .05.
Results are discussed in detail below. For contextualized variables, coefficients represent the relationship between a one standard deviation unit increase in the independent variable and the outcome. To interpret raw results, coefficients represent the relationship between a 0.1-point change in high school GPA or a one-point change in ACT and the outcome.
As shown in Table 5, ACT scores, whether contextualized or not, are significantly associated with first-year GPA, but their effect sizes are smaller than those for high school GPA, as illustrated by Figure 1. For instance, at Institution A, a one standard deviation increase in ACT score from one’s high school median accounts for 7.5% of the residualized variation in first-year college GPA, slightly lower than the effect sizes associated with raw ACT composite scores (8.0%). Contextualized ACT scores accounted for around one-third of the variation in first-year college GPA, compared to contextualized high school GPA, suggesting that contextualized high school GPA measures are more strongly associated with first-year college GPA than contextualized ACT scores.

Effect Sizes for High School GPA and ACT Composite Scores on First-Year College GPA.
Surprisingly, although most admissions offices emphasize the importance of curriculum rigor (Clinedinst, 2019), both contextualized and raw curriculum rigor variables (English, math, science) exhibit the smallest effect sizes in their relationship with college GPA. As shown in Tables 6 to 8 and Figure 2, of the three subjects, both contextualized and raw math levels are associated with the largest effect sizes at all institutions in our sample. For instance, at institution N, each unit of increase of contextualized math level attainment accounts for 4.8% of the residualized variation in first-year GPA. In contrast, at the same institution, each unit of increase of contextualized English and science level attainment account for only 1.7% and 2.2% of the residualized variation respectively.

Effect Sizes for Contextualized High School Curriculum Rigor Levels on First-Year College GPA.
Contextualized and raw measures of ACT composite scores were statistically significantly related to first-year retention across most institutions in our sample. However, at a few institutions (three out of 15 for contextualized ACT composite, and two out of 15 for raw ACT composite) these relationships were not significant. Also, effect sizes for institutions that displayed statistically significant relationships between ACT and first-year retention were much smaller for ACT-related measures than high school GPA-related measures. For instance, the largest effect size for the relationship between contextualized ACT composite score and first-year retention is 0.023, explaining only 2.3% of the variation in first-year retention. Models testing the relationship between English, math, and science curriculum rigor with first-year retention show even weaker results. There are more institutions at which the relationship is not statistically significant, and effect sizes for estimates are also much smaller than those obtained for our other variables of interest. As was the case for models estimating college GPA, contextualized and raw measures of high school GPA showed the strongest relationship with first-year retention.

Effect Sizes for Contextualized High School GPA on First-Year College GPA, Retention After the First-Year, and Graduation Within 4 Years.
While ACT-related measures and curriculum rigor variables are significantly related to 4-year graduation, the effect sizes associated with these variables of interest are much lower in comparison to those associated with high school GPA-related variables. For example, at Institution G, if a student’s high school GPA is one standard deviation above their high school’s median GPA, his or her odds of graduating within 4 years are 5.0 times greater, accounting for an estimated 8.3% of the residualized variation. In short, being a full standard deviation above one’s median high school GPA is associated with 2 to 4 times higher odds of graduating college within 4 years. In contrast, a standard deviation increase in ACT score from one’s high school median is generally associated with 1 to 2 times higher odds of graduating college within four years, accounting for an estimated 2% to 5% of the residualized variation.
Discussion and Implications
Recent research suggests that contextualizing students’ academic performance in relation to their high school and neighborhood is associated with an increased likelihood of admitting applicants from low-SES backgrounds (Bastedo & Bowman, 2017; Bastedo et al., 2021; Gaertner & Hart, 2013; Mabel et al., 2022). However, the performance of students admitted through contextualized holistic review has thus far remained largely uninvestigated, and is thus open to challenge from outside actors who may seek to undermine holistic review practices. This study thus examined the relationship between contextualized high school performance and various college success indicators to provide empirical support for the implicit assumptions behind evaluating students in context.
Our findings show that contextualized high school performance, including contextualized GPA, contextualized test scores, and contextualized curriculum rigor, are significantly associated with indicators of college success, such as college GPA, retention, and graduation. Interestingly, contextualized GPA had a stronger, more consistent relationship with college success than did contextualized standardized test scores; this trend was found across all 15 institutions in our study sample. Out of all tested measures of high school performance, measures of high school curriculum rigor—whether raw or contextualized—held the least importance. They did not hold a consistent, statistically significant relationship across the study’s 15 institutions, and also displayed the smallest effect sizes in terms of their relationship with college success indicators.
These findings extend our knowledge of the relationship between students’ contextualized high school performance and college success, which have so far mostly been limited to studies of class rank (Baron & Norman, 1992; Niu & Tienda, 2012) and a study of Colorado’s experiment in contextualized admissions (Gaertner & Hart, 2015). Our study, drawing upon data for the majority of public high schoolers within an entire state, is the first of its kind testing the underlying assumptions of contextualized review using large-scale, multi-year, non-self-reported transcript-level data. Our study therefore adds considerable weight to the usefulness of evaluating student performance in context, which is crucial to contextualized, holistic review. Our findings also provide more detailed insight into specifically which measures of contextualized high school performance may prove useful. Contextualized high school GPA displayed the largest effect sizes in terms of relationship with college success indicators, followed by contextualized standardized test scores, and then high school curriculum rigor. This suggests that using contextualized HSGPA may be most helpful when making holistic admissions decisions, especially under a college success lens.
Our findings also suggest that contextualized measures of high school performance could be useful at a much broader range of institutions. Discourse has thus far focused mostly on more selective institutions, where 95% of institutions report using some form of holistic review (Bastedo et al., 2018). However, less selective institutions may also have reason to evaluate students in context, as undergraduate retention and graduation rates are consistently lower than those found at their more selective counterparts (NCES, 2020). Major efforts are underway at many institutions to improve retention and graduation rates (University Innovation Alliance, 2021). It is therefore notable that our study findings generally held across all 15 institutions in our sample, which are characterized by widely varying levels of institutional selectivity. Our study findings suggest that evaluating students in context may allow institutions to identify students who will show strong academic achievement in college and graduate successfully. These findings also support dashboard interventions that provide admissions officers with robust data on applicants’ high school and neighborhood contexts (College Board, 2021).
Our findings also inform the growing number of colleges and universities that have test-free and test-optional admissions policies, especially when higher education institutions have predominantly shifted towards test-optional or test-free policies, whether permanently or temporarily (FairTest, 2022). Despite the growing use of test-optional practices, the influence of test-optional admissions on equity for low-income students and students of color remains contested. There is a small but growing systematic test-optional literature that uses quasi-experimental designs while suggesting no or weak effects of test-optional policies on increasing racial/ethnic and socioeconomic diversity for incoming students (Belasco et al., 2015; Bennett, 2021; Saboe & Terrizzi, 2019; Sweitzer et al., 2018), in contrast with what was earlier proclaimed by the proponents of test-optional policies and findings based on single case studies (Hiss & Doria, 2011; McDermott, 2008). After all, while standardized test scores have long been criticized as undermining equity in college admissions due to their high correlation with test-takers’ socioeconomic status and race/ethnicity (Toldson & McGee, 2014), it is also highly questionable whether remaining information in a student’s application file—after removing standardized test scores from the mix—by themselves allow admissions officers to make more equitable decisions. Admissions officers may simply rely on other data—such as participation in AP and IB classes—to make decisions similar to those they had made before the implementation of test-optional policies (Baker & Rosinger, 2020; Rodriguez & Camacho, 2022). Other admissions or enrollment management practices, particularly use of early admissions and maximizing tuition revenue, may mitigate any positive effects (Bastedo, 2016). Findings from this study add to these ongoing debates by suggesting that rather than relying solely on test-optional policies, higher education institutions should consider incorporating contextualized measures of high school performance alongside other additional measures to increase diversity.
Finally, this study emerges against the backdrop of pending Supreme Court decisions that may possibly ban race-conscious admissions in higher education institutions across the country (Liptak & Hartocollis, 2022). The Supreme Court has, in the past, consistently ruled that universities may use race/ethnicity as one factor among many when making admissions decisions, as far back as the landmark Regents of the University of California v. Bakke case in 1978, and as recently as 2016 (Howe, 2022). However, the Supreme Court recently heard oral arguments for two separate lawsuits,—one against Harvard, the other against the University of North Carolina at Chapel Hill—both of which call for considerations of race/ethnicity to be completely outlawed in college admissions altogether. If the proposed ban on race-conscious admissions becomes reality, using contextualized measures of student achievement may be one of the few legal means available to try to maintain racial/ethnic diversity among college admits.
Future iterations of this work will thus also consider contextualized performance among various sub-populations, including heterogeneous effects for underrepresented minority and low-income students, as well as women, and students in STEM fields such as engineering. In addition, future research could also examine the effectiveness of using contextualized high-school performance in predicting academic potential for students who have discrepant high school GPA and test scores. Given that students with lower raw test scores and good high school performance are disproportionately low-income students, underrepresented students of color, women, first-generation students, and English learners (Bennett, 2021; Hiss & Doria, 2011; Syverson et al., 2018), contextualized high-school performance can, in particular, provide valuable information and potentially improve the admission outcomes for these traditionally underrepresented student groups.
Moreover, strong college GPA and successful retention and graduation are not the only bases upon which to admit students; rather, other student qualities, such as their ability to contribute to diversity on campus and thrive in society, can be equally important to admissions officers (Clinedinst, 2019; Coleman & Keith, 2018). As a result, future studies should incorporate other measures to examine the contribution of students in a more diverse range of college and post-college outcomes, such as participation in graduate and professional school as well as public service professions, measures of civic participation, and post-graduation income.
Footnotes
Funding
The authors disclosed receipt of the following financial support for the research, authorship, and/or publication of this article: This research was funded by the National Science Foundation, Research on the Formation of Engineers (Grant No. 1947114). Any opinions, findings, and conclusions or recommendations expressed in this material are those of the authors and do not necessarily reflect the views of the National Science Foundation. This research result used data structured and maintained by the MERI-Michigan Education Data Center (MEDC). MEDC data is modified for analysis purposes using rules governed by MEDC and are not identical to those data collected and maintained by the Michigan Department of Education (MDE) and/or Michigan’s Center for Educational Performance and Information (CEPI). Results, information, and opinions solely represent the analysis, information, and opinions of the authors and are not endorsed by, or reflect the views or positions of, grantors, MDE and CEPI or any employee thereof.
Authors
MICHAEL BASTEDO is a professor of education in the Center for the Study of Higher and Postsecondary Education at the University of Michigan, where he also serves as Associate Dean for Research and Graduate Studies in the School of Education. His recent resea-rch focuses on college admissions, enrollment management, and inequality.
MARK UMBRICHT is the Director of Data Analysis and Research for the University of North Carolina System. He holds a PhD in higher education from Pennsylvania State University.
EMMA BAUSCH is a doctoral candidate in the Center for the Study of Higher and Postsecondary Education at the University of Michigan. Her dissertation considers how prospective college students and their families interpret financial aid offers, think about paying for college, and eventually choose a college.
BO-KYUNG BYUN is a doctoral student in the Center for the Study of Higher and Postsecondary Education. Her research interests revolve around issues of access and equity in college admissions, with a particular focus on holistic admissions practices, both in the U.S. and Korean context.
YIPING BAI is a doctoral student in the Center for the Study of Higher and Postsecondary Education. Her research interests involve studying the education inequality among race/ethnicity, socioeconomic status, and urbanicity, as well as evaluating the effects of education policies along these lines, to more equitably serve different student populations.