
Abstract
We examine the effects of disseminating school-level academic performance data—achievement status, achievement growth, or both—on parents’ school choices and their implications for racial, ethnic, and economic segregation. Many researchers consider growth to be a superior (if still imperfect) measure of school effectiveness relative to status. Moreover, compared to status, growth has weaker relationships with schools’ demographic compositions. We conduct an online survey experiment featuring a nationally representative sample of parents and caretakers of children ages 0–12. Participants choose between three randomly sampled elementary schools drawn from the same school district. The provision of status information guides participants toward schools with higher achievement status and fewer Black, Hispanic, and economically disadvantaged students. The provision of growth information and the provision of both types of academic performance data guide participants toward higher growth schools. However, only growth information—alone, and not in concert with status information—tends to elicit choices with desegregating consequences.
Keywords
Framed in the abstract, most Americans express support for school diversity. In 2021, 84% of American adults considered it at least somewhat important that public schools in their community “have a mix of students from different racial/ethnic backgrounds” (Potter et al., 2021). But there is reason to question the sincerity of this sentiment—especially when it comes to translating intention into behavior. Americans’ support for diverse schools may have limits when it runs counter to their freedom to choose where to live or where to send their own children to school.
Expressed intentions aside, schools in the United States remain racially defined. White students, on average, attend schools in which roughly two-thirds of their fellow students are also White. Meanwhile, Black and Hispanic students, on average, go to schools where roughly two-thirds of their fellow students are also Black or Hispanic (De Brey et al., 2019). The concentration of students by race and ethnicity often occurs even within putatively diverse districts: “Even white families that choose to live in racially diverse school districts . . . often make neighborhood and school selections that enroll their children in the district’s ‘whitest’ schools rather than schools that fully reflect the larger community’s diversity” (Turner et al., 2021, p. 2).
The resilience of school segregation is grounded in powerful systemic forces that flow from a long history of legal and extralegal discrimination in housing and educational opportunity as well as parental fears, suspicions, beliefs, and misbeliefs (Rothstein, 2017). Achieving diverse schools at scale will depend on addressing these issues, but it is not clear that either the political will or the governmental capacity to do so exist at present. However, two developments could potentially alter the landscape of American education in ways that could nudge families in the direction of selecting more diverse schools. On their own, such behavioral shifts are unlikely to undo centuries of segregation in one fell swoop, but they could improve meaningfully on the status quo.
The first development involves the increase of public school choice options that partially uncouple school assignment from a family’s place of residence. Although communities across the United States are rapidly diversifying, residential segregation remains a persistent feature of American life (Lichter et al., 2015). To the extent that these demographic divisions endure, short-term progress on school desegregation may rely on loosening the relationship between families’ home addresses and their school assignments. However, the integrative promise of school choice reforms has thus far been met mostly with disappointment, as many families choose schools in a manner that exacerbates rather than diminishes existing segregation (Frankenberg & Lee, 2003; Garcia, 2008; Kotok et al., 2017; Weiher & Tedin, 2002).
The second development is the growing availability of academic performance data that more accurately capture schools’ contributions to student learning rather than merely reflecting the social and economic advantages borne by the students they serve. Conventional wisdom often holds that the “best” schools are those attended primarily by the children of the most socially and economically privileged families. Many of these schools are, indeed, highly effective institutions, but so are many other schools that have largely positive effects on their students’ educational outcomes—even if those students have fewer initial advantages. The collection and dissemination of better measures of school effectiveness could weaken the relationship between Americans’ perceptions of school quality and the racial, ethnic, and economic composition of the student body. If so, then the conditions may be more favorable moving forward for the posited desegregating consequences of school choice.
We distinguish between two ways of measuring students’ academic performance: achievement status and achievement growth. Achievement status (sometimes referred to as achievement levels or simply achievement) measures students’ academic performance at a single point in time. Examples of school-level status include average standardized test scores or the percentage of students scoring above a predesignated proficiency threshold. Following the passage of the No Child Left Behind Act of 2001, all states were required to calculate and disseminate achievement status information for each school (Hess & Petrilli, 2007). Scholars criticized the use of achievement status as an indicator of school performance, arguing that school-level status largely reflects the demographic composition of the student body rather than the school’s effectiveness (Angrist et al., 2022; Chingos & West, 2015; Rothstein et al., 2008; J. Schneider, 2017).
Achievement growth measures the rate of improvement in students’ academic performance over time. There are multiple ways to measure growth, ranging from a simple year-to-year difference in an individual student’s test scores to more complex statistical models that compare a student’s performance to peers with similar prior test scores and, in some cases, similar demographic backgrounds (when aggregated to the teacher or school level, the latter approach is often referred to as a value-added model; Castellano & Ho, 2013; Harris, 2011). Growth has two chief advantages over status as a measure of school quality. First, because school-level growth measures changes in academic performance during students’ time in school, it more accurately reflects the effects of educators on student learning (Stiefel et al., 2011). Second, school-level growth has much weaker underlying relationships with most student demographic characteristics, making it easier to identify highly effective schools, regardless of the kinds of students they serve (Reardon, 2019).
Beginning in 2005, states could apply to the U.S. Department of Education to supplement their NCLB-mandated status-oriented accountability systems with an additional growth-based indicator (U.S. Department of Education, 2005). Following the passage of the Every Student Succeeds Act of 2015 (ESSA), all states are required to use multiple measures to assess school performance (Barone, 2017). As of January 2020, 43 states and the District of Columbia had calculated school-level indicators of growth and included this information in addition to school-level status in their annual school report cards (Data Quality Campaign, 2020).
In this article, we examine the effects of disseminating academic performance data—status, growth, or both—on parents’ school choices and their implications for racial, ethnic, and economic segregation. We conduct an online survey experiment featuring a nationally representative sample of parents and caretakers of children ages 0–12. In this experiment, participants make a series of choices between three randomly sampled elementary schools drawn from the same school district (the districts themselves are also randomly sampled from all districts serving Grades 3–8 nationwide, with sampling weighted by district size). To guide this choice, participants receive a range of demographic information about each school. In addition, some participants are randomly assigned to receive information about each school’s average status, average growth, or both.
One commonly expressed reservation about survey experiments is that they sacrifice external validity (the capacity to generalize the results beyond the experimental context) in the pursuit of internal validity (the capacity to generate an unbiased estimate of the average effect of the treatment). By their nature, they are artificial and contrived. We share that reservation, but we have also taken some unusual steps to reduce artificiality. We ask participants to choose between real schools in real school districts using actual academic performance and demographic data. Participants complete this exercise six times. For one of these exercises, they choose between three randomly selected schools drawn from their own local school district.
In the absence of either status or growth information (i.e., the control group), we find that participants tend to choose schools that are relatively White and affluent (and, as a result, high status) as well as close to home. The provision of status information steers participants toward higher status schools, which also tend to be less Black, less Hispanic, and more affluent than the schools chosen by the control group. By contrast, the provision of growth information steers participants toward higher growth schools, which are, on average, less White and less affluent than the schools chosen by the control group. The provision of status and growth information steers participants toward schools with higher status and higher growth—but not toward schools that are any more diverse than those chosen by the control group. In the context of our experiment, only the provision of growth information—alone and not in concert with status information—tends to elicit choices with desegregating consequences. These effects are modest in magnitude: Growth information tends to guide participants toward schools that are approximately 0.07 standard deviations (SD) less White and 0.05 SD more economically disadvantaged, relative to the range of racial and economic variation in a given district.
Literature Review
School Choice and School Segregation
The nation’s history of school choice is tightly entwined with its history of school segregation, but the relationship is neither simple nor straightforward. Families’ choices among schools, school sectors, and school districts have often frustrated efforts to create schools that are internally diverse. Advocates have long maintained that policies that increase the number of educational options for families can also increase school diversity by allowing students to attend schools outside their own neighborhood (e.g., Osborne & Langhorne, 2017). However, the evidence supporting this argument is decidedly mixed. In many circumstances, the expansion of school choice appears to exacerbate rather than ameliorate existing patterns of segregation (Bifulco et al., 2009; Frankenberg & Lee, 2003; Garcia, 2008; Kotok et al., 2017; Weiher & Tedin, 2002).
In one of its early iterations, school choice was a tool with the expressed intent of preserving racial segregation—one element of the “massive resistance” southern states mounted in response to Brown v. Board of Education (Orfield, 1969). By closing or defunding public schools while providing White families with tuition grants to attend private segregated academies, districts deliberately cultivated school choice as a strategy to sidestep the Supreme Court’s order to desegregate public schools. As federal courts shifted their focus to segregated schools in the north and the west, additional forms of school choice emerged as vehicles available to White families reluctant to have their children attend integrated schools. Most visible and important was the choice to engage in “White flight” to suburban districts that were overwhelmingly White and armed with a variety of policy tools to help keep them that way (Holme & Finnigan, 2018).
School choice is not always anathema to diverse schools. Some have touted it as a less politically contentious and more sustainable policy instrument for integration (Kahlenberg, 2001, 2012; Osborne & Langhorne, 2017). Magnet schools—schools with special themes and for which enrollment is not strictly limited by neighborhood attendance zones—emerged in the late 1960s primarily as a tool for encouraging White families to send their children to more integrated schools in more integrated neighborhoods (Goldring & Smrekar, 2000; Steel & Eaton, 1996). Charter schools—publicly funded but privately run schools that also allow families to choose them regardless of their neighborhood of residence—emerged in the 1990s. Although charter schools were promoted primarily based on their potential to improve student performance, early advocates also argued that they could result in school communities that were more demographically diverse (Hassel, 1999). Like magnet schools, charters weakened the tight bond between school demographics and the demographics of the surrounding neighborhood. If parents exercised choice based on race-neutral criteria, such as academic performance, it was argued, charters could provide more demographically integrated schooling options than those available in traditional districts with assigned zones that reified segregated housing patterns. However, empirical research suggests that the proliferation of charter schools has been more likely to increase rather than decrease racial, ethnic, and economic segregation within school districts (Finnigan et al., 2004; Frankenberg & Lee, 2003; Garcia, 2008; Kotok et al., 2017; Marcotte & Dalane, 2019; Monarrez et al., 2022). On the other hand, growth in the charter school sector also corresponds with declining segregation between districts (Monarrez et al., 2022). Moreover, a small core of advocates, schools, and funders are committed to creating charters that are “diverse by design.” In 2018, researchers at the Century Foundation found that 20% of charters showed some consideration of diversity in their school model, and they identified 125 intentionally diverse charter schools with an institutional commitment to racially and economically integrated enrollment (Potter & Quick, 2018).
Outside such variations as magnet and charter schools, the standard portrayal of public education in the United States is of a system comprising place-based neighborhood schools with enrollment limited to those within defined attendance zones. This was—and still is—accurate overall, but it was never as monolithic as portrayed, and its dominance has been waning. With limited publicity and often without a broad policy or plan, school districts have quietly incorporated elements of the magnet and charter school models into their standard operating procedures. One manifestation of this is “open enrollment,” a form of public school choice that allows students to transfer to any school within a district (intradistrict open enrollment) or between districts in the same state (interdistrict open enrollment) as long as space is available (Wixom, 2019). Relatedly, a number of districts have adopted a “portfolio management model” in which the central district oversees an array of different types of schools with a variety of student assignment mechanisms (Bulkley et al., 2020; Hill et al., 2013). In such school districts as Denver, New Orleans, and Washington, D.C., students are able to apply to any school in the district via a single common application system (Hesla, 2018). Given the absence of clear programmatic distinctions between various forms of contemporary intra- and interdistrict choice models, a consensus on their segregating or desegregating consequences has yet to emerge.
The literature’s failure to provide a consistent link between choice and school diversity reflects in part its tendency to refer to school choice in a broad and undifferentiated manner that fails to draw potentially important distinctions among types of choice. One distinction has to do with the difference between place-based school choice (actuated via residential relocation) and non-place-based school choice that eliminates the link between residential location and eligibility to attend a school. A second distinction is between interdistrict choice and intradistrict choice. A third involves the difference between laissez-faire choice (actuated by unregulated individual family decisions) and managed choice, wherein government and other institutions attempt to channel choices in socially desirable directions, via regulations, incentives, or information provision. These various types of choice differ in ways likely to affect the extent and direction of change as well as the likelihood of engendering enthusiastic uptake versus resistance and backlash. Our analysis in this article focuses on non-placed-based, intradistrict choice, with specific attention given to the question of whether government can steer choices toward more diverse schooling outcomes through policies regarding information dissemination.
Academic Performance Information and School Choice
When asked about what they value most when choosing schools, parents generally emphasize academic quality (Kleitz et al., 2000; M. Schneider et al., 1998). Yet Internet search data indicate that parents inquire for information about other school characteristics—such as student demographics—more often than they inquire about student achievement (Dougherty et al., 2013; Schneider & Buckley, 2002), and comments by other parents appear to hold greater weight than do official school ratings (Valant & Newark, 2020). Studies of revealed school preferences based on parents’ rank-ordered choices in districts that employ a centralized application system suggest that parents prioritize student test scores and other measures of achievement status, student demographics, and proximity to home (Denice & Gross, 2016; Glazerman & Dotter, 2017; Harris & Larsen, 2019). In these and similar contexts, parents generally do not appear to value schools with higher rates of achievement growth (Abdulkadiroglu et al., 2020; Ainsworth et al., 2020; Glazerman & Dotter, 2017; cf. Beuermann et al., 2023). This, however, might be explained by the fact that most Americans are largely unaware of how their local schools perform in this regard (Ainsworth et al., 2020; Houston et al., 2022).
The availability of academic performance information in easily accessible formats can influence parents’ school evaluations and choices (J. Schneider et al., 2019). Large-scale field experiments in New York City, Charlotte-Mecklenberg, New Orleans, and Romania demonstrate that the distribution of easy-to-understand academic performance information can increase enrollment in higher performing schools (Ainsworth et al., 2020; Cohodes et al., 2022; Hastings & Weinstein, 2008; Valant & Weixler, 2020). The experiments in New Orleans and Romania are particularly relevant to our study, as they indicate that the distribution of information about student growth can steer parents toward higher growth schools (Ainsworth et al., 2020; Valant & Weixler, 2020).
To understand the effects of academic performance information on school preferences more generally—rather than in the context of specific locations—other researchers have embedded hypothetical school choice experiments in online surveys. Houston and Henig (2021) find that providing district-level student growth information can steer individuals toward higher growth and more diverse districts when exercising residential choice within a metropolitan area. Haderlein (2021) employs a discrete choice experiment to assess the relative weight that participants place on different elements of information when choosing between schools. She finds that parents’ school choices are influenced by information about student growth when such data are available.
We build upon the efforts of previous survey experimental research along several important dimensions. First, we explore choices between schools rather than choices between districts (Houston and Henig [2021] focus on the kind of district-level choice a family might make when moving to a new region of the country). Second, our experiment features a nationally representative sample of parents and/or caretakers of young children (Houston and Henig [2021] and Haderlein [2021] rely on nonrepresentative samples recruited via Amazon’s MTurk). Third, participants in our experiment choose between real schools in real districts based on real demographic and academic performance data (Haderlein [2021] asks participants to choose between hypothetical schools, which allows schools’ attributes to vary across more potential combinations, but which also comes with a likely cost to external validity). Restricting choices to genuine options forces respondents to make difficult decisions between schools that differ in degree but not sharply in kind, possibly muting the patterns of selection we can isolate, but improving the verisimilitude of our experimental context. Moreover, drawing school options from a representative sample of districts provides us the opportunity to learn about the kinds of districts where the provision of status and/or growth information may facilitate desegregation, where it would likely have no effect, and where it could potentially exacerbate preexisting segregation. Lastly, to enhance the realism of our experiment, we also ask participants to choose a school from a set of options located in their own local school district. We expect some of the participants to recognize some of these schools, allowing them to supplement the information that we provide with their own personal knowledge of the schools and their reputations.
Methods
School Data
We use the Stanford Education Data Archive v4.0 (SEDA) for measures of school-level average achievement status, average achievement growth, and student demographics (Educational Opportunity Project, 2022; Fahle et al., 2021). SEDA contains school-level test score and demographic data for nearly every U.S. public school that serves students in Grades 3–8 from 2009 to 2018. We focus on the subset of elementary schools (defined as containing Grade 3) that are in districts that have at least three such schools. This subset consists of 31,391 schools in 2,894 districts. For each school, we use the empirical Bayes grade cohort scale estimates of average status and average growth, pooled across all grades, years, and subjects. Because status and growth data are only available for Grades 3–8, our analysis is limited to parents’ school choices in this grade range. SEDA’s measures of status and growth rely on test score data from the U.S. Department of Education’s EDFacts Data Initiative, which are aggregated at the grade-year-subject level. Ideally, growth is estimated by using individual student-level data; growth estimates based on aggregated data can be biased by student mobility within the unit of aggregation. However, comparisons of SEDA’s growth estimates and those generated by state longitudinal student data systems show that the two are closely correlated (Reardon et al., 2019).
The SEDA website features a graphical user interface that allows general users to explore school- and district-level academic performance data without specialized software. This platform features simplified language when reporting such values as status and growth. We adopt the same language used on the website as of March 2021. When presenting status information for a school, we use the phrase “Average Test Scores: Students score ___ grade levels above/below the U.S. average.” When presenting growth information for a school, we use the phrase “Learning Rates: Students learn ___% more/less each grade than the U.S. average.” By adopting the same language as the SEDA website, we ensure that participants encounter the SEDA data in the same format in our experiment as they would if they encountered it on their own.
Survey Experiment
We partnered with the survey research firm YouGov to recruit a nationally representative sample of 2,800 parents/caretakers of children ages 0–12 for an online survey. The survey took place March 16–31, 2021. Prior to survey administration, we preregistered our study on the American Economic Association’s registry for randomized controlled trials.
The survey begins by randomly assigning participants to one of four groups:
Control group: Participants receive neither status nor growth data when choosing schools.
Status group: Participants receive status data when choosing schools.
Growth group: Participants receive growth data when choosing schools.
Both groups: Participants receive both status and growth data when choosing schools.
Next, the survey asks participants to identify their local school district. We provide each participant with a list of one or more school districts associated with their zip code, based on the 2019 school district geographic relationship files maintained by the U.S. Department of Education (Geverdt, 2021). Six percent of participants do not recognize any of the school districts on their list. Furthermore, 17% of participants live in zip codes in which the local district does not contain three eligible elementary schools from which to choose; they are not asked to identify their local district.
All participants are then given the following prompt: Please imagine that you are looking for a new school for an elementary school-age child in your family. We will provide basic information about three schools from one school district. This information comes from the Stanford Education Data Archive, which provides accurate data about real schools across the United States. You will be asked to choose the school that best meets the needs of your family.
The next survey item features a choice between three randomly sampled elementary schools drawn from a randomly sampled district (with district sampling weighted by total enrollment to produce a proportional number of large and small districts). Participants repeat this task six times, each with three schools sampled from a different district. In one instance, participants choose between three schools drawn from their own local school district. If participants are unable to identify their home district or if they live in a district without three elementary schools, all six of the districts they encounter are random. To avoid ordering effects, the position of the home-district item in the survey sequence is random.
For each school option, all participants receive a series of demographic and geographic data points: total enrollment; the percentage of White, Black, and Hispanic students; the percentage of students of another race/ethnicity; the percentage of economically disadvantaged students (defined as eligible for free or reduced-price lunch, or FRPL); the percentage of students with limited English proficiency (LEP); and the distance from home (which is set to vary randomly between 10, 20, and 30 minutes away). In addition, participants in the status group receive information about the school’s average status, participants in the growth group receive information about the school’s average growth, and participants in the both group receive both of these types of academic performance information (with the order of the information randomized). See Figure 1 for an example of a school choice survey item as seen by a participant in the both group.

Excerpt from survey experiment.
We acknowledge that a choice set consisting of three schools randomly selected from a district does not fully represent the many barriers to school access that are unequally distributed across a community, often structured by historical and contemporary racial discrimination. Some elements of our experiment (such as allowing the distance to each school to vary randomly) do not fully reflect the geography of inequality in the United States. One can imagine an experiment with features that ours lacks, such as situating schools geographically within the Cartesian space of each district, situating participants geographically within those same spaces, and ensuring that participants’ locations reflect the patterns of residential segregation present in each district. Such an experiment would have limitations of its own. Namely, we would need to make strong assumptions about participants’ locations based on their demographic characteristics.
Moreover, because we are asking participants to reveal their preferences regarding socially sensitive issues, we acknowledge that participants’ responses may be influenced by social desirability bias (e.g., understating their preferences for Whiter and more affluent schools, under the assumption that such preferences may reflect poorly on them). Such bias likely does influence our estimates of the average preferences in each of the experimental groups. However, the propensity to be affected by social desirability bias ought to be equally distributed across experimental conditions; therefore, such bias is unlikely to influence our estimates of the average differences between groups.
Analytic Approach
To check for demographic balance between experimental groups, we use the following ordinary least squares (OLS) regression equation:
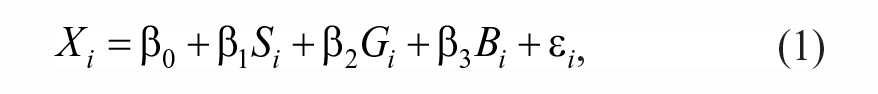
where
To estimate the average effects of status and/or growth information on the characteristics of the schools chosen by participants, we use the following equation:

where
Equation (2) does not control for the demographic variables that we use when checking for balance between experimental groups. We do not observe any precision gains when including demographic covariates in the model, nor do we observe any important differences between the unadjusted and adjusted results (Table B1). Moreover, when the covariates are excluded from the model, the value of the intercept becomes substantively meaningful: the average outcome of the control group. For these reasons, we focus on the unadjusted values in the text.
We also consider how the average effects of status and/or growth information vary by participants’ racial identity and household income by using the following equation:

where
We intentionally limit ourselves to these specific individual-level treatment effect heterogeneity analyses for two reasons. First, examining how the effects of status and/or growth information vary by participants’ race and household income has important theoretical and practical implications for our understanding of the intersection of parental school preferences and racial and economic segregation. Second, by restricting the individual-level heterogeneity analyses to a small subset of possible combinations, we reduce our exposure to the multiple comparisons problem that arises with each additional statistical test. Both categorizations—White/person of color and household income greater/less than $100,000—offer imperfect representations of the salient racial and economic cleavages. In each case, considerable within-group variation is obscured by the cut-point. We opt for these categories to evaluate the segregative or desegregative consequences as parsimoniously as possible, but we acknowledge that neither captures the full range of potential demographic divisions that apply to this question.
Lastly, we also explore how the average effects of status and/or growth information vary by the demographic compositions of the school districts in which the choices take place. To conduct this analysis, we construct a long-form data set in which each participant appears five times: once for each non-home-district choice. We then use the following equation:

where
For equations (1), (2), and (3), we calculate heteroskedasticity-consistent (HC2) standard errors (MacKinnon & White, 1985). For equation (4), we calculate cluster-robust (CR2) standard errors, clustered at the participant level (Bell & McCaffrey, 2002).
Findings
Balance and Missing Data
Table 1 displays the frequencies of participants’ demographic characteristics by experimental condition. There is only one instance in which the demographic profile of an experimental group is statistically distinguishable from the control group: Participants in the growth group are about 1 year older on average. Table 1 also displays the average characteristics of the schools that participants encounter when making their choices. We observe no statistically significant average differences between the experimental groups.
Balance and Missing Data
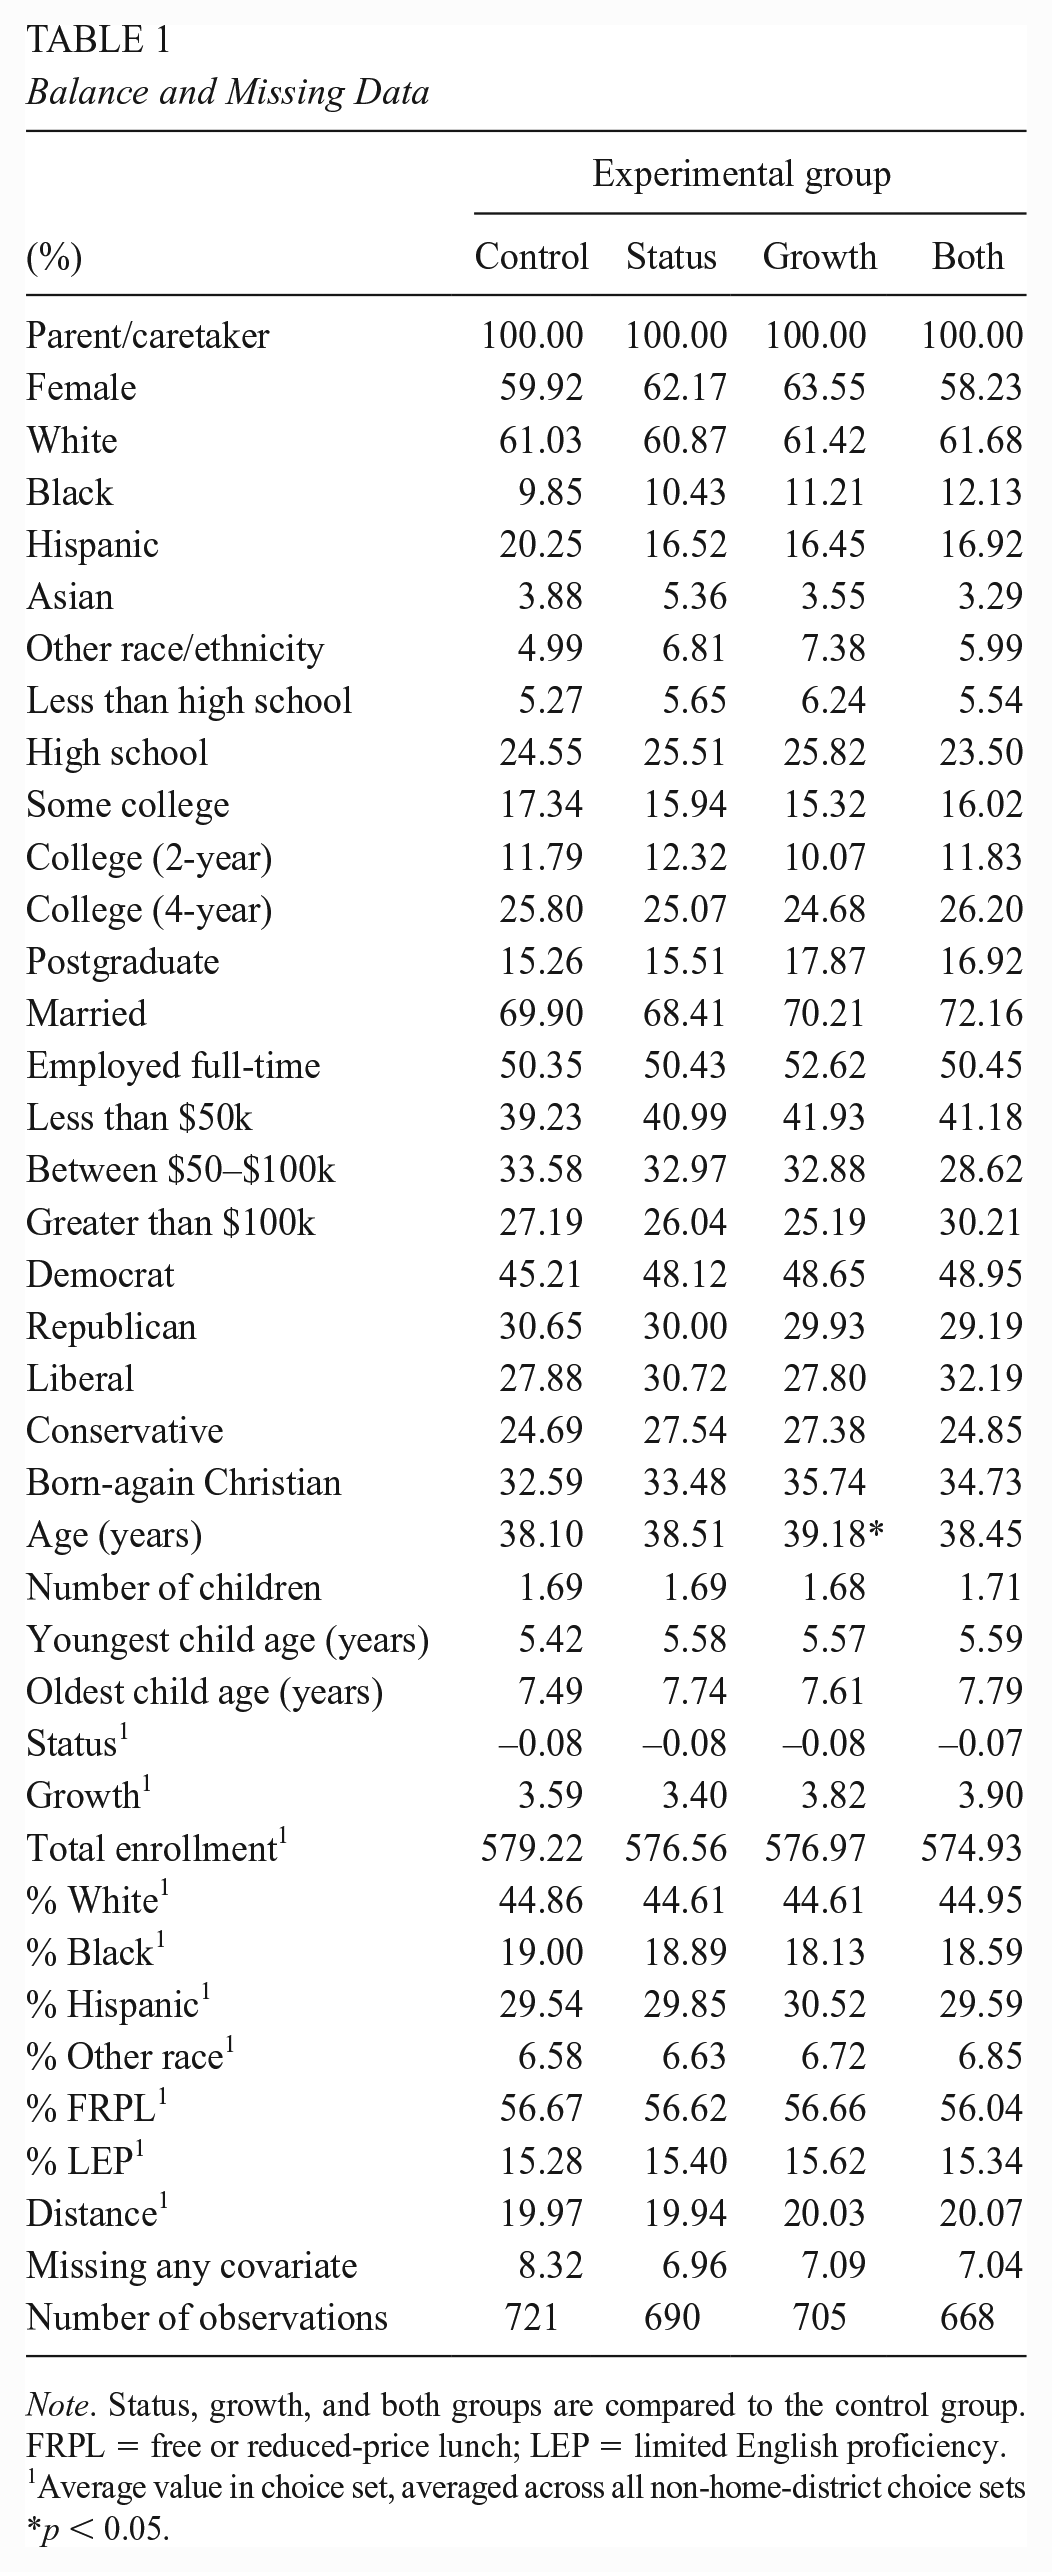
Note. Status, growth, and both groups are compared to the control group. FRPL = free or reduced-price lunch; LEP = limited English proficiency.
Average value in choice set, averaged across all non-home-district choice sets
p < 0.05.
Our original sample consists of 2,800 participants. We are missing outcome data for 16 participants, reducing our analytic sample to 2,784. Depending on the experimental group, about 7%–8% of participants are missing data on at least one of the demographic variables. For analyses in which we adjust for demographic differences between experimental groups (Table B1), we impute an arbitrary value for the missing data and control for an indicator of missingness.
Average Effects of Status and/or Growth Information
Figure 2 displays the primary results of our study: the average characteristics of the schools chosen by participants in each of the four experimental groups (see also Table A1).

Average characteristics of chosen schools.
Relative to the choice set mean (represented by zero on the y-axis), participants in the control group choose schools with higher status (0.17 SD), lower enrollment (–0.05 SD), a larger White population (0.21 SD), a smaller Black population (–0.07 SD), a smaller Hispanic population (–0.09 SD), a larger population of students of other races/ethnicities (0.09 SD), a smaller FRPL-eligible population (–0.21 SD), and a smaller LEP population (–0.13 SD) and schools that are closer to home (–0.28 SD).
Compared to their peers in the control group, participants in the status group choose schools with higher status (0.14 SD), higher growth (0.10 SD, likely because status and growth are modestly correlated at the school level), higher enrollment (0.06 SD), a smaller Black population (–0.06 SD), a smaller Hispanic population (–0.07 SD), a larger population of students of other races/ethnicities (0.05 SD), and a smaller population of FRPL-eligible students (–0.07 SD) and schools that are farther from home (0.11 SD).
Compared to their peers in the control group, participants in the growth group choose schools with higher growth (0.35 SD), a smaller White population (–0.07 SD), a larger population of FRPL-eligible students (0.05 SD), and a larger population of LEP students (0.05 SD) and schools that are farther from home (0.15 SD).
Compared to their peers in the control group, participants in the both group choose schools with higher status (0.07 SD), higher growth (0.25 SD), and higher enrollment (0.05 SD) and schools that are farther from home (0.14 SD).
To summarize, in the absence of either status or growth information, participants tend to choose schools that are relatively White and affluent (and, as a result, higher status) as well as schools that are closer to home. The provision of status information alone steers participants toward even higher status, higher growth, less Black, less Hispanic, more affluent, and more distant schools. The provision of growth information alone steers participants toward higher growth, less White, less affluent, and more distant schools. The provision of both types of academic performance information steers participants toward slightly higher status, higher growth, and more distant schools—but only insofar as those choices do not lead to schools that are less White or less affluent than those chosen by the control group.
In the context of our experiment, the provision of status information has only modest educational benefits for the individual while also exacting large social costs. Status information guides participants toward slightly more effective (i.e., higher growth) schools, but it also influences school choices in ways that can actively exacerbate racial and economic segregation. By contrast, the provision of growth information guides participants to more effective schools in ways that run counter to the conventional wisdom that the “good” schools almost always serve students who are White and affluent. The provision of both types of academic performance information also guides participants toward more effective schools, but it does not appear to have the same desegregating consequences as the provision of growth information alone.
Home District Analysis
Based on their zip codes, we are able to match 2,148 participants (77% of the sample) to the school district where they live. Figure 3 displays the results of the analyses that focus on participants’ choices between three schools in their home district (see also Table A2). The magnitudes and directions of the average effects in participants’ home districts are largely consistent with the effects that we observe in randomly sampled districts, but the results are less precise. This loss of precision occurs for two reasons. First, the sample size is smaller. Second, there is greater variation in the outcomes. In the non-home-district analyses, we average the characteristics of participants’ chosen schools over multiple different choices, reducing the overall variation in these characteristics. In the home-district analyses, we estimate the effects of status and/or growth information on participants’ choices in the context of a single choice set, resulting in a wider distribution of school characteristics. As a result, the average effects we observe in the home-district analyses are not always statistically significant.

Average characteristics of chosen schools in home district.
Individual-Level Treatment Effect Heterogeneity
For a better understanding of the effects of status and/or growth information on school segregation, we consider how the results vary by participants’ race and household income. Specifically, the tendency of growth information to steer participants toward less White and less affluent schools would only have desegregating consequences if growth information steered White participants toward less White schools and affluent participants toward less affluent schools. If the effects of providing growth information are concentrated among participants of color and/or low-income participants, then the resulting social outcome could be more rather than less segregation. Such an outcome may still be equity-inducing along other dimensions if growth information guides participants of color and low-income participants toward more academically effective schools—even if they are less racially or economically integrated.
Figure 4 displays the average racial composition (top panel) and average economic composition (bottom panel) of the schools chosen by participants in each experimental group, disaggregated by participants’ race (White or person of color) and income (greater than or less than $100,000; see also Table A3).

Individual-level heterogeneity analysis.
With two notable exceptions, the differences in the average effects of status and/or growth information between White participants and participants of color as well as between participants with income above and below $100,000 are statistically indistinguishable from zero. The first exception applies to the effects of growth information on the racial composition of schools chosen by participants in each experimental group. Compared to their counterparts in the control group, White participants in the growth group choose schools with a 0.11 SD smaller proportion of White students. By contrast, compared to their counterparts in the control group, participants of color in the growth group choose schools with only a 0.01 SD smaller proportion of White students. A similar difference appears with respect to provision of both status and growth information. Compared to their counterparts in the control group, White participants in the both group choose schools with a 0.05 SD smaller proportion of White students. By contrast, compared to their counterparts in the control group, participants of color in the both group choose schools with a 0.06 SD larger proportion of White students.
The results of these individual-level treatment effect heterogeneity analyses provide a clearer case for the desegregating effects of disseminating growth information. In general, the primary results regarding the racial and economic composition of the chosen schools hold for White participants and participants of color as well as for more affluent and less affluent participants. Moreover, with respect to the specific case of growth information steering participants toward less White schools, the effects are larger among White participants.
District-Level Treatment Effect Heterogeneity
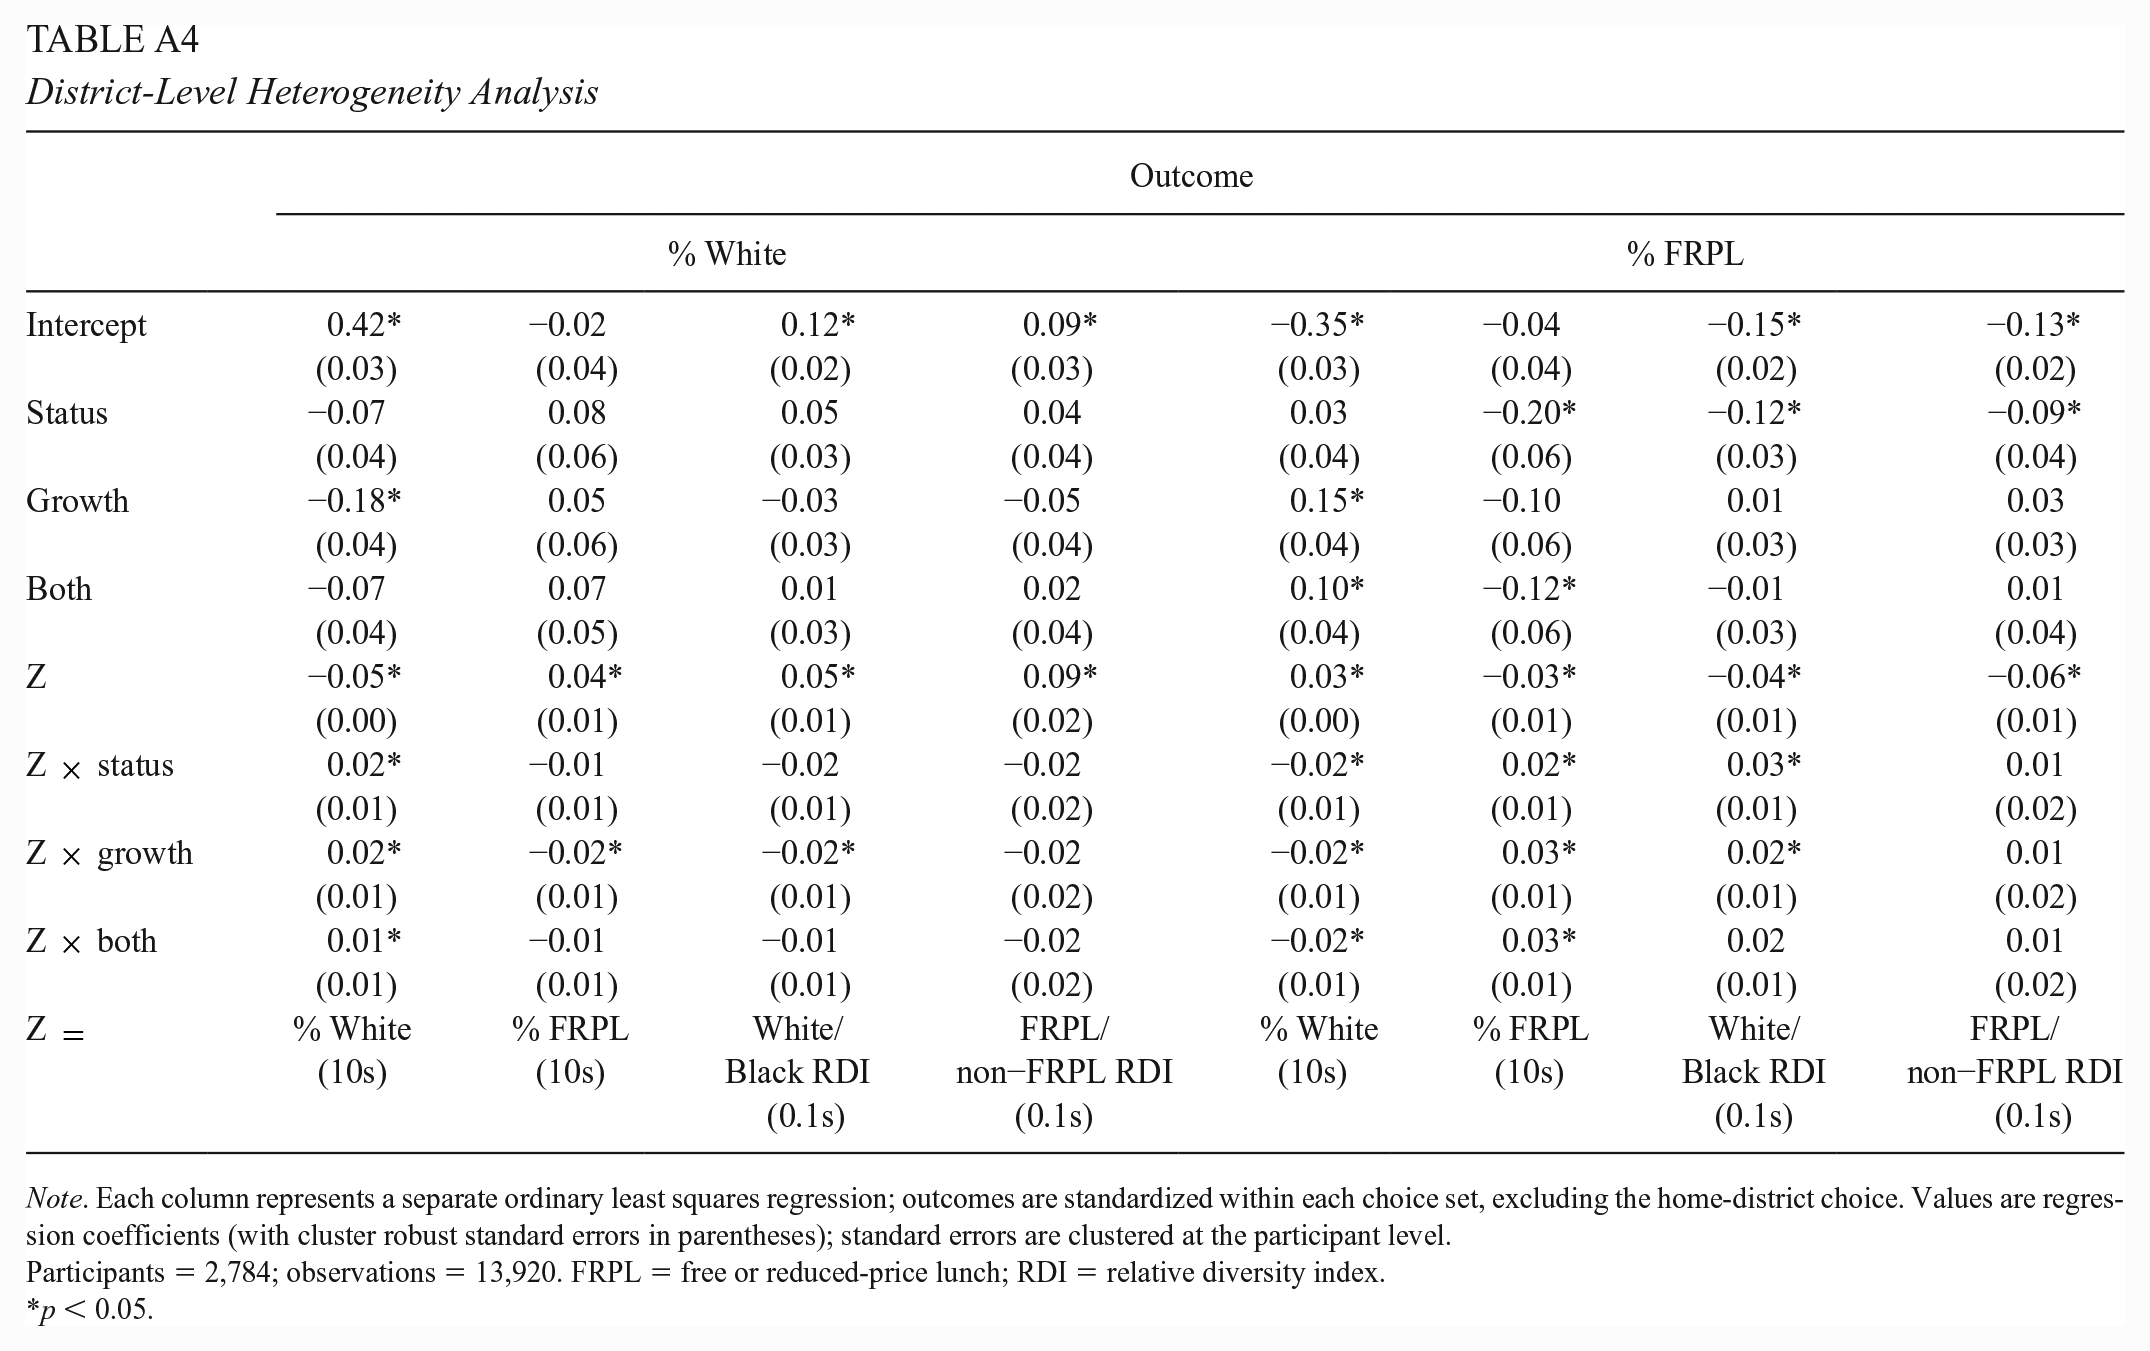
We continue our study of the potential implications of disseminating different types of academic performance information for school segregation by examining how the average effects of status and/or growth information vary by the demographic compositions of the school districts in which the choices take place. Figure 5 (see also Table A4) displays the average differences in the racial and economic compositions of the schools chosen by participants in the control group and the three other experimental groups, disaggregated by four different measures of district-level demographics: (a) the percentage of White students in the district, (b) the percentage of FRPL-eligible students in the district, (c) the district’s White/Black relative diversity index (W/B RDI), and (d) the district’s FRPL/non-FRPL relative diversity index (F/NF RDI). In each plot, the dark gray line represents the linearized average racial or economic compositions of the schools chosen by participants in the control group. The red, green, and blue lines represent the analogous values for the participants in the status, growth, and both groups, respectively.

District-level heterogeneity analysis.
Plots A–F display the average racial and economic compositions of the chosen schools at every point along the district racial spectrum (0%–100% White). In very non-White districts (less than 25% White), participants in the control group tend to choose Whiter and more affluent schools than the choice set mean. The choices of participants in the status group are generally indistinguishable from those of their peers in the control group. By contrast, participants in the growth group choose less White and less affluent schools than do their peers in the control group. Participants in the both group fall somewhere in between. Their choices with respect to school racial composition are similar to the those of the control group, but they choose slightly less affluent schools.
Plots G–L display the average racial and economic compositions of the chosen schools at every point along the district economic spectrum (0%–100% FRPL). In very low-income districts (greater than 75% FRPL), participants in the control group tend to choose Whiter and more affluent schools than the choice set mean. The choices of participants in the status group are generally indistinguishable from those of their peers in the control group. Participants in the growth group choose less White and less affluent schools than do their control group counterparts. Participants in the both group again fall somewhere in between. Their choices with respect to school racial composition are similar to the those of the control group, but they choose slightly less affluent schools.
Plots M–R display the average racial and economic compositions of the chosen schools at every point along the White/Black racial segregation spectrum (0–1 W/B RDI, where 0 is completely desegregated and 1 is completely segregated). In very racially segregated districts (around 0.75 W/B RDI), participants in the control group tend to choose much Whiter and much more affluent schools than the choice set mean. The choices of participants in the status group and in the both group are generally indistinguishable from those of their peers in the control group. However, participants in the growth group again choose less White and less affluent schools than do their control group counterparts.
Plots S–X display the average racial and economic compositions of the chosen schools at every point along the FRPL/non-FRPL economic segregation spectrum. We do not observe any statistically meaningful variation in average treatment effects along this dimension.
In short, the district-level treatment effect heterogeneity analysis largely reinforces our conclusions from the analysis of average treatment effects and their implications for school segregation. Only the provision of growth information alone produces a pattern of participant choices that could plausibly have desegregating consequences. When participants receive both types of academic performance information, their school choices with respect to racial and economic composition are generally consistent with those of their control group peers.
Conclusion
Public school choice has expanded dramatically over the last few decades. Parents of more than 4 in 10 school-age children indicate that they have multiple public options when choosing a school for their child (De Brey et al., 2021). In a country with entrenched residential segregation, advocates of school choice often tout the potential desegregating consequences of uncoupling students’ home addresses and school assignments. However, the relationship between school choice and school segregation is far from straightforward. Indeed, the preponderance of evidence suggests that many varieties of school choice tend to exacerbate rather than ameliorate preexisting patterns of racial, ethnic, and economic segregation.
The ways in which states and districts traditionally measured and reported school quality may have abetted this dynamic. Prior to the passage of ESSA in 2015, many states’ school accountability systems focused almost exclusively on measures of student achievement status (Data Quality Campaign, 2019). Although such measures may offer a useful—if limited—window on the condition of students’ knowledge and skills in the tested domains, they provide little if any insight into schools’ contributions to student learning. Because students enter school with varying levels of academic preparation and because students vary in the extent to which they encounter out-of-school obstacles to academic performance, school-level achievement status largely reflects the racial, ethnic, and economic composition of the student body. If guided by the official measures, families seeking the highest performing schools for their children would almost invariably be directed toward the Whitest and most affluent schools. Unless school choice policies deliberately prioritize low-income students and students of color when assigning seats in these schools, the end result is likely to be greater rather than less segregation.
ESSA now requires states to use multiple measures when evaluating school quality. One of the biggest shifts has been the widespread adoption of growth as one of those indicators (Data Quality Campaign, 2019). Growth is not a perfect measure of school effectiveness. In most of its current formulations, it does not capture changes in achievement outside Grades 3–8, it is limited to student performance on standardized math and reading tests, it can suffer from year-to-year volatility, and it does not account for ongoing out-of-school factors that may inhibit student learning but are outside educators’ control. But, despite its shortcomings, growth is a meaningful improvement over status. Moreover, growth bears a much weaker underlying relationship to the racial, ethnic, and economic composition of the student body. Therefore, as states begin to disseminate information on school-level growth, we might expect many families to consider schools that they would have otherwise written off under the previous status-based accountability regime.
We find evidence that giving parents information about school-level status guides them toward higher status schools that are, on average, less Black, less Hispanic, and less affluent than those chosen by their peers who only receive demographic information. This finding is consistent with the argument that a status-oriented school accountability system exacerbates school segregation. Alternatively, giving parents information about school-level growth results in a pattern of school choices that not only nudges parents toward more effective schools but may also modestly reduce racial, ethnic, and economic divisions among schools. The provision of both status and growth information steers parents toward higher performing schools on both dimensions, but not toward schools that serve a less advantaged population.
Online experiments deliberately create parameters that sharpen the focus on some variables and relationships at the expense of artificially restricting consideration of others. Despite the steps we take to mitigate this problem (relying on nationally representative data rather than volunteer samples, using data on real schools rather than hypothetical ones, and including for each participant a choice based on options in their own community), it remains uncertain how well our findings apply to households making high-stakes decisions in multidimensional environments with competing priorities and values in play.
Concerns like these suggest the need for additional research and for modesty in drawing policy implications. Additional experimental studies, particularly embedded in districts offering universal school choice systems, have the potential to vary interventions and choice parameters while also reflecting local contextual features in full. We also need to build on qualitative studies that probe families’ decision-making processes, linking these to the school choices they ultimately make. Combining interviews with revealed preferences from New Orleans’ One App system, Harris (2020) suggests that practical factors (e.g., the availability of after-school and sports programs) and familiarity (e.g., whether a parent attended the school or whether it retained its historic name) can trump narrowly educational considerations.
Our results are too circumscribed to support policy recommendations that are high cost or high risk. Nonetheless, a judicious reading of our findings has implications for policies regarding data collection and dissemination. States and districts have been steadily increasing their capacity to convert student-level assessment data into meaningful measures of learning growth. They have done so for reasons distinct from the goal of promoting more diverse schools, so the recommendation that they continue and expand those efforts and disseminate the results more effectively will have minimal marginal costs. Measuring and reporting school-level growth is a positive development in its own right, given its superiority to status as a measure of school effectiveness. However, because the general trend among states is to modify their school accountability systems by including growth as a supplement to status rather than as a replacement for status, we ought to lower our expectations that such changes will alter families’ school choice behavior in a way that meaningfully reduces existing school segregation.
Efforts to use governmental power and authority to promote school diversity have all too often sparked public backlash, attenuating or reversing any progress. That history helps explain the appeal of less intrusive efforts that might further the goal of inducing diversity with less political trauma and disruption. We undertook this study with the hope and some expectation that informational nudges might be a promising complement—although in no way a sufficient alternative—to more direct challenges to the systemic factors that promote and sustain racial, ethnic, and economic separation. We conclude with less optimism. Adding growth information to the array of data publicly available to parents and citizens is a good thing to do, but, on its own, it is unlikely to resolve the fraught tensions between perceived individual self-interest and the collective good that have bedeviled past efforts to use school choice to achieve more diverse educational environments for coming generations. Making more dramatic progress may mean working through the political process to build sufficient support for deliberate, informed, and authoritative action that goes beyond relying on parental choices alone.
Supplemental Material
sj-docx-1-ero-10.1177_23328584231177666 – Supplemental material for The “Good” Schools: Academic Performance Data, School Choice, and Segregation
Supplemental material, sj-docx-1-ero-10.1177_23328584231177666 for The “Good” Schools: Academic Performance Data, School Choice, and Segregation by David M. Houston and Jeffrey R. Henig in AERA Open
Footnotes
Appendix
District-Level Heterogeneity Analysis
| Outcome | ||||||||
|---|---|---|---|---|---|---|---|---|
| % White | % FRPL | |||||||
| Intercept | 0.42* | −0.02 | 0.12* | 0.09* | −0.35* | −0.04 | −0.15* | −0.13* |
| (0.03) | (0.04) | (0.02) | (0.03) | (0.03) | (0.04) | (0.02) | (0.02) | |
| Status | −0.07 | 0.08 | 0.05 | 0.04 | 0.03 | −0.20* | −0.12* | −0.09* |
| (0.04) | (0.06) | (0.03) | (0.04) | (0.04) | (0.06) | (0.03) | (0.04) | |
| Growth | −0.18* | 0.05 | −0.03 | −0.05 | 0.15* | −0.10 | 0.01 | 0.03 |
| (0.04) | (0.06) | (0.03) | (0.04) | (0.04) | (0.06) | (0.03) | (0.03) | |
| Both | −0.07 | 0.07 | 0.01 | 0.02 | 0.10* | −0.12* | −0.01 | 0.01 |
| (0.04) | (0.05) | (0.03) | (0.04) | (0.04) | (0.06) | (0.03) | (0.04) | |
| Z | −0.05* | 0.04* | 0.05* | 0.09* | 0.03* | −0.03* | −0.04* | −0.06* |
| (0.00) | (0.01) | (0.01) | (0.02) | (0.00) | (0.01) | (0.01) | (0.01) | |
| Z × status | 0.02* | −0.01 | −0.02 | −0.02 | −0.02* | 0.02* | 0.03* | 0.01 |
| (0.01) | (0.01) | (0.01) | (0.02) | (0.01) | (0.01) | (0.01) | (0.02) | |
| Z × growth | 0.02* | −0.02* | −0.02* | −0.02 | −0.02* | 0.03* | 0.02* | 0.01 |
| (0.01) | (0.01) | (0.01) | (0.02) | (0.01) | (0.01) | (0.01) | (0.02) | |
| Z × both | 0.01* | −0.01 | −0.01 | −0.02 | −0.02* | 0.03* | 0.02 | 0.01 |
| (0.01) | (0.01) | (0.01) | (0.02) | (0.01) | (0.01) | (0.01) | (0.02) | |
| Z = | % White |
% FRPL |
White/ |
FRPL/ |
% White |
% FRPL |
White/ |
FRPL/ |
Note. Each column represents a separate ordinary least squares regression; outcomes are standardized within each choice set, excluding the home-district choice. Values are regression coefficients (with cluster robust standard errors in parentheses); standard errors are clustered at the participant level.
Participants = 2,784; observations = 13,920. FRPL = free or reduced-price lunch; RDI = relative diversity index.
p < 0.05.
Funding
The author(s) disclosed receipt of the following financial support for the research, authorship, and/or publication of this article: This work is supported by the Spencer Foundation (Grant # 202000219).
Preregistration
This experiment was preregistered on the American Economic Association’s registry for randomized controlled trials (Trial # 7014).
Supplemental Material
Supplemental material for this article is available online.
Notes
Authors
DAVID M. HOUSTON is Assistant Professor of Education at George Mason University. He studies education politics and policy; email:
JEFFREY R. HENIG is Professor of Education and Political Science at Teachers College, Columbia University. His research focuses on the politics of education reform at the local, state, and national levels; email:
References
Supplementary Material
Please find the following supplemental material available below.
For Open Access articles published under a Creative Commons License, all supplemental material carries the same license as the article it is associated with.
For non-Open Access articles published, all supplemental material carries a non-exclusive license, and permission requests for re-use of supplemental material or any part of supplemental material shall be sent directly to the copyright owner as specified in the copyright notice associated with the article.