
Abstract
Is underrepresentation of Black students, Latinx students, English learners (EL), and students from economically challenging communities in gifted programs due to inequality in early academic achievement or bias in the gifted identification process? Using three-level multilevel logistic models, we examine the degree to which the disparities in gifted identification are due to disparities in early achievement. Our datasets include 3rd-, 4th-, and 5th-grade achievement scores and demographic variables from all students in a 3rd-grade, 2011–2012 cohort across three states. Students who qualified for free/reduced-price lunch (FRPL), EL, and Black or Latinx students were between two to eight times less likely to be identified as gifted compared to non–free/reduced-price lunch, non-EL, and White or Asian students. However, between 50% and 100% of gifted identification disparities could be explained by student-level differences in early academic achievement, which is consistent with an opportunity gap explanation of underrepresentation.
Keywords
F
Most of the research on underrepresentation focuses on raw disparities in disproportionality (Peters et al., 2019). Many observers of gifted identification interpret this raw disproportionality as evidence of bias in the gifted identification process (Ford, 2010; USDOE, 2016; Yaluma & Tyner, 2021). However, the cause of such disproportionality is unclear: raw disproportionality might not be evidence of bias in the identification process but could instead result from student differences that exist at the beginning of the identification process (Plucker & Peters, 2016, 2018; Simonsen et al., 2020; Worrell & Dixson, 2020, 2022).
To distinguish between differences due to bias in identification processes and disparities due to early achievement differences, we examine whether disproportionality exists after controlling for student, school, and district characteristics. The term conditional underidentification 3 refers to the disparity in identification rates after controlling for prior achievement and school and district demographics.
This research examined both raw disparities and conditional differences in gifted identification rates across different demographic groups. We estimated how much of the identification gap across various demographic groups can be explained by achievement differences with longitudinal data from all students in the 2011 3rd-grade cohort in three states. Most prior studies have focused on raw differences in identification rates; this study extended the research in earlier studies by examining both unconditional identification rates and conditional identification rates. To avoid the ecological fallacy of making claims about student process based on school or district data, we used three-level multilevel logistic regression to estimate disparities in gifted identification.
Literature Review
Although this study focuses on descriptive estimates of unconditional and conditional gifted identification rates, a broader understanding of the research on gifted identification helps inform our interpretation of differences in conditional identification rates. The academic research on gifted identification often posits three possible sources of differences in identification rates: (a) bias in the identification processes, (b) disparities due to early achievement differences, or (c) systemic racism or classism in the definitions of talent and opportunities to learn (Naglieri & Ford, 2003; Peters, 2022; Simonsen et al., 2020; Worrell & Dixson, 2020). Although these factors might all have joint and interactive effects on disparities in identification, we discuss the literature on each set of factors separately.
First, there has been extensive research into bias in the gifted identification process. The structure of the identification process (i.e., educators’ use of nominations, selection, and identification stages to identify giftedness; Peters, 2022) and/or the instruments used in the identification process (Ford, 1999; Naglieri & Ford, 2003) could introduce bias into the identification process.
Limited research has documented positive impacts of strategies to modify the instruments and structures of the identification process—such as universal screening (e.g., Card & Giuliano, 2015, 2016; Plucker & Peters, 2018), use of local norms (e.g., Lohman, 2005), specifically targeted teacher rating scales (e.g., Peters & Gentry, 2013), limiting the use of teacher referrals (Lamb et al., 2019), and professional development in the use of teacher rating scales (e.g., Hunsaker et al., 1997). However, Lee et al.’s (2021) and Hodges et al.’s (2018) meta-analyses found that most attempts to use alternative approaches to identification, such as nonverbal ability tests, led to very limited improvement in representation. For example, Hodges et al. (2018) found a Black/White relative risk (RR) of .34 for nontraditional identification methods and a Black/White RR of .27 for traditional identification methods. Even using nontraditional methods, Black students were identified as gifted at about a third of the rate of White students. To date, none of the modifications in instruments or modification of the structure of identification to address underrepresentation has fully mitigated the disparities in proportionate identification across subgroups (Peters, 2022). Second, differences in early academic achievement may also influence the outcomes of the identification process (Plucker & Peters, 2016, 2018; Simonsen et al., 2020; Worrell & Dixson, 2020).
A third potential source of inequality could be systemic racism and/or systemic classism in the identification process or in the gifted program itself. For instance, the choice of instruments or the creation of a structure for gifted identification could have systematically benefited the group in power. In a recent issue of Gifted Child Quarterly (GCQ; Worrell & Dixson, 2022), which included a focal article and 28 commentaries on the possible source of gifted identification disparities, almost half (13 out of 28) of the commentaries argued that some form of systematic racism was the cause of raw or conditional disparities in identification rates. Most of these commentaries described a form of systemic racism that have led to inequalities due to conscious or unconscious opportunity hoarding where one group created gifted identification structures or definitions of talent that benefited their group over others. This opportunity hoarding could also have been due to class bias in definitions of talent (Bernstein, 2007; Karabel, 2005) or an active creation of elite tracks that benefited the higher-income or wealthier groups (Bourdieu, 1996; Lucas, 1999, 2001). And, as intersectionality researchers argue, this potential influence of racism and classism may lead to low-income Latinx students or low-income Black students having a double disadvantage in their chances of being identified for gifted programs.
Documenting the intersectionality of inequalities of race/ethnicity and socioeconomic status may help to better understand the gaps due to racism and/or classism (Collins, 2015; Hodges et al., 2022). In addition, studies of conditional identification may elucidate potential mechanisms through which systemic racism or classism might influence inequalities. For example, raw estimates of disparities might differ from conditional identification estimates controlling for both race/ethnicity and socioeconomic status (intersectionality) and academic achievement. In addition, intersectional joint estimates of the influence of race/ethnicity and socioeconomic status could differ in conditional identification estimates with and without controlling for academic achievement. Descriptive estimates of unconditional and conditional gifted identification rates with and without achievement provide clues as to whether inequalities are due to proximal causes, such as bias in the nomination structure, or more distal causes, such as inequalities in achievement. Such inequalities in achievement could suggest bias in early educational opportunities reflective of multiple levels of racism or classism over time (Carter & Welner, 2013; Duncan & Murane, 2011; Erwin & Worrell, 2012; Grodsky et al., 2008; Peters, 2022), or they could reindicate that certain assessments systematically favor certain groups (Freedle, 2003; Karabel, 2005; Kendi, 2016a, 2016b).
Conditional Underidentification—Influence of Early Student Achievement
Some gifted identification gaps may be reflective of pervasive achievement gaps, 4 which have been extensively documented in the research literature (Worrell & Dixson, 2020). Conditional underidentification refers to the rate of underidentification net of student achievement differences, controlling for school and district characteristics.
Raw Disproportionality vs. Conditional Underidentification
Since the 1970s, researchers have documented gaps in gifted identification by racial/ethnic groups, SES, and EL status. In the following sections, we compare studies of the magnitude of these identification gaps measured by raw disparities and measures of conditional underidentification.
Racial/Ethnic Disparities
Raw disparities
The underrepresentation of Black and Latinx students has increased over time (Peters et al., 2020). In 1970, representation indices 5 were .7 for Black students and .8 for Latinx students; 40 years later, in 2006, representation indices declined to .5 for Black students and .6 for Latinx students (Yoon & Gentry, 2009). OCR data indicate that low representation indices for Black and Latinx continued into the 2010s (Peters et al., 2019; Yaluma & Tyner, 2018). Peters et al. (2019) observed a representation index of .57 for Black students and .70 for Latinx students in 2016.
Conditional underidentification
Backes et al. (2021), Grissom and Redding (2016), and Warne et al. (2013) examined conditional underidentification using student-level data and demonstrated that part or all the racial/ethnic identification gaps disappeared after accounting for early achievement. 6 Backes et al. used data from Washington State and found no underidentification of Black and Latinx students in gifted programs after controlling for academic achievement. Warne et al. (2013) studied underidentification in Utah. After controlling for 3rd-grade achievement scores and poverty, when compared to White students, the odds of identification changed from a Black and Latinx disadvantage (Black/White odds of .81 and a Latinx/White odds of .95 in a model without SES and achievement) to a net Black and net Latinx advantage (Black/White odds of 2.22 and a Latinx/White odds of 2.85 in a model controlling for achievement and SES; Warne et al., 2013). Using national data from the Early Childhood Longitudinal Study, Grissom and Redding (2016) found that after controlling for achievement, there were no disparities in Latinx and White identification rates: the odds changed from about .5 to about 1 after controlling for achievement. However, a reduced but statistically significant disparity between Black and White identification rates remained. The inclusion of achievement in models of gifted identification changed the odds of identification for Black students from about .3 to .5, implying that Black students are 70% less likely to be identified than White students in models that did not account for achievement differences. Among students with similar levels of early achievement, Black students were about half as likely to be identified as gifted (Grissom & Redding, 2016), suggesting that early excellence gaps account for about 30% of the Black/White disparity in identification rates (.7–.5/.7 = .3).
Socioeconomic Status Disparities
Raw disparities
Yaluma and Tyner (2018) merged school-level data on poverty with school-level OCR data on gifted identification rates and showed differences in gifted identification rates by school poverty: 12.4% of students in low-poverty schools were identified as gifted, whereas only 6.1% of students in high-poverty schools were identified as gifted (Yaluma & Tyner, 2018). This gap in identification rates between high- and low-poverty schools widened during the 2010s (Yaluma & Tyner, 2021). Using student-level data from the Early Childhood Longitudinal Survey, Grissom et al. (2019) reported raw disproportionality rates by SES: 14% of students in the top SES-status quintile were identified as gifted as compared to only 2% in the bottom SES quintile.
Conditional underidentification
Conditional underidentification studies of SES identification gaps have presented conflicting findings. Warne et al. (2013) and Backes et al. (2021) both found after controlling for achievement, there were lower or no disparities in FRPL and non-FRPL identification rates. In contrast, in a study of data from three states, Hamilton et al. (2018) found a persistent effect of poverty on gifted identification, even after controlling for 3rd-grade mathematics and reading achievement. Using ECLS data, Grissom et al. (2019) found an interaction effect between SES and race/ethnicity on gifted identification. After controlling for academic achievement, there was no Black/White disparity in identification rates for the lowest two SES quintiles, and there was a persistent disparity in Black/White identification rates among the highest three SES quintiles. The predicted gap between Black and White identification rates in the third quintile was a difference of 3 percentage points, 5 percentage points in the fourth quintile, and 10 percentage points in the fifth quintile (Grissom et al., 2019). In the fifth quintile, just under 15% of White students were identified as gifted but only 5% of Black students were identified as gifted (Grissom et al., 2019, p. 351).
English Learners
Raw disparities
Hamilton et al. (2020) reported notable raw disproportionality rates by language status based on U.S. Dept. of Education Data. Only 3% of gifted students are ELs, whereas 10% of the student population in the United States are ELs (USDOE, 2018a, 2018b).
Conditional underidentification
Hamilton et al. (2020) conducted a multilevel logistic regression controlling for early achievement, SES, and race/ethnicity and found a persistent disparity between EL and non-EL students. They found that EL students were 56% as likely to be identified as gifted compared to non-EL students (see Model 2 in Hamilton et al., 2020, p. 395).
Lessons and Limitations of Conditional Underidentification Research
The studies discussed previously show that while raw disparities in gifted identification rates between Black and Latinx versus White and Asian students, EL and non-EL students, and students from low-SES versus high-SES families have been fairly consistent, estimates of conditional representation based on student-level data have been mixed. Studies that jointly modeled the influence of poverty and race/ethnicity using a census of state-level student data found that after controlling for achievement, almost 100% of the SES and race/ethnic identification gaps disappeared (Backes et al., 2021; Warne et al., 2013). In contrast, Grissom et al.’s (2019) analysis of the national Early Childhood Longitudinal Study (ECLS) revealed a 50% to 70% reduction in the effect of being in the highest SES status quartile after controlling for early achievement. 7 Grissom & Redding (2016) analysis of ECLS data found that controlling for achievement accounted for all of the Latinx/White disparities but only 30% of the Black/White disparities.
Grissom & Redding, 2016 and 2019 analyses had limitations. First, their measure of giftedness was based on a teachers’ response to a survey item and was not an indicator that the student had been formally identified as gifted by the students’ school nor district (Grissom & Redding, 2016). Second, they used a national stratified sample of students instead of a census of students. 8 Given that gifted identification is a relatively rare event (i.e., often less than 10% of students are identified), it is possible that a stratified random sample, even one as large as the ECLS, might have limitations in accurately capturing the experiences of gifted students. Third, they only examined students in schools with at least one gifted student. This does not allow them to have made state-level estimates of the access to gifted services by subgroup statewide. Therefore, studies that used censuses of students instead of samples and that used all students instead of just students in gifted programs would provide more robust estimates of the conditional odds of being identified as gifted. Therefore, the Backes et al. (2021), Hamilton et al. (2018), and Warne et al. (2013) studies provided better estimates than Grissom and Redding (2016) and Grissom et al. (2019) studies.
However, Backes et al. (2021), Hamilton et al. (2018), and Warne et al. (2013) also had limitations. Hamilton et al. (2018) focused solely on FRPL students and did not jointly estimate the influence of FRPL, race/ethnicity, and EL on identification. Backes et al. (2021) and Warne et al. (2013) included states with a very small proportion of Black and Latinx students. For example, in Warne et al.’s study, there were fewer than 20 Black gifted students in a population of thousands. Therefore, their findings might be impacted by sampling error and/or they might not generalize to states/districts with larger proportions of Black and Latinx students. We need additional research based on census data from states with larger proportions of Black, Latinx, EL, and low-income students that jointly estimates the influence of FRPL, EL, and race/ethnicity.
Limitations due to a Lack of Research on the Intersectionality of Race/Ethnicity and SES
The gifted identification literature is also limited due to a lack of research into the ways that race/ethnicity and SES intersect and interact. Very few studies in gifted education explicitly examined the double disadvantage of racism and socioeconomic disparities. Most studies of disparities in identification rates have focused on SES disparities (see the 2018 GCQ special issue on poverty; VanTassel-Baska & Stambaugh, 2018) or racial/ethnic disparities (see most articles in the 2022 GCQ special issue on identification disparities; Worrell & Dixson, 2022). Demographers and education researchers have noted substantial differences in educational experiences by affluent and less affluent members of different racial/ethnic groups (Hodges et al. 2022; Portes & Rumbaut, 2001). Further, theorists such as hooks (2000) and Collins (2015) 9 and gifted education researchers (Goings & Ford, 2018; Hodges et al., 2022) have all noted the importance of incorporating measures of the intersectionality of both race/ethnicity and class/SES. 10
Limitations due to Lack of Longitudinal Student Data and Lack of Multilevel Modeling
Very few studies have examined individual student-level data, and only a handful of studies followed individual students over time to estimate an ever-gifted 11 identification rate (Grissom et al., 2019; Hamilton et al., 2018, 2020; Warne et al., 2013) 12 . Our ever-gifted identification rate refers to the proportion of students in the school who were ever identified as gifted by 5th grade. Following students from kindergarten through 5th grade, any student who was identified as gifted by fifth grade is denoted as ever gifted. Given that identification processes might involve multiple identification opportunities throughout elementary school, cross-sectional estimates of identification during a particular grade could differ from longitudinal estimates of gifted identification.
In addition, many studies of underidentification do not have student-level data. Studies that just have school- or district-level data can only answer questions about school or district processes. However, student-level data allows us to examine the identification process at the micro (student) and macro (school and district) levels. Education is inherently multilevel: students are nested within classes nested within schools nested within school districts (Barr & Dreeben, 1983; Gamoran et al., 2000; Raudenbush & Bryk, 2001). Many studies of gifted underidentification using the OCR data suffer from the ecological fallacy of making claims about individual student identification experiences based on aggregated school, district, state, or national data on identification rates (Peters et al., 2019; Shores et al., 2020; USDOE, 2016).
Shores’s et al. (2020) study is a notable example of the limitations of using aggregate data to study gifted identification. Shores’s (2020) conditional identification study of the impact of district- and school-level variables on school-level disparities in gifted identification found persistent disparities even after controlling for district and school SES and achievement variables. Shores claims that this is evidence of categorical inequality and persistent bias in the gifted identification process. However, without student-level data, it is impossible to know whether student-level measures of achievement could account for gifted identification disparities. Such claims about student-level identification without student-level data represent an ecological fallacy.
Summary
In summary, the literature to date on the raw disparities in gifted identification rates between Black and Latinx versus White and Asian students, EL and non-EL students, and low-income versus non-low-income students shows consistent disparities; however, the conditional identification research presents a more nuanced story. The results of the conditional identification studies are somewhat mixed as to whether differences in academic achievement can fully explain racial, ethnic, and socioeconomic disparities in gifted identification.
In addition, the raw disparities research is limited by a lack of intersectional analyses of gifted disparities and the lack of longitudinal student data. The current conditional identification research is limited by the lack of census data; a failure to examine EL, FRPL, Black, and Latinx experiences jointly; and the use of aggregate data and consequent inability to apply multilevel modeling to offer fuller explanation. The current research addresses these limitations, providing improved estimates of raw and conditional disparities in identification rates, adding to the literature on gifted underrepresentation. We want to emphasize this paper is descriptive and has no causal aspirations. Although this paper does not provide causal estimates of mechanisms, we believe that these results can help inform current identification practices and suggest potential areas for future research.
Research Questions
To examine underrepresentation in gifted identification, we posed two questions:
How large are identification gaps between historically underrepresented groups and non-underrepresented groups?
What proportion of these identification gaps can be explained by student-level achievement differences? How well do student-, school-, and district-level characteristics (such as student achievement in mathematics and reading and school and district demographics) explain these identification gaps?
Methods
To examine our two research questions about the rates of underrepresentation and the influence of early achievement gaps, we used longitudinal state achievement test and demographic data from a full cohort of students who were 3rd graders in 2011 in three states.
Data
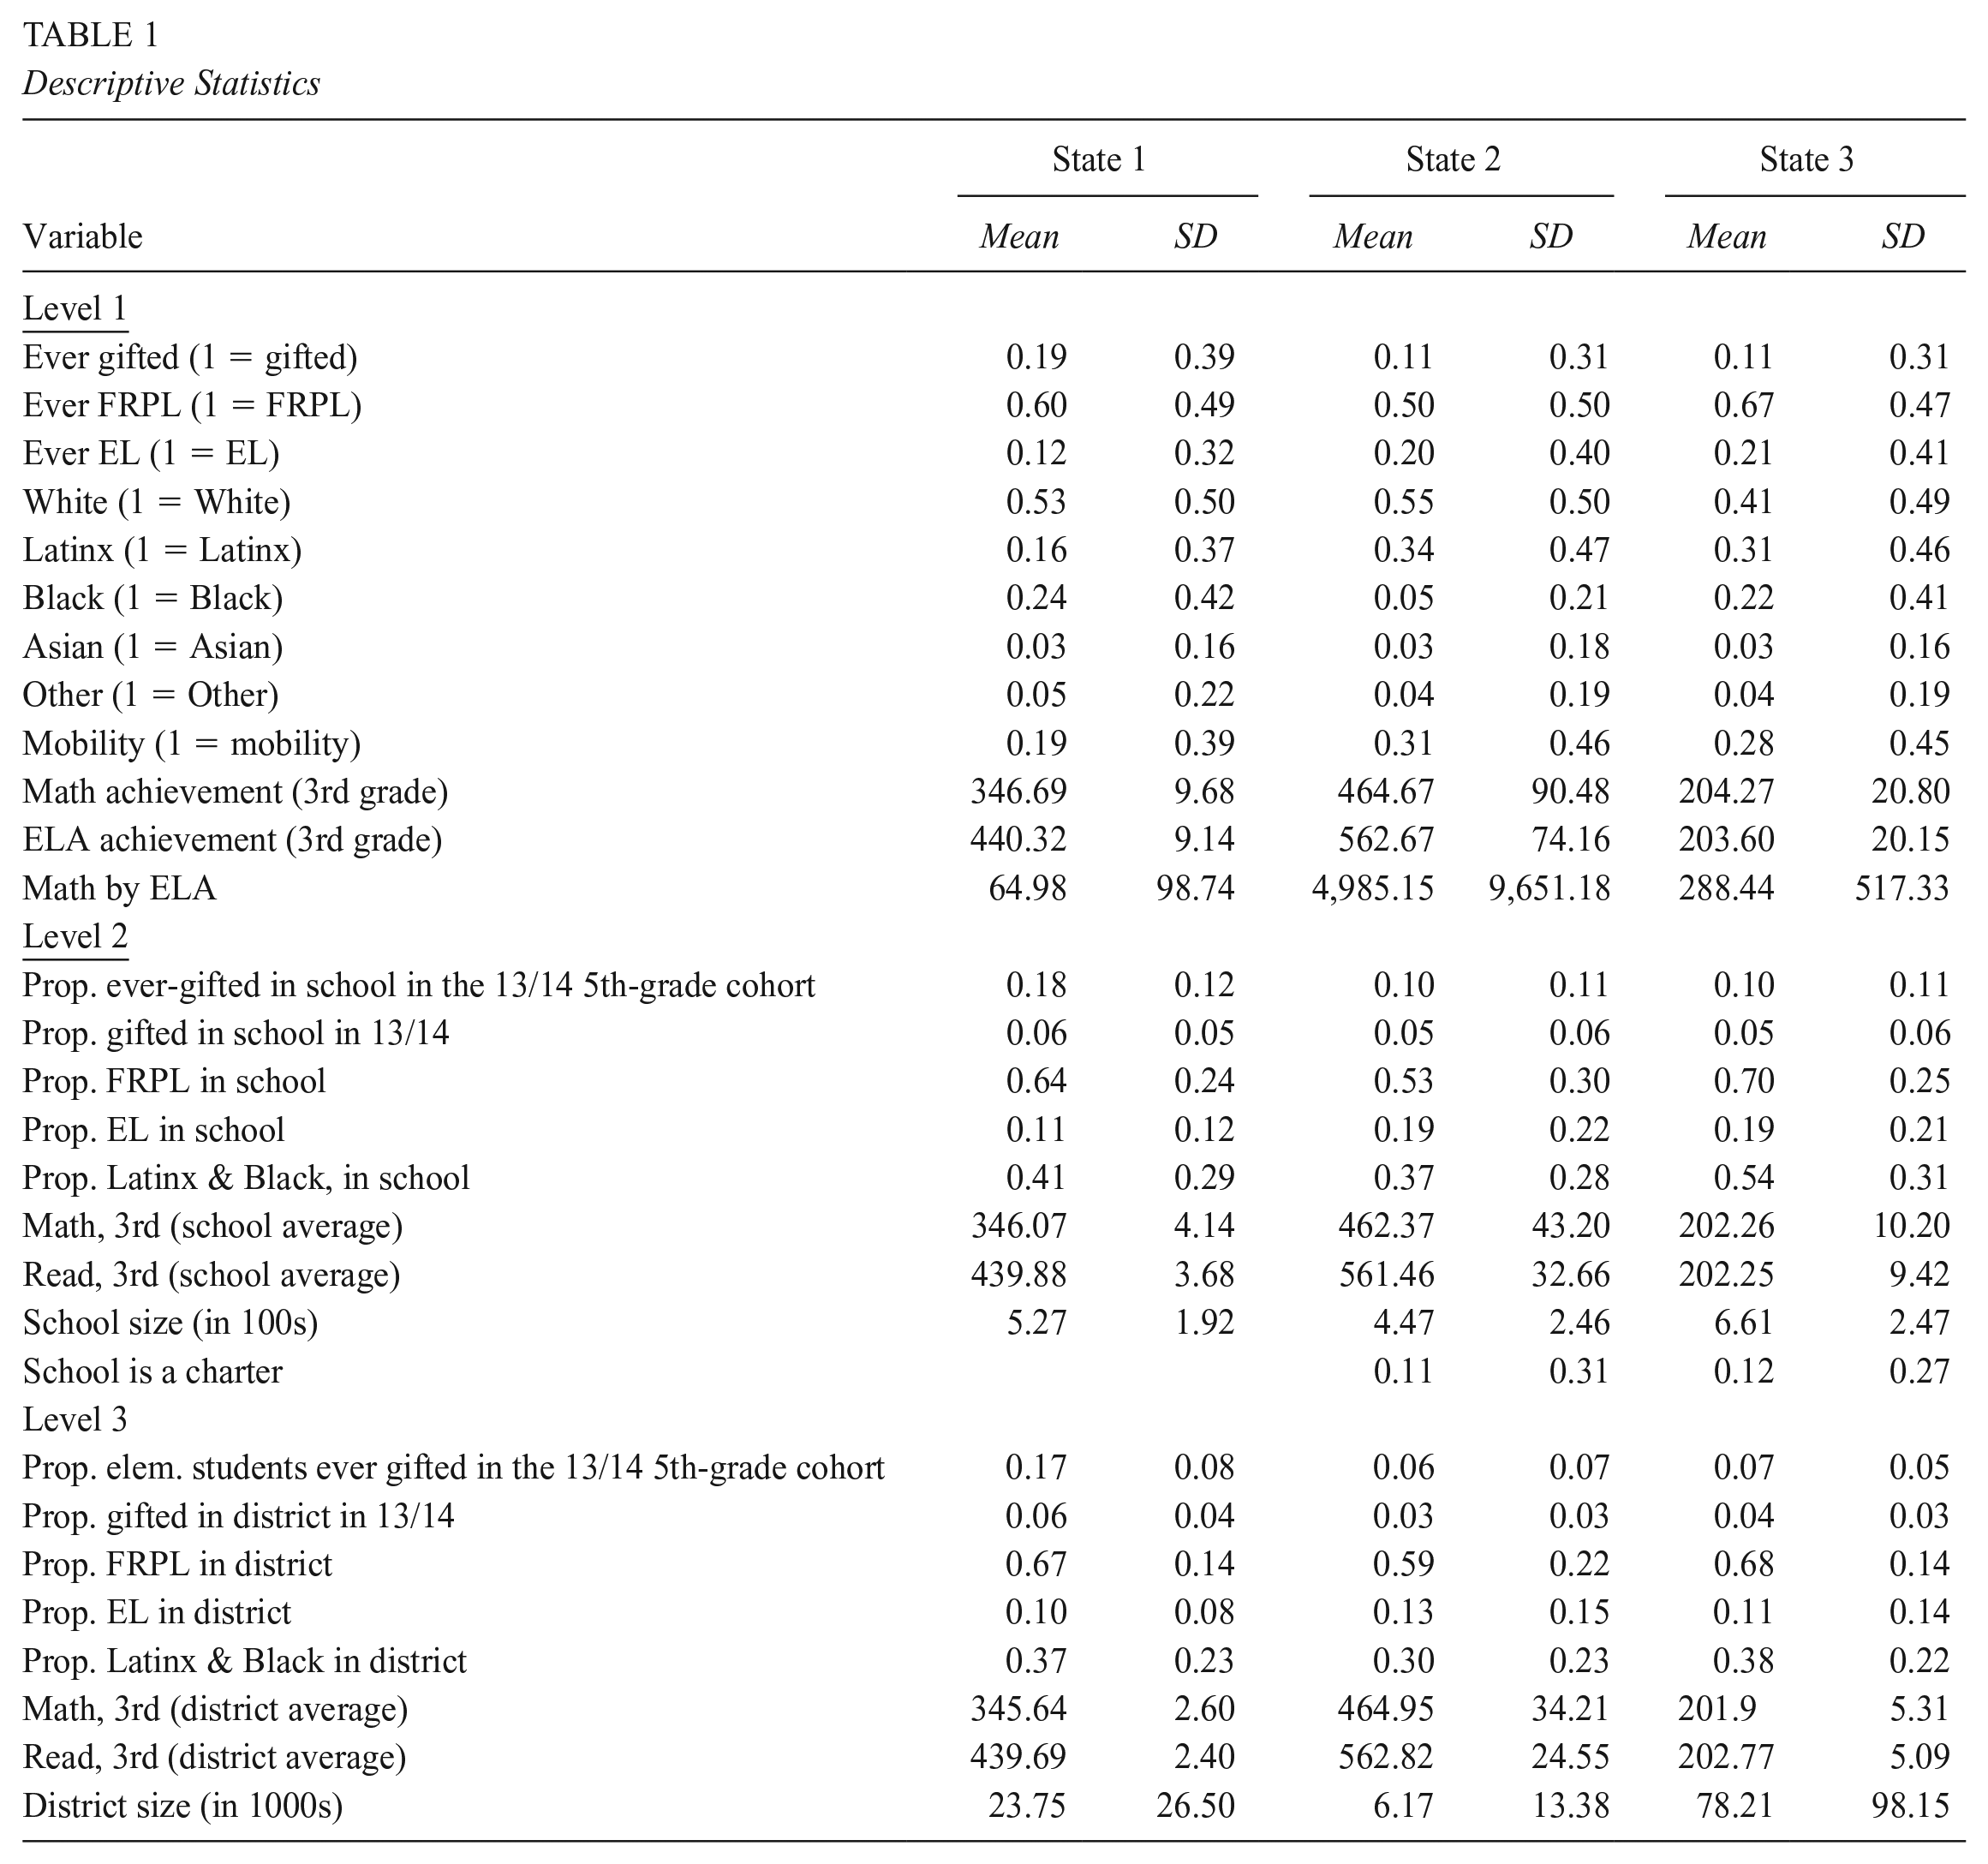
We analyzed longitudinal student-level data from state departments of education on all students in the 2011–2012 3rd-grade cohort from three states 13 that provide a state-level mandate for identification of and services for gifted students and that reported using vertically scaled state achievement tests. Our use of administrative data allowed us to examine a census of students that would be cost prohibitive if we had to gather these data ourselves (Hodges, 2019). These three states include a racially and ethnically diverse set of students: only 51%, 55%, and 41% of students in states 1, 2, and 3, respectively, were White (see Table 1). In addition, 95%, 80%, and 94% of schools in states 1, 2, and 3 had at least one identified gifted student per school. The longitudinal data file included state mathematics and reading achievement test scores from 3rd, 4th, and 5th grades, as well as student demographic variables such as gifted status, FRPL status, EL status, and race/ethnicity. All demographic variables were reported annually. These data files included 95,587 students in 1,394 schools in 115 districts in state 1; 64,438 students in 1,034 schools in 181 districts in state 2; and 168,516 students in 2,154 schools in 73 districts in state 3. However, our data only provide information on the 2011 3rd-grade cohort over 3 years and do not provide information about all students in all grades for each elementary school; therefore, we supplemented these data with school and district measures of proportion gifted and school and district demographics from the 2013–2014 OCR data and school and district size data from the 2013–2014 Common Core Data (OCR, 2018; USDOE, 2018a, 2018b).
Descriptive Statistics
Exclusion Criteria
In states 2 and 3, we included both charter and noncharter schools in our analyses. However, we excluded charter schools from state 1 for two reasons: (a) the charter schools in state 1 were not affiliated with school districts, and (b) the charter schools in state 1 were not required to identify students as gifted. Dropping charter schools in state 1 reduced the sample size from 95,587 to 90,240.
Analytic Samples and Missing Data
There was a small amount of missing data on student achievement, records of giftedness, within district school mobility, whether a school is a charter school, EL status, FRPL status, and race/ethnicity. States 1, 2, and 3 had 2.1%, 1.9%, and .04%, respectively, of observations with any missing data. Given the small percentage of missing data, we used listwise deletion (Allison, 2002). We examined an analytic sample based on data from students with achievement data from 3rd to 5th grade. After dropping cases with missing data, our analytic sample sizes are 88,340; 63,195; and 167,779 students in states 1, 2, and 3, respectively.
Variables
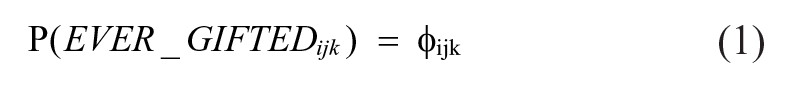
The outcome variable measures whether a student was identified as gifted any time from 3rd to 5th grade. The ever-gifted variable was coded 1 if the student was identified as gifted in 3rd, 4th, or 5th grade, and 0 if the student was never identified as gifted. 14 As part of the larger research project, the authors conducted a survey of districts in the three states and found that only 1% of districts identified students for gifted programs in kindergarten, 3% identified in 1st grade, 30% identified in 2nd grade, 51% identified in 3rd grade, 13% identified in 4th grade, and 2% identified in 5th grade. Given the variation in the proportion of identification that occurs at various grade levels in school districts, the school proportions of gifted students may reflect both differences in the proportion of students who are identified within grade levels with identified gifted students and the numbers of grades in the school at which students are identified as gifted. Such confounding adds considerable error to total school average proportion of gifted students measures commonly reported 15 (USDOE, 2016). Therefore, the use of the ever-gifted variable, which indicated whether the student had ever been identified as gifted by 5th grade, provided a more accurate measure of levels of underrepresentation than school average proportions or single time-point measures used in most studies of underrepresentation. In the following sections we list the independent variables used in this study.
Student-level variables
The independent variables at level one included:
School-level variables
At the school level (level two), we included the following district-mean-centered covariates below. We group-mean centered the covariates so that the coefficient refers to the change above or below the district average.
We added data from the Common Core and OCR data to our state administrative data to include:
District-level variables
At the district level (level three), we included the following grand-mean-centered covariates. We grand-mean centered the district level covariates so that the coefficient refers to the change above or below the state average.
We group-mean centered all continuous covariates at levels one and two and grand-mean centered all continuous covariates at level three. This centering strategy allows for variance decomposition and eases interpretation: The intercept represents the predicted value for a reference student who is at the average for their school and attends a school at the average for their district, in a district that is mean for their state. Centering also helps to dramatically simplify our calculation of predicted values.
Analytic Approach
To examine the two research questions, we conducted two different sets of analyses. First, we descriptively analyzed rates of underrepresentation using the student-level data. Second, using the student-level data, we used HLM to estimate conditional rates of underidentification using a three-level logistic model.
To estimate the rates of underrepresentation, we examined the probability that a student would ever be identified as gifted by 5th grade. In Table 2, we present the proportion of students ever identified as gifted by 5th grade by demographic subgroup. Next, in Table 3, we estimate the representation index and relative risk for each subgroup. To calculate each group’s representation index, we divided the proportion of the subgroup identified as gifted by the overall proportion of gifted students in the state. For example, the representation index for FRPL students was calculated by dividing the proportion of FRPL students identified as gifted by the proportion of gifted in the state.
Percentage of Students Identified as Gifted by Subgroup

Relative risk (RR) of Identification as Gifted by Subgroup

Note: We calculated the relative risks (RR) by dividing the proportion identified as gifted in one subgroup by the proportion gifted in a second subgroup. An RR of 1 indicates that the proportion identified as gifted in group one is identical the proportion identified as gifted in group two. An RR of .5 indicates that only half as many students in group 1 are identified as gifted compared to group 2. And an RR of 2 indicates that twice as many students in group one are identified as gifted compared to group 2.
To calculate the relative risk, we divided the proportion of students in a subgroup identified as gifted by the proportion of students that did not belong to the subgroup identified as gifted. Figure 1 provides a graphic comparison of different representation indexes. Figures 2–5 illustrate how differences in identification rates vary by achievement. Each figure graphs the proportion of students identified by achievement percentile (we took the average of the math and ELA achievement score and calculated the percentile ranking by average achievement).

Representation index by subgroup.

Proportion of White and Black students identified as gifted by 3rd-grade math and ELA achievement.

Proportion of White and Latinx students identified as gifted by 3rd-grade math and ELA achievement.

Proportion of FRPL and underrepresented minorities and non-FRPL and non-underrepresented minority students identified as gifted by 3rd-grade math and ELA achievement.

Proportion of EL and non-EL students identified as gifted by 3rd grade math and ELA achievement.
Next, we fit a series of conditional three-level multilevel models to predict the probability of ever being identified as gifted by 5th grade, after controlling for student, school, and district demographic and achievement variables. We estimated three-level (student-school-district) logistic multilevel models for each state to examine rates of underidentification and the influence of student achievement and other factors on rates of underidentification (see Table 5). These multilevel models were estimated with randomly varying intercepts; none of the student or school slopes were allowed to very randomly.
Model 1 estimated the effect of being FRPL, EL, Black, or Latinx on the log odds 18 of being identified as gifted (see Model 1 in Table 4). These models include controls for student mobility and whether a school is a charter school (states 2, 3). Model 1 includes six demographic variables: Black, Latinx, Asian, and other (White is the omitted reference category), plus FRPL and EL status. Vector X1j represents the individual demographic characteristics. Vector X2j represents the group-mean-centered, school-level averages of these demographic variables. Vector X3j represents grand-mean-centered, district-level averages of these demographic variables. Also, C1 is a student-level control for student mobility. C2 is a school-level control for whether the school is a charter school. Charter schools represent 11% of the schools in state 2 and 14% of the schools in state 3 (see Model 1).
Multilevel Logistic Regression Models for the Effects of Demographics and Socioeconomic status (SES) on Gifted Identification

Note. * = p < .01; ** = p < .001. FRPL = free/reduced-price lunch; EL = English learners; ELA = English/language arts; prop. = proportion; sch. = school; avg. = average; dist. = district. Standard errors appear in parentheses. Models control for school size, district size, charter school, and student mobility. Analyses based on the full analytic sample described in the text and Table 1. The math and reading achievement coefficients are multiplied by 10 (e.g., 0.19 for state 2 is actually 0.019) and the interaction of math and reading achievement coefficient is multiplied by 1,000 (e.g., –0.05 for state 2 is actually –0.00005). Sample sizes for state 1: level 1 = 88,340, level 2 = 1322, and level 3 = 115; for state 2: level 1 = 63,195, level 2 = 1,013, and level 3 = 178; and for state 3: level 1 = 167,779, level 2 = 1,322, and level 3 = 115. All results are from a unit-specific, over-dispersed Bernoulli model with robust standard errors.


Model 2 added achievement variables. Vector A1 represents student achievement at level 1 by 3rd-grade math and reading achievement plus the interaction of math and reading achievement. Vectors A2 and A3 represent average math and average reading achievement at the school and district levels, respectively (see Model 2).


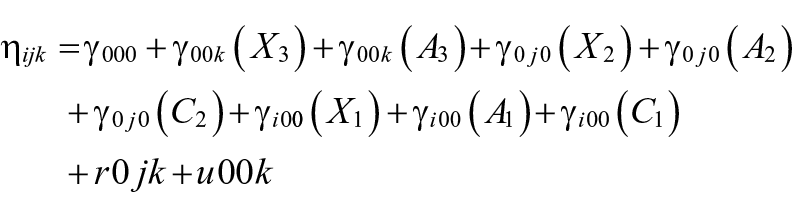
Model 3 added the proportion of identified gifted students at the school and district levels. Vector G2 is the proportion gifted at the school level based on OCR data. G3 is the proportion gifted at the district level based on OCR data (see Model 3).


We used PQL estimation, and the literature on model comparisons with multilevel logistic regressions suggests that overall model fit comparisons are not possible with PQL estimates (O’Connell et al., 2022). To estimate a rough, albeit imprecise, measure of model fit we compared the different models and estimated the change in explained variance by level based on multilevel linear probability models (see Appendix D online). We estimated the percentage change in explained variance from the null model to Model 1, Model 1 to 2, and Model 2 to 3.
We next examined the degree of intersectionality by estimating the interaction effects of race/ethnicity by FRPL (see Figures A1–A3 and Tables A1–A3 in the online appendix). Modeling the interaction effect of race/ethnicity by FRPL allowed us to evaluate whether the effect of FRPL was stronger or weaker for different racial/ethnic groups and evaluate whether the effects of race/ethnicity differ for FRPL and non-FRPL students.
We examined potential evidence of opportunity hoarding by estimating the interaction effects of race/ethnicity at the student level by the proportion of Black and Latinx students at the school and district level and the interaction of FRPL at the student level by the proportion of FRPL at the school and district level. The available data did not include information on who makes the decisions about the use of achievement scores in gifted identification, but we could make a prediction based on the theory of opportunity hoarding. If racial/ethnic opportunity hoarding did exist, we would expect that districts with more traditionally disadvantaged racial/ethnic groups would exhibit a larger Black/White or Latinx/White gap than districts with fewer historically disadvantaged racial/ethnic groups. If economic opportunity hoarding did exist, we would expect that districts with more FRPL-eligible students to exhibit a larger FRPL gap than districts with fewer FRPL eligible students.
Last, we examined whether districts with only one elementary school influenced our findings. The percentage of districts with only one school per district in states 1, 2, and 3 was 13%, 63%, and 8%, respectively. We tested the influence of the large number of one elementary school districts in state 2 with a series of sensitivity tests and found that the results were nearly identical both with and without only one elementary school district.
Results
Research Question 1: How Large Are Identification Gaps Between Historically Underrepresented Groups and Non-Underrepresented Groups?
Across the three states studied, Black, Latinx, FRPL, and EL students were less likely to be identified as gifted than White, Asian, non-FRPL, and non-EL students (see Table 2). The total proportion of 5th-grade students ever identified as gifted students were 19.3%, 10.9%, and 10.7%, respectively. Therefore, if underrepresentation were not a problem, we would expect to see similar proportions of students of each subgroup identified as gifted. Instead, there were much smaller proportions of identified gifted Black students (7.4%, 6.0%, and 4.4%, respectively), Latinx students (8.8%, 6.9%, and 9.4%, respectively), EL students (6.0%, 7.7%, and 6.8%, respectively), and FRPL students (9.2%, 6.7%, and 6.8%, respectively). In contrast, the proportions of identified non-FRPL students (34.4%, 15.3%, and 18.8%, respectively), White students (27.0%, 13.3%, and 14.2%, respectively), and Asian students (40.5%, 18.2%, 25.3%) were much higher than the proportions of gifted students in the selected states. When we overlap traditionally overrepresented groups, these disparities between over and underrepresented groups were more dramatic. For example, among students who were non-FRPL, non-EL, and White or Asian, 37.0%, 16.2%, and 20.4%, respectively, were identified as gifted. In contrast, among students who were FRPL and Black or Latinx, 6.3%, 6.1%, and 5.9%, respectively, were identified as gifted. State 1 stands out with an exceptionally large number of students identified as gifted (37.0%) among non-FRPL, non-EL, and Asian or White students, although state 1 also had the largest percentage of gifted students (19.3%). Even so, state 1 students who were non-FRPL, non-EL, and White or Asian were 5.87 times as likely to be identified as gifted than students who were FRPL and Black or Latinx. (This ratio is 2.66 in state 2 and 3.46 in state 3.) In both states 1 and 3, the proportion of White/Asian, non-EL, non-FRPL students identified was nearly twice the overall identification rate (37.0% vs 19.3% in state 1 and 20.4% vs. 10.7% in state 3).
Next we examined each group’s representation index. A representation index of 1 indicated that students in the subgroup were identified as gifted at the same rate as the overall population. The representation index above 1 indicated that the proportion of identified students in the subgroup was higher than in the overall proportion in the general population. A representation index below 1 indicated that the subgroup was identified at a lower proportion than in the general population. 19 For example, the representation index of .48 for FRPL in state 1 indicated that the proportion of FRPL students identified as gifted was less than half as large as the overall proportion of identified students within the state.
As seen in Figure 1, there was notable underrepresentation of identified gifted learners in the categories of FRPL, Latinx, African Americans, and EL across all three states. For example, the representation indices for states 1, 2, and 3 for FRPL were .48, .61, and .63, respectively, meaning that FRPL students were about 50% to 60% as likely to be identified as gifted than the overall proportion of identified students within the state. The representation indices for Black students were .38, .55, and .41, indicating that Black students are less than half as likely to be identified as gifted than the overall proportion of identified students in two of the three states and almost half as likely in the third.
We also computed the relative risk for each state. Relative risk is the proportion of a subgroup identified as gifted divided by the proportion that were not in the subgroup identified as gifted. 20 In state 1, non-FRPL students were almost four times as likely to be identified as gifted as FRPL students (i.e., relative risk for non-FRPL/FRPL = 34.4/9.2 = 3.74), and White students were almost four times as likely to be identified as gifted as Black students are (27.0/7.4 = 3.65). In state 2, White students were almost twice as likely to be identified as Black students (13.3/7.7 = 1.73), and in state 3, White students were over three times as likely to be identified as Black students (14.2/4.4 = 3.23). These results underscore the differences in identification rates for historically underrepresented groups. The relative risks (RR) for White vs. Black that we computed based on longitudinal data were larger than RR estimates based on cross-sectional OCR data in states 1 and 3 (White vs. Black RR based on OCR data of 3.03, 2.70, and 2.27, respectively, versus our longitudinal data of 3.73, 2.22, and 3.22, respectively). 21
Examining relative risks for underserved racial/ethnic groups who were FRPL students versus non-underserved racial/ethnic groups who were non-FRPL students highlights the dramatic differences in identification rates. As mentioned earlier, in state 1, students who were non-FRPL, non-EL, and White or Asian were almost six times more likely to be identified as gifted compared to students who were FRPL and Black or Latinx (37.0%/6.3% = 5.78). In states 2 and 3, students who were non-FRPL, non-EL, and White or Asian were 2.66 and 3.46 more likely to be identified as gifted than students who were FRPL and Black or Latinx (16.2%/6.1% = 2.66; 20.4%/5.9% = 3.46). These relative risks were even higher when examining the overlap of under-representation by race/ethnic, SES, and EL status. The relative risks when we compared students who were not in poverty, non-EL, and White or Asian to students who were EL, in poverty, and Black or Latinx are 8.41, 2.38, and 3.71, respectively (see Table 3).
Conditional Underidentification
Next, to determine whether this underrepresentation was a function of early academic achievement, we examined the degree of underidentification for students with similar levels of 3rd-grade achievement. Each state exhibited substantial achievement gaps across demographic groups. If achievement gaps exist, and if higher achievement predicts identification as gifted, then the underidentification in gifted identification might be driven by achievement gaps across student subgroups. If differences in early achievement explain differences in identification, then holding academic achievement constant, the probability of being identified as gifted should not differ across demographic groups. In other words, after controlling for math and reading achievement, we would expect to see (approximate) proportional representation.
Figures 2–5 show the relationship between 3rd-grade math and reading/language arts achievement and the proportion of White vs. Black students (Figure 2), the proportion of White vs. Latinx students (Figure 3), the proportion of FRPL and non-FRPL students ever-identified as gifted (Figure 4), and the proportion of EL vs. non-EL students (Figure 5). These graphs plot the proportion identified by average achievement percentile (we averaged the ELA and math achievement then rank ordered the students by percentile). The x-axis only shows students at the 50th percentile and above because very few students in the lower half of the 3rd-grade achievement distribution were identified as gifted.
As expected, students with higher academic achievement were more likely to be identified as gifted, regardless of background. However, for all 3rd-grade math and reading achievement levels, Black students were identified at lower rates than White students in states 1 and 3. In state 2, there was no identification gap between Black students and White students with similar mathematics and reading achievement. Latinx with similar math and reading achievement had similar identification rates as non-Latinx in states 2 and 3. However, in state 1, Latinx students were underidentified as gifted across all math and reading achievement levels. In state 1, there was also a notable FRPL/non-FRPL identification gap, even after controlling for 3rd-grade math and reading achievement. Finally, in state 1, there was a noticeable identification gap between EL and non-EL students, even after controlling for mathematics achievement. In the other two states, comparisons of students with similar math and reading achievement substantially reduced (or eliminated) these identification gaps. In fact, in state 2, EL students were identified at slightly higher rates than non-EL students with similar levels of math and reading aachievement.
In sum, when disparities in identification were compared by achievement percentiles, disparities in identification diminish dramatically (see Figures 2–5), suggesting that differences in mathematics and reading achievement did help to explain much of the disparity in identification rates across the three states. Even so, some disparities in identification rates remained, especially in state 1.
Research Question 2: How Does Student Achievement in Mathematics and Reading Relate to Gifted Identification Gaps?
The three-level multilevel logistic models provided inferential tests for the descriptive observations (listed previously) and further examination of the relative influence of early mathametics and reading achievement and school characteristics on disparities in gifted identification. Table 4 presents the results from a multilevel model that estimates the level of underidentification of FRPL, EL, Black, and Latinx students in gifted programs with and without controls for achievement. Across the three states, before controlling for academic achievement, Black, Latinx, and FRPL students were underidentified in programs for the gifted. In states 1 and 3, EL students were also underidentified in gifted programs (Model 1). After controlling for academic achievement, in states 1 and 3, FRPL, EL, Black, and Latinx students had lower levels of underidentification in gifted programs. And in state 2, after controlling for academic achievement, there appeared to be no discernible underidentification.
Not surprisingly, controlling for the proportion of gifted students in the school strongly predicted the likelihood of being identified as gifted (log odds of 11.04, 8.98, and 13.21 in states 1, 2, and 3 respectively; see Table 4). Students in schools with higher proportions of gifted students were more likely to be identified as gifted. For example, all else being equal, in a school whose percentage gifted was 10% higher (i.e., a proportion of .1), students were between 2.45 and 3.74 times more likely to be identified as gifted (exp(8.98*.1) = 2.45 and exp(13.21*.1) = 3.74).
Figure 6 graphs the predicted probabilities of being identified as gifted for FRPL vs. non-FRPL, EL vs. non-EL, and by racial/ethnic groups, both with and without controls for achievement. The predicted probabilities were estimated with math and reading achievement at 1.5 standard deviations above the state mean, which corresponds to the 93rd percentile. These figures highlight the findings fromTable 4. All three states showed notable differences by FRPL, EL, and race/ethnicity prior to controlling for achievement (Figure 6, Model 1–Table 5). In state 2, the disparities between FRPL students and non-FRPL students, between Latinx and White students, and between Black and White students disappeared after controlling for academic achievement and school characteristics (see Figure 6, Model 2–Table 4). In states 1 and 3, there were still noticeable disparities in the identification rates of Black and White students (b = –.30 in state 1; b = –.34 in state 3), Latinx and White students (b = –.18 in state 1; b = –.25 in state 3), and EL and non-El students (–.24 in state 1; b = –.30 in state 3). In state 1, there were still disparities between FRPL students and non-FRPL students (b = –.47), although these disparities decreased considerably after controlling for achievement (and school/district characteristics).

Inequalities in gifted identification with and without controls for achievement (+1.5 SD).
Change in the Odds of Models With and Without Controls for Achievement

Note: The decrease in disparity is calculated based on the change in the difference from parity (where parity has an odds of 1) for the odds with achievement (OwA) and the odds without achievement (OwoA). The proportion decrease in disparity is equal to ((1 – OwoA) – (1 – OwA)) / (1 – OwoA).
Completely disappeared and the decrease in disparity is equal to or over 100%.
The adjusted differences were much smaller than the unadjusted differences (i.e., differences not adjusted for demographic, SES, student, school, or district characteristics). For example, Table 2 shows the unadjusted difference in identification rates between FRPL vs. non-FRPL 22 students were .25, .09, and .12 for states 1, 2, and 3, respectively, compared to the adjusted differences between White non-FRPL and Black FRPL of .06, .03, and .03 in states 1, 2, and 3, respectively (see Figure 6).
Figure 7 graphs the predicted probabilities of being identified as gifted for students who were Black and FRPL eligible compared to non-FRPL and White students for different levels of 3rd-grade achievement from Model 3. This figure highlights the differences in gifted identification rates between high vs. low SES and White vs. Black students after controlling for student, school, and district variables. First, students with higher 3rd-grade achievement were more likely to be identified as gifted by 5th grade compared to students with lower 3rd-grade achievement. Second, SES and Black/White identification differences largely disappear for the highest-achieving students (see Figure 7). Third, state 1 is notable for having a large Black & FRPL vs. White and non-FRPL gap among students who score between .5 and 1.5 standard deviations above the mean. But this gap largely disappears in the highest-achieving students. This White and non-FRPL student advantage among above average but not the highest-achieving students is an area that future research should explore further. Fourth, it is possible that at the lower end of the figure for state 3, our model might not be performing well in the lower tail because our predicted probabilities show more students identified than would be expected among average-achieving students with achievement levels equal to the state mean.

Predicted probability of being identified as gifted for Black and FRPL vs. White and non-FRPL students.
Table 5 shows the degree to which the disparities in gifted identification could be explained by early achievement disparities. In this table, we present the odds of identification with and without controls for achievement. We also calculated the percentage change in odds after controlling for achievement. Last, we calculated the decrease in underidentification as the percentage change in the disparity in identification rates (i.e., 1-odds). We defined disparity in identification rates as the distance from equality or parity (i.e., the distance from odds of 1). For example, in state 1 the odds of being identified as gifted for FRPL vs. non-FRPL students was .32. This means FRPL students were one-third as likely to be identified (32%) as non-FRPL students. However, after controlling for achievement, the odds of being identified as gifted for FRPL vs. non-FRPL students rose to .66. This means that the identification rate of FRPL students was now two-thirds (66%) of the identification rate of non-FRPL students. This was a 105% increase in the odds (see Table 5, column 3, row 1). In addition, the disparity (i.e., the distance from odds of 1) was reduced by 50% as shown in Table 5, column 4, row 1 (i.e., (1 – .66) / (1 – .32) = .34 / .68 = .50).
The decrease in the underidentification column (i.e., decrease in disparity) for state 2 in Table 5 shows that the disparity in identification for EL and Latinx students in state 2 completely disappeared. For other states, controlling for achievement reduced the underidentification between 50% to 95% (see Table 5). Figures 8 and 9 graphically display the findings from Table 5. Figure 8 highlights the changes in the odds of identification with and without achievement. Figure 8 shows that the gifted identification gap was dramatically reduced when controlling for achievement. 23 As shown in Figure 9, across all three states, at least 50% of the identification gaps between Black and White, Latinx and White, FRPL and non-FRPL, and EL vs. non-EL were accounted for by achievement; in some cases, achievement accounted for nearly 100% of the identification gap.

Odds of being identified as gifted by subgroups.

How much of the underidentification gap declines when early academic achievement is controlled?
Table 5 and Figure 9 summarize the key findings of this paper: a large portion of underidentification was accounted for by 3rd-grade achievement. Early achievement accounted for 50% to 94% of the non-FRPL/FRPL disparity, 49% to 100% 24 of the non-EL/EL disparity, and 54%–80% of the White/Black disparity. In contrast, the effect of early achievement for White/Latinx disparities in gifted identification was much more varied, with 5% to 94% of the disparity accounted for by early achievement.
Tests of Intersectionality and Opportunity Hoarding
We tested the degree of intersectionality by examining the effects of the interaction between race/ethnicity and student poverty on the log odds of being identified as gifted. We reestimated Model 3 with the variables FRPL by Black, FRPL by Latinx, FRPL by Asian, and FRPL by other for each of the three states. Only one of these interaction terms in one state was statistically significant (FRPL by Black interaction in state 1). We found that the positive coefficient for the FRPL by Black in state 1 did not change the rank order of disadvantage in the log-odds of being identified as gifted for Black and FRPL students, but the interaction term did slightly narrow the gap in the log odds of being identified between Black non-FRPL and White FRPL. In the model without an interaction, the log odds of being identified were –.72, –.42, and –.30 for Black FRPL, White FRPL, and Black non-FRPL students. The log odds were –.68, –.50, and –.47 when the interaction effect was included (White non-FRPL was the reference category for these coefficients). The results of the models that include the interaction are available in online appendices A and B.
A supplemental analysis that examined the interactions of district percentage Black and Latinx on the student-level race effects did not provide support for the opportunity hoarding prediction (see Appendix E). To model possible opportunity hoarding, we estimated the interaction of race/ethnicity at the student level by the proportion of Black and Latinx students at the school and district level as well as the interaction of FRPL at the student level with the proportion FRPL at the school and district level. The opportunity hoarding hypothesis predicts a negative interaction effect of student demographics (FRPL, Black, or Latinx) with the school or district demographics (proportion of students in a school or district who are FRPL, or Black/Latinx). There were no statistically significant negative interactions in any of the three states. In state 3, there was a statistically significant positive interaction effect for Black by proportion Black and Latinx at the district level: in state 3, Black students were more likely to be identified as gifted in districts with more Black and Latinx students. In states 1 and 2, there was a statistically significant positive interaction effect for Latinx by proportion Black and Latinx at the school level: in states 1 and 2, Latinx students were more likely to be identified as gifted in schools with more Black and Latinx students. In state 3, there was a positive and statistically significant interaction of student-level FRPL with school proportion FRPL, suggesting that FRPL students were more likely to be identified as gifted in schools with higher percentages of FRPL students. In sum, we did not see evidence of opportunity hoarding, and in certain instances, we actually saw the opposite effect.
Summary and Discussion
This study found notable underrepresentation of students in poverty, EL students, and Black and Latinx students in gifted programs in three states. Our research estimates representation indexes substantially below 1 for FRPL, Black, Latinx, and ELs, indicating high levels of underrepresentation in gifted programs (see Table 3). These low representation indexes for EL, FRPL, Black, and White students are even more striking given the high levels of overrepresentation for students who are not in poverty and are White or Asian. Students who were non-FRPL, non-EL, and White or Asian were about two to eight times more likely to be identified as gifted than students who were EL, FRPL, and Black or Latinx.
Our results suggest higher levels of underrepresentation than previously reported. Although school-level data from the 2018 OCR documents elementary school Black/White and Latinx/White relative risks of .55, our study showed even greater disparities, with relative risks for Black vs. White students of .27, .45, and .31 across these three states. In two out of three states, these relative risks were lower than state-level estimates based on cross-sectional OCR data. These findings are consistent with existing research using ever-gifted measures of giftedness to calculate state-level gifted representation versus cross-sectional measures of gifted representation. For example, research in Utah showed that estimates using longitudinal data showed lower Black representation in gifted programs with a Black vs. White relative risk of .82 versus 1.23 in cross-sectional OCR data (Peters et al., 2019; Warne et al., 2013) 25 .
As expected, 3rd-grade math and reading achievement was highly predictive of identification as gifted. In our three-level models, we found a positive association between student, school, and district achievement and the log odds of being identified as gifted (Table 5). In addition, academic achievement appeared to explain a great deal of the identification gaps across demographic groups. In state 2, 3rd-grade student achievement largely accounted for underidentification. In states 1 and 3, there was still notable underidentification, even after controlling for achievement; however, more than 50% of the disparity between over- and underrepresented groups was accounted for by academic achievement for Black vs. White, FRPL/non-FRPL, and EL/non-EL disparities. Latinx vs. White disparities did not appear to be as strongly influenced by early achievement gaps (see Table 5). Future research should explore which factors might account for the differences in the influence of academic achievement on gifted identification. In addition, future research could explore why academic achievement seems to have a stronger influence on identification rates of FRPL and Black students than EL and Latinx students. These differences might be due to differences in gifted identification systems, differences in state or district policies, or differences in the ways that achievement gaps manifest across different contexts.
The difference between state 2 and the other states suggest that future research should examine why there are state-level differences in the influence of early achievement differences on identification gaps. Unfortunately, we obtained our data with an agreement not to reveal the names of the states studied. Therefore, this discussion cannot reveal state policies that might disclose the identity of the states in our study. Future research should develop data sets and indicators to examine the influence of factors such as modification of gifted identification policies, the influence of high levels of universal identification statewide, the presence or absence of a holistic universal identification system that develops talent scouts, or the history of systemic racism in the educational system in certain states.
Future research should also examine why achievement better predicts gifted identification disparities for certain groups but not others. Unfortunately, our data do not allow us to directly examine why achievement seems less predictive of Latinx/White disparities in certain states. To answer this question requires a deep theorizing of the multiple sources of cumulative disadvantage different racial/ethnic groups face in different states and the cumulative advantage of historically overrepresented groups (e.g., the legacy of White privilege in neighborhoods, schools, and states such as residential segregation and other sources of wealth disparity on access to affluent neighborhoods and affluent schools; Oliver & Shapiro, 2006; Orr, 2003; Rothstein, 2017) and also policies within schools that might privilege White students (Brown et al., 2003; Ford, 2014, 2016).
In addition, given the role of teachers’ expectations in gifted identification (Grissom & Redding, 2016; Hunsaker et al., 1997; Lamb et al., 2019), future research could expand on these findings by examining a data set that allows for the analysis of students nested within teachers within schools within districts. These data would help us examine whether the residual disparities in identification after controlling for student achievement occur at the teacher, school, or district levels.
Alternative Interpretations: Opportunity Hoarding, Achievement-Focused Identification Systems, Deficit Perspectives, or Opportunity Gaps
The large influence of early achievement differences on disparities in gifted identification could provide evidence of early opportunity gaps. However, these differences could be due to opportunity hoarding by high-income and White and Asian parents, differences in the use of achievement scores in identification, or deficit explanations instead of opportunity gap explanations.
Opportunity Hoarding
If high-income White and Asian parents know that their children have achievement scores that tend to be higher than other subgroups, they might push for a gifted identification system that primarily uses achievement scores creating a system of opportunity hoarding. In our supplemental analysis examining the interactions of district percentage Black and Latinx on the student-level race/ethnicity effects, the opportunity hoarding prediction was not supported (see Appendix E). We found no evidence that districts with greater proportions of Black and Latinx students had a stronger advantage in identification for White students. Nor did we find evidence that districts with greater proportions of FRPL students had a stronger advantage in identification for non-FRPL students.
Achievement-Focused Identification Systems
It is possible that variation in the use or weighting of achievement scores could be a cause for these disparities. This explanation is not supported by a survey and qualitative observations conducted in these three states (Gubbins et al., 2020; Long & Gubbins, 2021). Survey research of districts in these three states found that 95% of districts use achievement scores for identification. Therefore, it is unlikely that the use or lack of use of achievement scores could drive the association between achievement and identification disparities. Further, the state with the highest influence of achievement scores also had qualitative evidence of using a wide variety of identification strategies beyond just focusing on achievement scores (Gubbins et al., 2020). This suggests that the strong influence of achievement is not due to an achievement-focused identification system.
Deficit Perspective vs. Opportunity Gaps
Researchers who subscribe to a deficit perspective might interpret our findings as evidence of class or racial/ethnic differences in educational priorities or other deficit interpretations (Flores, 2007; Thernstrom & Thernstrom, 2003). However, decades of research from the opportunity gap perspective have refuted the deficit perspective (Brown et al., 2003; Carter & Welner, 2013; Ladson-Billings, 2006). For example, Black families tend to have higher educational expectations than White families (Harris, 2011; Tyson & Lewis, 2021). 26 Prior research provides strong evidence for opportunity gap explanations of achievement differences from the role of access to high-quality educational opportunities (Harris, 2011); wealth differences (Conley, 2009; McIntosh et al., 2020; Orr, 2003; Shapiro, 2005); and systemic racism’s influence on poverty, early child health, neighborhood quality (Duncan & Murnane, 2011; Magnuson & Waldfogel, 2008), segregation (Orfield, 2013; Rothstein, 2017), and access to culturally relevant curricula (Aronson & Laughter, 2016; Garces-Bacsal & Elhoweris, 2022; Griner & Stewart, 2013; Ladson-Billings, 2009). Carter and Welner (2013) and Harris (2011) argue that these different components of systemic racism have led to an opportunity gap that generates large early achievement differences between Black and White students in early elementary school.
Limitations
There are several limitations of our analysis due to a lack of available census data on continuous measures of family education, income, and wealth; classroom and school characteristics; and state and district policies. First, it is possible that data on continuous measures of socioeconomic status such as family income, wealth, or parental education could show persistent effects of SES not captured by the FRPL measure. Grissom et al.’s (2019) finding of race/ethnicity effects only for the top SES quintile suggests that there is a chance that the experiences of Black students from high SES families might differ from the experience in low SES families. We found this pattern in state 1, but a continuous measure might show this pattern in the other states. Also, given the nature of wealth as an indicator of cross-generational impact of systemic racism, it is possible that we would see a persistent effect of SES if we had wealth measures instead of FRPL measures (Conley, 2009; McIntosh et al., 2020; Shapiro, 2005). Second, given the limitations of our data, we cannot say much about the reasons for differences in the effect of achievement across subgroups due to our lack of indicators of the mechanisms behind the different influence of achievement on Latinx and EL students versus Black students and students in poverty (e.g., levels of segregation, wealth differences, neighborhood differences, and direct measures of bias in district and school practices). Third, our data-sharing agreement with the states to keep state identification confidential prohibits discussion of differences in state policies.
Another possible limitation is that we are examining differences in numerous point estimates across different models across different states. It is possible that the outlier findings in our analysis could be due to the large number of models estimated. For example, even if we restrict our analysis of the changes in the coefficients for the log odds of being identified as gifted for students who are EL, FRPL, Black, Latinx, Asian, or White at the student level, we still have 54 estimates across six coefficients for three states for three models each (3*3*6). Therefore, if we were using a .05 p-value then we might incorrectly identify at least two of these coefficients as statistically significant when they are not. To reduce this potential risk of type one error, we use a .01 p-value or smaller in evaluating our multilevel logistic models.
What Should Be the Focus of Research on Underrepresentation—Early Opportunity Gaps or Bias in Identification?
Our findings suggest that future gifted-education research should more deeply examine the sources of the opportunity gaps that lead to test score disparities by 3rd grade. These opportunity gaps are an important source of gifted-identification disparities. Therefore, policies that focus on eliminating achievement disparities prior to 2nd or 3rd grade (when most schools identify students for gifted programs) could help to increase equity of gifted program participation.
Early academic achievement appears to have a dramatic influence in explaining disproportional rates of gifted identification across different student subgroups. Because models controlling for early academic achievement reduce the disparity in gifted identification rates by at least 50%, much of the underidentification in gifted programs appears to be explained by early achievement gaps. The strong predictive influence of early academic achievement on gifted identification reinforces the need for educators to focus considerable attention on reducing early achievement disparities. To combat these underrepresentation issues, closing early achievement gaps may be more effective than changing identification practices. Our study does not support the recent claim that the underidentificaiton of Black and Latinx students is entirely due to systemic bias and educator practice within the gifted-identification process itself (Shores et al., 2020). Instead, early achievement gaps explained between 50% and 100% of the underidentification of Black, Latinx, EL, and FRPL students. Because achievement differences did not explain all the differences in identification, the interactions between achievement levels and the identification processes and the degree to which they interact in producing disparities should be examined in future research.
This strong influence of achievement disparities on rates of underidentification also suggests that past efforts to address underrepresentation such as nonverbal tests and multiple measures might not have much effect. This is consistent with Hodges et al. (2018) meta-analysis of identification policies that found that nonverbal tests and other nontraditional identification practices did little to narrow the identification gap between Black and White students.
Instead, our findings suggest we need to develop strategies to close achievement disparities during the first 3 years of elementary school as early achievement disparities then lead to later gifted-identification disparities. If gifted programming is beneficial, then historically underserved groups are doubly disadvantaged—first through the achievement disparities and then by having limited opportunities to participate in advanced programming due to these early achievement disparities. Given these large inequalities at the starting line (i.e., disparities in early academic achievement), it is hard to imagine how changes in identification practices alone can close identification gaps. Further, middle- or late-elementary interventions that typically occur in 2nd or 3rd grade may occur too late to affect identification. These findings suggest that talent development and efforts to improve equity in academic achievement need to happen at earlier ages. Improving the academic achievement of underrepresented groups should greatly improve the representation of historically underserved students in gifted programs. Policies that address the racial/ethnic, EL/non-EL, and the FRPL/non-FRPL academic achievement gaps before and during elementary school may have the largest impact on reducing both achievement gaps and identification gaps.
Supplemental Material
sj-docx-1-ero-10.1177_23328584231171535 – Supplemental material for Inequality at the Starting Line: Underrepresentation in Gifted Identification and Disparities in Early Achievement
Supplemental material, sj-docx-1-ero-10.1177_23328584231171535 for Inequality at the Starting Line: Underrepresentation in Gifted Identification and Disparities in Early Achievement by Daniel A. Long, D. Betsy McCoach, Del Siegle, Carolyn M. Callahan and E. Jean Gubbins in AERA Open
Footnotes
Declaration of Conflicting Interests
The author(s) declared no potential conflicts of interest with respect to the research, authorship, and/or publication of this article.
Funding
The author(s) disclosed receipt of the following financial support for the research, authorship, and/or publication of this article: This study was conducted by the National Center for Research on Gifted Education (![]() ), which is funded by the Institute of Education Sciences, U.S. Department of Education PR/Award No. R305C140018 and R305C200012.
), which is funded by the Institute of Education Sciences, U.S. Department of Education PR/Award No. R305C140018 and R305C200012.
Supplemental Material
Supplemental material for this article is available online.
Notes
Authors
DANIEL A. LONG is a research scientist at the National Center for Research on Gifted Education at the University of Connecticut, 2131 Hillside Road Unit 3007, Storrs, CT 06269-3007; e-mail:
D. BETSY MCCOACH is a professor of research methods, measurement, and evaluation in the Department of Educational Psychology at the University of Connecticut, 249 Glenbrook Road, Unit 3064, Storrs, CT 06269-3064; e-mail:
DEL SIEGLE is the Lynn and Ray Neag Endowed Chair for Talent Development at the University of Connecticut, 2131 Hillside Road Unit 3007, Storrs, CT 06269-3007; e-mail:
CAROLYN M. CALLAHAN is professor emerita at the University of Virginia, Charlottesville, Virginia; e-mail:
E. JEAN GUBBINS is associated with the University of Connecticut, Department of Educational Psychology, Renzulli Center for Creativity, Gifted Education and Talent Development, 2131 Hillside Road, Unit 3007, Storrs, CT 06269-3007; e-mail:
References
Supplementary Material
Please find the following supplemental material available below.
For Open Access articles published under a Creative Commons License, all supplemental material carries the same license as the article it is associated with.
For non-Open Access articles published, all supplemental material carries a non-exclusive license, and permission requests for re-use of supplemental material or any part of supplemental material shall be sent directly to the copyright owner as specified in the copyright notice associated with the article.