
Abstract
This paper examines changes from 1996–2019 in U.S. parents’ time investment at their children’s schools using data from the National Household Education Survey (N ≈ 116,000). The most common way parents spend time at their child’s school is by attending a general school meeting, which rose from 76% to 85% over this period. The proportion who volunteered at school rose slightly over time (36% to 38%), whereas the frequency of participating in school activities decreased slightly. Little change emerged in the proportion who attend a PTA/PTO meeting (~50%), whereas the proportion who spent time fundraising decreased (60% to 54%). Differences in time investment between high- versus low-income parents either narrowed significantly (attended school meetings, frequency of participation) or remained stable (attended PTO/PTA meeting, volunteered) over time, except for income-based differences in time spent fundraising for their child’s school, which grew significantly. We discuss factors possibly related to these narrowing and persistent gaps.
Keywords
Economic growth for much of the 20th century supported America’s promise of offering opportunities to both parents and their children. However, income inequality increased and intergenerational upward mobility decreased in the United States beginning in the 1970s (Atkinson et al., 2011). Recent research suggests that these macroeconomic forces have played an important role in the dramatic increase in parents’ investments (of time, money, and energy) in their children’s learning and development across all income levels. In recent work, Doepke and Zilibotti (2019) discuss how macroeconomic conditions and social policies shape parental behavior: in high-inequality societies, parents are motivated to use their resources to secure limited opportunities for their children through an intensive parenting style in which parents invest heavily in their children’s skill development.
Indeed, intensive, deliberate parenting time devoted to children’s education and learning has increased substantially in the last decades (Flood et al., 2022). For example, in the United States, the time per week that mothers and fathers spent with their children increased by about 6 hours each between the late 1970s and 2005 (Doepke & Zilibotti, 2019). Moreover, an increasing share of this time has been devoted to stimulating or educational activities that help children learn. In the United States, in particular, the increase in time spent on childcare activities has been even greater for college-educated parents, thus plausibly reinforcing inequalities by family background in parental investments and children’s opportunities (Doepke & Zilibotti, 2019; Flood et al., 2022).
Nonetheless, several recent studies show that low-income parents too have significantly increased their time investments in children’s learning at home over the past several decades in the United States (Bassok et al., 2016; Flood et al., 2022; Kalil et al., 2016). And, even when income-based gaps in parenting behaviors persist, for many key measures the lowest-income parents today are spending as much time supporting their children’s learning as did the highest-income parents 25 years ago, reflecting major changes overall in parents’ behavior (Kalil et al., 2016).
The present study examines parents’ time investment at another key site for parental support of their children’s learning and development—namely, at their child’s school. Specifically, we examine change over the past 20 years in parents’ time investments at their children’s schools and how the nature of these changes may have differed for low- and high-income parents. Scholars have long argued that the time parents spend at their child’s schools is an important element of children’s social capital and educational success (Crosnoe, 2012; Crosnoe & Cooper, 2010; Lareau, 1989, 2015; Lareau & Horvat, 1999; Vincent, 2017), as measured, for example, by time spent at parent meetings, volunteering in the classroom, and time spent fundraising for the school. We hypothesize that just as U.S. parents at all income levels have intensified the time they spend on children’s learning at home, parents on average will also have increased the time they spend at their children’s schools, reflecting changes in macroeconomic conditions that increasingly demand parents’ efforts to support their children’s success (Doepke & Zilibotti, 2019).
In this descriptive study, we also ask whether any observed increases in parents’ time investment in children’s schools are similar for parents with different levels of income. Research describing structural barriers to parents’ participation in school and the various ways in which parents from low-income, racial minority, and immigrant status backgrounds face more of these barriers than their more advantaged peers (Kim, 2009; Lee & Bowen, 2006; Posey-Maddox & Haley-Lock, 2020; Rollock et al., 2015) suggests that changes over time in parents’ time investments in children’s schools may differ by family background.
Background
Changes in Parent Time Investments in the Past 30 Years
Scholars from a variety of fields have documented significant changes in parenting in the United States in the past 30 years. In broad terms, this change can be characterized as an increasing endorsement by parents at all income levels of “intensive” parenting (Ishizuka, 2019), characterized by concerted investments of time, money, and attention in the development of children’s cognitive skill and emotional adjustment and a reduction in harsh or punitive measures of control or discipline.
Some work shows substantial heterogeneity by family background in the rate of increase in parents’ time investments. For example, Doepke and Zilibotti (2019) show that between the years 2003 and 2006, mothers with a college degree spent on average four hours more on childcare per week compared to mothers with no more than a high school education, though both groups had registered striking increases since the mid-1990s. Restricting the focus to more discrete and intense parental care activities (such as reading to children), and in some cases examining more recent data, suggests a greater degree of convergence. Kalil et al. (2016) and Bassok et al. (2016) showed not only that lower-income parents caught up to their higher-income peers between 1988 and 2012 in children’s book ownership and children being taken to the library, but also that income-based gaps in reading daily, teaching academic skills like letters and numbers, and regular storytelling plateaued after 2005. Further, using the most recent data from the American Time Use Survey, Flood and colleagues (2022) report that although children from more advantaged households receive more hours of intense parental engagement, the gap by family background fell from about 8 hours per week in the early 2000s to 3 hours by the late 2010s.
The fact that low- and high-income parents alike in the United States are increasing their time investments, especially in intensive activities linked to child skill development, could be interpreted as showing that economic forces are incentivizing parent behavior across the socioeconomic spectrum. Supporting this idea is evidence from Ryan et al. (2020), who showed that parents at the top and bottom of the income distribution have converged over the past 30 years in the kinds of skills they most want to instill in children, in particular those skills that yield dividends in today’s economy. Specifically, when asked to choose from a list of five characteristics they think are most important to instill in their children, the plurality of parents at all income and education levels select “thinks for self” as most important and nearly as many select “works hard.” Conversely, “helps others,” “obeys,” and “to be well-liked or popular” are far less often nominated.
Of course, measuring parents’ values is not the same as measuring parents’ time investments in children’s learning and education, but taken together, these studies suggest that parents across the income distribution agree on the beliefs and behaviors that help children succeed in a competitive, global economy. Further, there is now near universality in parents’ predictions that children will go to college even among low-income parents (Taylor et al., 2011) and an acknowledgment among lower-income and less-educated parents that education is more important today than before (Irwin & Elley, 2011; Vincent & Ball, 2007). In short, the rise in income inequality in the United States alongside increasing economic returns to college (and parents’ increasing awareness of this fact) may have prompted more parents, low- and high-income alike, to spend more of their time on education-related activities to bolster their children’s chances of success.
Parents’ Time Investment at their Child’s School
Most studies of parents’ time investments in their children’s skill development or education focus on parents’ time at home (see Flood et al. [2022] for a comprehensive review), but the school environment represents another arena for parent time investment. For instance, involvement in Parent Teacher Associations and Organizations (PTAs and PTOs) is an avenue through which parents can spend time supporting their child’s education (Murray et al., 2019). Although the causal impact of parent participation in these organizations on child’s academic success has not been established, Cucchiara (2017) finds that when parents attend a PTA meeting, it is likely to be in the service of fundraising for such things as improvements to school facilities, materials, enrichment programming, and even additional teachers, all of which might benefit children’s learning and development. Some research suggests that high-income parents are, on average, more involved or engaged in their children’s schools, using such measures as time spent serving on the PTA (Crosnoe, 2012), but, unlike the broader parental time use literature, the historical trends are not well established.
Parents can also spend time attending general events and volunteering in their children’s schools in various capacities, including in the classroom. Attendance at school-wide meetings, though perhaps the least time-intensive activity (in part because such meetings occur infrequently), nonetheless provides a forum for sharing information and building social ties with other parents. Parents who spend time volunteering in their child’s school or classroom can informally track their child’s educational progress and get to know their child’s teacher and other parents, which provides a forum for building social capital on behalf of the parent’s child (Crosnoe, 2012). To the extent that parents volunteer their time in the classroom, specifically, they are also effectively lowering the teacher-student ratio or possibly serving in informal roles as teaching assistants, factors that have been established in other work to be causally related to children’s educational outcomes and later life achievement (Dynarski et al., 2013; Hemelt et al., 2021). School-based volunteer organizations in which parents spend their time institutionalize social ties among parents by offering events, facilitating information-sharing and access to school personnel, and potentially building trust and organizational capacity at the school (Coleman, 1988; Murray et al., 2019; Small, 2009). Like PTA/PTO involvement, high-income parents are, on average, more likely to report participating in volunteer work at their child’s school than low-income parents (Crosnoe, 2012), but it is not well established how this might have changed over time and for which types of parents.
Present Study
Although a large body of research has focused on parents’ time investments in the home environment, on how these patterns have changed over time, and for whom, little is known about parents’ time investments in their child’s school setting. The present paper provides new evidence on this important question, asking if parents’ time investments at their child’s school have increased over time on average, if income-based gaps have changed over time, and if these trends apply equally to various school activities. To do so, we explore a high-quality, large-scale quantitative dataset that has not yet been used for this purpose and that provides a range of measures of parents’ time investment at school. Most importantly for our purposes, these measures are repeated over time over a 20-year period that mirrors the time frame analyzed in recent studies of changes in parents’ time investments in the home environment.
Methods
Data
Data for this study were drawn from the National Household Education Surveys (NHES), a series of repeated cross-sectional, nationally representative surveys that collect descriptive information on the education-related activities of children and adults in the United States. These surveys have been administered every 3 years since 1991 on a range of topics, including family involvement in education. The NHES relies on a two-stage sampling design, wherein sampled households are asked to complete a screener questionnaire describing their household composition, which determines the eligibility and selection of household members for the topical surveys being fielded that year.
The NHES Parent and Family Involvement in Education Survey (PFI) focuses on parents with children in kindergarten through 12th grade, inquiring about their school-related decisions and participation in their child’s education. This involvement is measured with respect to time spent at school—such as volunteering—and at home, such as helping with homework. The initial screening survey selects a focal child for the PFI if there are multiple school-aged children within the household, and the survey respondent must be a parent or guardian familiar with the selected child’s education. The PFI has been administered at seven time points: 1996, 1999, 2003, 2007, 2012, 2016, and 2019, all of which were included in our sample. Although the method of completing these surveys shifted from a telephone-conducted survey to a paper-based form that families were asked to complete starting in 2012, the similarities in sampling design over the course of the PFI allow education-related trends to be analyzed over time. Any relevant changes in the wording of questions across survey years that may affect our analyses are discussed in the discussion section.
Analytic Sample
Survey participants across all years the PFI was fielded were included in this study, which is a total sample of 116,583 respondents. We then restricted the sample to those whose child attended a public school, which brought our analytic sample down to 92,539. With this sample, there was complete data across our main independent variable and income level, as well as our main dependent variables that measure parents’ time investments at their children’s school. All analyses were weighted with the study-provided weight, fpwt.
Measures
Income
To measure income, parents were asked to select an income category that best matched their total household income in the past year, including sources like salaries, interest, and retirement. These income categories varied over time, with as few as 10 categories and as many as 14, as did their ranges, which were measured in anywhere from $5,000 increments to $50,000 increments. Because comparing income asked in different ways over time was the central analytic challenge of this paper, information regarding how we harmonized income measures across cohorts is detailed in the analytic strategy section.
Measures of Parents’ Time Investments at their Child’s School
The PFI had several measures that tapped the different ways parents spend time at their children’s schools. The questions we rely upon ask about a range of time investments in the child’s school, including attendance in general school meetings, such as open houses or back-to-school nights, PTA or PTO meeting attendance, whether parents participated in fundraising in the child’s school, and whether they volunteered in the child’s school. Although our measures of parent time use at their child’s school primarily rely upon dichotomous measures of parents’ participation in meetings and volunteering, the PFI also includes a relevant question about the frequency of this participation.
All these questions asked whether any adult in the sampled household has spent time in these school-related activities, which we recognize may include adults other than parents or guardians. However, for simplicity’s sake, we will be referring to these measures as parental activities because parents are the typical adults who spend time at a child’s school.
Attendance at a General School Meeting
Across the 1996 to 2019 survey years, respondents were asked about adult attendance in general school meetings. Specifically, respondents were asked to indicate whether, since the beginning of the school year, they or any other adult in their household had “attended a general school meeting, for example an open house, back-to-school night, or meeting of a parent-teacher association,” with options for “yes” or “no.” Starting in 2007, however, this question shifted slightly, as respondents were asked a separate question for whether any adults had attended a PTA/PTO meeting, so PTA/PTO meeting attendance was no longer included as an example of a general school meeting in the later survey years.
Attendance at a PTA/PTO Meeting
In 1996, and again from 2007 to 2019, respondents were asked about their family’s attendance at PTA/PTO meetings at their child’s school. Respondents were asked to indicate whether, during the school year, any adult in the household had “attended a meeting of the parent-teacher organization or association,” with response options for “yes” or “no.” Although attendance at a PTA/PTO meeting was included as an example of the general school meeting question from 1996 to 2003 as described previously, we were not able to isolate which of those parents participated in PTA/PTO meetings and which attended other general school meetings. As a result, we were not able to use the general school meeting question as a comparison point to the PTA/PTO question and thus did not analyze PTA/PTO meeting attendance in 2003 and 2007. In 1996, a random half of the respondents were asked a separate question about their PTA/PTO attendance, so we did have usable information for comparison on PTA/PTO attendance in 1996.
Volunteering at Child’s School
Respondents were asked whether any adults in the household had volunteered in the focal child’s school in comparable ways across the survey years. From 1996 to 2003, the question asked whether sometime during the school year an adult had “acted as a volunteer at the school or served on a committee,” whereas from 2007 to 2019 the question asked whether an adult had “served as a volunteer in this child’s classroom or elsewhere in the school,” to which respondents could reply “yes” or “no.”
Fundraising Within Child’s School
From 2003 to 2019, respondents were asked the same question about fundraising. Specifically, they were asked whether any adult in the focal child’s household had, since the start of the school year, “participated in fundraising for the school.” Participants provided “yes” or “no” responses to this question.
Frequency of Parent Participation
Across all survey years, respondents were asked how often any adult in the focal child’s household went “to meetings or participated in activities at this child’s school” during the school year. Respondents gave a free response of the number of times any adult in the household had participated in activities at their child’s school.
Analytic Strategy
The aim of this paper is to understand the relationship between parents’ income levels and the time they spend at their child’s school, as well as whether there have been changes in this relationship over time. However, two main challenges arise in estimating these relationships and trends: one, income levels in the United States over the past 20 years have varied considerably, making, for example, the value of a $50,000 yearly income in 1996 difficult to compare to the same income in 2019. However, even if these values were adjusted for inflation, a second problem would remain, which is that the income was measured categorically in the PFI and the number of categories and their values varied over time. These categorical measures of income obscure the individual’s precise income level, which further complicates our ability to make comparisons over time.
To overcome these challenges, we employed a series of strategies. First, we compare rates of parent time investment by income percentiles in each survey year. This method helps standardize the differing values ascribed to income levels at each time point. For example, when comparing rates of time volunteering among parents in the 90th percentile of income, we are always comparing the highest-income parents relative to each survey year to one another, even if their underlying incomes vary. Moreover, when comparing the difference in rates of volunteering between parents at the 90th and 10th percentiles of the income distribution, we are comparing parents who are similarly situated relative to each other in each year, even if raw income levels and differences shift over time. Next, to overcome the challenge of having categorical income values, we utilize a technique established by Reardon (2011) that allows us to create estimates of endorsement by parents of each of our dependent variables by income percentiles. The authors found that in using this technique, there are not systematic differences in estimates based on the numbers of categories, thus allowing us to compare these percentiles across survey years.
The categorical nature of the income measures in the PFI only allow us to observe an individual’s category of income, which we will call X. Somewhere within the range of the values of X lies an individual’s precise income, which can be represented by θ. Given that we are trying to capture the relationship between parents’ time investments in schools (Y) and their income (θ), we can represent our research question through the equation:

Because we do not know θ, we must instead estimate the function using the weighted average of X for each of our dependent variables of interest. To obtain these predicted values, along with their standard errors, we predict each of our measures of parents’ time investment at their child’s school for each income category separately using a weighted least-squares regression, with the study-provided survey weight, fpwt. This process is repeated across all categories of income, the total of which can be represented by K, for each survey year. The intercepts from these models represent an estimate of the expected parental investment of time in their child’s school for each income category, which we will refer to as
Next, we take the cumulative percentage of parents in each of these income categories to determine the probability of being within each group. Let

The cubic function allows our data to fit the model more flexibly, in case the relationship between parental time investment and income is not linear. The equation was weighted by the inverse sampling variance of
These values are used to determine parents’ average time investment (per each of our dependent variables) at the 90th, 50th, and 10th percentiles of income for each survey year. The 90/10 gap of parental time investment is then calculated by subtracting the average value at the bottom 10th percentile of income from the top 10th percentile of income, as detailed in the following equation:


Once we obtained the estimated 90/10 gaps of parental time investment at their child’s school, our final step was to systematically test whether there were differences in these gaps over time. To do so, we ran a series of pooled t-tests that compared the estimated gaps from each survey year to one another, two at a time. The same testing was conducted to compare time investment among parents at the 90th percentiles over time, the 50th percentiles over time, and the 10th percentiles over time. Differences in parent time investment were also tested among parents that made up the 90th, 50th, and 10th percentiles within each survey year.
Using this approach, we estimate parental time investments at each income percentile without controlling for other demographic characteristics that typically covary with income, including race/ethnicity, parent education level, and region. This study aims to describe trends over time in parental time investments in schools and how those trends may vary by household income, not to isolate the causal effect of income on parental time investments. By describing trends over time, we can illuminate the implications of rising income inequality for children’s skill development and the intergenerational transmission of economic status as a result. If we were to partial out our estimates demographic characteristics that covary with income, we would obscure those implications.
Results
Sample Description
As Table 1 displays, the education and racial/ethnic background of this subsample of the NHES largely mimics U.S. population statistics in each cohort. Unfortunately, the categorical income information in the NHES obscures average income levels in the cohorts, making it difficult to see if it is relatively representative of the U.S. population.
Demographic Characteristics of Sample by Cohort
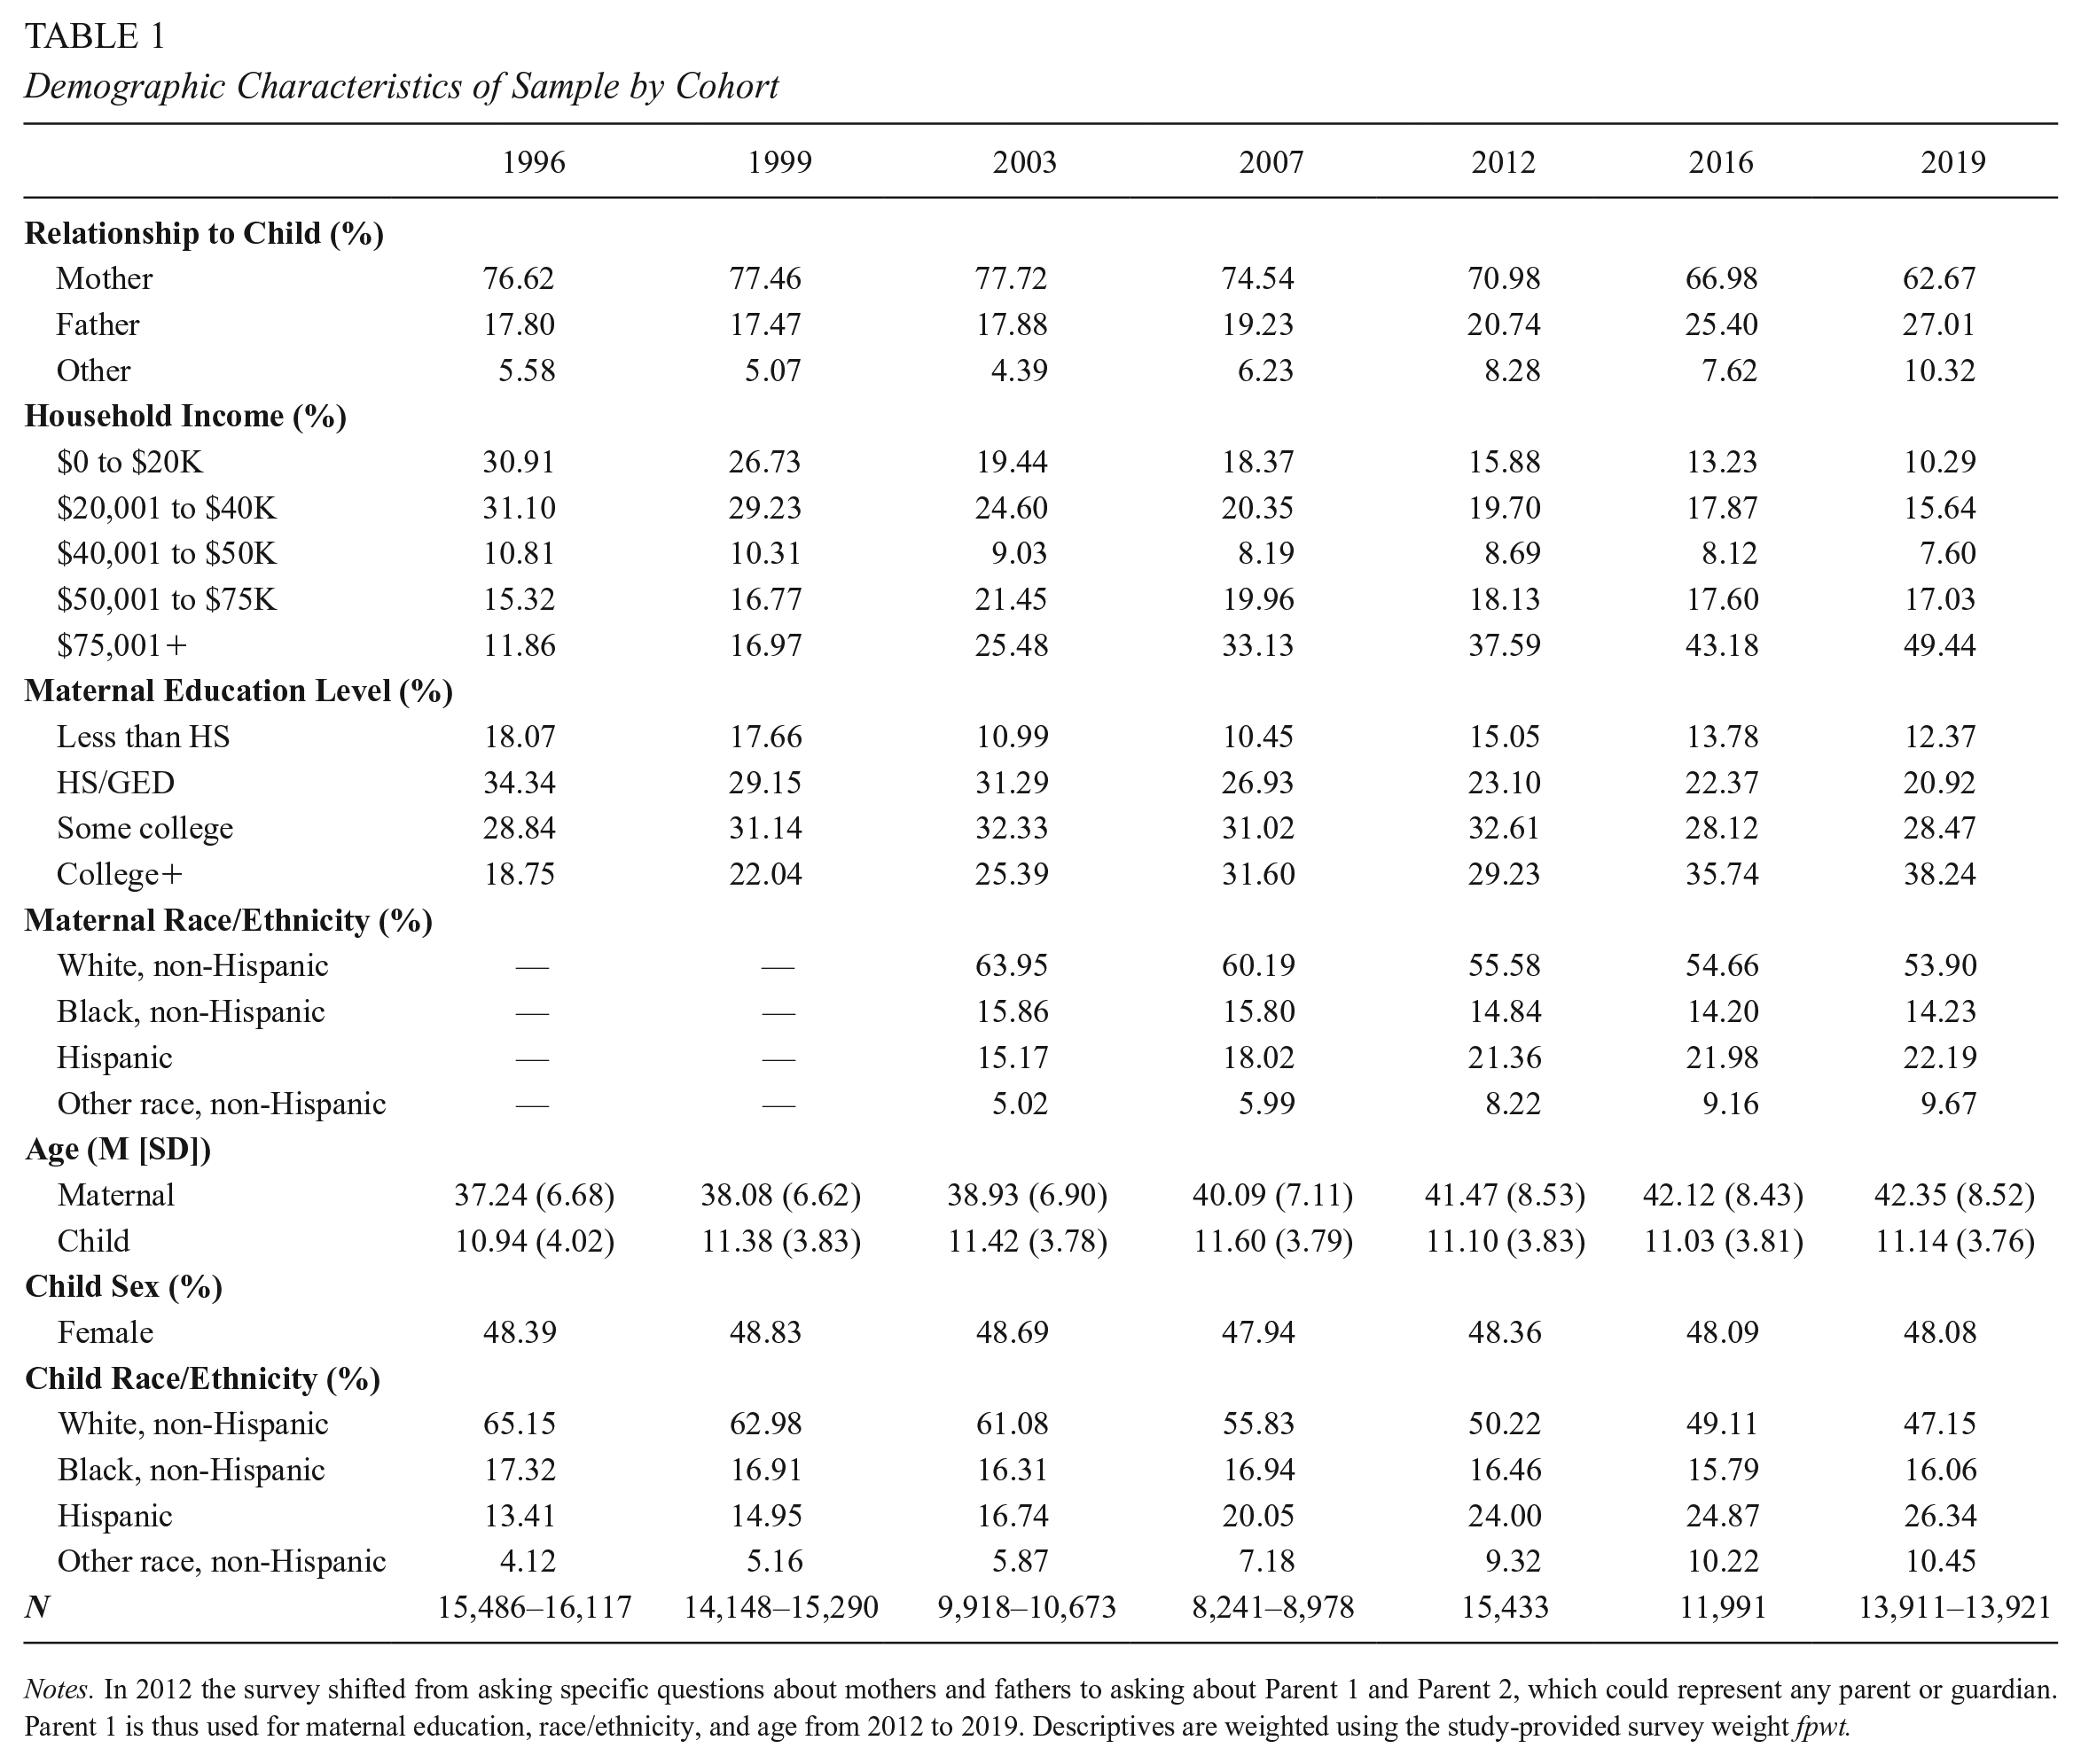
Notes. In 2012 the survey shifted from asking specific questions about mothers and fathers to asking about Parent 1 and Parent 2, which could represent any parent or guardian. Parent 1 is thus used for maternal education, race/ethnicity, and age from 2012 to 2019. Descriptives are weighted using the study-provided survey weight fpwt.
Table 2 presents the percentage of each cohort that endorsed each parent activity. Overall, the proportion of parents who attended a general school meeting significantly increased over time, from 76% in 1996 to 85% in 2019. The proportion of parents who reported volunteering at their child’s school also increased over time, though by a much smaller magnitude, with rates just under 40% at each time point. The number of times parents reported participating in activities at their child’s school decreased slightly from 1996 to 2019, after significantly increasing by 2016. The proportion who reported attending a PTA/PTO meeting remained stable over time. Finally, the proportion of parents who reported fundraising for their child’s school decreased from when it was first measured in 2003 to 2019, from about 60% to 54%.
Parent Time Investments for Each Activity by Cohort
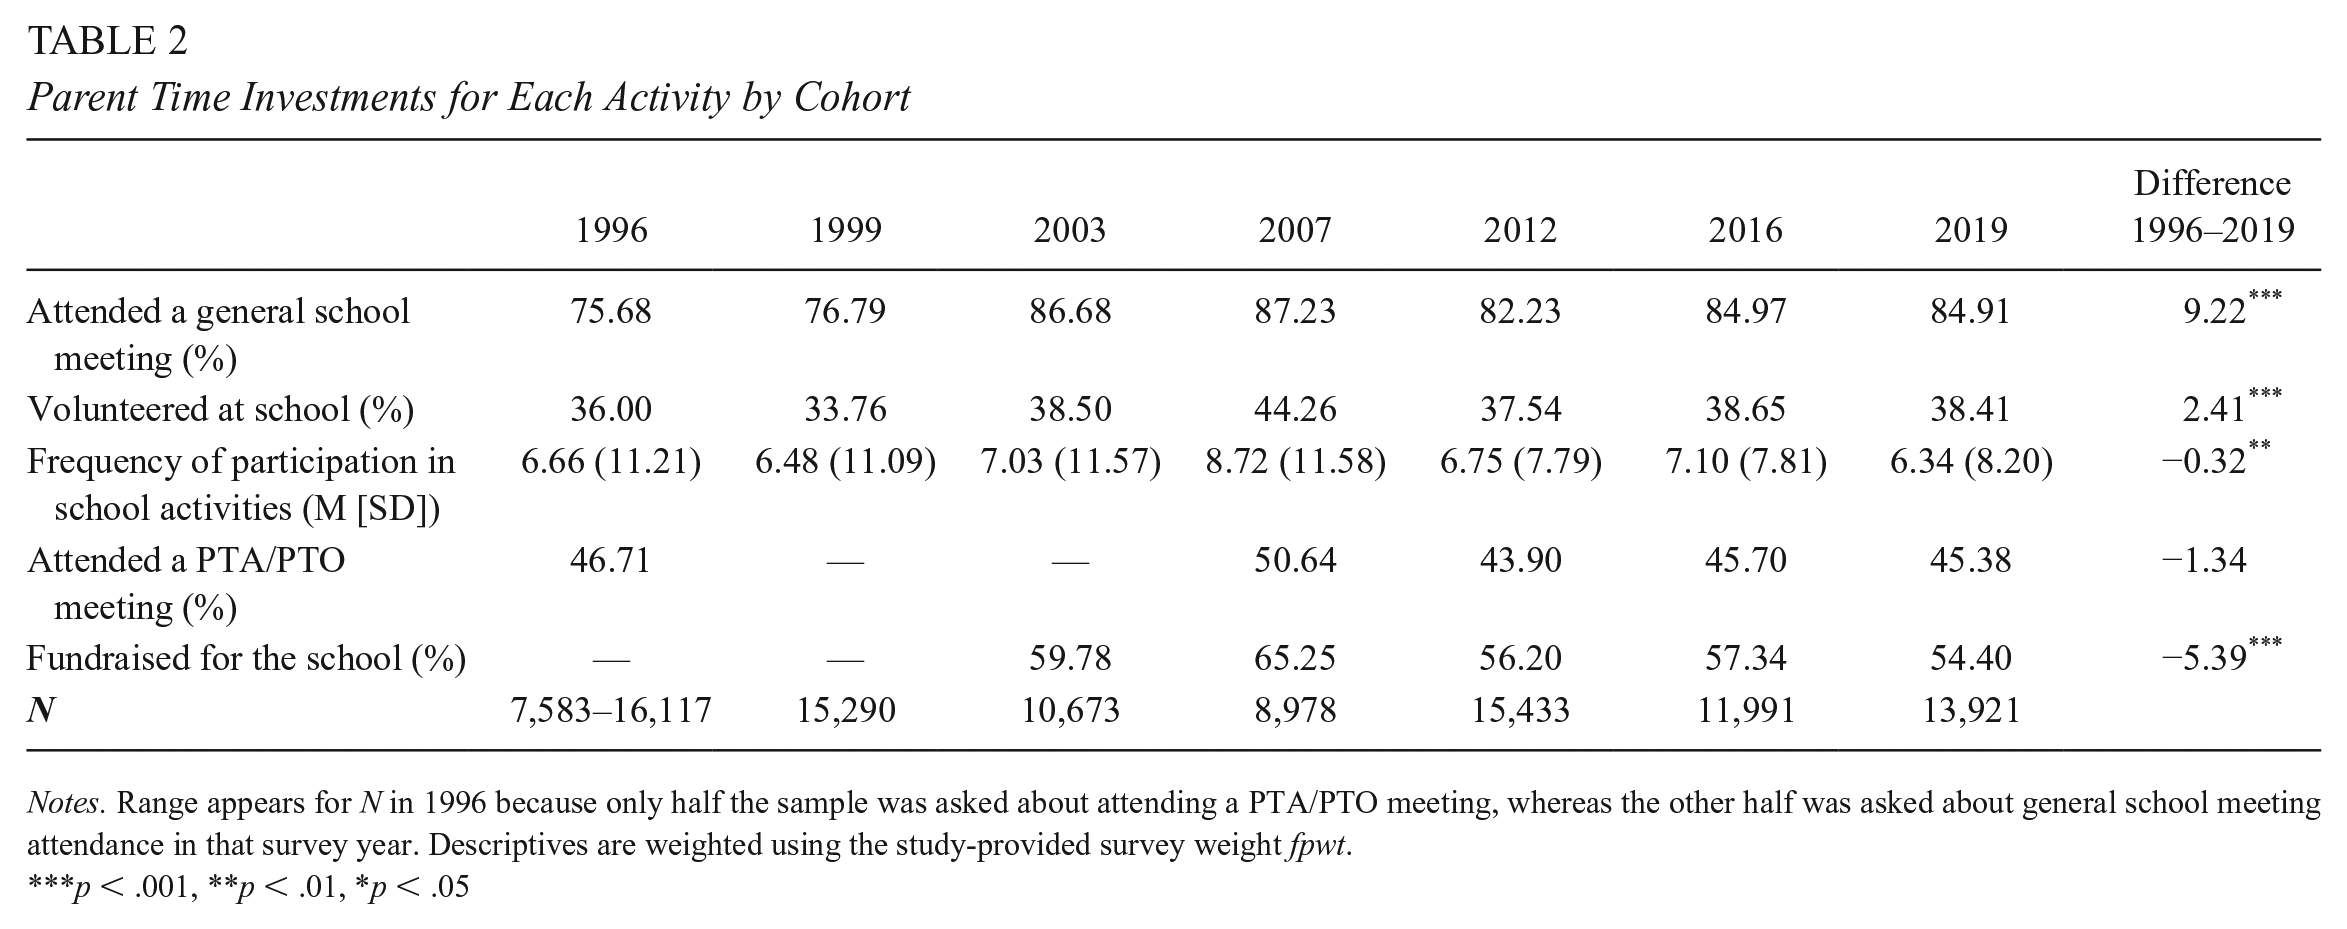
Notes. Range appears for N in 1996 because only half the sample was asked about attending a PTA/PTO meeting, whereas the other half was asked about general school meeting attendance in that survey year. Descriptives are weighted using the study-provided survey weight fpwt.
p < .001, **p < .01, *p < .05
Income-Based Differences Over Time
Table 3 presents the point estimates and standard errors for the 90th percentile, the 10th percentile, and the gap between the 90th and 10th percentile (90/10) for each measure of parent time investment across each year grouping. Estimates are also displayed for the 50th percentile to establish the median response. A large share of low- and high-income parents alike report attending a general school meeting each year. For instance, between 87% and 95% of parents at the 90th income percentile report attending a general school meeting at all survey time points, whereas nearly three-quarters of parents also do so at the 10th percentile. Over time, the likelihood that parents at both the 90th and 10th percentiles of the income distribution attended a general meeting increased significantly (90th percentile: t = 4.69, p <. 001; 10th percentile: t = 5.93, p <. 001). Whereas all parents increased their likelihood of attending a general school meeting over time, the increase was greater for parents at the 10th percentile, resulting in a narrowing of the 90/10 income gap over the entire period, with high-income parents significantly more likely to report attending a meeting by about 20 percentage points in 1996 (t = 11.8, p <. 001) and only about 15 percentage points more likely in 2019 (t = 11.6, p < .001). The time trends for these estimates are illustrated in Figure 1.
Estimated Parents’ Time Investment at Child’s School by Income Percentile and Cohort

Notes. From 1996–2003, parents were asked whether they attended a general school meeting (including PTA/PTO meetings, open house, back-to-school nights, etc.), whereas from 2007–2019 they were separately asked if they attended a PTA/PTO meeting. In 1996, half the parents were asked if they attended a general school meeting (including PTA/PTO) and the other half were just asked if they attended a PTA/PTO meeting. Estimates within a year for a given activity that do not share a common subscript are significantly different at p < .10.
p < .001, **p < .01, *p < .05, +p < .10.
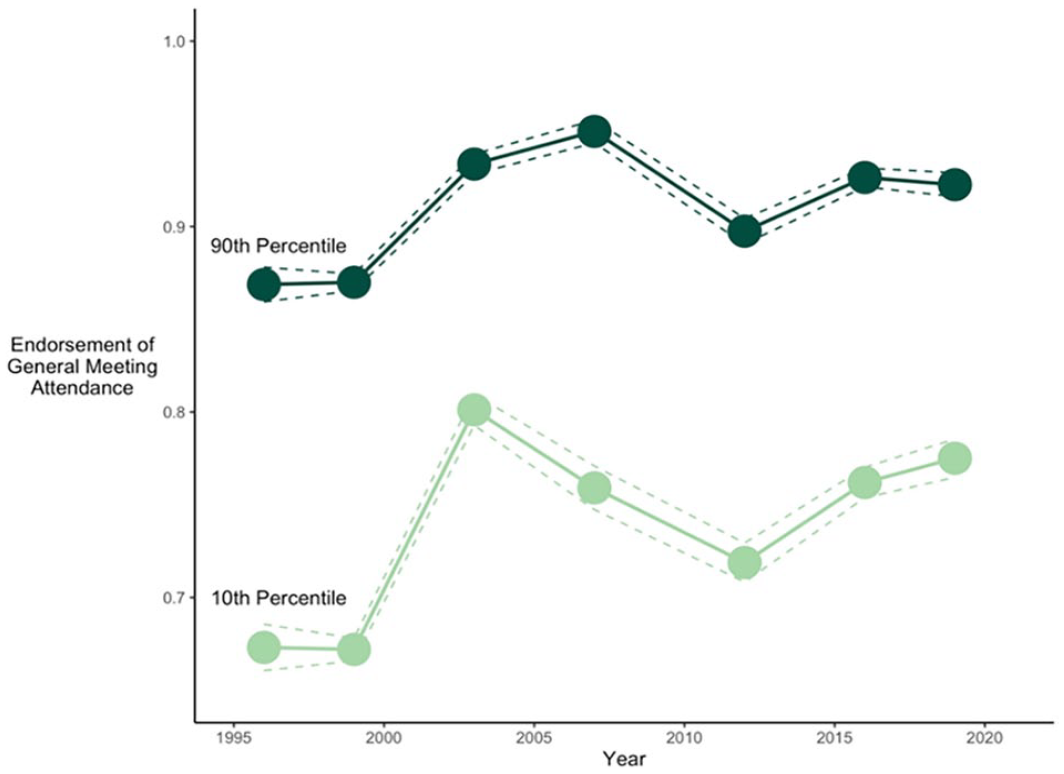
Parents’ general meeting attendance 1996–2019, by income percentile.
We also find large income-based gaps in the share of parents who report volunteering at their child’s school. In each year, about half of high-income parents reported volunteering whereas only about one-quarter of low-income parents reported doing so, with significant differences in each year at p < .001. These income-based gaps favoring high-income parents were relatively stable over time, hovering around 30 percentage points in a given year (e.g., 1996: t = 14.8, p < .001; see Figure 2). In addition, higher-income parents report attending nearly twice as many school events each year compared to parents at the 10th percentile of the income distribution (i.e., an average of 10 events per year compared to about half that number in 1996, respectively), with significant differences that persist at p < .001 in each year (see Figure 3). However, the difference between these two groups significantly narrows by 2019 (t = −3.78, p < .001) due to high-income parents attending events less frequently over time and low-income parents attending them at the same rate.
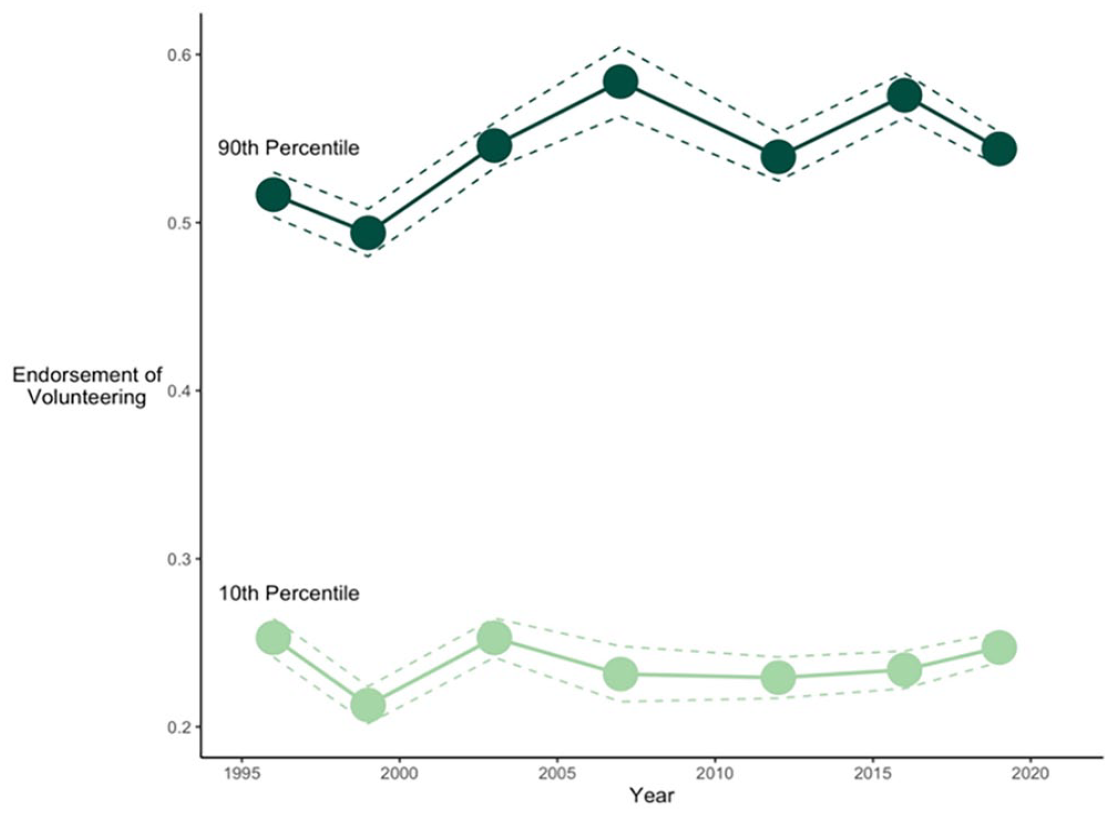
Parents’ participation in volunteering 1996–2019, by income percentile.

Parents’ frequency of participation in child’s school 1996–2019, by income percentile.
Trends for attending PTO/PTA meetings follow a different pattern. Roughly half of all parents report attending a PTO/PTA meeting across income levels in a given year, but notably there is a significant initial gap of 6.6 percentage points favoring high-income parents in 1996 (t = 2.97, p < .01), which closes entirely by 2019. Because the gap was so small to begin with, however, the gap change between 1996 and 2019 is not significant, nor are the slight decreases in attendance by parents at the 90th and 10th percentiles over time. These changes, though small, do suggest a convergence among high- and low-income parents in PTA/PTO attendance over time, as illustrated in Figure 4.

Parents’ participation in PTA meetings 1996, 2007–2019, by income percentile.
Finally, we find large income-based gaps in the share of parents who report spending time fundraising at their child’s school. In each year, almost three-quarters of high-income parents report fundraising compared to less than half of low-income parents, a significant difference in each year (e.g., 2003: t = 19.1, p < .001; 2019: t = 12.7, p < .001). These income-based gaps favoring high-income parents have grown significantly. For example, the 90/10 income gap in 2003, the first year in which we have data on this outcome, was 22 percentage points, which grew to a 30 percentage point gap in 2019 (t = 3.05, p < .01). This pattern was driven by the decrease in the proportion of lower-income parents fundraising over time, from 47% to 39% (t = −4.34, p < .001), whereas the likelihood that higher-income parents spent time fundraising was stable from 2003 to 2019 at about 70% (see Figure 5).
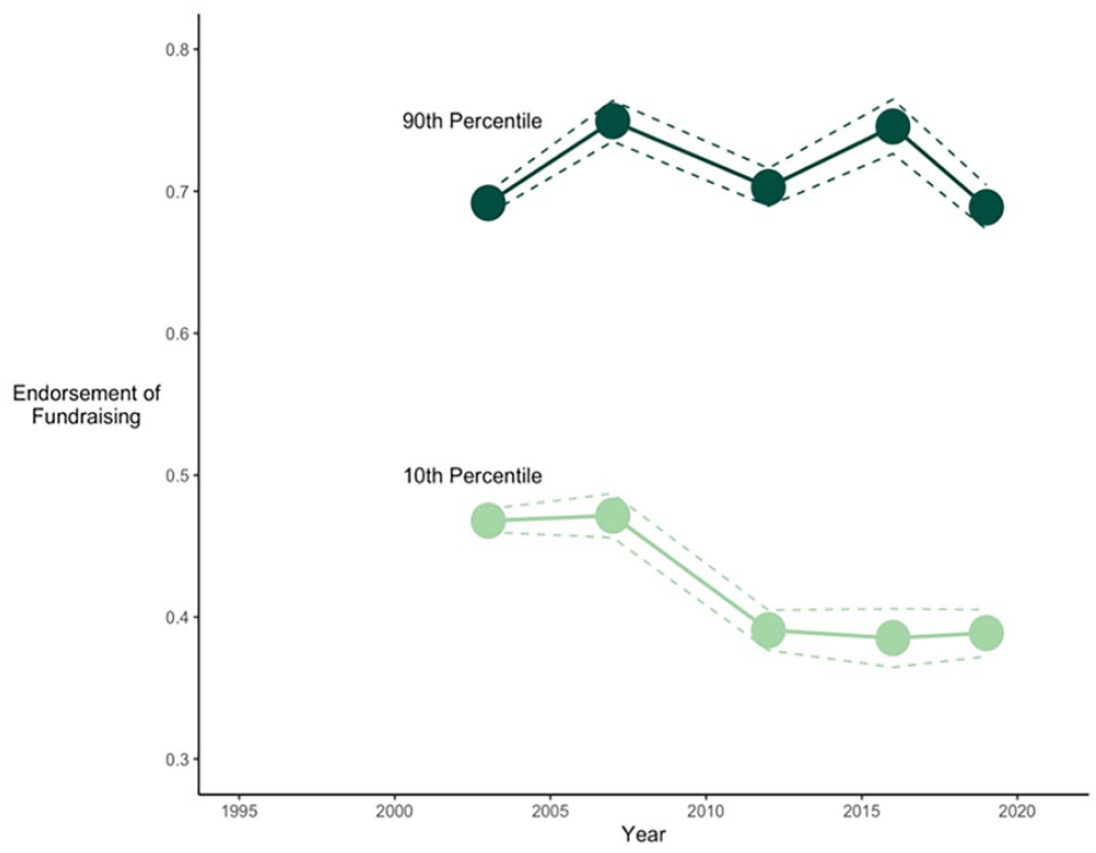
Parents’ participation in fundraising 2003-2019, by income percentile.
Discussion
As income inequality and the economic returns to education have risen in the United States, so too have the time and money parents at all income levels invest in their children’s academic skills and emotional resources (Bassok et al., 2016; Flood et al., 2022; Kalil et al., 2016). Doepke and Zilibotti (2019) argue that these trends are causally linked such that in countries with higher-income inequality, the high stakes of educational attainment motivate parents to invest more of their own time and money in children’s educational success. Although these dynamics theoretically reinforce income-based differences in parental investments, recent research finds that some long-documented differences in parents’ time investments have narrowed during the most recent period of declining economic mobility in the United States. The present study investigated whether these trends extend to parents’ time investment in children’s schools. We found some support for this hypothesis: income-based differences in parents’ attendance of general school meetings and participation in school events declined significantly over time, the former because parents at the 10th percentile of the income distribution increased their participation. Differences in attendance at PTO/PTA meetings also declined because lower-income parents increased their participation, although not significantly, whereas the rate of volunteering remained stable for high- and low-income parents, as did income-based differences. The income-based gap in participation in fundraising, however, grew over time because lower-income parents decreased their engagement in these activities while higher-income parents did not. In short, income-based differences in all activities either narrowed or remained stable over time, with the exception of time spent fundraising. We offer both reasons for and implications of these findings.
First, it is important to note that our results align with previous research examining parents’ involvement in school by income level. With respect to all activities except for attendance at PTA/PTO meetings, higher-income parents report engaging in activities for their child’s school more than parents with lower incomes, even in the most recent period. What gives rise to these income-based gaps in parents’ attendance and volunteering? Structural factors, including constraints on parents’ time, likely play a significant role (Posey-Maddox, 2014). For instance, low-income parents may be more likely to work in jobs with less flexibility to make extensive time commitments to volunteer at their child’s school, or to attend meetings during standard daytime work hours (Presser, 2003). They may also be less likely to have affordable, available childcare during meeting or volunteering times (Crosby et al., 2019). In addition, given profound resource differences between and within school districts and communities, schools in low-income communities may be less likely to offer ample volunteering opportunities relative to schools in high-income areas. Finally, traditional partnerships between parents and school or district leaders often reflect deficit conceptions of marginalized parents and families that can discourage parental involvement in schools (Ishimaru, 2014).
Parents’ private contributions of time and money likely facilitate the unequal distribution of educational opportunities both within and across schools; indeed, although parent involvement in the school may be a public good (Murray et al., 2019), more recent scholarship on inequality has characterized the school organizations like the PTA as an example of the “opportunity hoarding” of high-SES parents (Calarco, 2018; Cucchiara & Horvat, 2009; Lareau & Horvat, 1999; Reeves, 2017). Popular explanations for the observed increase in high-income parental investments in the home environment include that the increasing competition for scarce spots in elite universities motivates high-income parents to increase the time they spend at home cultivating their child’s skills (Ramey & Ramey, 2010) and, generally, high-income parents perceive greater competition for remunerative careers for their children (Ryan et al., 2020). The same phenomena could explain income-based gaps in how parents spend their time at their child’s school.
Given these constraints, it is notable that lower-income parents have increased in their engagement in children’s schools over time, in some cases narrowing or closing entirely the historical income-based gap. Specifically, we found that the 90/10 gap in general meeting attendance in 1996 reduced significantly by 2019, as did the difference in frequency of participating in school activities. These findings support the theory that in a context of high income inequality, alongside high economic returns to education, parents will be motivated to secure their children’s economic futures through exceptional personal investments of time in their children’s educational success (Doepke & Zilibotti, 2019). That low-income parents have increased their time investments in schools even more than higher-income parents with respect to certain activities suggests that either high-income parents were already investing at very high levels or that low-income parents have shifted their attitudes toward school involvement more over time (Ryan et al., 2020).
As hypothesized, however, we did not see convergence over time with respect to activities related to fundraising for children’s schools. We note that this difference grew even during the shorter time period over which we had data on time spent fundraising relative to other activities (2003–2019 vs. 1996–2019). Different trends may help explain this unique divergence. First, given the contemporaneous rise in income inequality (Atkinson et al., 2011), parents at the 90th percentile may simply have more money to donate relative to those at the 10th percentile and thus be motivated to spend time fundraising given their growing ability to contribute. A complementary trend is rising income segregation in U.S. neighborhoods and, thus, public schools (Owens et al., 2016; Reeves, 2017; Taylor & Fry, 2012); this trend means not only do higher-income parents have more money to donate to public schools, but they are increasingly likely to live in communities where other parents also have more money to donate. Either or both of these trends could make parents in higher-income communities likely to expect to raise large amounts of money for their child’s school in the time they spend fundraising, a motivation not shared by low-income parents living in increasingly concentrated low-income communities. Supporting this interpretation, these differences in time spent fundraising over time mirror large (and growing) differences in actual fundraising revenue for PTAs/PTOs in high- versus low-income communities (Rowe & Perry, 2020; Schaller & Nisbet, 2020; Yoon et al., 2020).
Although the foregoing are plausible explanations for the patterns we document, we note that we cannot present causal evidence as to the mechanisms behind these trends. Even the link between rising income inequality, declining social mobility, and the investment trends we find merely reflect co-occurrence and cannot be causally connected using these data. Additionally, our measures of parental time spent at their children’s schools are limited. The dichotomous nature of the attendance questions may obscure differences (or similarities) in the frequency of participation across parents and qualitative differences in the level of engagement, interpersonally, that parents deploy when attending a meeting or event. Moreover, the specific questions may not fully capture the ways that low-income parents invest time in their children’s schools, as traditional school-based models of parent involvement rarely account for the many ways that low-income parents, particularly those of color, participate in their children’s education (Cooper, 2009; Paredes Scribner & Fernández, 2017). Future research on this topic should include more qualitatively nuanced measures of parental time use, as well as other behaviors parents engage in that reflect school engagement of low-income parents and parents of color.
Moreover, changes in the ways the survey questions were asked over time may have contributed to patterns we captured in the data. However, the changes to the questions surrounded the examples provided, such as what kinds of roles constitute volunteering or what kind of meetings count as general school meetings, not the main aim of the question itself, so it is unlikely that these shifts in examples meaningfully altered our results. Where possible to investigate this potential bias, there is little evidence that changes in the questions drove changes in participants’ responses. For instance, from 1996 to 2003, parents were asked if they attended a general school meeting, including PTA/PTO meetings. Then, in 2007, parents were asked separate questions for general school meetings and PTA/PTO meetings. Our results find that rates of general school meeting attendance went up in the period after 2007 relative to the period before, for all parents. We would expect that by making the question more restrictive in not counting PTA/PTO meetings as a general school meeting, that rates of general meeting attendance would go down over time if the wording of the question systematically altered participants’ responses. Further, general school meetings are more heavily attended by parents than PTA/PTO meetings in this study, with over 90 percent of all parents who attend a PTA/PTO meeting also attending a general school meeting in every year parents were asked both questions. Therefore, any biases associated with the question change would be expected to be downward, and we still find significant increases in general meeting attendance over time, suggesting the patterns we find are persistent even with possible downward biases from survey question changes.
Finally, we understand that the differences in parental time investments in schools we describe are relevant to the growing income-based segregation of schools in the United States. During the period we examine, between-school district income segregation of families with children enrolled in public school increased by over 15%, and between-school segregation of students who are eligible for free lunch increased by over 40% (Owens et al., 2016). The inequalities in parental time investments in schools, alongside well-documented inequalities in monetary contributions, could exacerbate these growing between-school differences. Linking parental time investments in schools to neighborhood-level educational inequalities is beyond the scope of this paper, but future research should examine the link between these differences and school-level resources and student achievement.
Conclusion
Parents in a country with high levels of income inequality and high returns to education may feel more than ever that they need to invest their own time in their children’s education, including in their schools directly. We find mixed evidence for this hypothesis. Specifically, low- and high-income parents alike are doing more than ever for their children’s future, including attending school meetings and participating in school activities, and with regard to certain activities, low-income parents increasingly resemble higher-income parents. There are, however, stickier differences in time investments related to volunteering and, increasingly, fundraising. The private investment of parents’ money in their children’s schools are dwarfed by public spending on schools. Nonetheless, as Murray and colleagues (2019) assert, school-based volunteer and fundraising organizations can serve “as both a reflection of the degree of social capital present in a community and as a broker of additional social ties” (p. 44). Thus, determining how parents’ private investments in schools shape school resources and children’s education, and whether this phenomenon reinforces existing inequalities, is an important question for future education research.
Footnotes
Authors
ARIEL KALIL is a Daniel Levin Professor at the Harris School of Public Policy Studies, University of Chicago, 1307 E 60th St. Chicago, IL 60637; email:
SAMANTHA STEIMLE is a PhD candidate in the Department of Psychology at Georgetown University, 3700 O St. NW, Washington, DC 20057; email:
REBECCA M. RYAN is a professor in the Department of Psychology at Georgetown University, 3700 O St. NW, Washington, DC 20057; email: