
Abstract
Research documents positive associations between school climate and student outcomes, and, as such, many policymakers have positioned it among their chief priorities for school improvement. Despite this increased focus, extant research has offered mixed findings on the presence and magnitude of racial school climate disparities. The present study uses administrative data of middle and high schools in Georgia to examine disparities in school-climate perceptions and factors predicting them. I find that Black and “Other” students consistently report worse perceptions on nearly all measures of school climate compared to White students and that these disparities persist within school. Furthermore, Black teachers moderate Black students’ climate perceptions and are critical protective factors against the risks they face in school. Implications suggest that an increased focus on school climate is unlikely to yield equitable returns absent ancillary policy and practices that improve schooling conditions influencing disparities in students’ school climate perceptions.
Introduction
Education stakeholders increasingly recognize school climate as an essential component of the school improvement process (Hamlin, 2020; Kim et al., 2014; U.S. Department of Education, 2014; Voight et al., 2013), as a well-established body of literature continues to explicate its positive effects on student and school outcomes (Burdick-Will, 2018; Hanson & Voight, 2014; Thapa et al., 2013; Williams et al., 2021). Policymakers and practitioners have expressed increased interest in understanding how students are experiencing schooling, and school climate is a useful, valid, and reliable construct to underscore these experiences (Bottiani et al., 2016; Voight et al., 2015). The policy focus on school climate is now inscribed in law, as the Every Student Succeeds Act (ESSA) mandates that in addition to testing, states must have at least “one measure of school quality or student success that is valid, reliable, and comparable across the state” (Darling-Hammond et al., 2016, p. 5). Using this provision, many states now include improving school climate as an essential part of their school improvement plans (Jordan & Hamilton, 2020; Ryberg et al., 2020; Temkin & Harper, 2017).
As states undertake greater interest in identifying and promoting avenues to improve school climate, research must keep pace by accentuating disparities in students’ schooling experiences and the factors driving them. Using school climate surveys that are increasingly common in the ESSA era, some scholars have investigated racial differences in school climate perceptions and have coined the phrase “the racial school climate gap” (Voight et al., 2015). Such work is especially critical, as racial-ethnic and religious intolerance, White supremacist ideologies, and incidences of hate crimes have been rising in recent years (Müller & Schwarz, 2018; Rushin & Edwards, 2018; Southern Poverty Law Center, 2016). To the extent that such intolerance exists within schools, a necessary step in understanding school climate must involve a rigorous exploration of factors influencing how and why students’ schooling experiences vary across and within schools (Bradshaw et al., 2009; Shirley & Cornell, 2012).
To better understand disparities in school climate experiences and the factors that influence them, this study explicates and quantifies the magnitude of racial school climate gaps in Georgia. Further, the present study also explores whether and how schools can act as protective factors for Black students, in particular, to ensure that all students experience the optimal benefits of positive school climates. Theoretically, I situate this study within the Phenomenological Variant of Ecological Systems Theory (PVEST; Spencer et al., 1997; Spencer 1999, 2006) by positioning schools as either cultivating environments that exacerbate or mitigate threats to students’ schooling experiences. With this framework in mind, the present study explores three separate but related research questions:
To what extent do racial differences exist in students’ school climate experiences, and how have they varied over time?
To what extent do school climate perceptions differ by race when adjusting for district- and school-level differences?
In what ways do schools’ contextual factors operate as risk and protective factors to influence the magnitude of the within-school racial school climate gap?
In this paper, I first synthesize the literature about school climate disparities across student subgroups. Next, I offer a review of the contextual factors influencing school climate perceptions. Following this, I unpack the PVEST framework and its implications for and application to the present study, which is followed by a detailed Methods section. After presenting findings, I conclude with a Discussion section comprising implications and directions for future research.
Disparities in Perceptions of School Climate Between Students
There is near consensus that positive school climates foster conditions that facilitate students’ academic, social, and emotional needs (Cohen et al., 2009; Gage et al., 2016; McCoy et al., 2013; Ruiz et al., 2018). However, scholars conceptualize school climate broadly, describing it as some combination of beliefs, interactions, relationships, and organizational structures that shape students’, parents’, and staff members’ school experiences (Aldridge et al., 2018; Davis & Warner, 2018; Ryberg et al., 2020). Researchers have thus used varying measures to assess school climate (Berkowitz et al., 2017), positioning it as a multidimensional construct that broadly captures “the quality and character of school life” (National School Climate Council, 2007). Although consensus is lacking regarding the specific domains that make up a school’s climate, extensive scholarly reviews underscore safety, relationships, connectedness, physical resources, and adult and peer support as common dimensions (McConnell & Kubina, 2014; Thapa et al., 2013; Wang & Degol, 2016).
However, extant evidence regarding whether and to what extent disparities in school climate perceptions exist across student subgroups remains inconclusive. On the one hand, some scholars assert that race and perceptions of school climate are only weakly correlated (Kuperminc et al., 1997; Way et al., 2007) or nonsignificant (Bradshaw et al., 2009; Koth et al., 2008; Vieno et al., 2005). Fan et al. (2011) use data from the Educational Longitudinal Study of 2002 to determine whether school- or individual-level characteristics account for more of the variance in students’ perceptions of school climate. These researchers assess school climate based on students’ perceptions of (a) order, safety, and discipline; (b) fairness and clarity of rules; and (c) teacher-student relationships. They conclude that students’ individual-level characteristics (e.g., mobility, low-income status, and problem behaviors) are more predictive of how students perceive climate than are school-level characteristics (e.g., school size, poverty, and school type), but they do not find a significant effect of race.
On the other hand, Bottiani et al. (2016) assess school climate by students’ perceptions of support from teachers and find that Black students reported significantly lower levels on this measure. Further, Voight et al. (2015) operationalize school climate by using safety and connectedness, opportunities for meaningful participation, and perceptions of adult-student relationships. They find that Black and Hispanic students reported lower perceptions of safety and school connectedness than did White students. The magnitude of these differences also varied significantly by school characteristics, suggesting that between-school variations in school-level factors account for a significant amount of the variance in these disparities, which is consistent with other work (Battistich et al., 1995; McNeely et al., 2002).
Reconciling these differences is important and challenging. One explanation about the differences in results surrounding the association of race and students’ perception of climate lies in the variability of the school climate elements that researchers assess across studies. If studies rely on different or only a few aspects of school climate, it becomes challenging to draw clear conclusions about racial school climate gaps, as they may operate differently across varying dimensions of climate. The multidimensional nature of school climate lends itself to different results in how students assess any given element. Another explanation may lie in the varied contexts in which researchers investigate students’ climate perceptions, as specific histories and sociopolitical contexts might lead to racial school climate disparities in some places and not in others. Both realities necessitate using large-scale, statewide, or national data sets to capture variations in contexts across space and time.
School-Level Factors That Drive Climate Disparities
School Composition
In addition to examining the influences of individual-level predictors of climate, such as race, important school-level characteristics might also help explain whether disparities in perceptions of climate manifest between students. For instance, evidence suggests that Black students who attend predominately White, higher socioeconomic status schools have lower perceptions of school climate relative to Black students in schools with different racial and socioeconomic compositions (Bottiani et al., 2016). Additionally, Voight et al. (2015) find that White, urban middle school students were less likely to engage in prosocial behaviors in school contexts with higher compositions of Black students, although this was not true for Black students. Voight et al.’s work suggests that White students in urban schools may have worse perceptions of school climate, which reduces the likelihood that they will pursue interactions with students from other racial backgrounds. Other studies have shown that students’ perceptions of school safety are significantly lower in high poverty schools, as they are more likely to experience violence and peer victimization (Bevans et al., 2007; Bradshaw et al., 2009; Khoury-Kassabri et al., 2004; Koth et al., 2008).
Norms That Reflect Cultural Appreciation
The extent to which schools have consistent norms that reflect a respect for diversity also influences school climate. When schools foster an appreciation for student diversity and culture, Black and Hispanic students report feeling safer and more supported (Datnow & Cooper, 1997; Mattison & Aber, 2007). Chang and Le (2010) find that Hispanic students showed higher levels of empathy toward their peers when they believed that their schools facilitated respect for cultural diversity. Schools that intentionally facilitate environments that cultivate an appreciation for the racial-ethnic and cultural backgrounds that compose today’s student populations are more likely to have students who report feeling supported, safe, and a stronger sense of belongingness (Voight et al., 2015).
Teachers
Teachers play a central role in—and may serve as primary protective factors for—establishing positive school and classroom climates. Tan (1999) finds that teachers who engaged in practices that reflected cultural respect significantly improved school engagement among a sample of Hispanic middle and high schoolers. Tan also finds that when these students believed that other students and teachers respected their culture, they reported more interest in school. Furthermore, Bellmore et al. (2012) suggest that teachers who promoted collaborations between students across racial groups influenced students’ perceptions of school norms and respect for diversity. Schools with such teachers, on average, have fewer students who self-report experiences of racial discrimination.
Besides being central figures in the cultivation of positive school climates, teachers’ characteristics can also serve as important protective factors. Although a paucity of extant literature examines the relationship between teachers’ race and school climate (Voight et al., 2015), some scholars have concluded significant associations. Goldsmith (2004) uses a nationally representative sample of eighth-grade students to assess the relationship between the proportion of teachers of Color in a school and the climate perceptions of Black and Hispanic students. This study shows that increases in the percentage of teachers of Color were significantly associated with more positive attitudes toward school for Black and Hispanic students.
Research also demonstrates that supportive student-teacher relationships are particularly salient for Black students (Decker et al., 2007; Meehan et al., 2003) and that school characteristics shape their exposure to healthy intersections with teachers (Hamre & Pianta, 2001; Hughes & Kwok, 2007). This line of scholarship also highlights how students of Color face more discrimination in mostly White and upper-class schools via relatively worse student-teacher relationships (Benner & Graham, 2013; Price et al., 2019; Seaton & Yip, 2009). However, these students fare better in schools with a “critical mass” of same-race peers (Benner & Graham, 2009).
Given the well-understood impacts of teachers of Color on students of Color’s academic and nonacademic outcomes (Fairlie et al., 2014; Gershenson et al., 2016; Redding, 2019), there is reason to believe that Black and Hispanic teachers may serve as critical protective factors for Black and Hispanic students’ climate perceptions. Descriptive evidence suggests that districts that employ more teachers of Color have higher levels of achievement for all their students, holding constant poverty rates and expenditures (Meier et al., 1999). Causal research suggests that Black teachers positively influence students’ test score outcomes and overall schooling outcomes (Gershenson et al., 2018; Hart, 2020; Joshi et al., 2018; Lindsay & Hart, 2017). Still, there is much to learn about the protective roles teachers of Color play in fostering positive school climates for minoritized students.
Theoretical Framework
PVEST guides this study’s attempts to underscore school climate disparities by showing the intersections between risks and protective factors for students’ climate perceptions. Using PVEST, I position schools as either exacerbating or mitigating threats to students’ climate perceptions (Chavous et al., 2008; Cunningham et al., 2009; O’Connor et al., 2007; Swanson et al., 2003). PVEST outlines the following interdependent components: net vulnerability level, net stress engagement, reactive coping mechanisms, emergent identities, and life stage outcomes (Spencer, 1999, 2006). Each of these elements is shaped by an individual’s perception of their experience. The theory is premised on the notions that (a) all students are situated within contexts that feature risks and protective factors and that (b) students in some settings face more risks or benefit from more protective factors than do others. Thus, the combination of each individual’s risks and protective factors is specified in the first component of PVEST, which is their net vulnerability level (Spencer, 2005; Spencer et al., 1997). Examples of risks might include rac(e)ism and socioeconomic status, and these risks may predispose students to adverse, systematically unjust conditions and outcomes. Importantly, PVEST does not position individuals’ racial-ethnic or socioeconomic backgrounds as inherent risks but acknowledges that historically disadvantaged students’ well-being is affected by inequitable and disproportionate threats they face because of racism. These threats, and not a racial or class background alone, are what PVEST scholars contend are risks to positive school experiences for marginalized students.
Protective factors (e.g., exposure to high-quality teaching and/or a diverse school staff), on the other hand, may buffer the influences of these risks and promote positive outcomes (Cunningham et al., 2018). For minoritized students, the noted risk factors may be compounded by low expectations from teachers that demean their aptitude and by the race- and/or class-based stereotypes that undermine their effort (Hope, Hoggard, & Thomas, 2016; Hope, Keels, & Durkee, 2016; McGee & Stovall, 2015). Alternatively, these students can attend schools with positive climates that intentionally function to dispel the effects of the deep-seated racism that plagues schools. In the former, schools exacerbate rather than mitigate—as is done in the latter—students’ risk factors and can lead to poor academic and socioemotional outcomes for students of Color.
The second component, the student’s net stress engagement, includes the ways risks and protective factors occur in everyday experiences (Cunningham et al., 2009; McGee & Stovall, 2015). Thus, the balance of students’ challenges compared to their supports influences their schooling experiences and life-stage outcomes. The supports students receive mitigate the effects of risk factors by diminishing their influence on students’ well-being (Hope et al., 2018; Hope & Spencer, 2017). The combination of stressors and supports leads to reactive coping methods—the third stage of PVEST (Spencer et al., 1997). These responses involve developing coping strategies that can be either adaptive or maladaptive (Ballard et al., 2018; Hope et al., 2018; Hope & Spencer, 2017). These coping mechanisms hold significant ramifications for students’ mental health and form the basis for developing emergent identities, which is the fourth component. This stage of PVEST highlights how individuals perceive themselves because of their experiences and contexts. Finally, the culmination of these stages leads to the final component: life-stage outcomes (Spencer, 1999), which can include short-term outcomes, such as school climate perceptions and test scores, as well as long-term outcomes.
Methods and Sample
This study uses PVEST to accentuate the risks students from marginalized racial identities face at school and to position Black teachers as critical protective factors who may lower Black students’ net stress engagement by mitigating the effects of those risks on Black students’ perceptions of school climate. I investigate whether disparities exist in perceptions of school climate (PVEST life-stage outcome) and by which school characteristics (PVEST risk and protective factors) such disparities are influenced. To do so, I use a 4-year panel of student-level data for students who took the Georgia School Health Survey (GSHS) from 2014–15 through 2017–18. This study relied on student survey and state administrative data from middle and high schools in Georgia that administered the GSHS to students in each of the 4 academic years sampled. During this time frame, roughly 2.6 million surveys were completed.
Measures
GSHS
Annually, the Georgia Department of Education (GaDOE) administers the GSHS to each school in the state, and students in Grades 6 and above can opt to respond to the survey. The GSHS contains 121 items spanning several different domains, including school climate, peer victimization, mental health, and risky behavior (Georgia Department of Education et al., 2016; La Salle et al., 2017). All surveys are completed anonymously and online by using school-designated computers or electronic devices during school hours. The GSHS has been psychometrically validated (e.g., La Salle, 2017; La Salle et al., 2021) and used (e.g., Smalley et al., 2017; C. Wang et al., 2019; C. Wang et al., 2021) in several studies.
School Climate
The dependent variable in this study is students’ perceptions of school climate. The school climate scale is derived from eight subscales: school connectedness (5 items), peer social support (3 items), adult social support (4 items), cultural acceptance (5 items), social and civic learning (6 items), physical environment (4 items), safety (4 items), and structure for learning (5 items; see Appendix A for omega reliability coefficients). Participants respond to items with 1 = strongly disagree, 2 = disagree, 3 = agree, or 4 = strongly agree. Subscale scores are summed and divided by the total number of items in each subscale. To compute the overall school climate score, all subscale scores are summed and divided by the number of subscales (e.g., eight). The school climate scale and all subscales are standardized (i.e., M = 0, SD = 1) within each year and relative to all middle and high school students in the state. The factor structure (La Salle, 2017; La Salle et al., 2021) and invariant nature (La Salle et al., 2021) of the school climate scale have been validated in prior studies and confirmed in the present study (see Appendix B). Within the PVEST framework, I position school climate as the life-stage outcome (Spencer, 2006), which is illustrative given the range of factors school climate influences.
Students’ Race
Race is operationalized by using binary variables for Black, Hispanic, White, Asian, and “Other,” which students self-report on the GSHS. The GSHS only allows students to select one of those five categories for their racial-ethnic background, and if students select “Other,” the GSHS does not provide them space to add specificity to their racial identity. I contend that “otherizing” racial or other social identities is problematic and that the handling of non- Black-, Hispanic-, White-, and Asian-identifying students on the GSHS is a major constraint. As such, although I report on the “Other” group, I do so to not erase these students’ experiences and voices and with recognition of the limited inferences scholars and policymakers can draw from this classification. Based on conditional descriptive statistics shown in Table 1, students who select “Other” as their race may primarily identify as multiracial or Native American, as these are the largest non-Black, White, Hispanic, or Asian ethnicities in the state, although I cannot confirm this suggestion.
Conditional descriptive statistics
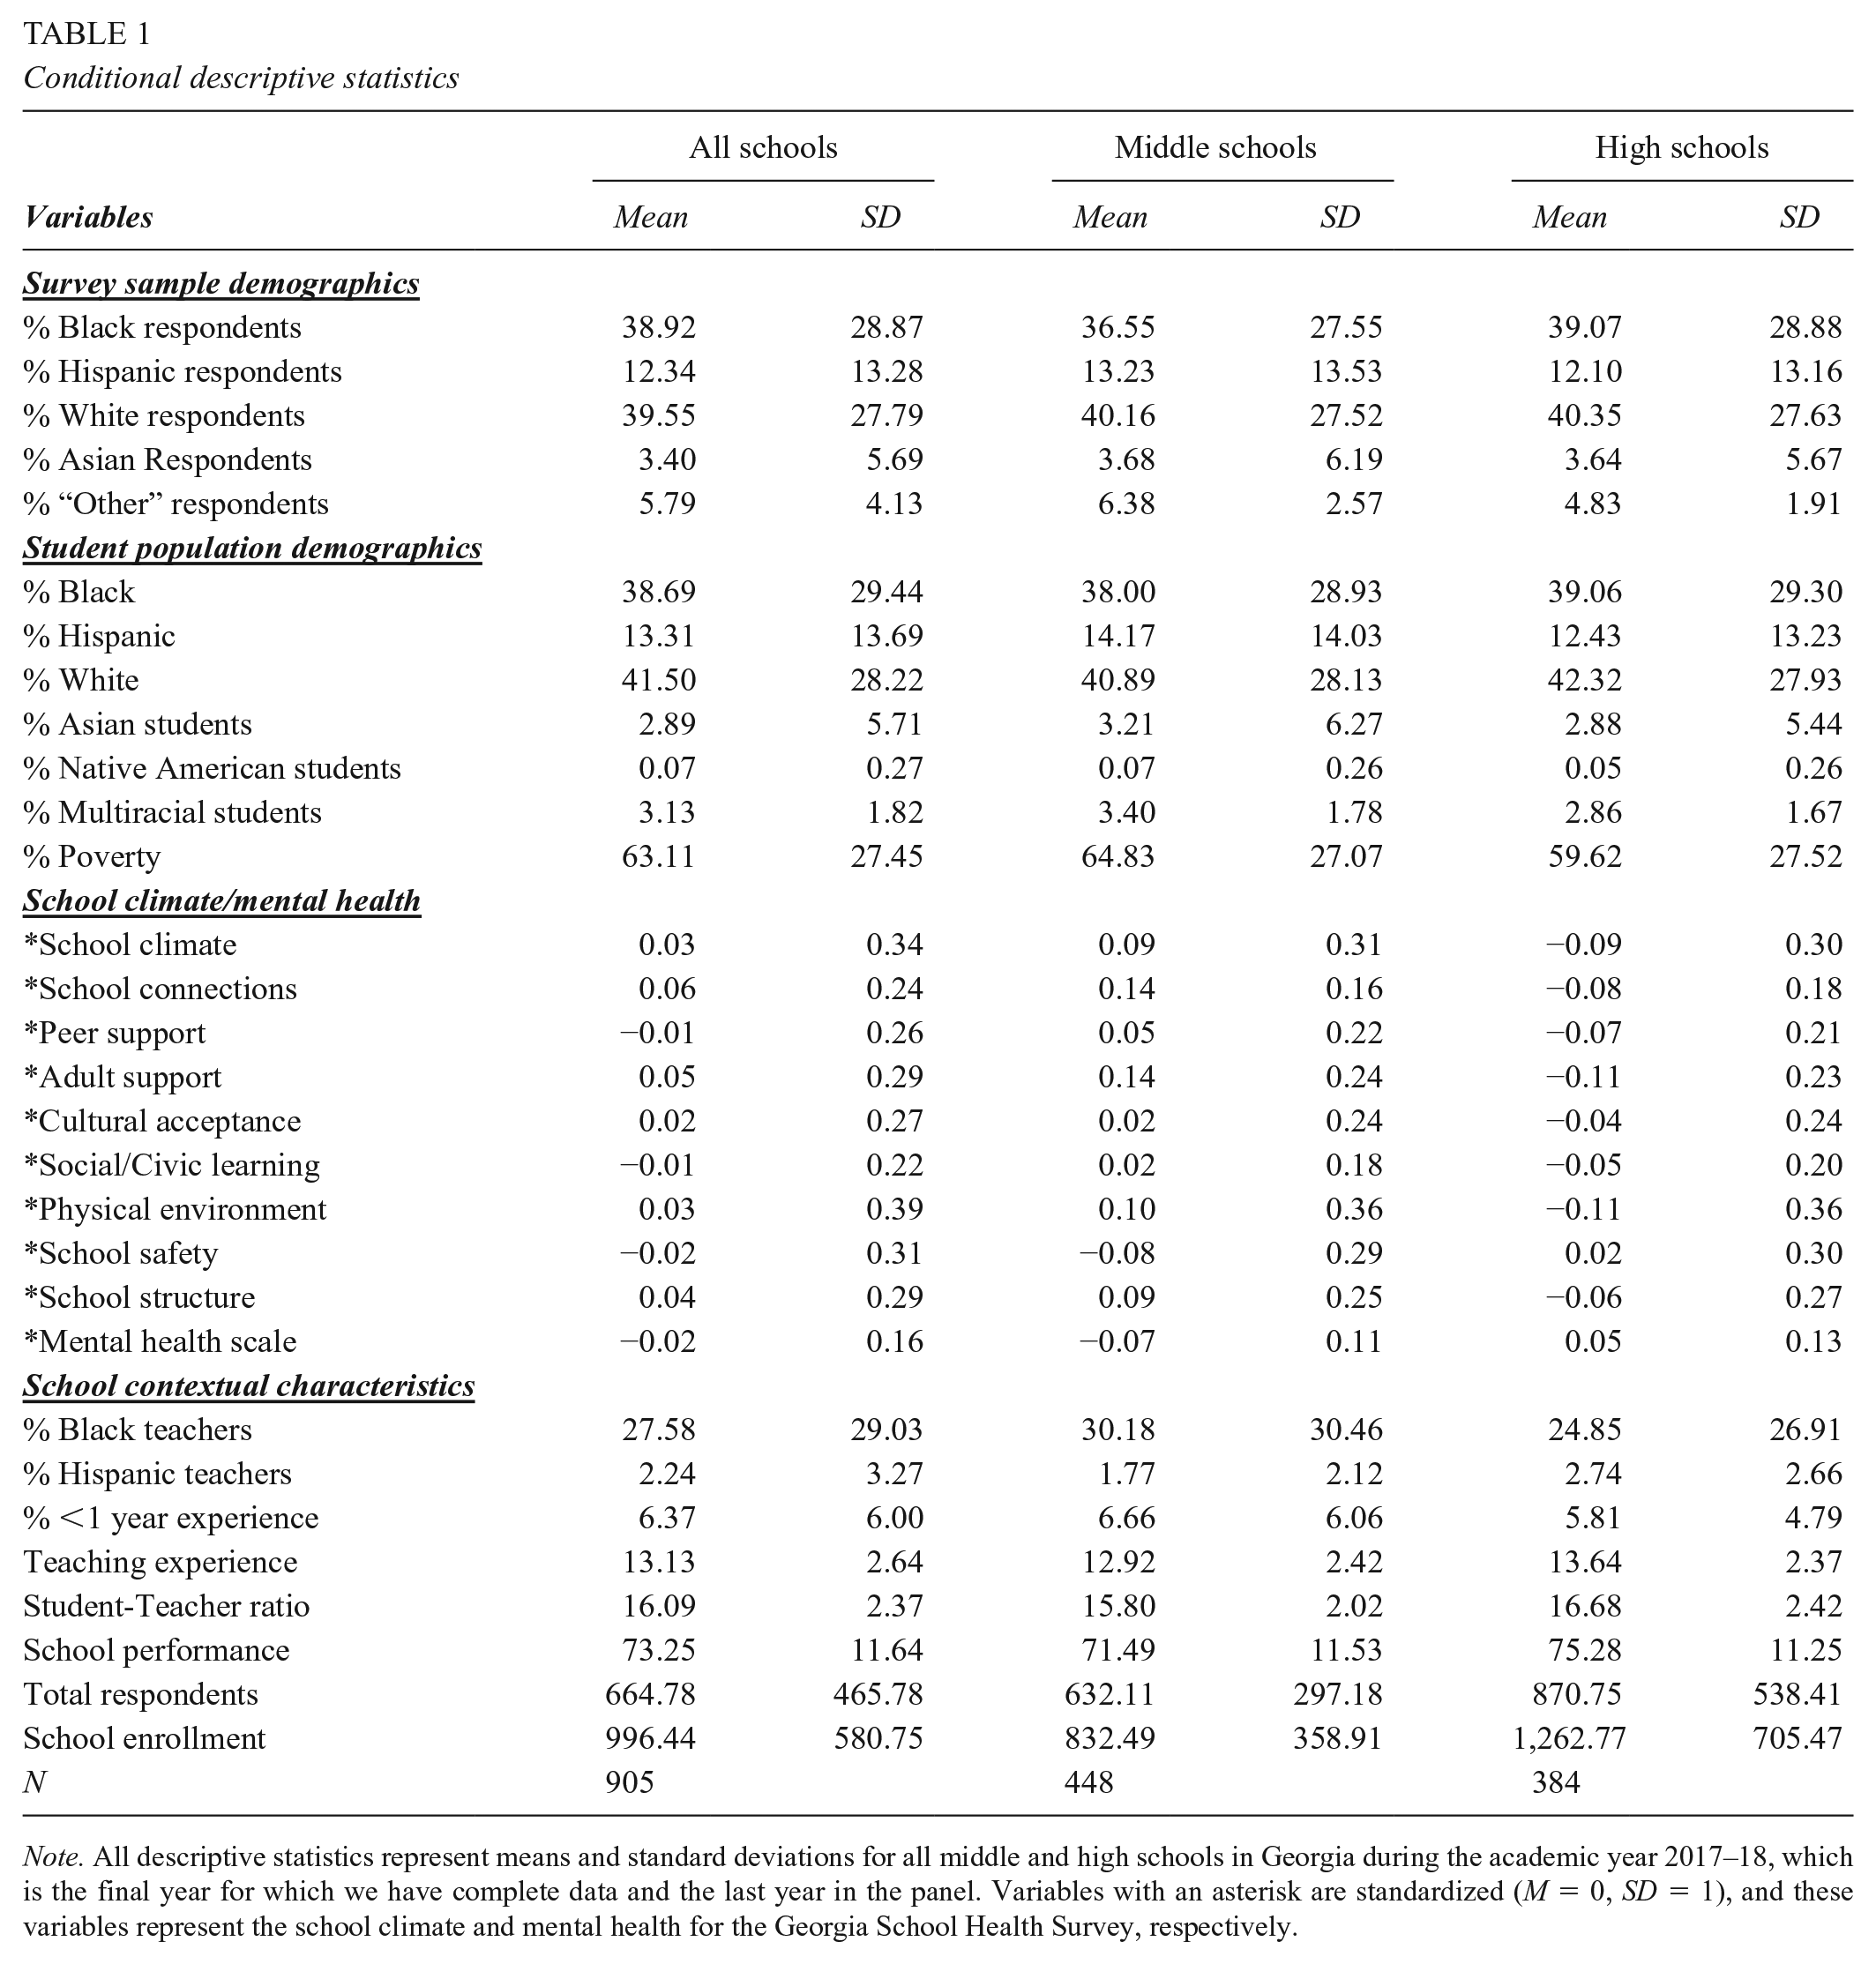
Note. All descriptive statistics represent means and standard deviations for all middle and high schools in Georgia during the academic year 2017–18, which is the final year for which we have complete data and the last year in the panel. Variables with an asterisk are standardized (M = 0, SD = 1), and these variables represent the school climate and mental health for the Georgia School Health Survey, respectively.
Within the PVEST framework, racism, which is most profoundly expressed through the disparate treatment of students of Color based on their racial-ethnic backgrounds, is positioned as the primary risk factor and is captured by the race variables (Gillburn et al., 2018; Sablan, 2019). In this vein, I do not position students’ racial identities as risks in themselves but suggest that because they capture the racially disparate ways students of Color are treated at school, they represent the many risks to students’ schooling and life outcomes that PVEST scholars attempt to accentuate.
Students’ Mental Health
This study uses a secondary part of the GSHS to assess students’ mental health and its association with students’ climate perceptions. Eight items on the survey ask students to respond to a series of questions related to how often in the past 30 days they have felt sad or down, have felt anxious, have had difficulty concentrating, or have experienced other behavior challenges. Items contain seven responses, ranging from “none” to “all 30 days.” A sample item from this subscale is “In the past 30 days, on how many days have you experienced severe mood swings that have caused problems in relationships?” A reliability test returns a Cronbach alpha for the mental health scale of .90. Confirmatory Factor Analysis (CFA) confirms all items loaded on one factor (available upon request), and it has been psychometrically validated (La Salle, 2017). The mental health subscale is conceptualized as reactive coping mechanism in the PVEST framework.
School Contextual Characteristics
I extract school demographic information from the GaDOE, including the percentage of Black, Hispanic, and low-income students. These variables are used as risk factors in the present study, not because students with these social identities are risks but because of the disparate treatment these students receive because of their identities. GaDOE data also include the number of disciplinary infractions reported each year by all schools in the state, which is another risk factor to which students of Color are disproportionately subjected. I also include data on the share of Black and Hispanic teachers, as they may serve as protective factors for students of Color. I also include other protective factors, such as schools’ student-teacher ratios, average years of teacher experience, and average teacher evaluation scores on the Georgia Teacher Keys Effectiveness System. Finally, I examine schools’ geographic locations by using urban, rural, and suburban classifications from the Urban Institute, Education Data Explorer (https://educationdata.urban.org/data-explorer/). Given that students of Color and students in urban and rural areas are disproportionately exposed to lower levels of teacher quality in Georgia (Graham & Flamini, 2021; Williams et al., 2021), the vector of teacher characteristics and the geographic locations of schools are additional risk factors included in models.
Table 1 shows the full set of variables examined across all middle and high schools for the 2017–18 academic year, which is the final year of the panel. I find that the survey sample closely mirrors the student body composition across secondary schools in the state. For instance, Black students make up ~39% of the survey takers and of students in Georgia’s secondary schools. I find comparably small discrepancies between the survey sample and student body composition for White (40% to 42%), Hispanic (12% to 13%), and Asian (~3% for both) students. I also find that the average student response rate (i.e., Total Student Respondents over Total Enrollment) is relatively high for middle (76%) and high (69%) schools.
Empirical Strategy for Research Question 1
Research question 1 examines the presence of racial disparities in school climate perceptions and explores whether and how their magnitudes have changed over time. To do so, I first descriptively plot means and standard deviations of the overall school climate scale (Figure 1) and the eight (connectedness, peer support, adult support, cultural acceptance, social/civic learning, physical environment, safety, or structure for learning) subscales (Figure 2). Appendix C shows the average magnitude of the statewide racial school gap for all subscales across all panel years.
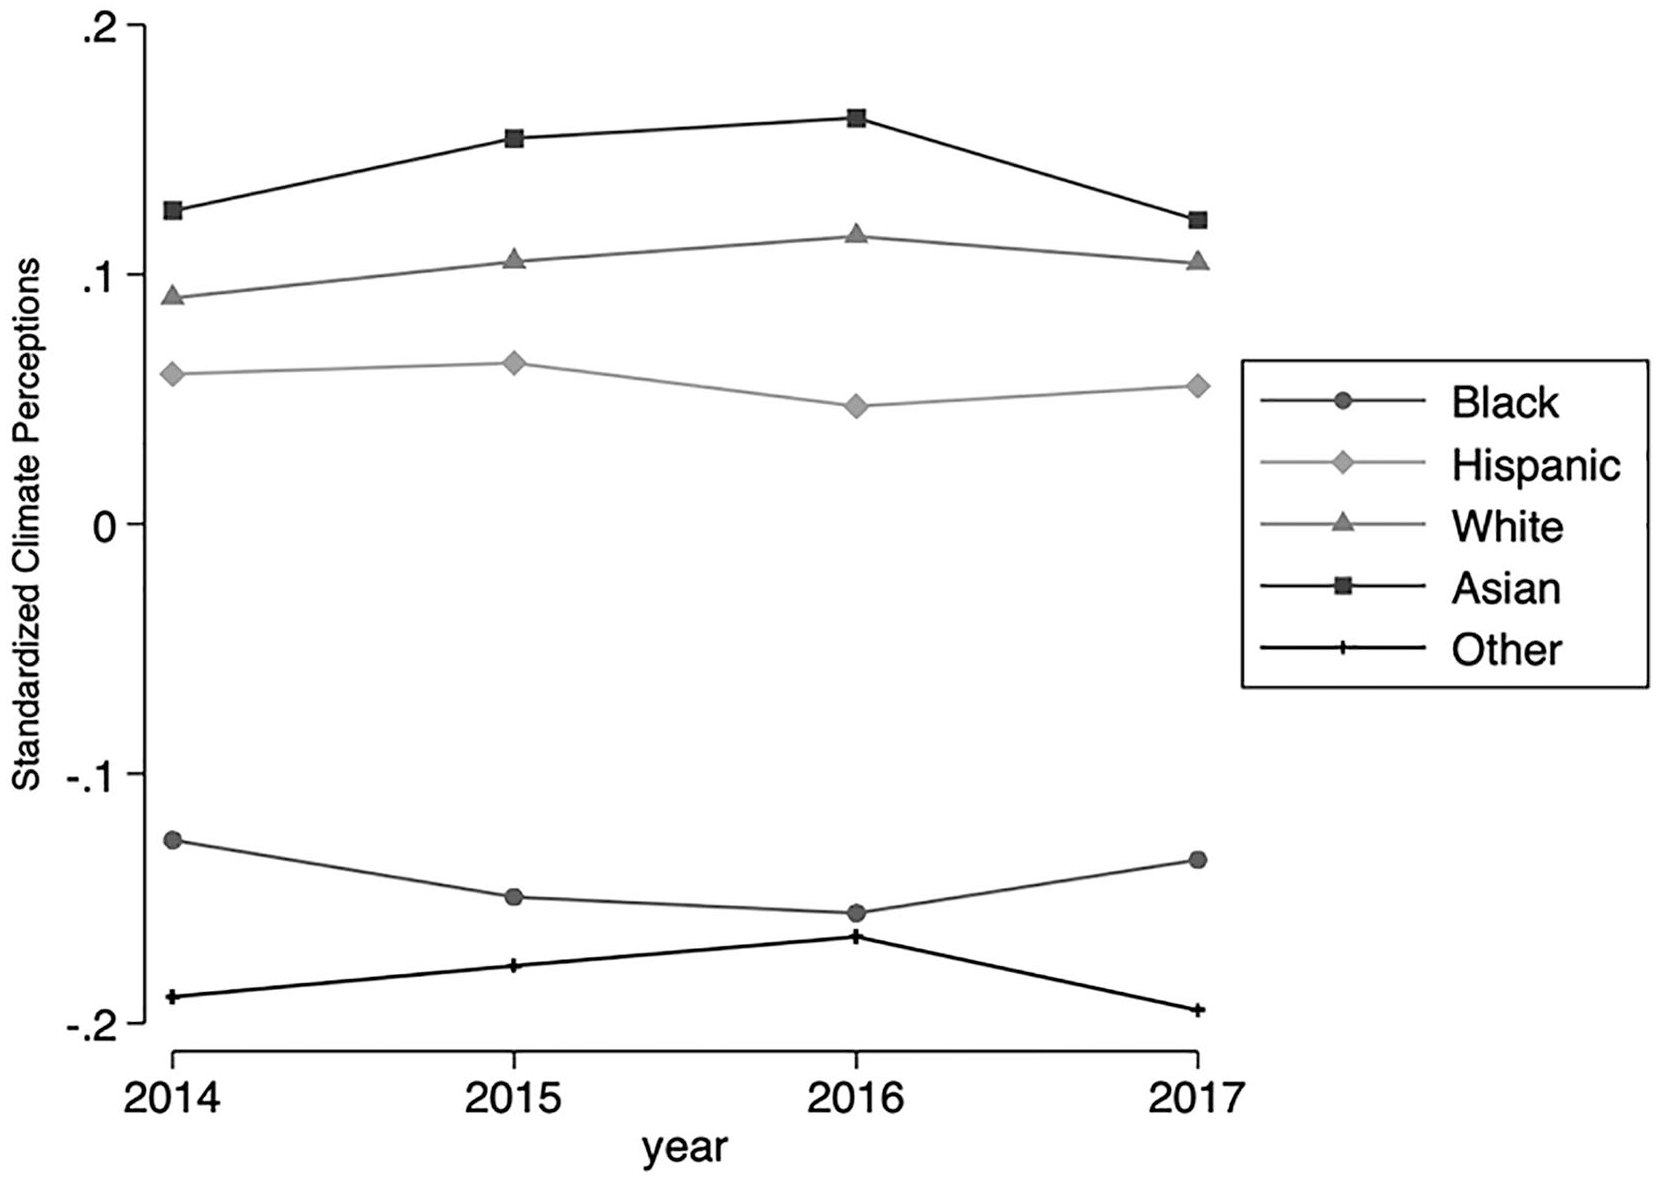
Racial disparities in school climate perceptions over time.
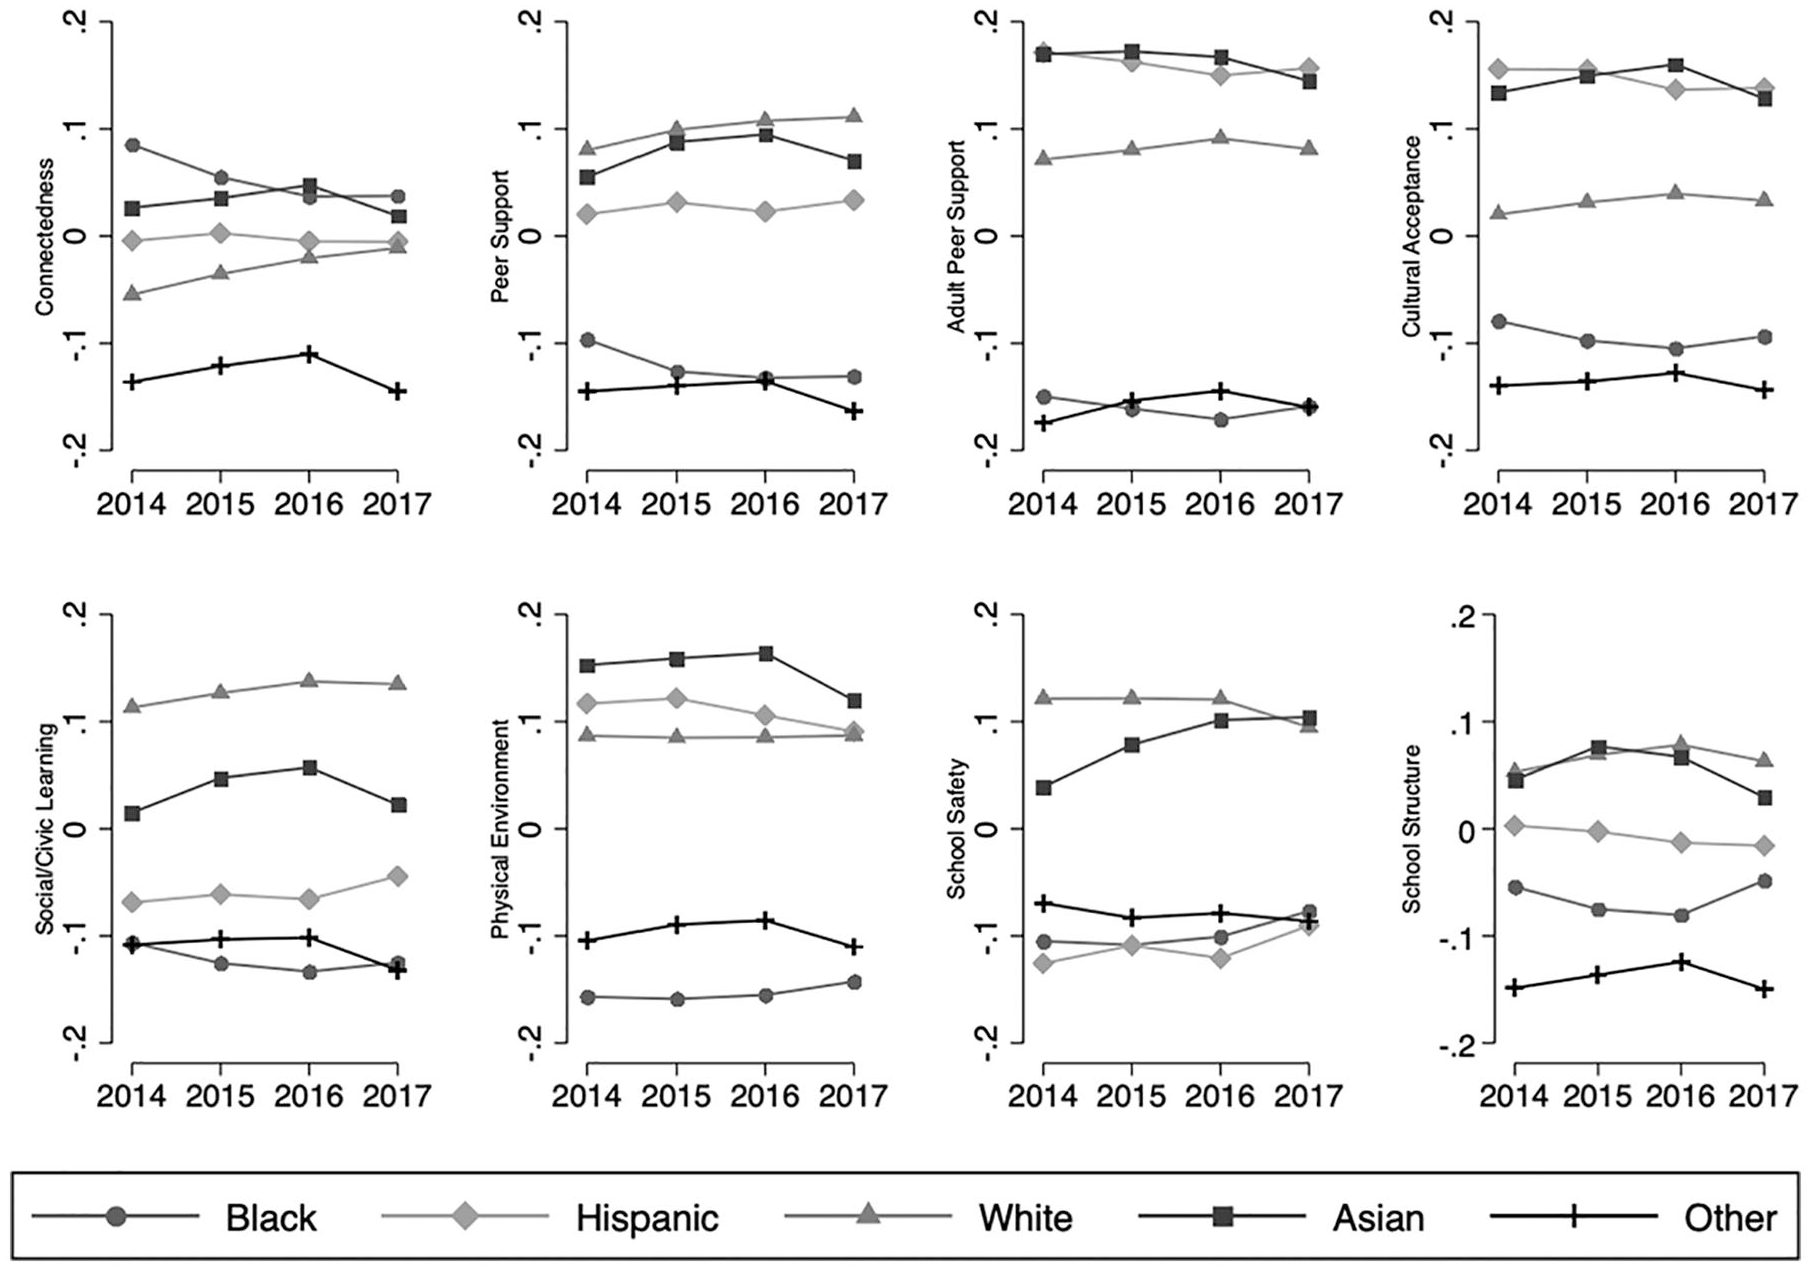
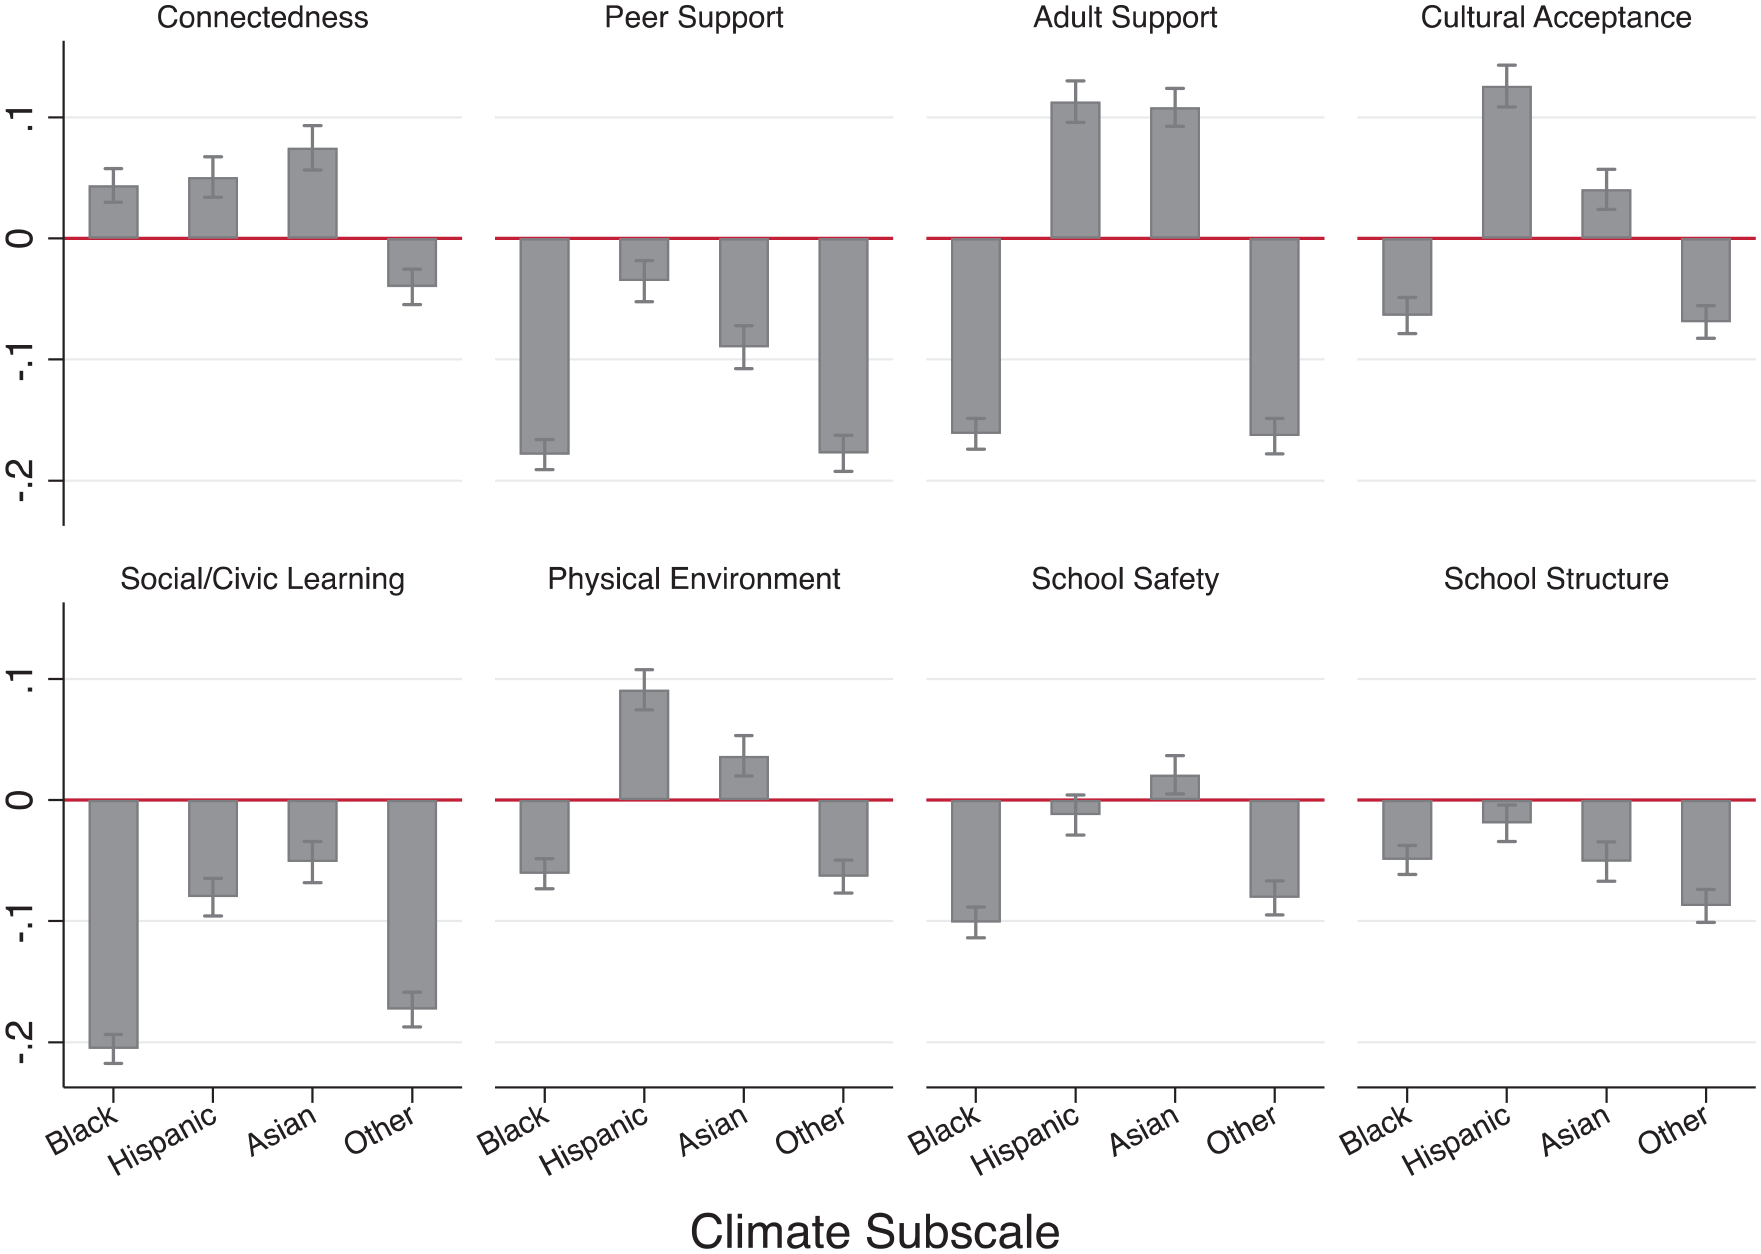
Students’ schooling experience trends by climate dimension.
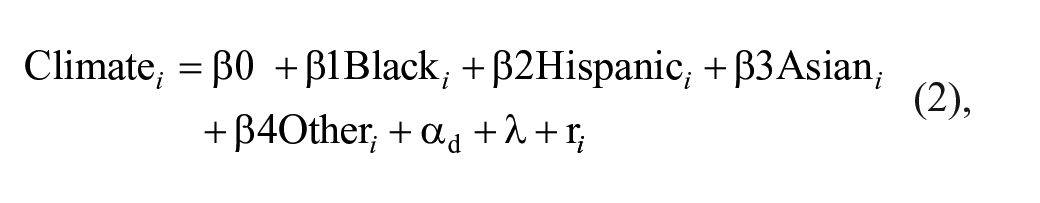
Next, I explore the magnitude of racial school climate gaps and their variation over time. To do so, I first examine racial school climate gaps separately between Black, Hispanic, Asian, and “Other” students relative to their White counterparts for 2014, which is the baseline year. Next, I interact each panel year with each racial-ethnic background (omitting 2014 and White students), which accentuates changes in racial school climate gaps relative to baseline. I estimate these analyses by using ordinary least squares regressions, as expressed by the following equation:

Where Climate is the overall school climate score of student i. The β1Race term represent a series of binary variables indicating, in separate models, whether student i self-identifies as Black, Hispanic, Asian, or “Other” and reflects the racial school climate gaps (or lack thereof) between students of Color and White students. The β2Year indicates the school year in which the racial school climate gap is observed, and the β3Racei*Yeart interaction term highlights the degree to which such gaps vary relative to 2014. All models include robust standard errors clustered to the school level. The results of the analysis are shown in Table 2 for the overall school climate scale. Estimates presented for these analyses are naïve in that they do not account for school- and district-level variation, which are the focus of Research Question 2.
Statewide racial school climate gaps over time

Note. Table 2 presents mean differences in racial-ethnic minoritized students’ school climate perceptions relative to their White peers for middle and high schools in Georgia from the academic years 2014–15 through 2017–18. The coefficient for “Other” represents students who endorse “Other” as their racial-ethnic background on the Georgia School Health Survey. Coefficients representing the mean differences on the overall school climate scale between Black, Hispanic, Asian, and “Other” students compared to White students are presented for the baseline year (Row 2), and additional coefficients depict the variation in these gaps relative to baseline (Columns 2–5). All models include robust standard errors clustered to the school level, and models do not account for school- or district-level variation.
p < 0.1. *** p < 0.01.
Empirical Strategy for Research Question 2
One potential limitation with statewide comparisons is the fact that due to high and stagnant levels of segregation in Georgia (C. Freeman et al., 2002; K. J. Freeman & Steidl, 2016), students of Color and White students experience schooling in very different districts and schools. Therefore, research question 2 builds on the naïve estimates from the research question 1 analyses by exploring whether racial school climate gaps remain significant among students who attend schools in the same district and school. To examine within-district, across-schools racial school climate gaps, I fit the following district fixed-effect model, which forces estimation of racial school climate disparities to be among students in the same district:
where the outcomes and race variables mirror those in Equation 1. However, this model adds district (α) and year (λ) fixed effects to account for differences in climate experiences across districts as well as any time trends across the state in a given year. The district fixed effect model tests whether, for example, racial school climate gaps are apparent among Black and White students who attend schools in the same district. The results of this analysis are shown in Column 2 of Table 3.
Racial school climate gap by level
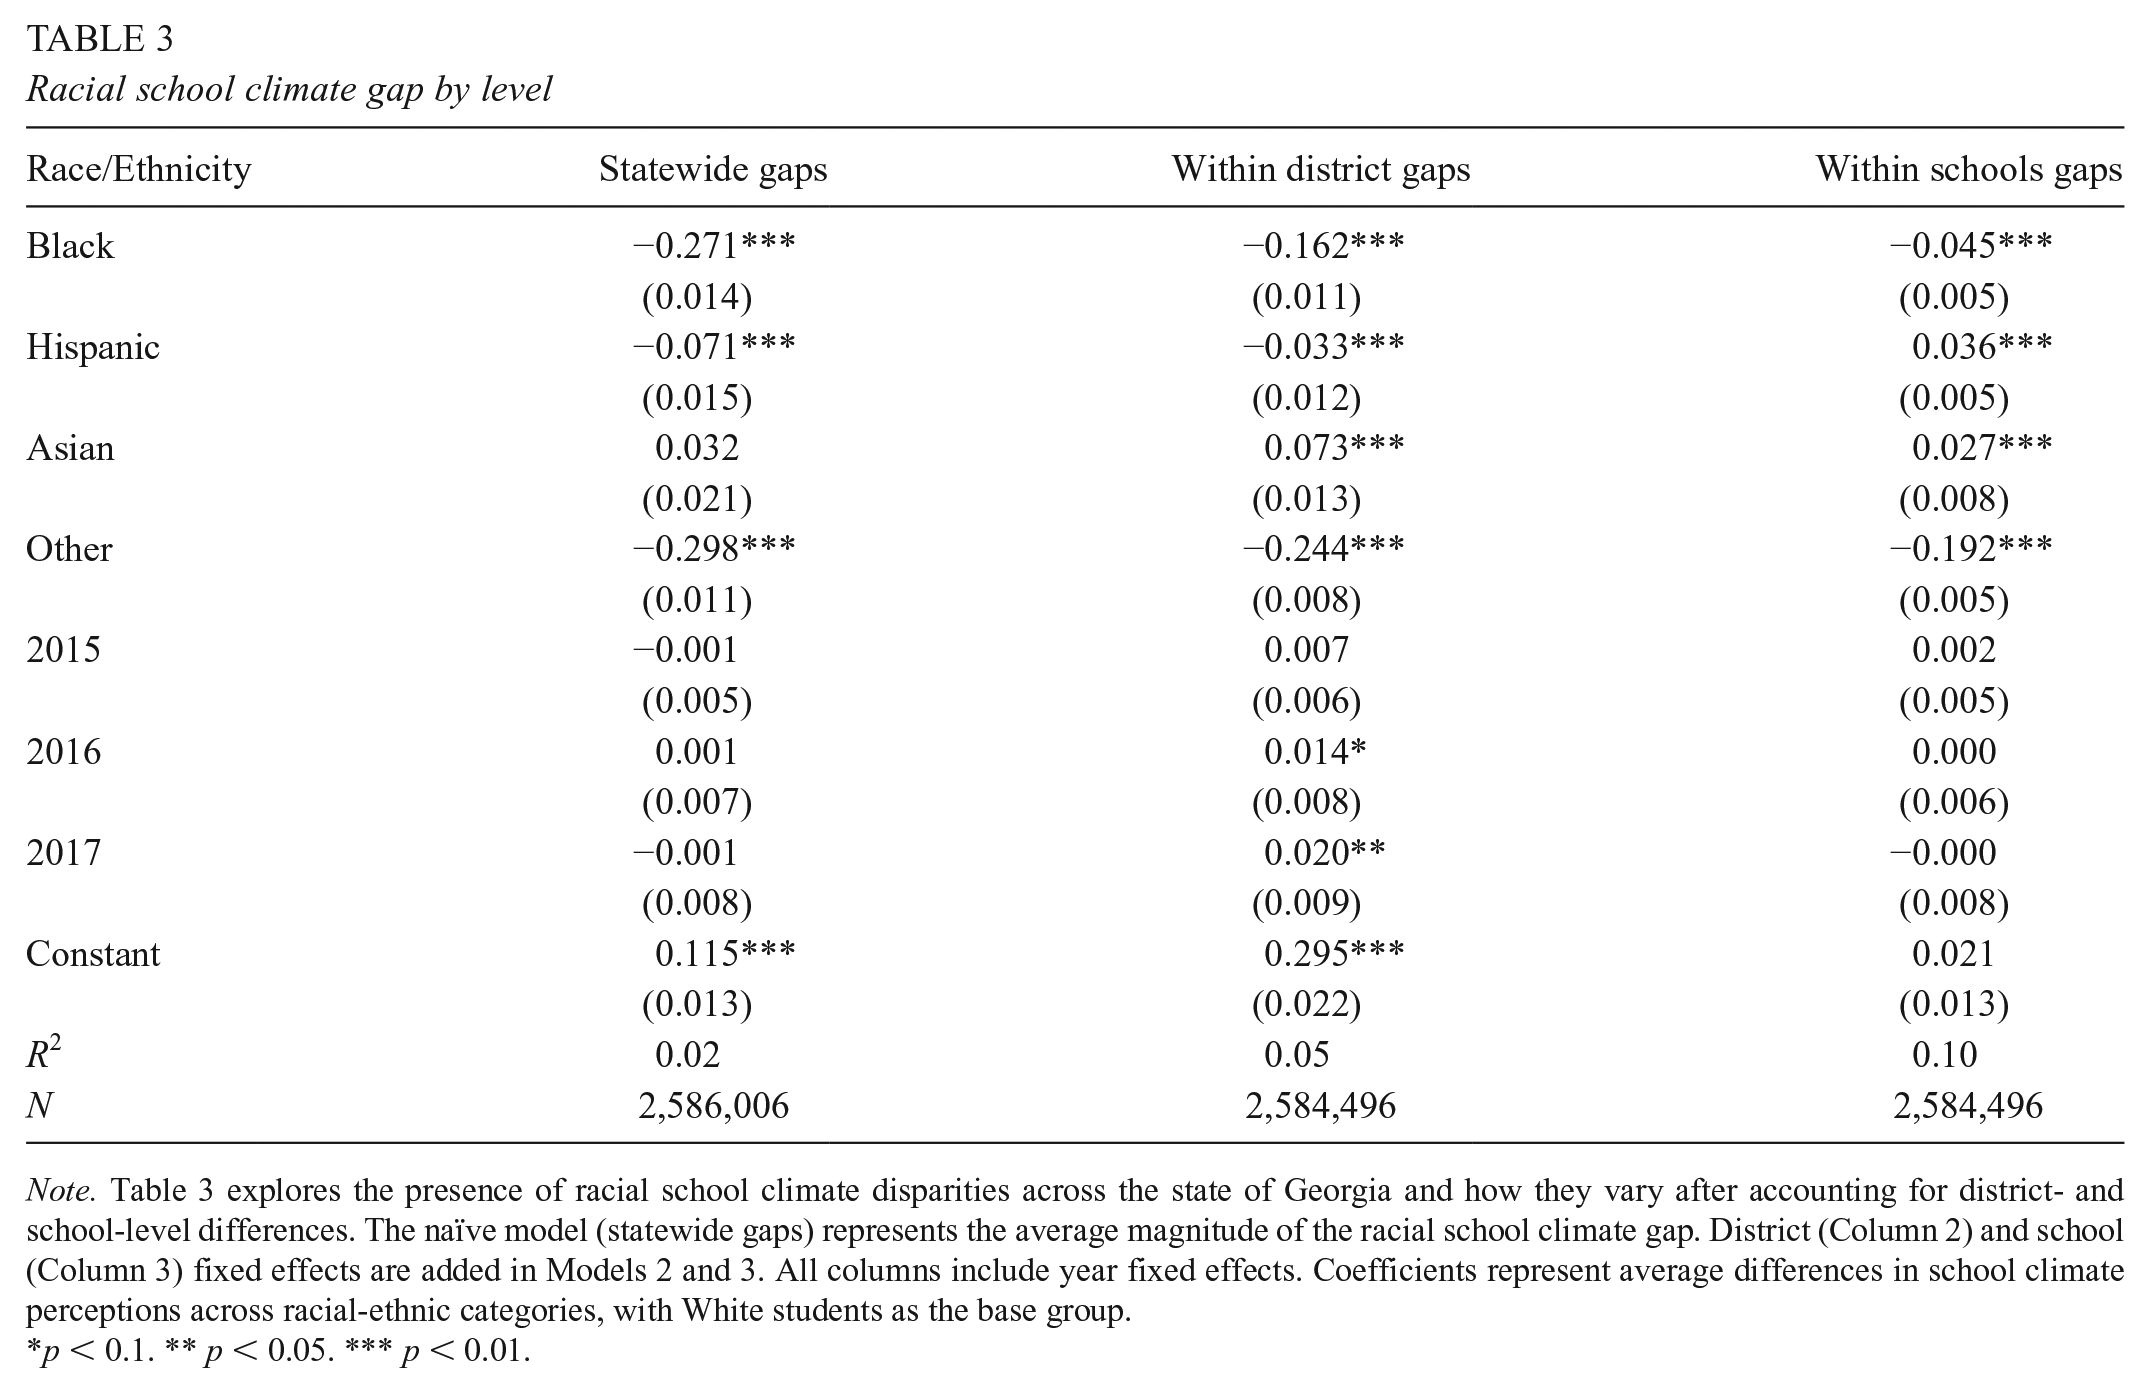
Note. Table 3 explores the presence of racial school climate disparities across the state of Georgia and how they vary after accounting for district- and school-level differences. The naïve model (statewide gaps) represents the average magnitude of the racial school climate gap. District (Column 2) and school (Column 3) fixed effects are added in Models 2 and 3. All columns include year fixed effects. Coefficients represent average differences in school climate perceptions across racial-ethnic categories, with White students as the base group.
p < 0.1. ** p < 0.05. *** p < 0.01.
Segregation in Georgia may also manifest such that districts can be relatively integrated, but the schools within them are severely segregated by race. Given this, determining whether racial school climate differences are a function of the fact that Black and White students attend different schools remains difficult with a district fixed-effects model. Therefore, I also explore within-school, across-students racial school climate by using the following equation:

which mirrors Equation 2, with the exception that α represents a school fixed effect here. This model tests, for instance, whether Black and White students who attend the same school experience the climate of their schools differently. The results of this analysis are depicted in Column 3 of Table 3.
Empirical Strategy Research Question 3
The present study also seeks to better understand the variance of school climate gaps across schools and the potential school contextual factors that influence them. To do so, I first fit an unconditional, multilevel model to assess the amount of variation in the level 1 outcome (student i’s school climate score) accounted for by schools by computing the intraclass correlation for students’ overall school climate perceptions. The school-level intraclass correlation for overall school climate is .113, suggesting that schools account for around 11% of the variation in students’ school climate perceptions, which accentuates the need to account for school clustering effects. Model testing for the school climate residuals suggest that they follow a normal distribution (see Appendix D). To determine average within-school racial gaps, random-slope multilevel models are estimated that allow school-specific racial gaps to vary across schools, as expressed in the following equation:

Finally, I seek to understand how a range of individual and school contextual risk and protective factors influence students’ climate perceptions and the magnitude of the racial school climate gap, which forms what I refer to as the fully specified model, as shown in Table 4. This model follows the same form as Equation 4 but adds in random intercept and slope terms for the level-1 predictor indicating student i’s self-reported responses to the mental health battery in school j at time t. This study theorizes mental health scores as representing adaptive and maladaptive reactive coping mechanisms that influence the school climate life-stage outcome. I also include a series of level-2, school-level covariates to explore their associations with students’ perceptions of school climate and the racial school climate gap, each with random intercepts. The first school-level controls represent the share of Black, Hispanic, and economically disadvantaged students in school j at time t, which represent additional risk factors due to the disparate treatment of these students from marginalized social identities. I also include a term representing the total number of discipline infractions in school j at time t, as students of Color and low-income students are disproportionately affected by discipline processes in school.
Within-school racial school climate gaps

Note. Table 4 examines racial disparities in perceptions of school climate. In Model 1, Black, Hispanic, Asian, and “Other” students’ school climate scores are compared against those of White students. Model 2 adds a robust set of school contextual covariates to explore factors associated with students’ school climate perceptions and racial school climate gaps. Finally, Model 3 adds interaction terms. All models include a year fixed effect.
p < 0.1. ** p < 0.05. *** p < 0.01.
I add a vector of level-2 predictors representing a series of teacher characteristics, including the percentage Black and Hispanic, novice teachers, average years of experience, and teachers’ observed overall effectiveness ratings, and the student-to-teacher ratio of school j at time t. These variables operate as protective factors, given the widespread evidence suggesting the positive impacts of teachers on students’ schooling outcomes. Following the inclusion of these variables, I add a control for location, indicating whether school j is urban or rural (suburban as reference group). Two cross-level interaction terms—Black teachers by Black student and Hispanic teachers by Hispanic student—are added to the model, which show how Black and Hispanic teachers influence Black and Hispanic students’ climate perceptions, respectively. Given research on the impacts of Black teachers and teachers of Color on students’ outcomes, I theorize that Black and Hispanic teachers might lower Black and Hispanic students’ net stress engagement. All continuous variables are standardized within year (M = 0, SD = 1), and all models include year fixed effects. Finally, I show estimates of the fully specified multilevel model for each climate subscale in Figure 3.
Within-school racial school climate gaps by dimension.
Findings
Although the trend lines establish racial inequities in school climate perceptions, a more granular examination of the data paints a clearer portrait of the magnitude of the racial school climate gap and the degree to which the estimates observed above are statistically significant. As shown in Table 2, the average Black student’s school climate score is .217 standard deviation less than that of the average White student in 2014. The magnitude of this disparity grows by .037 standard deviation in 2015 (β = –.254, p < .01), peaks in 2016 at .054 standard deviation (β = –.271, p < .01), and then recedes slightly in 2017 (β = –.239, p < .01). Students who select “Other” as their racial category report climate perceptions .28 standard deviations lower than White students in 2014 (β = –.28, p < .01), and this disparity does not change significantly across panel years. Although less pronounced, Hispanic students also report less favorable views of school climate than do White students, with the disparity peaking in 2016 (β = –.068, p < .05), and this increase is a statistically significant change relative to 2014. Finally, the difference in school climate perceptions between White and Asian students is not statistically significantly different from zero.
This study also captures where climate disparities are largest by examining the subscales of the GSHS (Figure 2). Results show that the most significant gaps in perceptions of school climate between Black and White students are for social/civic learning (β = –.25, p < .001), physical environment (β = –.24, p < .001), adult support (β = –.24, p < .001), and peer support (β = –.22, p < .001). The magnitudes of these differences are comparable for students who select “Other,” although some are more pronounced. The racial school climate gap between Black and White students is reversed when considering connectedness (β = .08, p < .001), such that Black students, on average, tend to report a stronger sense of connectedness to their schools. Hispanic students also report statistically significantly less favorable climate perceptions relative to those of their White peers, with the largest gaps in perceptions of safety (β = –.23, p < .01) and social/civic learning (β = –.19, p < .01). On average, Hispanic students appear to hold more favorable perceptions of cultural acceptance (β = .11, p < .01), adult support (β = .08, p < .01), and school connectedness (β = .03, p < .01). For Asian students, their school climate scores tend to be higher across nearly all subscales, except for social/civic learning (β = –.09, p < .01). See Appendix C for a full reporting of these coefficients.
To underscore the extent to which the racial school climate gap between students of Color and White students changes in response to the inclusion of school contextual variables, a series of increasingly controlled regression models are fitted. PVEST guides the model-building approach to answering research question 3, as Model 1 begins with a random intercepts and slopes analysis of the level-1 race predictors to examine the racial school climate gaps. Model 2 adds level-2 school contextual variables (risk and protective factors) as well as the level-1 mental health scale (reactive coping mechanisms). Finally, the shares of Black and Hispanic teachers (protective factors) are included as across-level interactions to explore the extent to which they provide additive benefits to Black and Hispanic students’ climate perceptions, respectively. The inclusion of these interaction terms is also rooted in the PVEST framework, as Black and Hispanic teachers are theorized to lower the net stress engagement of Black and Hispanic students.
Across the 4-year panel, the average within-school racial school climate gap between Black and White students’ is –.026 standard deviation (β = –.026, p < .01). The gap is considerably larger when examining differences between students in the “Other” group and White students (β = –.169, p < .01). On the contrary, Hispanic (β = .064, p < .01) and Asian (β = .019, p < .01) students tend to endorse more favorable perceptions of school climate relative to those of White students after accounting for school-level clustering. When school contextual variables are added in Model 2, disparities between Black and “Other” students’ climate perceptions and White students’ grow, highlighting the different ways school contextual factors may shape their school experiences.
Some notable risk factors include the number of discipline infractions schools report (β = –.112, p < .01), the share of first-year teachers (β = –.016, p < .05), and higher student-to-teacher ratios (β = –.013, p < .10). Given that Black students are disproportionately exposed to racialized discipline processes, novice teachers, and larger class sizes, PVEST suggests that these risk factors likely increase Black students’ net stress engagement and influence their perceptions of school climate. Results also indicate a significant and positive association between teacher effectiveness and school climate perceptions (β = .017, p < .05), suggesting that higher quality teaching and equitable access to it may serve as vital protective factors. PVEST scholars theorize that students can have adaptive or maladaptive responses to the combination of their risk and protective factors. This may be evidenced in this study by the apparent negative and substantive relationship between mental health and school climate, which is consistent with other studies (Polk et al., 2020). In particular, a standard deviation increase in students’ scores on the mental health battery is associated with a .312 standard deviation reduction in their school climate score (β = –.312, p < .01).
In Model 3, I include an interaction between the Black and Hispanic student binary variables and the percentage of Black and Hispanic teachers, respectively, to test for the extent to which these teachers of Color operate as protective factors for students of Color. The positive and significant coefficient on the Black student by Black teachers interaction term shows that as the share of Black teachers in a school increases, the gap in school climate perceptions between Black and White students moves closer to zero (β = .055, p < .05). Taken in conjunction with the research elucidating the positive impacts of Black teachers on Black students (Gershenson et al., 2018; Hart, 2020; Joshi et al., 2018; Lindsay & Hart, 2017), this association lends credence to the notion that Black teachers likely lower Black students’ net stress engagement through their supportive and humanizing teaching practices. The interaction term on Hispanic students by Hispanic teachers is small and not significant, but these results should be interpreted cautiously because Hispanic teachers represent only around 2% of teachers in Georgia.
Finally, I regress each school climate subscale on the fully specified model to understand how within-school racial school climate gaps vary by each element of school climate. Figure 3 shows that the largest Black-White school climate gaps are in perceptions of social and civil learning, peer support, and adult support. The gap remains reversed for perceptions about school connectedness, which is true for all racial groups, except for students in the “Other” group. Finally, racial school climate gaps are less clear for Hispanic and Asian students, as differences move in opposite directions or toward zero, depending on the subscale.
Discussion
The present study examines racial school climate gaps and the myriad factors influencing them across middle and high schools in Georgia. Using the PVEST framework (Spencer et al., 1977), this study conceptualizes school climate as assessing students’ perceptions of different elements of their schooling experiences. I find evidence that Black and “Other” students consistently report less favorable perceptions of school climate relative to those of White students, and these gaps appear to have widened over time for Black students. Differences between White and Hispanic and White and Asian students across elements of school climate have trend lines and magnitudes that move in opposite directions. These results are hard to reconcile with the prior literature showing disparities in school climate perceptions, particularly between Hispanic and White students (Fan et al., 2011; Thapa et al., 2013; Voight et al., 2015), although they are consistent with others (Bradshaw et al., 2009; Konold et al., 2017). Considering reports about racist incantations spewed in schools—such as “build that wall”—and policies that target Latinx students (Bellows, 2019; Dee & Murphy, 2020; Kirksey et al., 2020), these results warrant further inquiry.
The results from research questions 1 and 2 make clear that Black and “Other” students report less favorable perceptions of school climate than do their White counterparts and that these differences remain substantively and statistically significant when these students attend the same schools. I position school climate perceptions as short-term life-stage outcomes within the PVEST framework and, using its tenets, postulate that these disparities reflect the systemic marginalization of these minoritized students. Consistent with PVEST and critical quantitative research, this manuscript does not posit students’ racial identities as risk factors but instead contends that racism, as captured by racial identifiers, is a primary threat students of Color face at school.
I also explore how school contextual factors predict students’ climate perceptions and identify several risk factors that likely increase Black and “Other” students’ net stress engagement. Students in schools with higher disciplinary infractions, a larger share of novice teachers, and higher student-to-teacher ratios tend to rate their climates less favorably. The percentage of Black and low-income students appears to be negatively associated with students’ climate perceptions, which likely reflects how individuals from these marginalized backgrounds are subjected to schooling environments and broader societal conditions that drastically affect their academic and nonacademic outcomes (Gillborn et al., 2018; Ladson-Billings, 2006, 2009; Ladson-Billings & Tate, 2006). Thus, coefficients on these variables must be contextualized appropriately and interpreted with a nuanced and historical understanding of the ways racism and White supremacy manifest in many of the constructs used in statistical analyses.
Finally, Black teachers appear to play a role in closing school climate gaps between Black and White students and may do so by lowering Black students’ net stress engagement. I find that as the share of Black teachers in a school increases, the racial school climate gap for Black and White students moves closer to zero. Black teachers might explain why Black students tend to feel more connected to their schools than do their peers, despite endorsing less favorable perceptions of all other elements of school climate. This finding might suggest that, overall, Black students do not feel supported by their schools but may have a small group of peers and teachers, perhaps Black teachers, to whom they feel especially connected.
Two potential threats might undermine the implications of this study, which point to racially disparate schooling experiences among minoritized students relative to those of their White peers: (a) the observed differences might be simply explained by the fact that students attend schools in segregated settings and, as such, are not assessing the same schooling environments and (b) any observed differences might be the result of students responding to the school climate survey in fundamentally variant ways. To rule out the first threat, I examine the presence of racial school climate gaps among students who attend the same school. In so doing, I find that Black and “Other” students report less favorable perceptions of climate even when they attend the same school as their White peers. On the latter point, scholars have established measurement invariance with the Georgia school climate survey (La Salle et al., 2021), suggesting that there are not systematically distinct patterns in how students respond to the survey. Therefore, it is unlikely that racial school climate gaps are fully or even mostly explained by subjective differences in how students rate their schools’ climate or by the segregated nature of middle and high schools in Georgia.
Relevant Future Work
Future research should build onto extant work that uses experimental and quasi-experimental designs to explore how programs and policy changes affect students’ school climate perceptions and racial school climate gaps (Bottiani et al., 2012; Bradshaw & Rosenberg, in press; Hershfeldt et al., 2009). Although schools and districts adopt these programs endogenously, researchers can exploit the timing of their adoption to identify credible causal inferences on the policies and practices that influence students’ school climate perceptions. Future research can also examine how variations in racial school climate gaps are associated with the magnitude and direction of test-score achievement and discipline disparities. Scholars have theorized many compelling reasons for these disparities, but more research is needed to underscore the role schools’ climates play in moderating them.
In addition, the relationship between mental health and school climate can be the focus of future research, as the experience of mental health issues appears to shape how students perceive school in nontrivial ways. More research is required to understand better specific practices school leaders and teachers can model to ensure that all students experience positive schooling environments. For example, a compelling body of scholarship suggests that students of Color substantially benefit when their schools exude norms that reflect a respect for diversity and inclusion (Chang & Le, 2010). Such research illuminates that programs seeking to improve school climate must target changes in teachers’ and school leaders’ policies, practices, and dispositions rather than assume that students’ climate perceptions need correction.
Although evidence is mounting that school climate disparities exist, much more work is needed to understand the mechanisms that drive them. We know that minoritized students, especially Black students, are overrepresented in schools’ discipline pools (Losen, 2015; Skiba et al., 2011; Wang et al., 2022; Welsh & Little, 2018a, 2018b), underrepresented in advanced and gifted placement programs (Domina et al., 2019; Giersch, 2018; Grissom & Redding, 2015; Grissom et al., 2017; Hill, 1993; Noguera, 2003), and most often educated by teachers who employ culturally responsive pedagogies (Carter & Welner, 2013; Garmon, 2004; Plata et al., 2017). Future research should explore how these facets of schooling affect school climate disparities.
Finally, the lack of qualitative research on racial school climate disparities and the mechanisms driving them is glaring, making this area ripe for future study. Given the weight of the evidence on what we know about the racialized ways minoritized students experience schooling, it appears likely that objective variation in how students are treated at school and in society drives the findings in this study and others on school climate disparities (Chambers, 2009). For instance, evidence suggests that minoritized students are aware of the racialized ways they experience school, as they perceive that they are more likely to get in trouble than are White students, even when they commit less severe offenses, and that their teachers have lower expectations of their abilities (Drakeford, 2004; Lee, 1999). Other works (e.g., Gregory & Mosley, 2004; Kennedy & Soutullo, 2018) accentuate the ways that the deficit orientations teachers hold about Black and Brown students affect students’ schooling experiences, which could also explain school climate disparities. Although they are not testable in the present study, these potential mechanisms represent some tangible schooling practices that almost certainly affect minoritized students’ perceptions of school climate (Hargrove & Seay, 2011; Milner, 2012).
Implications for Scholarship, Policy, and Practice
The present study bolsters racial school climate gap scholarship by filling several gaps in the extant literature. Although the connection of inequities to the school climate literature has significant theoretical advances in education, the racial school climate gap remains underexamined, due in large part to data constraints. Existing studies tend to rely on relatively small samples or focus on specific schools or districts (Bachman et al., 2013; Booren et al., 2011; Swartz et al., 2011), which makes generalizability challenging. Further, although national surveys have the advantage of large sample sizes, they frequently lack enough observations in individual schools to draw inferences about the within-school differences in school climate perceptions (Hong & Eamon, 2012; Sacco & Nakhaie, 2007). The present study adds to the body of scholarship by using statewide samples (Akiba, 2008; Astor et al., 2002; May & Dunaway, 2000; Welsh, 2001), which sheds light on the direction, magnitude, and variation of within-school racial school climate gaps and their variation over time.
Understanding the factors that influence racial school climate gaps holds important implications for policy and practice because if positive school climates improve students’ outcomes, disproportionate access to them might widen achievement disparities (Hopson et al., 2014; O’Malley et al., 2012). ESSA has opened a window to identify and address these disparities, as some states are fulfilling the ESSA mandate that requires additional assessments of school effectiveness beyond test scores by focusing on interventions to improve their schools’ climates (Darling-Hammond et al., 2016). Education stakeholders’ focus on school climate must be coupled with adequate resources to ensure that Black, Brown, and low-income students benefit optimally from positive school climates.
Supplemental Material
sj-docx-1-ero-10.1177_23328584221131529 – Supplemental material for Explaining the Racial School Climate Gap: Evidence From Georgia
Supplemental material, sj-docx-1-ero-10.1177_23328584221131529 for Explaining the Racial School Climate Gap: Evidence From Georgia by Jerome Graham in AERA Open
Footnotes
Author
JEROME GRAHAM is an assistant professor of K–12 educational administration at Michigan State University. His research interests focus broadly on the interaction of race and class in educational policy and practice. Specifically, he uses mixed-methods research designs to evaluate the effects of education reforms that target minoritized students and the mechanisms that drive such reforms. His current research background emphasizes how schools can provide constructive school climates for students, facilitating the process by which they develop cognitive and socioemotional skills to improve their short- and long-term outcomes. His theoretical orientation is psychosociological, in that his research agenda focuses not only on persons’ individual development (academic, emotional, and otherwise) but also on the social structures that influence their development.