
Abstract
The COVID-19 pandemic resulted in an unanticipated, near-universal shift from in-person to virtual instruction in the spring of 2020. During the 2020–21 school year, schools began to reopen, and families were faced with decisions regarding the instructional mode for their children. We leverage administrative, survey, and virtual-learning data to examine the determinants of family learning-mode choice and associations between virtual education, student engagement, and academic achievement. Family preference for virtual (versus face-to-face) instruction was highly associated with subsequent school-level infection rates and appeared relatively uniform within schools. We find that students assigned to a higher proportion of instructional days in virtual mode experienced higher rates of attendance but negative achievement growth compared to students who were assigned a higher proportion of instructional days in face-to-face mode. Insights from this study can be used to better understand family preferences as well as to target and refine virtual learning in a post-COVID-19 society.
The COVID-19 pandemic presented a shock to the U.S. educational system, resulting in a near-universal shift to virtual learning in the spring of 2020 (Goldstein et al., 2020). More than half of all students continued to receive only virtual instruction into the fall of 2020 (Roche, 2020). Although many students began to transition back to in-person learning in school year (SY) 2020–21, roughly one in five schools remained fully remote for most of the school year (Kaufman & Diliberti, 2021). Mounting evidence suggests that the pandemic and associated disruptions to families and schools have led to reductions in student achievement growth, particularly among students belonging to marginalized groups (Curriculum Associates, 2021a, 2021b, 2021c; Kogan & Lavertu, 2021; Kuhfeld et al., 2020; Lewis et al., 2021; Pier et al., 2021; Renaissance, 2021a, 2021b). This result has the potential to exacerbate educational opportunity gaps in the short and the long term.
The observed reduction in the rate of achievement growth has many possible explanations, including economic disruptions due to parental job loss; student, family, and teacher health problems caused by COVID-19; and mental trauma from isolation and stress. However, most important from an educational policy perspective are factors within the control of schools, the most notable of which are the decisions of whether and how to employ virtual instruction. We, therefore, focus our analysis on the relationship between instructional mode and student outcomes, including attendance, engagement, and achievement. The pandemic necessitated expanded familiarity, proficiency, and infrastructure for virtual learning in the United States, all of which are likely to lead to expanded use of this learning mode in future years (Kaufman & Diliberti, 2021; St. George et al., 2021). The likely future expansion of virtual education makes understanding the inherent strengths and limitations of this instructional mode critical to supporting quality education in a post-pandemic educational system.
As a secondary interest, we also examine the correlates of family choice over instructional mode. During the fall of 2020, many districts allowed families to choose between remaining virtual or having their child participate in face-to-face schooling. Prior to the pandemic, options for remote learning were most often limited to one-off course-taking for credit recovery, advanced learning opportunities, and (in a limited number of states) full-time virtual charter schools. Although learning-mode choices during COVID-19 were undoubtedly affected by concerns over potential health risks associated with in-person learning, variation in pandemic-era learning-mode choices by families facing similar health risks could provide some insight into parental perceptions of the relative efficacy of virtual learning. For example, if parents of children who are English learners (ELs) more frequently opt for in-person learning than do similarly situated families whose children are proficient in English, it might suggest that parents view remote EL services as inferior to in-person EL programs. Further, several recent reports have shown parents’ increased interest in virtual learning and other forms of homeschooling post-COVID-19 (Brenan, 2020; Kaufman & Diliberti, 2021; Patrick et al., 2021; Schultz, 2020; St. George et al., 2021). As such, it is important to continue measuring and investigating family preferences.
To address the related issues of instructional-mode choice and the impacts of instructional mode on student outcomes, we seek to answer the following research questions: (a) What were families’ preferences for virtual learning during the COVID-19 era when face-to-face options were offered? (b) How did student attendance, engagement, and learning vary by learning mode? And (c) to what extent were student characteristics associated with differential preferences, attendance, engagement, and learning? To do this, we first develop an empirical model of family instructional choice, based on trade-offs between student safety and achievement growth. We then estimate the model by using detailed data from a large school district in a Southeastern state. To account for potential selection bias, we use the instructional-mode-choice model as the first stage of a two-stage-least squares estimator to reduce bias in estimates of the impact of instructional mode on student engagement, attendance, and achievement. We then use these findings to identify for whom (and in what contexts) the form of virtual learning provided during the pandemic was academically beneficial. This includes investigating the underlying instructional models (and programs) that appeared to support effective instruction in a virtual environment.
Equity in Virtual Learning Before, During, and After the COVID-19 Pandemic
Historically, family choice, digital access, and academic achievement have been closely intertwined with race and social class (Carter & Welner, 2013; Heinrich et al., 2020). For instance, students belonging to minoritized groups often have lower performance in school, as evidenced by test scores and graduation rates that are less than those of their White counterparts, due at least in part to structural inequities in society (Carter & Welner, 2013; Gaias et al., 2020; Jones et al., 2020). Further, recent studies of virtual learning have identified negative associations with student achievement, with educational inequities often appearing even more salient when examining the use of technology in education due to differential access to and experiences within the instructional environment (Ahn & McEachin, 2017; Besecker & Thomas, 2020; Center for Research on Educational Outcomes [CREDO], 2015; Fitzpatrick et al., 2020; Gonzales et al., 2020; Heinrich et al., 2020; Kim & Padilla, 2020; Molnar, 2021). Notably, many of the most widely used virtual-learning platforms often provide limited (if any) modifications and accommodations for students requiring them, such as students identified as ELs or receiving special education (SPED) services (Great Public Schools Now, 2021; Heinrich et al., 2019). Virtual learning also often places increased ownness on students to manage their own learning experiences (Jacob et al., 2016), requiring a level of self-regulation that one large-scale study has found was present only among high school juniors and seniors (Heinrich et al., 2019).
Despite this, students belonging to marginalized groups were more likely to attend schools that remained fully virtual during the COVID-19 pandemic, with these schools reporting lower rates of curriculum coverage and instructional time nationally (Kaufman & Diliberti, 2021). Further, early in the COVID-19 pandemic, the Los Angeles Unified School District found lower engagement among students belonging to minoritized groups (Besecker & Thomas, 2020). Similarly, more than half of all middle school students across six Tennessee districts reported challenges with motivation during the fall of 2020, with students identified as ELs and SPED reporting less frequent engagement (Patrick et al., 2021). The same study found that rates of chronic absenteeism rose substantially more for students identified as Black and Hispanic during SY 2020–21 compared to students identified as White (Patrick et al., 2021). One reason for this finding might be that technology-facilitated learning often exacerbates existing disparities in academic engagement and achievement due to increased onus on students to self-regulate (Darling-Aduana et al., 2019; Heinrich et al., 2020; Jacob et al., 2016). Based on this literature and the equity implications of differential access and experiences with virtual learning by subgroup, we purposefully examine outcome variation across income, racial-ethnic identity, gender, EL, and SPED status.
At the same time, virtual learning may offer benefits (through self-directed pacing, anytime-anywhere access, personalized just-in-time formative feedback, and so forth) that allow schools to better meet the educational needs of some students when compared to traditional models of face-to-face instruction (Darling-Aduana et al., 2019; Jacob et al., 2016; St. George et al., 2021). Additionally, continuing virtual-learning options for some students might result in spillover benefits for students who remain in face-to-face classrooms (Darling-Aduana, 2019; Hart et al., 2019). As virtual learning is likely to play an increased role in students’ educational experiences in coming school years, continued study is merited to identify how to most effectively leverage virtual learning to achieve the goals of enhancing the educational experiences of all students, with an eye toward minimizing existing educational opportunity gaps.
Family Choice and Virtual Learning
In recent decades, alternatives to traditional brick-and-mortar public schools (e.g., physical charter schools, private-school vouchers, and virtual schooling) have grown in popularity (Torre, 2013). However, virtual schools differ from other alternatives to traditional public schools in several ways. First, prior to the pandemic, many virtual schools specialized in supplemental courses (i.e., advanced courses or credit-recovery coursework) and thus served as a complement to brick-and-mortar public schools (Digital Learning Collaborative, 2019). Second, although voucher-supported private schools and brick-and-mortar charters primarily attracted students previously attending neighborhood schools, full-time virtual schools are often seen as an alternative (or support) for homeschooling, as they provide a structured environment and/or curriculum for students. The pandemic has led to increased interest and discussions around this topic (Brenan, 2020; Patrick et al., 2021; Schultz, 2020). Nationwide, 35 states have recently proposed legislation relating to charter schools and school vouchers, showing that the school-privatization movement may be stronger than ever (Flannery, 2020; Strauss, 2021). Specific to the COVID-19 pandemic, schools that began the school year virtually saw lower than normal enrollments, with slightly higher enrollment observed among private schools and districts with preestablished virtual schools (Flanders, 2020; Kelly, 2021).
The Current Study
Building on the prior literature related to equity and choice in virtual learning, this study examines preferences, engagement, and learning during the COVID-19 pandemic. More specifically, we examine which families opted into virtual learning; associations between virtual learning, student engagement, and achievement; and interactions between the learning environment and student characteristics, experiences, and outcomes. Although there is a large extant literature on school choice and student characteristics relating to academic achievement, there is much less evidence on virtual learning more generally and family preferences for virtual instruction more specifically. This evidence is of critical importance as we move into a future that is likely to include greater demand for, and reliance on, virtual learning.
Methods
Setting
This study is part of a larger Research-Practice Partnership, where the research topics studied emerged through joint-agenda setting in response to shared priorities among district administrators and the research team. Our district partner is a large school district in the Southeast that serves a predominately minoritized, mixed-income student population across rural, urban, and suburban communities. In response to the COVID-19 pandemic, this district—along with most other school districts in the United States—was forced to close its physical schools and switch to virtual learning. In the school district studied, all content was delivered virtually beginning in mid-March 2020, which included teachers delivering lectures and giving assignments online. The district reported that devices were made available to students who needed them. In the fall of 2020, this district continued a virtual-learning approach to start the semester but began to bring students back into the classroom as the semester progressed, first with a hybrid program and then in a fully face-to-face learning option.
In addition to providing devices, the district supported virtual learning by providing access to a suite of virtual software and tools. However, beyond the near-universal use of iReady as an assessment tool in the grades studied, there was little centralized directive regarding which tools teachers should use or how they should be used. School-level resources, support, and leadership also varied. Lastly, based on prior research, we would expect differential outcomes associated with the same instructional technology strategies, depending on the student population served.
Data
Our partner school district provided administrative, virtual learning system, and family learning mode survey data for the fall 2020 semester. The administrative data we received from the school district include student-level information on learning mode by day, test scores, grade levels, attendance, racial-ethnic identity, EL status, free or reduced-price meal (FRPM) status, and SPED status. Test scores are expressed in vertical scale-score points, which are designed to be a consistent measure along an achievement continuum across all grades. For students engaged in full-time in-person learning, attendance was measured in the traditional way. Virtual learners had some variation in attendance criteria over time. During the universal remote period at the beginning of the fall 2020 semester and the subsequent transitional hybrid-learning period, an elementary student assigned to remote learning on a given day had to be present during reading or math instruction to be counted as present that day. For middle and high school, students assigned to remote instruction had to be present for 50% or more of the school day to be counted as present. From the time that full-time in-person learning was offered in mid-October until the end of the fall semester, elementary students who remained in virtual learning were considered present if they checked in via the Microsoft Teams or iReady application at any point during the day (attendance procedures did not change for secondary students).
We identify family learning-mode preference based on responses to the family learning-mode survey administered online at the beginning of the fall 2020 semester. Families could indicate a preference for either fully virtual or in-person instruction. In total, the families of 81% of students responded to the survey. Students were then assigned to the learning mode selected on the family survey with three exceptions. First, students whose families did not respond defaulted to attending in-person instruction when offered. Second, because the semester began fully virtual, all students were assigned to virtual instruction at the beginning of the semester, with students whose families indicated a desire to return to in-person instruction doing so for an increasing number of days each week beginning in mid-October. Lastly, students were assigned to virtual instruction regardless of family preference when there was a COVID-19 exposure.
Using the test-score and sociodemographic variables provided, we estimate student achievement growth by calculating the difference between each student’s fall and winter SY 2020–21 scores on the iReady formative assessments in math and reading. We subsequently divide this growth measure by the number of weeks between when the student took fall and winter iReady tests during SY 2020–21 to calculate average weekly student achievement growth in each subject.
In addition, the district provided student-by-month usage information from two virtual learning-based platforms: Microsoft Teams and iReady. Teams is the learning-management program used by the district during the study period, through which students could access a plethora of online tools, programs, and software. The most common tools accessed through the platform included those facilitating synchronous meetings, assignments, communication, and the Microsoft Office suite (e.g., Word, PowerPoint, Excel). iReady is a self-contained learning and assessment tool that can also be used to support blended instruction and teacher-directed interventions that all students were required to use throughout the district.
This analysis focuses on students in Grades 4–8 in the district during the fall 2020 semester due to low reliability in lower-grade test scores (Curriculum Associates, 2021c; Sass & Goldring, 2021). High school grades are excluded due to the use of a different formative assessment that could not be nationally normed or linked to the exam used in Grades K–8.
Sample
Among students in the sample, 43% identified as Black, 25% as White, 17% as Hispanic, 12% as Asian, and 3% as “other” (see Table 1). In addition, 36% of students qualified for FRPM during SY 2019–20. We use FRPM status from the prior school year, as information on FRPM status was not reported during SY 2020–21.
Sample characteristics, overall and by proportion virtual

Note. Standard deviations are in parentheses. EL = English learner; FRPM = free or reduced-price meal; SPED = special education.
During the fall of 2020, the modal students logged around 17 hours a week virtually. It is important to note that even the average of 23 hours a week logged by students assigned to virtual mode 100% of the time was still substantially lower than the more than 30 hours a week students would have attended school during a pre-pandemic traditional school schedule. Variability by the proportion of days in virtual mode observed is to be expected, as students attending face-to-face could receive instruction outside the virtual learning system. However, we also know that many students who attended face-to-face continued to learn in classrooms that made use of the virtual learning system to deliver instruction, facilitate collaboration, and complete assignments, at least part of the time. Thus, although it is not a true measure of instructional time for students attending face-to-face, this information provides a useful check (and potentially additional information) compared to solely examining the number of days attended.
Additionally, results from the family survey indicated that approximately 38% of families in the sample preferred to remain virtual when face-to-face instruction was offered. The surveys were administered prior to the beginning of the fall of 2020, with a smaller second wave administered later in the semester to families who did not complete the initial survey. For the 19% of students whose families did not respond to the survey, we input learning-mode preference as selecting the default option—returning to in-person instruction. To adjust for any systematic differences between families who expressed a preference for in-person instruction and those who opted in by default, we include a binary indicator variable in all models for whether the learning-mode preference variable is input.
Families’ initial preference was strongly associated with subsequent instructional-mode assignment. Discrepancies between initial family preference and subsequent attendance patterns are likely due in large part to school (or classroom) closures triggered by neighborhood infections. Regardless of family preference, however, due to the first portion of the school year beginning entirely virtually, the modal student attended 69% of the fall 2020 semester virtually. The proportion of days assigned to virtual mode was also influenced by the proportion of positive cases and quarantines within each student’s school. On average, the student-weighted modal school quarantine rate during the fall of 2020 was approximately 9%. In other words, on average, 9% of students at any given school were required to learn virtually at one point during the semester due to a potential COVID-19 exposure.
Empirical Strategy
To examine our first research question regarding families’ preferences for virtual learning when face-to-face options were offered, we first develop a function that incorporates factors likely to influence family preferences, based on the broader school-choice literature. Equation 1 conceptualizes the choice for student i to engage in virtual learning at time t in school s. We postulate that this choice is a function of the expected achievement growth
Furthermore, this decision is also a function of time-invariant student characteristics

Understanding Family Preference
To examine family learning-mode preference, we first estimate associations between student and school characteristics and family preference for continuing virtual learning when face-to-face instruction was initially offered during the summer of 2020. Using learning-mode choice data from the family survey, we estimate a linear probability model, predicting opting on the family survey to remain virtual when face-to-face instruction was offered (

In reference to our model of the virtual-learning decision (Equation 1), this model estimates the roles of student
Understanding Student Engagement and Outcomes
After investigating patterns in family learning–mode preference, we set out to determine how much student attendance, engagement (i.e., weekly hours logged virtually), and learning (i.e., average weekly student achievement growth) varied by instructional mode. First, we estimate the same model described above with the proportion of days assigned to virtual mode during the fall of 2020
2
included as the independent variable

School Fixed-Effect Approach
Next, we estimate models (see Equation 4) comparing each student to other students at the same school (versus all students within the district) by adding school fixed effects

This approach allows us to remove endogenous variation associated with school characteristics that were fixed over time within the school. For instance, this approach removes variation due to constant school-level resources, support, and leadership as well as any consistent neighborhood or student characteristics (including aggregate infection rates) during the study period. Further, it removes variance associated with school characteristics that affected the virtual-learning decision for all students in the school, as given by
Despite differential attendance rates being a part of the impact of instructional mode and thus appropriately included when evaluating impacts on achievement, we are also interested in measuring what proportion of any overall association was due to each mechanism. To disentangle these elements, we estimate the above model, including days attended as an additional covariate. 3 To the extent that any differential outcomes persist (or emerge) after conditioning on days attended, we could be more confident that those associations are due to variation in rates of learning per day (versus variation in attendance) by mode. Conversely, if any differential outcomes become nonsignificant after conditioning on days attended, we would expect that previously identified associations are more likely due to variation in attendance (versus learning per day) by instructional mode. Lastly, we add the time logged by virtual program (e.g., synchronous meetings, Microsoft Word, iReady) to the version of Equation 4 that conditions on days attended to ascertain whether learning varied by time logged in each virtual program.
Instrumental Variable Approach
We next estimate a two-stage least squares (2SLS) instrumental variables (IV) model to mitigate potential bias from unmeasured factors that might drive instructional-mode assignment and student outcomes (Angrist & Pischke, 2009). To implement our IV approach, the first-stage equation predicts the proportion of days assigned to virtual mode during the fall of 2020 based on a vector of the same student (χ) and school characteristics

We choose to isolate variation associated with initial views about learning mode and associated risks to exclude variation in student outcomes associated with subsequent COVID-19-related incidents and circumstances. In doing so, we aim to produce estimates of outcomes associated with the proportion of days assigned to virtual learning that might be more likely to provide insight on potential post-pandemic trends. However, despite the removal of bias associated with subsequent unanticipated COVID-19 circumstances, we acknowledge that family preference might still be shaped by confounding characteristics and the differential structural impacts of COVID-19. As such, the resulting estimates should be interpreted as descriptive versus causal.
We then use the predicted value of the proportion of days assigned to virtual mode generated from each first-stage model to predict each dependent variable of interest, controlling for the same vectors of student and school characteristics, as shown in Equation 6:

Consistency between estimates produced by the instrumental variable and OLS regression models would minimize concern regarding many (although not all) potential sources of bias in the base model.
Post-estimation tests, summarized in Table 2, demonstrate that the excluded variables predict assignment into treatment. More specifically, the first-stage statistics demonstrate that the excluded variables explain a sizable proportion of variance in the proportion of days assigned to virtual mode. The Sargan Overidentification test examines the null hypothesis that the excluded instruments should be included in Equation 6 and thus would not represent valid instruments. 5 In all but one case, we fail to reject the null that the overidentifying restrictions are valid. 6 For the model predicting total weekly hours logged virtually, we reject the null at better than a 98% confidence level. For this reason, we are less confident in, and place less weight on, estimates produced from the 2SLS models predicting time logged virtually. Consequently, in this instance, we privilege estimates resulting from the OLS model with school fixed effects because there is less likelihood of reduced bias from the 2SLS model examining time logged virtually to outweigh the efficiency advantage of the OLS model.
Tests of the exclusion restriction for instrumental variable analysis
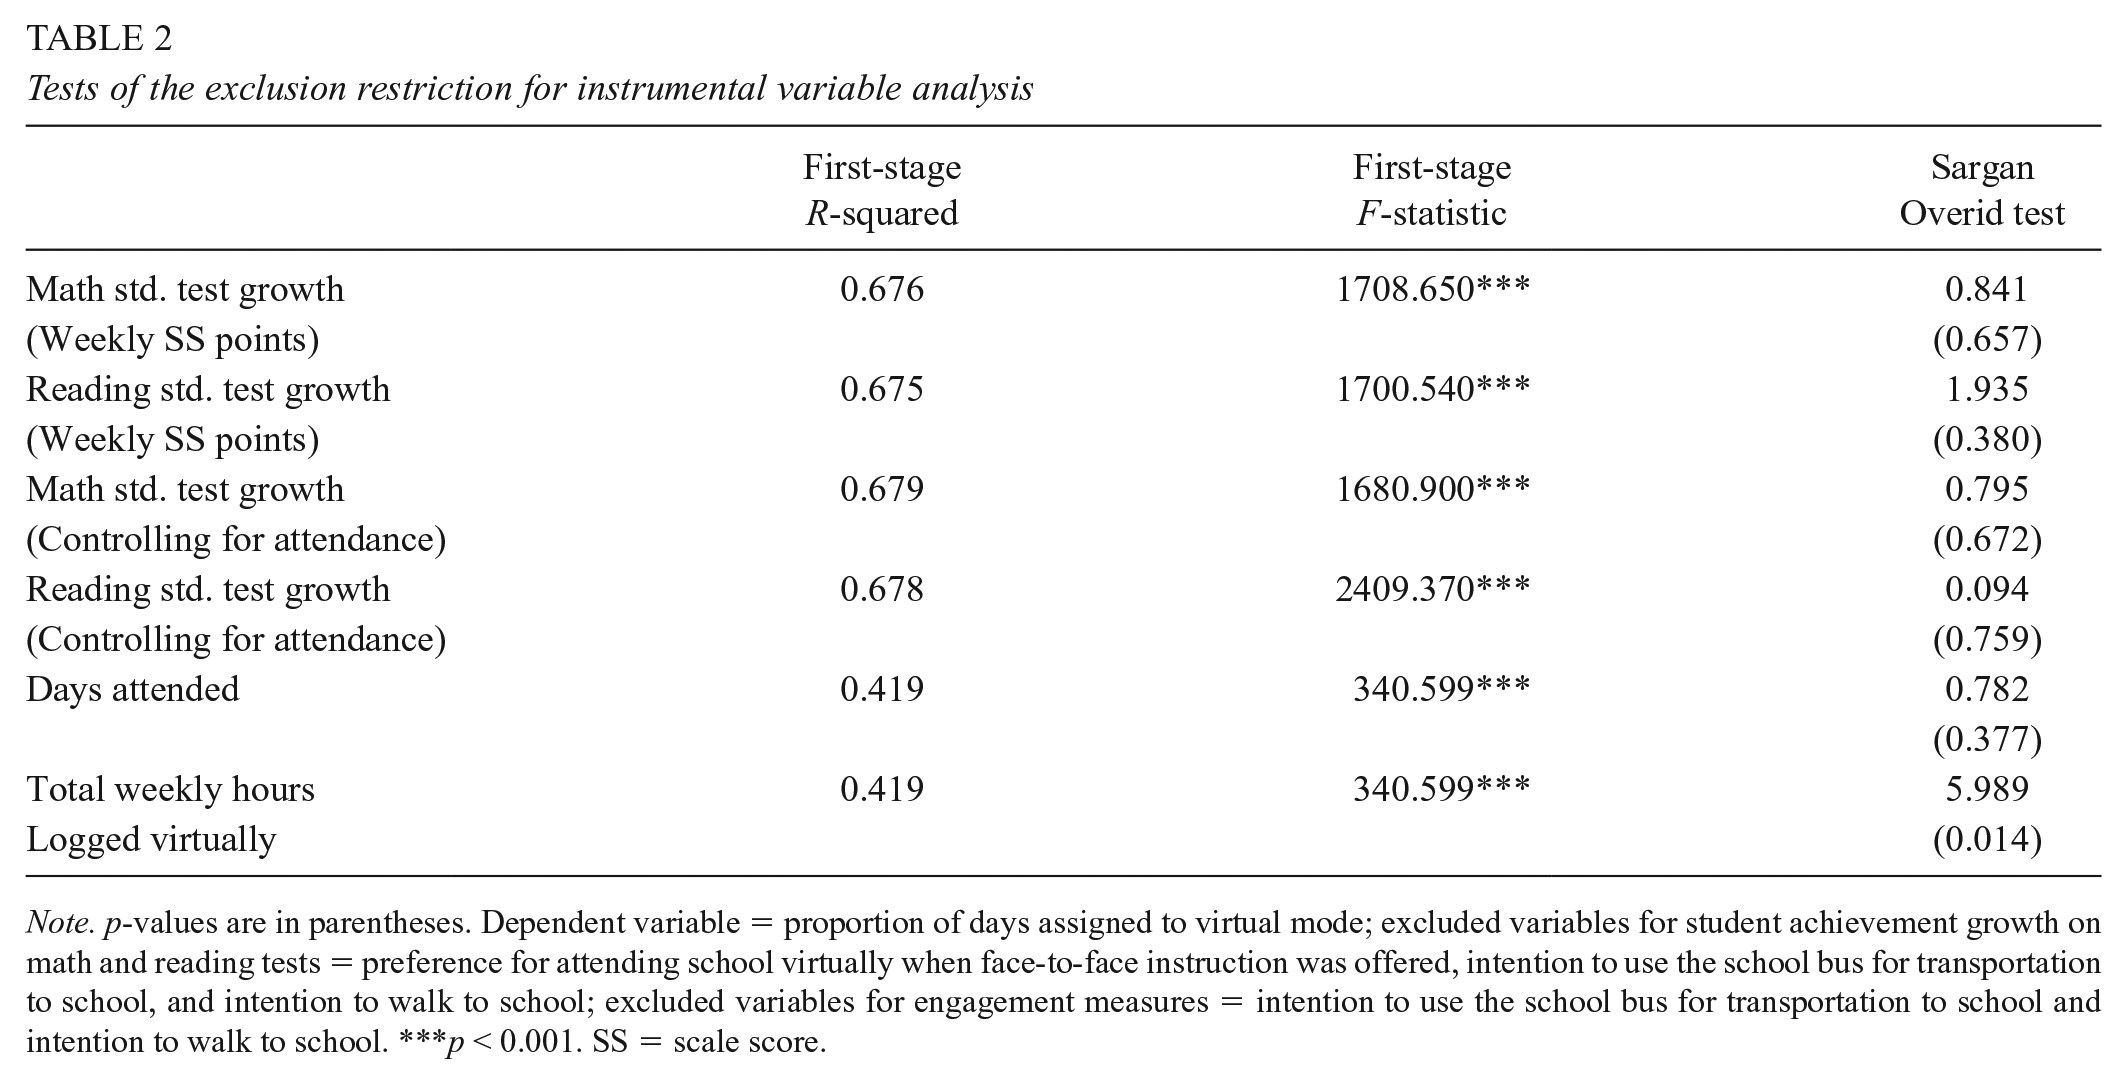
Note. p-values are in parentheses. Dependent variable = proportion of days assigned to virtual mode; excluded variables for student achievement growth on math and reading tests = preference for attending school virtually when face-to-face instruction was offered, intention to use the school bus for transportation to school, and intention to walk to school; excluded variables for engagement measures = intention to use the school bus for transportation to school and intention to walk to school. ***p < 0.001. SS = scale score.
Student Fixed-Effect Approach
As an additional sensitivity test, we employ a student fixed-effect approach that examines month-to-month variation in days attended and time logged virtually among students who switched from or to fully virtual learning during the fall of 2020. Because we could only measure student achievement growth at the semester level, we could not estimate achievement models with student fixed effects. The use of a student fixed-effect approach—as shown in Equation 7—mitigates potential bias from endogenous learning-mode choice by accounting for time-invariant characteristics of a student (

We also control for the all covariates included in prior models with month-to-month variation
Heterogeneous Effects
Lastly, we examine the extent to which student characteristics were associated with differential responses to learning mode. To do so, we separately estimate associations between the proportion of days assigned to virtual mode and achievement, attendance, and engagement after limiting the analytic sample to each subgroup of interest. These associations are separately estimated using the school fixed effect and 2SLS models described above by gender, race/ethnicity, SPED status, EL status, and FRPM status.
Findings
Learning-Mode Preference
We first examine the relationship between family preference for virtual schooling when face-to-face schooling was offered (as indicated on the family survey) and student and school characteristics by using a linear probability model. Overall, we find that a family’s preference for remaining virtual when face-to-face was offered has a reasonably strong association with several of our covariates (see Figure 1). We identify a large, significant relationship between family preference and the school-level proportion of days assigned to virtual mode (β = 0.612; p < 0.001), which likely reflects some combination of peer effects and neighborhood characteristics. We also identify a large, significant association between a family’s preference for remaining virtual and the proportion of positive cases in the student’s school (β = 1.797; p < 0.01).

Coefficient plot between opting to remain virtual when face-to-face was offered and student/family/school characteristics
Furthermore, we identify clear differences in family preference for virtual learning based on sociodemographic characteristics. Students who identified as Black were 10 percentage points more likely to want to remain in virtual learning mode, holding all else equal, while students who identified as EL were 5 percentage points less likely to want to remain virtual. The latter might indicate that communicating and comprehending language on a virtual learning platform is particularly difficult for students with still-developing English skills. Finally, students who received SPED services as well as those with past disciplinary infractions were slightly less likely to prefer to remain virtual, whereas students identified as female and qualifying for FRPM were slightly more likely to prefer to remain virtual. Lastly, students attending schools in the more affluent region of the district were 8% less likely to prefer virtual learning when face-to-face instruction was offered, which might be in response to lower infection rates and/or a higher prevalence of families identifying as Republican in this region.
Engagement and Achievement
Estimates of the relationship between the proportion of days assigned to virtual mode and achievement growth, days of school attended, and weekly hours logged on virtual platforms are presented in Table 3. We find generally negative associations between the proportion of days a student was assigned to virtual mode and average weekly scale-score growth in math and reading, although only some model specifications identify significant, negative associations. 7 For instance, we find that students achieved 0.20 scale-score points lower weekly reading growth when estimating models with school fixed effects. This difference translates into an effect size of –.08, which is considered moderate in magnitude (Kraft, 2020). 8 In math, we identify a significant, negative association between the proportion of days students were assigned to virtual learning and weekly test-score growth only after conditioning on days of school attended, which further increases in magnitude when conditioning on virtual program usage, indicating that not just how much time was spent online but how the time was used matters. Estimates remain comparable in direction and magnitude (if not significance) between the models employing OLS, school fixed effects, and IV approaches. Additionally, we provide evidence in Appendix A that estimates are consistent (if smaller in magnitude) when substituting the primary excluded instrument (family preference for virtual learning when face-to-face instruction was offered) entirely for the proportion of days assigned to virtual mode.
Associations between the proportion of instructional days in virtual mode and average weekly student achievement growth during the fall of 2020

Note. Standard errors are in parentheses. * p < 0.05; ** p < 0.01; *** p < 0.001. FE = fixed effect; S/M = student and month.
When examining associations with days of school attended, we find that students attending entirely virtually (versus students who attended 50% of days face-to-face) attended 1.5 to 2 more days of school per semester. When examining within-student variation from month-to-month, we find that students attended approximately a half day more of school on average when they switched from being assigned to attend school entirely virtually from face-to-face mode. However, it should be noted that when using categorical variables to measure each quartile of the proportion of days assigned to virtual mode, this positive association is driven entirely by students in the fourth quartile (assigned to virtual mode for 90%–100% of days). Similarly, students attending entirely virtually logged 8.5 to 10.5 more weekly hours virtually than students who attended 50% of days face-to-face, according to the same OLS and 2SLS models. When examining within-student changes, the modal student who switched from attending school entirely virtually to entirely face-to-face logged 17 more hours virtually per month. The comparability of estimates across model specifications demonstrates robustness to the varied assumptions of each model. We subsequently estimate the same models, controlling for preference for virtual learning and the proportion of days assigned to virtual learning mode (as well as an interaction term between the two variables) to parse out the extent to which any previously identified association might be due to different preferences (based on available information, beliefs, and values) versus externally imposed constraints on that choice (see Appendix B). We generally find that family preference (and whether that preference was realized) was more strongly associated with favorable attendance and weekly hours logged virtually than with scale-score growth.
To provide insight on potential mechanisms, we report associations between virtual learning usage by program and weekly differentials in student achievement growth. These estimates, shown in Figure 2, are identical to those reported in the “+Usage” columns of Table 3. The separate table was created to share coefficients for additional covariates. When examining associations with specific virtual learning programs and applications, we generally find nominal or higher rates of student achievement growth the more time students logged in programs (apart from a few small-magnitude, nonsignificant negative associations).

Coefficient plot between 4th through 8th virtual learning usage and weekly differential in student achievement growth during the fall of 2020
Most notably, each additional hour per week that students spent on the iReady platform was associated with scoring approximately 0.31 scale-score point higher in math (and 0.46 scale-score point higher in reading) per week. Those gains translate into effect sizes of 0.19 each in math and reading, which are considered moderate to large in magnitude (Kraft, 2020). This should be interpreted cautiously; at least part of the strength of the relationship is likely due to high alignment between content covered in iReady and the iReady-developed standardized tests used to measure learning, compounded by the identification of larger effect sizes in correlational (versus causal) studies (Kraft, 2020). Across subjects, applications that supported visualizations, such as PDF viewers and image apps, were also significantly associated with positive gains.
Beyond aggregate associations, it is likely that the efficacy of virtual learning varied based on student characteristics associated with structural inequities that proceeded and were exacerbated by COVID-19. To this end, we also examine subgroup variation by estimating models limited to only students belonging to each subgroup of interest, as shown in Figure 3. Across subgroups, students assigned to a higher proportion of days in virtual mode attended more days of school and logged more weekly instructional hours virtually. Students who identified as Black and qualified for FRPM experienced the largest positive associations between the proportion of days assigned to virtual mode and days of school attended. When examining associations with math and reading test-score growth, the identification of significant, negative associations with proportion of days assigned to virtual mode appears to be concentrated primarily among students identified as male, Black, and FRPM. Estimates are generally consistent across model specifications, as shown in Appendix C.

Coefficient plot by subgroup between proportion virtual and attendance, engagement, and achievement (OLS estimates)
Limitations
Throughout our analysis, we strive to mitigate potential bias in a variety of ways, including through the inclusion of controls for observable student characteristics; the use of school, grade, and student fixed effects; and the application of 2SLS estimation techniques. Nonetheless, potential threats to the validity of our estimates remain. For example, technology usage and achievement outcomes are likely associated with differences in family characteristics and resources, including, but not limited to, health status and the ability for families to provide (or pay for) supervision and academic support during the school day. Similarly, we cannot fully account for differences in students’ motivation or self-regulation that may affect the activities that teachers assigned to their students and student outcomes. However, the fact that a wide variety of empirical models yields similar results suggests that any omitted variable bias is likely small.
Another possible concern is the representativeness of the analytic sample and external validity. Although the district studied is diverse and overall achievement is close to nationwide averages, our study is based on a single district and may not extrapolate to other settings. Further, although our sample should, theoretically, contain all students in Grades 4–8 in the participating school district, certain parts of our analyses include only a subset of students for whom we have key data—most notably, the student test scores used to measure student achievement growth. The rate of test-score missingness is qualitatively similar across socio-demographic groups, with the exception of students identified as Black or receiving FRPM, who were around 20% and 10%, respectively, less likely to have test scores than other students in the district. Lastly, it is critical to acknowledge that this study focuses on academic outcomes. Numerous other nonacademic factors (i.e., social and emotional well-being, behavior, and disciplinary outcomes) are not within the scope of this study but are important in their own right as well as predictors of future life satisfaction and outcomes.
Discussion
The COVID-19 pandemic has brought about widespread changes in how students and families engage with the education system and has necessitated a shift to virtual learning on a scale that has not been seen previously. We document significant variation in family preference for virtual learning within our sample and demonstrate that observable characteristics of students and schools were strong predictors of this choice. Some of the strongest correlates of a family’s virtual-learning decision were school-level infection rates and the decisions made by other students at their school. This appears to indicate that much of the variation in family preference for virtual learning occurred between, rather than within, schools.
When examining student attendance and weekly hours logged virtually by mode, we identify generally positive associations with the proportion of days assigned to virtual mode. Specifically, students who attended 100% (versus 50%) of days virtually attended 1.5 to 2 more days of school during the fall semester and logged 8.5–10.5 more hours a week virtually (depending on model specification). However, it should also be noted that part of the positive association with proportion of days assigned to virtual mode might be due to the inherent stress or challenges to learning in a face-to-face environment during COVID-19 restrictions, including increased likelihood of infection and quarantine as well as many teachers being expected to continue accommodating virtual learners even once they had students back physically in their classrooms. Further, virtual attendance may not be as strongly associated with learning as attendance in face-to-face settings, given the greater ease with which students could disengage without detection (i.e., muting audio and turning video off).
In contrast, we identify significant, negative associations between student achievement growth and the proportion of days assigned to virtual mode. These findings are consistent with those identified in contemporaneous research within different educational settings, which have generally found null or negative associations between virtual instruction and student learning (Curriculum Associates, 2021c; Kogan & Lavertu, 2021; Kuhfeld et al., 2020; Pier et al., 2021; Renaissance Learning, 2021a, 2021b). When examining associations between time logged in specific virtual applications and student achievement growth, time logged in iReady was the most strongly associated with student achievement growth, potentially due to the highly structured, standards-targeted, personalized practice facilitated by the system.
Beyond relationships between learning mode and achievement growth for students as a whole, we also observe some notable variations across subgroups. Being assigned to a greater proportion of days in virtual mode was associated with the largest increases in days attended among students who identified as Black or received FRPM. These findings stand in contradiction to research conducted earlier during the COVID-19 pandemic that identified lower rates of engagement and assignment completion among students belonging to these subgroups (Besecker & Thomas, 2020; Thompson, 2021). One potential reason for divergent findings might be that earlier in the pandemic, evidence suggested that differential access to digital devices and infrastructure resulted in limited access to educational content and experiences for many students belonging to marginalized groups (Gonzales et al., 2020; Kim & Padilla, 2020). Alternatively, our partner district may have provided more equitable access to devices during the entire pandemic (in part because they had been doing some virtual instruction pre-pandemic and already had devices in the hands of students). However, the finding that students who identified as Black or received FRPM attended more school the greater the proportion of days assigned to virtual mode provides evidence that district attempts to mitigate this divide by providing access to devices and broadband were likely largely successful during the fall of 2020.
In contrast, when examining associations with student achievement growth by subgroup, students who identified as male, Black, and FRPL-eligible were most likely to experience significantly lower achievement growth the greater the proportion of days assigned to virtual mode. These discrepancies likely reflect differences in family resources at home, which became exacerbated by the virtual environment. From an equity perspective, it is concerning that many of the students who made the smallest gains when assigned to a higher proportion of days in virtual mode belonged to marginalized groups, which has the potential to exacerbate existing educational opportunity gaps.
Interestingly, when examining family preference for virtual learning in conjunction with associated student achievement growth, we see that greater preference for virtual learning for a given group did not consistently align with the sign of our measured efficacy. This could indicate that parents were privileging other factors, such as health concerns and political preferences, due to the nature of the pandemic (COVID Tracking Project, 2021). Alternatively (or in addition), these findings could be a result of families attempting to optimize their child’s education modality with imperfect information and/or privileging engagement (as a proxy for educational experience) over test-score gains. One piece of evidence that supports these interpretations is the finding that, in aggregate, family preferences were more strongly (and positively) associated with improved student attendance and weekly hours logged virtually measures than scale-score growth. It is also possible that families had distorted perceptions regarding the benefits of virtual (or face-to-face) learning for their child and/or the ability of their school to successfully carry out virtual instruction; on the other hand, it could be the case that families did not foresee the difficulties that virtual (or face-to-face) learning could entail, whether that be language, technology, motivation, or otherwise.
Conclusion
In general, it is not clear that the students most likely to benefit academically from virtual learning were the students most likely to opt in to virtual learning when face-to-face instruction was offered. Instead, other factors, such as health or political considerations (or imperfect information), appeared to be more likely influences. Nonetheless, under the confines of crisis-schooling studied, students appeared on average to attend more school and log more virtual hours the higher the proportion of days they were assigned to attend school virtually. Further, students belonging to advantaged groups reached similar rates of student achievement growth regardless of instructional mode, despite negative associations with achievement growth identified among students who identified as male, Black, or receiving FRPM.
These findings suggest that virtual learning as implemented during the fall of 2020 in the district studied might be most viable as an alternative learning mode for students identified as female and/or belonging to historically advantaged groups. In turn, this might allow for spillover benefits for students who remain in a more comprehensive, traditional, face-to-face instructional environment (Darling-Aduana, 2019; Hart et al., 2019). Further, continuing to offer virtual learning where feasible might be a helpful option to provide students likely to benefit from anytime, anywhere access (i.e., students who possess sufficient self-regulation skills and/or out-of-school resources to monitor their own engagement), so long as schools are able to also implement fidelity and quality-control measures to accurately measure and foster engagement (Darling-Aduana, 2019).
Although the state of virtual learning is likely to continue evolving and society will (hopefully) soon move past the current era of COVID-19-triggered crisis-schooling, this study provides a nuanced look at preferences, engagement, and achievement during this unique era. Certain subgroup-specific trends demonstrate the potential for virtual learning to enhance educational experiences when appropriately targeted to students most likely to benefit, while also expanding opportunities for choice within educational institutions. However, families may need additional assistance navigating and understanding the ramifications of these new educational modes, while policymakers and practitioners must continue to investigate critically and refine educational offerings to ensure equitable, quality educational opportunities for all students.
Footnotes
Appendix
Subgroup analysis sample sizes

| Math std. test growth |
Reading std. test growth |
Days attended and |
|
|---|---|---|---|
| Female | 12154 | 12197 | 16055 |
| Male | 12440 | 12626 | 16595 |
| Black | 8995 | 9027 | 14165 |
| Hispanic | 4194 | 4254 | 5390 |
| White | 7161 | 7253 | 8135 |
| SPED | 2667 | 2728 | 3750 |
| Not SPED | 21927 | 22095 | 28901 |
| EL | 1341 | 1373 | 1716 |
| Not EL | 23253 | 23450 | 30935 |
| FRPM | 8218 | 8313 | 11760 |
| Not FRPM | 16376 | 16510 | 20891 |
Note. EL = English learner; FRPM = free or reduced-price meal; SPED = special education; SS = scale score.
Authors’ Note
All opinions expressed herein are those of the authors and do not necessarily represent the opinions of any school district partner.
Compliance With Ethics Standards
This study was reviewed and approved by the Georgia State University IRB, protocol #H21185.
Open Practices
The data that support the findings of this study are available from the school district partner but restrictions apply to the availability of these data, which were used under license for the current study, and so are not publicly available. Data are however available from the authors upon reasonable request and with permission of the school district partner. Additional information about the data and code used in this study is available via the following link: ![]() .
.
Notes
Authors
JENNIFER DARLING-ADUANA is an assistant professor of learning technologies at Georgia State University. Her research focuses on the equity implications of K–12 online learning.
HENRY WOODYARD is a doctoral candidate in economics at Georgia State University and a graduate research assistant with the Georgia Policy Labs. His research lies at the intersection of labor and urban economics.
TIM SASS is a Distinguished University Professor in the department of economics at Georgia State University and the W. J. Usery Chair of the American Workplace in the Andrew Young School of Policy Studies. He is also the faculty director of the Metro Atlanta Policy Lab for Education (MAPLE). His research interests include the teacher labor supply, the measurement of teacher quality, and school choice.
SARAH BARRY is a doctoral candidate in economics at Georgia State University and a graduate research assistant with the Georgia Policy Labs. Her research interests include education policy, urban/environmental economics, and economics pedagogy.