
Abstract
The schooling disruptions due to the COVID-19 pandemic continue to reverberate across the K-12 educational system more than a year after schools closed for in-person instruction. In this study, we examined the aftermath of these disruptions by modeling student achievement trends prior to and during the pandemic, with particular focus on growth in 2020-2021. The data included test scores from 4.9 million U.S. students in Grades 3 through 8. Although the average student demonstrated positive gains in math and reading during the 2020-2021 school year, students were still behind typical (prepandemic) averages by spring 2021 (0.16 to 0.26 standard deviations behind in math and 0.06 to 0.11 standard deviations behind in reading). Furthermore, growth in math was more variable than in prior years, and much of the gains occurred among initially high-performing students pulling further ahead. Findings support the theory that the pandemic left students behind academically across the board while also worsening existing educational inequities.
Introduction
The COVID-19 pandemic has interrupted almost all aspects of K-12 schooling since most U.S. schools closed to in-person instruction in March 2020 (Peele & Riser-Kositsky, 2020). Disruptions continued well into the 2020-2021 school year, with the majority of U.S. students still receiving at least some remote instruction by spring 2021 (Institute of Education Sciences, n.d.). Students and educators reported facing a wide range of academic, socioemotional, and health challenges during the COVID-19-interrupted school years. For instance, over 70% of students reported experiencing one or more obstacles to learning, such as pandemic-driven concerns related to health, distractions at home, and family responsibilities (YouthTruth, 2021). Meanwhile, educators had to contend with rapid shifts in student enrollment, toggling between in-person and online teaching, and finding ways to ensure the safety of students during in-person instruction, all while coping with the continued health and societal effects of the pandemic. In short, the 2020-2021 school year was far from normal for students and teachers.
We are still in the early stages of understanding the full scope of the impacts wrought by COVID-19 disruptions to the education system and the effects on student learning. Planning for how best to support students’ recovery requires a clear understanding of the scope of the overall impacts, how much students were able to learn during the school year following the pandemic’s arrival (2020-2021), and the extent of differences in learning across student groups. To that end, this study contributes descriptive evidence on academic growth across the COVID-19 pandemic period using the most comprehensive data set to date. In particular, results from the 2020-2021 school year are important to understand the state of recovery in U.S. public schools and what additional resources are needed for the long recovery.
To help contextualize this study, we begin with a brief synthesis of research on achievement trends in the COVID-19 era. Our review includes descriptive data from achievement tests taken in spring 2021, which have not been systematically summarized in peer-reviewed resources (though national and international results from the 2020-2021 school year have been summarized by Halloran et al., 2021, and Thorn and Vincent-Lancrin, 2021). Spring 2021 achievement tests also have limitations enumerated by other scholars (Gerwetz, 2021; Ho, 2021) that we briefly review. We then situate our research questions and analyses within this context.
Existing Research on Student Learning During the Pandemic
To summarize extant research on student achievement during the COVID-19 pandemic, we searched for research studies and test results published by state or assessment providers, including the Center for Reinventing Public Education’s COVID-19 K-12 research database (Evidence Project, 2021), Google Scholar, and the assessment websites of all 50 states and the District of Columbia. We included studies that were (a) conducted in U.S. K-12 public schools, (b) included standardized assessments of student achievement, and (c) included data collected before and after the start of the pandemic so that comparisons could be made to prepandemic achievement. In total, we reviewed 75 studies/state websites and found 44 studies that met our criteria (16 using optional interim/benchmark assessments and 28 reports using a state’s federally mandated end-of-year assessments). Table A1 in the appendix (in the supplemental materials) provides a summary (and references) for the interim assessment results, and Table A2 shows the summary of the state-level assessment results.
Before discussing findings across studies, it is important to note that many researchers have cautioned against interpreting trends in achievement test results between 2019 and 2021 due to differences in (a) testing population (Ho, 2021), (b) test mode of administration (Barnum, 2021), and (c) the test themselves (Gerwetz, 2021). For example, the Pennsylvania education secretary Noe Ortega wrote, “The very student groups that have faced the greatest historical disadvantages will be systematically underrepresented in any near-term statewide assessment administration” (Ortega, n.d.). However, others have encouraged the use of these data (with appropriate caveats) to provide a more comprehensive understanding of the academic impact of the pandemic (Betebenner et al., 2021). Therefore, we present our review of assessment results with a word of caution that each individual study likely has one or more limitations due to the challenges of administering assessments during a pandemic.
Interim Test Results
In total, 16 of the 44 identified studies used interim/benchmark assessments (such as MAP Growth or Renaissance STAR) and were conducted across the 2020-2021 school year. Of these 16 studies, eight studies included fall 2020 data, three focused on winter 2021 data, and five included spring 2021 results (including some measure of fall-to-spring growth, though two were using data from just a single state or district). Given the focus of our study is understanding student achievement across the span of the 2020-2021 school year, we focus our interpretation of results on three nationwide studies (Curriculum Associates, 2021; Lewis et al., 2021; Renaissance, 2021) that examined fall-to-spring growth. Across the three studies, results show that students did make learning gains in the 2020-2021 school year, but gains were smaller in magnitude compared with historical data. Student achievement (reported as percentiles or percentage on grade level) in spring 2021 was lower than historical levels, with larger declines in math than in reading. In addition, Black, Hispanic/Latino, and American Indian/Alaskan Native students and students in economically disadvantaged schools or neighborhoods experienced the largest declines (Kogan & Lavertu, 2021; Lewis et al., 2021; West & Lake, 2021). Furthermore, students in Grades K-3 were falling behind in the development of essential early reading skills (Domingue et al., 2021; McGinty et al., 2021).
State Summative Test Results
Among the 50 U.S. states and Washington, D.C., we found that 21 states had released proficiency rates for 2020-2021 that allowed for comparison with 2018-2019. As mentioned earlier, such comparisons should be made with extreme caution given shifting samples and testing modes before and after the pandemic’s onset. Figure 1 presents the trends across 16 states (out of 28 that reported 2020-2021 test scores) that had participation rates of at least 85%. Multiple patterns emerged from the state results. For one, math achievement in Grades 3 to 8 seems to have declined more than reading/English language arts (ELA) scores in most of the reviewed studies. For example, the average percentage of students who were proficient on their spring 2021 state assessment dropped 11 percentage points in math but 6 points in reading (aggregating across all states with available data). Additional detail on these state results can be found in Table A2 in the supplemental material.

Changes in state trends in proficiency rates between spring 2019 and spring 2021 for states reporting participation rates greater than 85% on average. Vertical bars represent the calculated overall (or average across grades) change in proficiency, and the vertical lines represent spread across grade levels (when reported).
Gaps in the Literature
Cumulatively, this synthesis of available research highlights important national trends during the COVID-19 pandemic, but many aspects of these trends are still poorly understood. In particular, we note three primary gaps in our current understanding of COVID-19 impacts, all of which our study begins to address. First, the available studies did not rigorously quantify student academic growth over the 2020-2021 school year using growth models that account for time in school since the pandemic began. Knowledge about 2020-2021 school year achievement trends is likely key to understanding what student progress was like after the initial shock of the pandemic and school closures in spring 2020, whether students who began the pandemic struggling academically were more impacted, and how much work remains to support students as they recover academically. Second, gaps remain in our understanding of how the country’s most vulnerable students grew academically during COVID-19 and whether existing inequities changed during the 2020-2021 school year. Specifically, is there evidence of differential growth across students by race/ethnicity, and have such differences exacerbated long-standing inequities in the educational system? Third, the health risks of the pandemic were disproportionately borne by some communities (oftentimes low-income ones) compared with others. Is there evidence that students living in communities with the largest health risks also saw the most significant reductions in academic growth?
The Current Study
To address these critical gaps in our understanding, we conducted a series of analyses using a national sample of 4.9 million U.S. students in Grades 3 through 8 who took MAP Growth assessments, which are administered at multiple time points across the school year. We estimated student learning trajectories from the start of fall 2019 to the end of the 2020-2021 school year in order to describe how trends in student learning shifted after school closures in 2020 and throughout the following academic year. We acknowledge that our study was descriptive in nature and not intended to support causal inferences. Our goal was to provide evidence on student growth and achievement one-and-a-half years into the pandemic, and to understand differential growth across student racial/ethnic groups as well as among students living in communities identified as being most at risk during the pandemic. In so doing, we asked three primary research questions, which parallel the gaps we identified in the current literature:
How did student growth during the 2020-2021 school year compare with growth during 2019-2020 and a “typical” school year? Did students who began the pandemic with low achievement show more or less growth in the 2020-2021 school year?
Did racial/ethnic inequities in academic achievement widen after disruptions from the COVID-19 pandemic?
Did students in communities that were hardest hit by COVID-19 make less academic progress during the 2020-2021 school year than students in other communities?
Method
Measure of Achievement
The data for this study came from NWEA’s anonymized longitudinal student achievement database. School districts use NWEA’s MAP Growth assessments to monitor elementary and secondary students’ reading and mathematics achievement throughout the school year. MAP Growth is a computer adaptive test that precisely measures achievement even for students above or below grade level and is vertically scaled to allow for the estimation of gains across time. The MAP Growth assessments are typically administered three times a year (fall, winter, and spring) and are aligned to state content standards (NWEA, 2019). Test scores are reported on the RIT (Rasch Unit) scale, which is a linear transformation of the logit scale units from the Rasch item response theory model.
A large number of school districts offered remote or hybrid instruction during portions of the 2020-2021 school year, which meant that many students were assessed at home under different conditions than typical administration of standardized assessments (Barnum, 2021). To address concerns about the comparability of assessments administered in these different modalities, Kuhfeld, Lewis, et al. (2020) compared the psychometric properties of MAP Growth assessments collected in Grades K-8 in fall 2020 within a subset of districts that administered MAP Growth remotely or in typical in-person school settings. The results supported the comparability of remote and in-person test administration in Grades 3 to 8 but called into question the trustworthiness of K-2 assessment results that were administered remotely. Given these findings, we focus our analyses on students in Grades 3 to 8 during the pandemic period.
Student and School Characteristics
The NWEA data also included demographic information, including student race/ethnicity, gender, and age at assessment, though student-level socioeconomic status is not available. School-level racial/ethnic distribution, urbanicity, and enrollment were drawn from the 2018-2019 Common Core of Data files collected by the National Center for Education Statistics. Community risk due to the pandemic was calculated from the COVID-19 Pandemic Vulnerability Index (PVI) reported at the county level by National Institute of Environmental Health Sciences (NIEHS). The PVI was designed to monitor disease trajectories and communicate local vulnerability and is a composite index from 12 indicators, including current infection rates, available hospital beds, population concentration, social distancing policies, and health and environmental vulnerabilities (Marvel et al., 2021). We pulled the PVI each day from February 28, 2020 (the first day the PVI was published) to June 1, 2021 (our cutoff date for beginning analysis) and took the average. Communities with similar transmission rates may differ on their PVI scores due to preexisting health and environmental risk factors (e.g., high population density and comorbidities), whereas alternatively, a community with otherwise low risk factors may have a high PVI score due to high disease spread and few social distancing measures. In the NIEHS dashboards, the PVI measure is reported as both a continuous measure as well as quintiles of risk. For this study, we split the continuous PVI metric into three indicators: (a) low risk (e.g., bottom quintile), midlevel risk (20th to 80th percentile), and high risk (top quintile of PVI scores).
Analytic Sample
We used the test scores of approximately five million third- to seventh-grade students in over 16,000 public schools across the United States. In this study, we followed students across two school years (2019-2020 and 2020-2021) and one extended summer break (as described in further detail later, due to lack of spring 2020 testing data, the last months of the 2019-2020 school year are bundled with summer 2020). Table 1 provides descriptive statistics for the sample by subject and grade. Overall, the sample was 49% White, 15% Black, 19% Hispanic, 4% Asian, and 12% Other racial/ethnic group. A comparison of the 16,000 public schools in our sample relative to the U.S. population of public elementary and middle schools (72,075 total schools serving Grades 3 to 8) is provided in Table 2. Overall, our sample consisted of approximately 1 in 5 U.S. public schools that served students in Grades 3 to 8. The NWEA sample of schools closely aligned to the characteristics of U.S. public schools, with a slight overrepresentation of Black students and underrepresentation of Hispanic students. Additionally, our sample was slightly more urban and has a slightly higher percentage of schools that have low pandemic risk than the national population of public schools.
Sample Descriptive Statistics
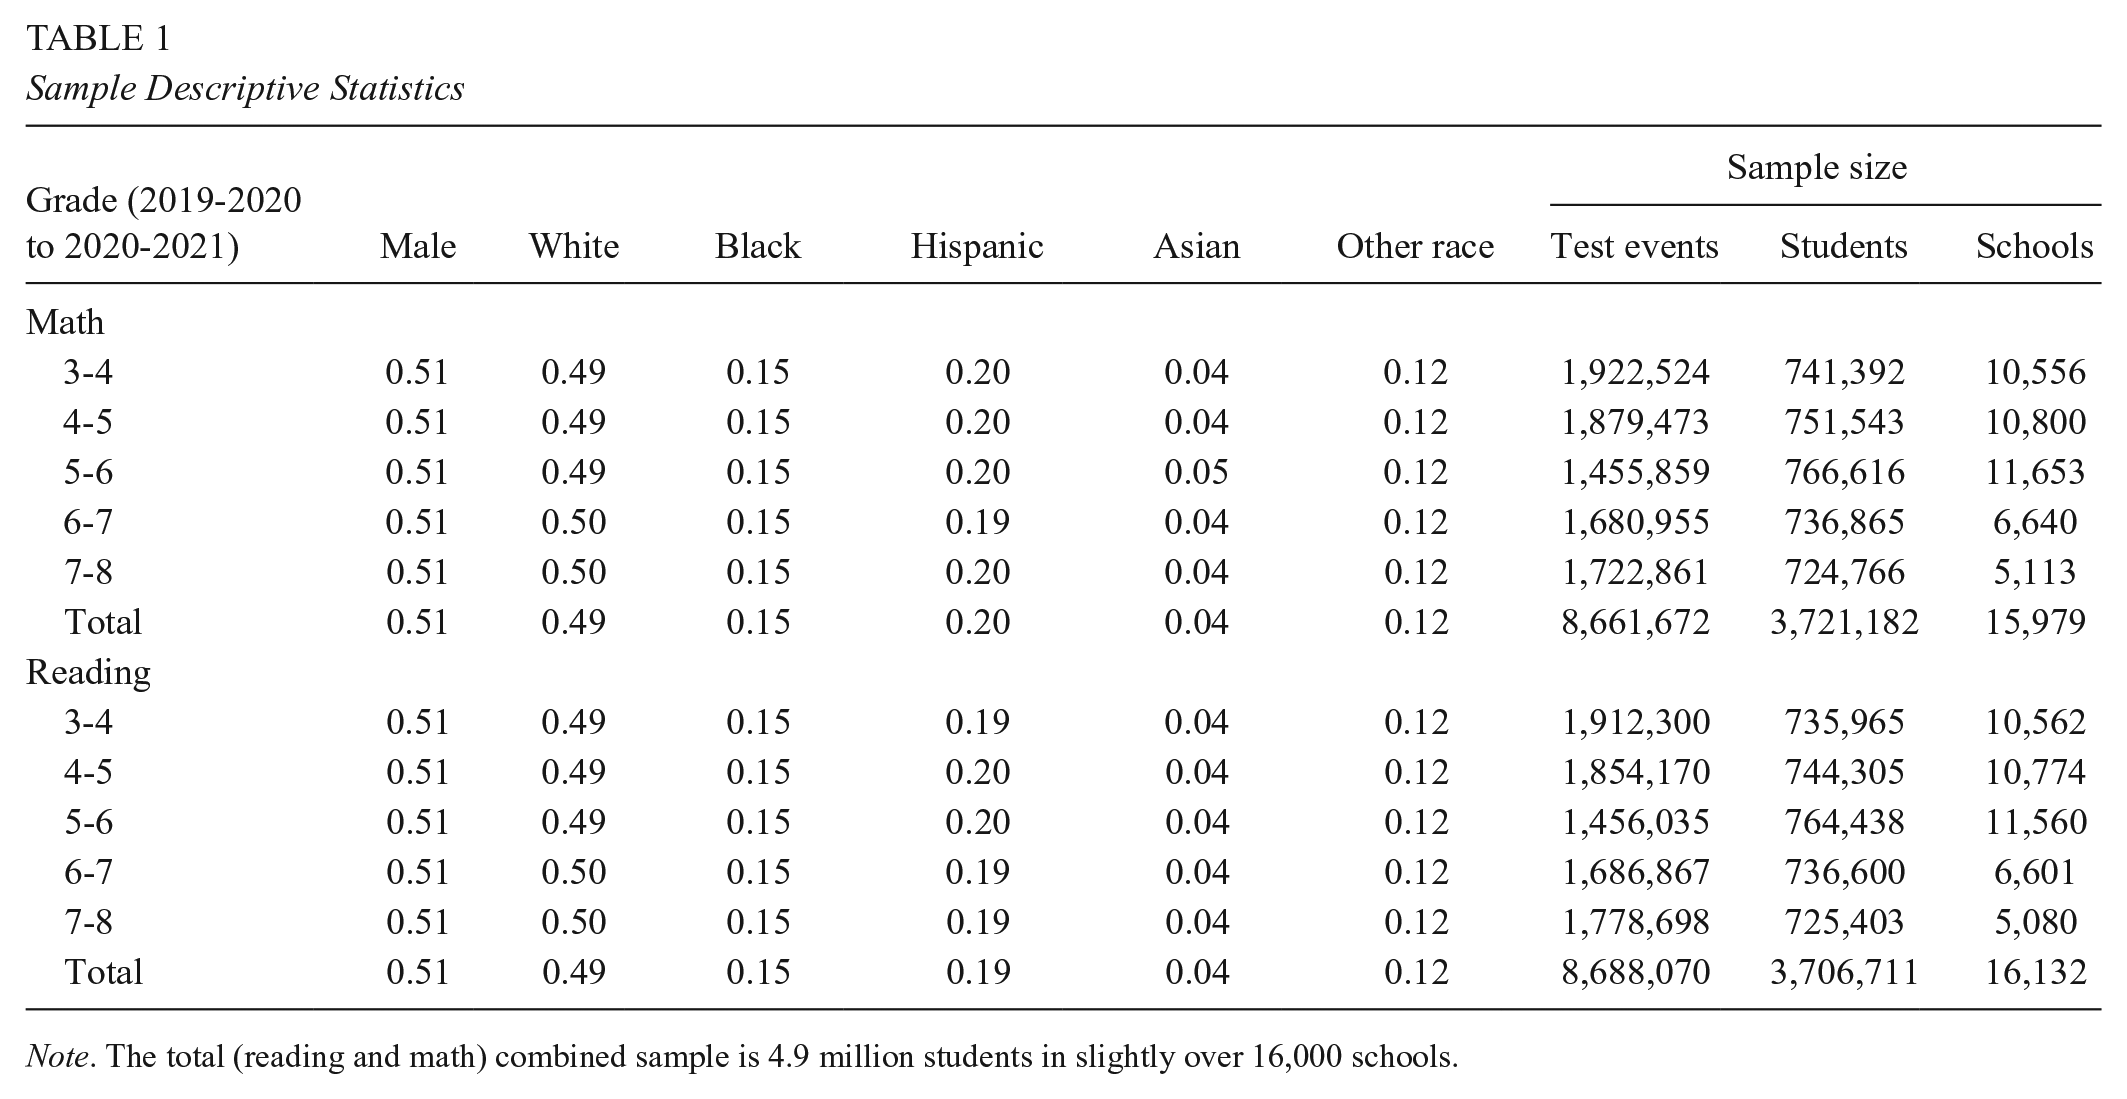
Note. The total (reading and math) combined sample is 4.9 million students in slightly over 16,000 schools.
Descriptive Information for the NWEA School Sample Compared With the Population of U.S. Public Schools Serving Grades 3 to 8
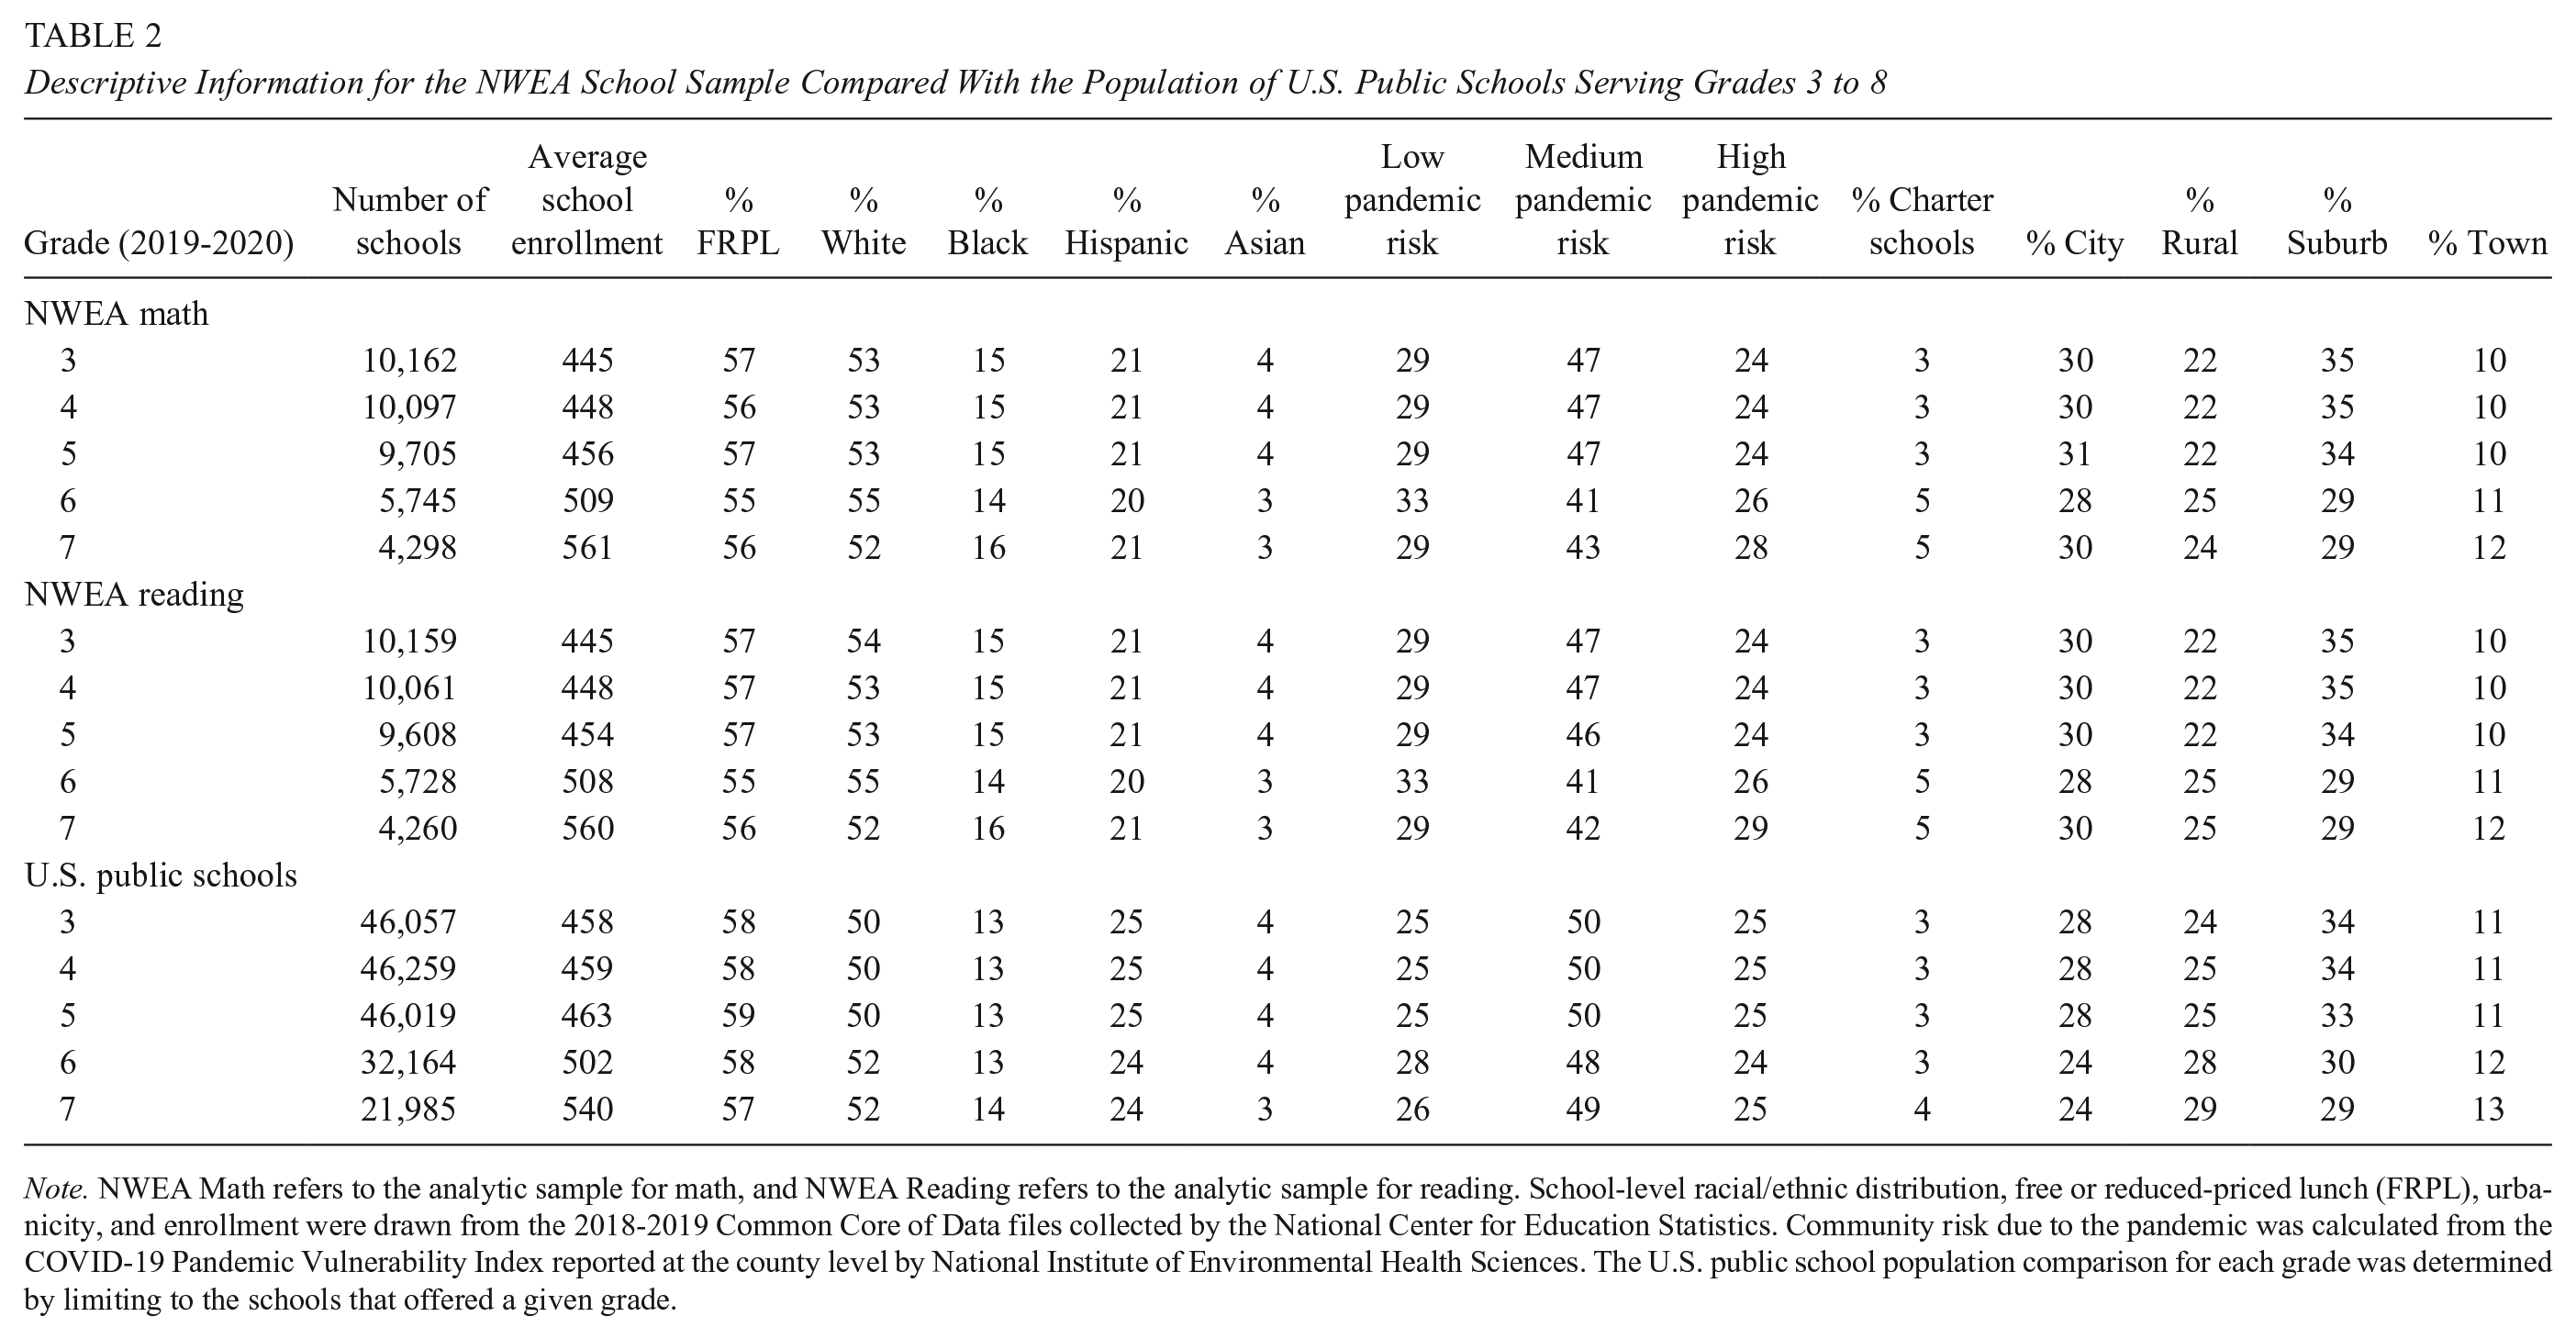
Note. NWEA Math refers to the analytic sample for math, and NWEA Reading refers to the analytic sample for reading. School-level racial/ethnic distribution, free or reduced-priced lunch (FRPL), urbanicity, and enrollment were drawn from the 2018-2019 Common Core of Data files collected by the National Center for Education Statistics. Community risk due to the pandemic was calculated from the COVID-19 Pandemic Vulnerability Index reported at the county level by National Institute of Environmental Health Sciences. The U.S. public school population comparison for each grade was determined by limiting to the schools that offered a given grade.
Research Question 1: Overall Patterns of Growth During the 2020-2021 School Year
To obtain estimates of growth rates across two school years (2019-2020 and 2020-2021), we used a series of multilevel growth models (longitudinal test scores nested within students within schools). Following other seasonal learning research studies (Kuhfeld et al., 2021; von Hippel et al., 2018), we estimated student learning rates as a function of the months that elapsed during the two school years and the summer between. We selected a linear functional form for these analyses based on an examination of growth patterns that we describe in Appendix B in the supplemental materials.
Under this model, the test score ytij for student i in school j at time point t was modeled as a linear function of the months that a student had been exposed to the 2019-2020 school year (MonY1 tij ), the school closures and summer break of 2020 (Sum tij ), and the 2020-2021 school year (MonY2 tij ). Each of the growth terms is calculated based on students’ school start date, end date, and test event date. Given we do not have testing data from spring 2020, we attribute the final months of the 2019-2020 school year (March 2020 to June 2020) to the “summer 2020” period. District calendars were collected for the 2019-2020 and 2020-2021 school years from participating school districts. We calculated “months of exposure” to school at each test event as the total number of days elapsed between the school’s start date and testing date(s) divided by 30. For example, a hypothetical fourth-grade student testing at the beginning of October 2021 may have 6.5 months of exposure to third grade in the 2019-2020 school year, 5.5 months of exposure to summer break following third grade (including the spring 2020 school closure period), and 1.8 months of exposure to fourth grade by the time of fall 2020 testing. At Level 1 (test score occasion), the growth model can be expressed as

The intercept (π0ij) is the predicted score for student i in school j tested on the 1st day of the 2019-2020 school year, π1ij is the average RIT gain per month during the 2019-2020 school year, π2ij is the monthly gain/loss during the spring 2020 school closures and summer 2020 break, and π3ij is the average RIT gain per month during 2020-2021. In Appendix B in the supplemental materials, we discuss sensitivity analyses that tested the functional form of growth in the 2020-2021 school and established that growth was sufficiently linear in the 2020-2021 school year. In 2019-2020, we cannot test the functional form given we have only two time points for most students. At Levels 2 (student) and 3 (school) of the model, the intercept and linear growth parameters were allowed to vary among students within schools and between schools. This model was estimated separately by subject (mathematics and reading) and 2019-2020 grade level (3 to 7) using HLM Version 7 (Raudenbush et al., 2013).
Level 2 model (student i within school j):


Level 3 model (school j):


Variance component specification:

To further contextualize the achievement patterns we observed in 2020-2021, we calculated standardized effect sizes comparing spring 2021 mean test scores with the mean test scores of students in the same grade in spring 2019. The RIT score means, standard deviations, and sample sizes by grade, subject, and term that were used in the calculations are presented in Table A3 in the supplemental materials. The standardized gap between average test scores in grade g between spring 2019 and spring 2021 is

where
Additionally, we compared the average growth rates in 2020-2021 (as well as the variability in those growth rates) with “typical” year growth rates in a prior analysis of MAP Growth data (Kuhfeld, Soland, et al., 2020). In that paper, a similar growth model was estimated using national MAP Growth test data from 2017-2018 and 2018-2019. Given that students were in school for the entire 2017-2018 school year, the summer 2018 growth term represented a typical summer, whereas the summer 2020 growth term in our model represents a combination of the last months of the 2019-2020 school year as well as the summer 2020 months. The model parameters from the “typical growth” analyses are presented in Tables A4 and A5 of the supplemental materials. To understand the variability in growth during the 2020-2021 school year relative to a typical year, we calculated the empirical Bayes (EB) estimates of 2020-2021 monthly growth (
Last, we examined the associations between students’ achievement levels prior to the pandemic and growth during the 2020-2021 school year based on the random-effect variance-covariance matrices. A key parameter of interest was the within-school correlation among academic achievement at the start of the 2019-2020 school year (r0ij) and growth rates during the 2020-2021 school year (r3ij). This parameter indicates whether students who were higher achieving before the onset of the pandemic showed higher growth rates across the 2020-2021 school year than students who were initially low achieving.
Research Question 2: Racial/Ethnic Group Differences in Academic Gains
Second, we examined whether learning rates during COVID-19 differed by race/ethnicity within the same school as well as between schools based on the racial/ethnic student composition of the school. Specifically, we included group mean centered student race/ethnicity indicators in Level 2 of our model, which allows for the interpretation of racial/ethnic differences (with White students as the reference group) within a given school. Due to low counts for many of our other racial/ethnic groups (e.g., Native Americans, Pacific Islanders, students of two or more races), we created an “other race” group to include these students in the model but did not interpret the corresponding parameters. At Level 3 of the model, we include school racial/ethnic composition variables to test whether there are between-school differences in growth rates for schools serving a high proportion of racial-/ethnic-minority students.
Level 2 model (student i within school j):


Level 3 model (school j):


Research Question 3: Association Between Community Vulnerability and Learning Patterns
To examine the relationship between student learning and the degree to which students’ communities were hit by the pandemic, we included the county-level PVI, which is used by NIEHS to monitor disease trajectories and communicate local vulnerability (Marvel et al., 2021; NIEHS, n.d.). The PVI is a composite index from 12 indicators, including current infection rates, population concentration, existing policies in interventions, and health and environmental vulnerabilities (including race and poverty indicators). PVI scores are typically reported either in a continuous metric (0–1) or as quintiles. In this study, we grouped schools into three categories: (a) low risk (e.g., bottom quintile), midlevel risk (20th to 80th percentile), and high risk (top quintile of PVI scores). We included the medium- and high-PVI indicators at Level 3 of the model (with low-PVI schools as the reference group):
Level 3 model (school j):


We estimated the growth model conditional on PVI using both the COVID-19 cohort (2019-2020 to 2020-2021) as well the prepandemic cohort (2017-2018 and 2018-2019) used in a prior analysis of MAP Growth data (Kuhfeld, Soland, et al., 2020). Given the PVI measure reflects a combination of COVID-19-specific policy responses to the pandemic as well as preexisting health and economic disparities, examining whether high-risk communities showed differential growth prior to the pandemic provides an important check on whether it was COVID-19 disruptions or preexisting differences driving growth rate disparities.
Results
Research Question 1: Overall Patterns of Growth During the 2020-2021 School Year
Figure 2 shows the growth trajectories of five cohorts of students, starting with students moving from third to fourth grade during 2019-2020 and 2020-2021 school years and ending with students moving from seventh to eighth grade during the same two school years. Specifically, the average test scores by grade and month (shown as circles proportional to how many students tested in a given month) are plotted, as are the estimated linear 1 growth patterns (shown as lines) during (a) the fall and winter of the 2019-2020 school year (spring test data were missing for over 99% of students), (b) the period following March 2020 school closures through the summer of 2020, and (c) the 2020-2021 school year. The growth parameter estimates and standard errors are provided in Table 3. Across Grades 3 to 8, the average student showed almost uniformly positive math and reading test score gains on average in the 2020-2021 school year, though distinct patterns for math and reading were clear. In the period directly following the initial shock of school closures due to the pandemic (between March 2020 and the start of the 2020-2021 school year), students showed sizable test score drops in math but mostly flat growth patterns in reading. However, as the 2020-2021 school year progressed, students showed strong gains in math, but any observed gains in reading were modest. In other words, students’ math achievement declined in the early phase of the pandemic but showed evidence of rebounding over the course of the 2020-2021 year. Meanwhile, reading achievement appears to have weathered the initial shock but then stayed fairly stagnant during 2020-2021.

Growth trends across 2019-2020 and 2020-2021 school years for (A) math and (B) reading. The number to left of each line represents the grade students were in during the 2019-2020 school year. Circles represent the mean scores within each month (size is proportional to the number of observed students in a month), and lines display the estimated growth trajectories from the multilevel growth model (see Table 3). The solid lines represent school year growth, and the dashed line represents the estimated school closure/summer learning trajectory (which the model estimates by extrapolating from data at the end of the 2019-2020 school year and start of the 2020-2021 school year).
Estimated Fixed Effects for the Hierarchical Linear Growth Model for Research Question 1

p < .05. **p < .01. ***p < .001.
By the end of the 2020-2021 school year, students were 0.16 to 0.26 standard deviations below a “typical” spring in math and 0.06 to 0.11 standard deviations below in reading, with the largest differences in fourth and fifth grades (see Table A3c in the supplemental materials). These large differences in math achievement by spring 2021 appear to be linked to the sizable drops that occurred during summer 2020.
We next highlight the variability in growth rates during the 2020-2021 school year. Students’ growth in math achievement looked closer to a typical school year than students’ growth in reading achievement. This may in part be due to the lower starting point in math relative to reading in fall 2020. Figure 3 compares the variability in 2020-2021 school year growth rates with growth rates observed in a typical school year (2018-2019, the most recent noninterrupted school year). Median growth rates are shown as the horizontal bar inside each box, and the 25th and 75th percentiles are displayed at the bottom and top of each box. Comparison of the medians between years shows that math growth rates in 2020-2021 were similar to a typical year (2018-2019), while reading growth rates were far lower than in a typical year. Figure 3 also indicates that 2020-2021 growth rates in both subjects were more variable than a typical year (with the exception of reading in Grades 4 to 5) and particularly so for math. That is to say, the heterogeneity in learning rates within a school and grade level was greater in the 2020-2021 school year than in the 2018-2019 school year. Additionally, particularly in the middle school grades, a larger percentage of students had lower achievement scores in 2020-2021 relative to a typical year.

Variability in growth estimates (reported in monthly Rasch Unit gains or losses) for 2020-2021 relative to a typical school year (2018-2019). The box displays the interquartile range, and the vertical lines and dots show the extremes of the distribution. Any part of the distribution falling below zero indicates a student lost learning over the course of the school year.
We also examined whether there is a strong association between prepandemic achievement and growth in the subsequent periods to see if students who had already been behind likely fell further behind during COVID-19. The random-effect standard deviation estimates and relationship among the model parameters are included in Table A6 in the supplemental materials. Results on the correlation between initial achievement and growth during 2020-2021 were mixed. Students who were higher achieving in fall 2019 tended to show greater gains in math during 2020-2021 (with correlations between initial achievement levels in fall 2019 and 2020-2021 growth rates ranging from .17 to .30). However, there were near-zero correlations between fall 2019 reading achievement and growth during the 2020-2021 school year. These results may suggest that students who had been low achieving prior to the pandemic were additionally impacted in math, but the impact on reading was more evenly experienced by all students regardless of their prepandemic achievement levels.
Research Question 2: Racial/Ethnic Group Differences in Academic Gains
We first considered whether within-school racial/ethnic inequalities widened significantly during the pandemic. Figure 4 displays the estimated within-school racial/ethnic differences in 2020-2021 learning rates (parameter estimates are provided in Table A7 in the supplemental materials). Prior to the start of the pandemic, sizable within-school inequities existed in fall 2019 achievement levels by race/ethnicity. During the 2020-2021 school year, Black and Hispanic students had lower average achievement gains than White and Asian students in the same school in almost all grades and subjects. Math achievement differences between White students and Black and Hispanic students increased, on average, within the same school building in the school year following the pandemic’s onset. Notably, the Black–White differences in math growth rates were approximately 2 to 3 times larger in 2020-2021 than during the prior school year. In reading, Black students gained less than White students in their same school in all grade levels, whereas Hispanic students showed similar or slightly higher gains than White students during the 2020-2021 school year. Across grades and subjects, Asian students showed either similar or slightly higher 2020-2021 growth than White students in the same school.

Racial/ethnic gaps in monthly growth estimates for 2020-2021 school year. Each reported estimate corresponds to the difference (in monthly Rasch Unit points) between the 2020-2021 learning rate for White students and Asian, Black, and Hispanic students, respectively. The vertical lines show the 95% confidence interval around each estimate.
Second, we considered whether 2020-2021 growth rates systematically differed for schools with varying student racial compositions (between-school inequality). During the 2020-2021 school year, students in schools with higher proportions of Black and Hispanic students and students from other races tended to have lower average score gains in both math and reading (see Table A7 in the supplemental materials). These results are consummate with the theory that both within-school and between-school factors contributed to widening racial inequality during the COVID-19 pandemic.
Research Question 3: Association Between Community Vulnerability and Learning Patterns
Finally, we examined whether student test score growth varied by whether students attended school in communities that were particularly vulnerable to the pandemic. Table A8 in the supplemental materials shows the parameter estimates from the COVID-19 pandemic, and Table A9 shows the parameter estimates for the cohort followed prior to the onset of the pandemic. Figure 5 shows the estimated overall monthly growth rates by PVI risk level prior to and during the COVID-19 pandemic. In 2018-2019, growth rates were similar or higher in communities that were deemed high risk during the pandemic relative to students in low-risk communities. However, in 2020-2021, students in high-risk communities demonstrated consistently lower growth rates than students in low-risk communities. Further, our results indicate that 2020-2021 growth rates among students in low-risk communities were parallel to typical (2018-2019) national growth rates in math but substantially lower than a typical year in reading (see Figure A1 in the supplemental materials).
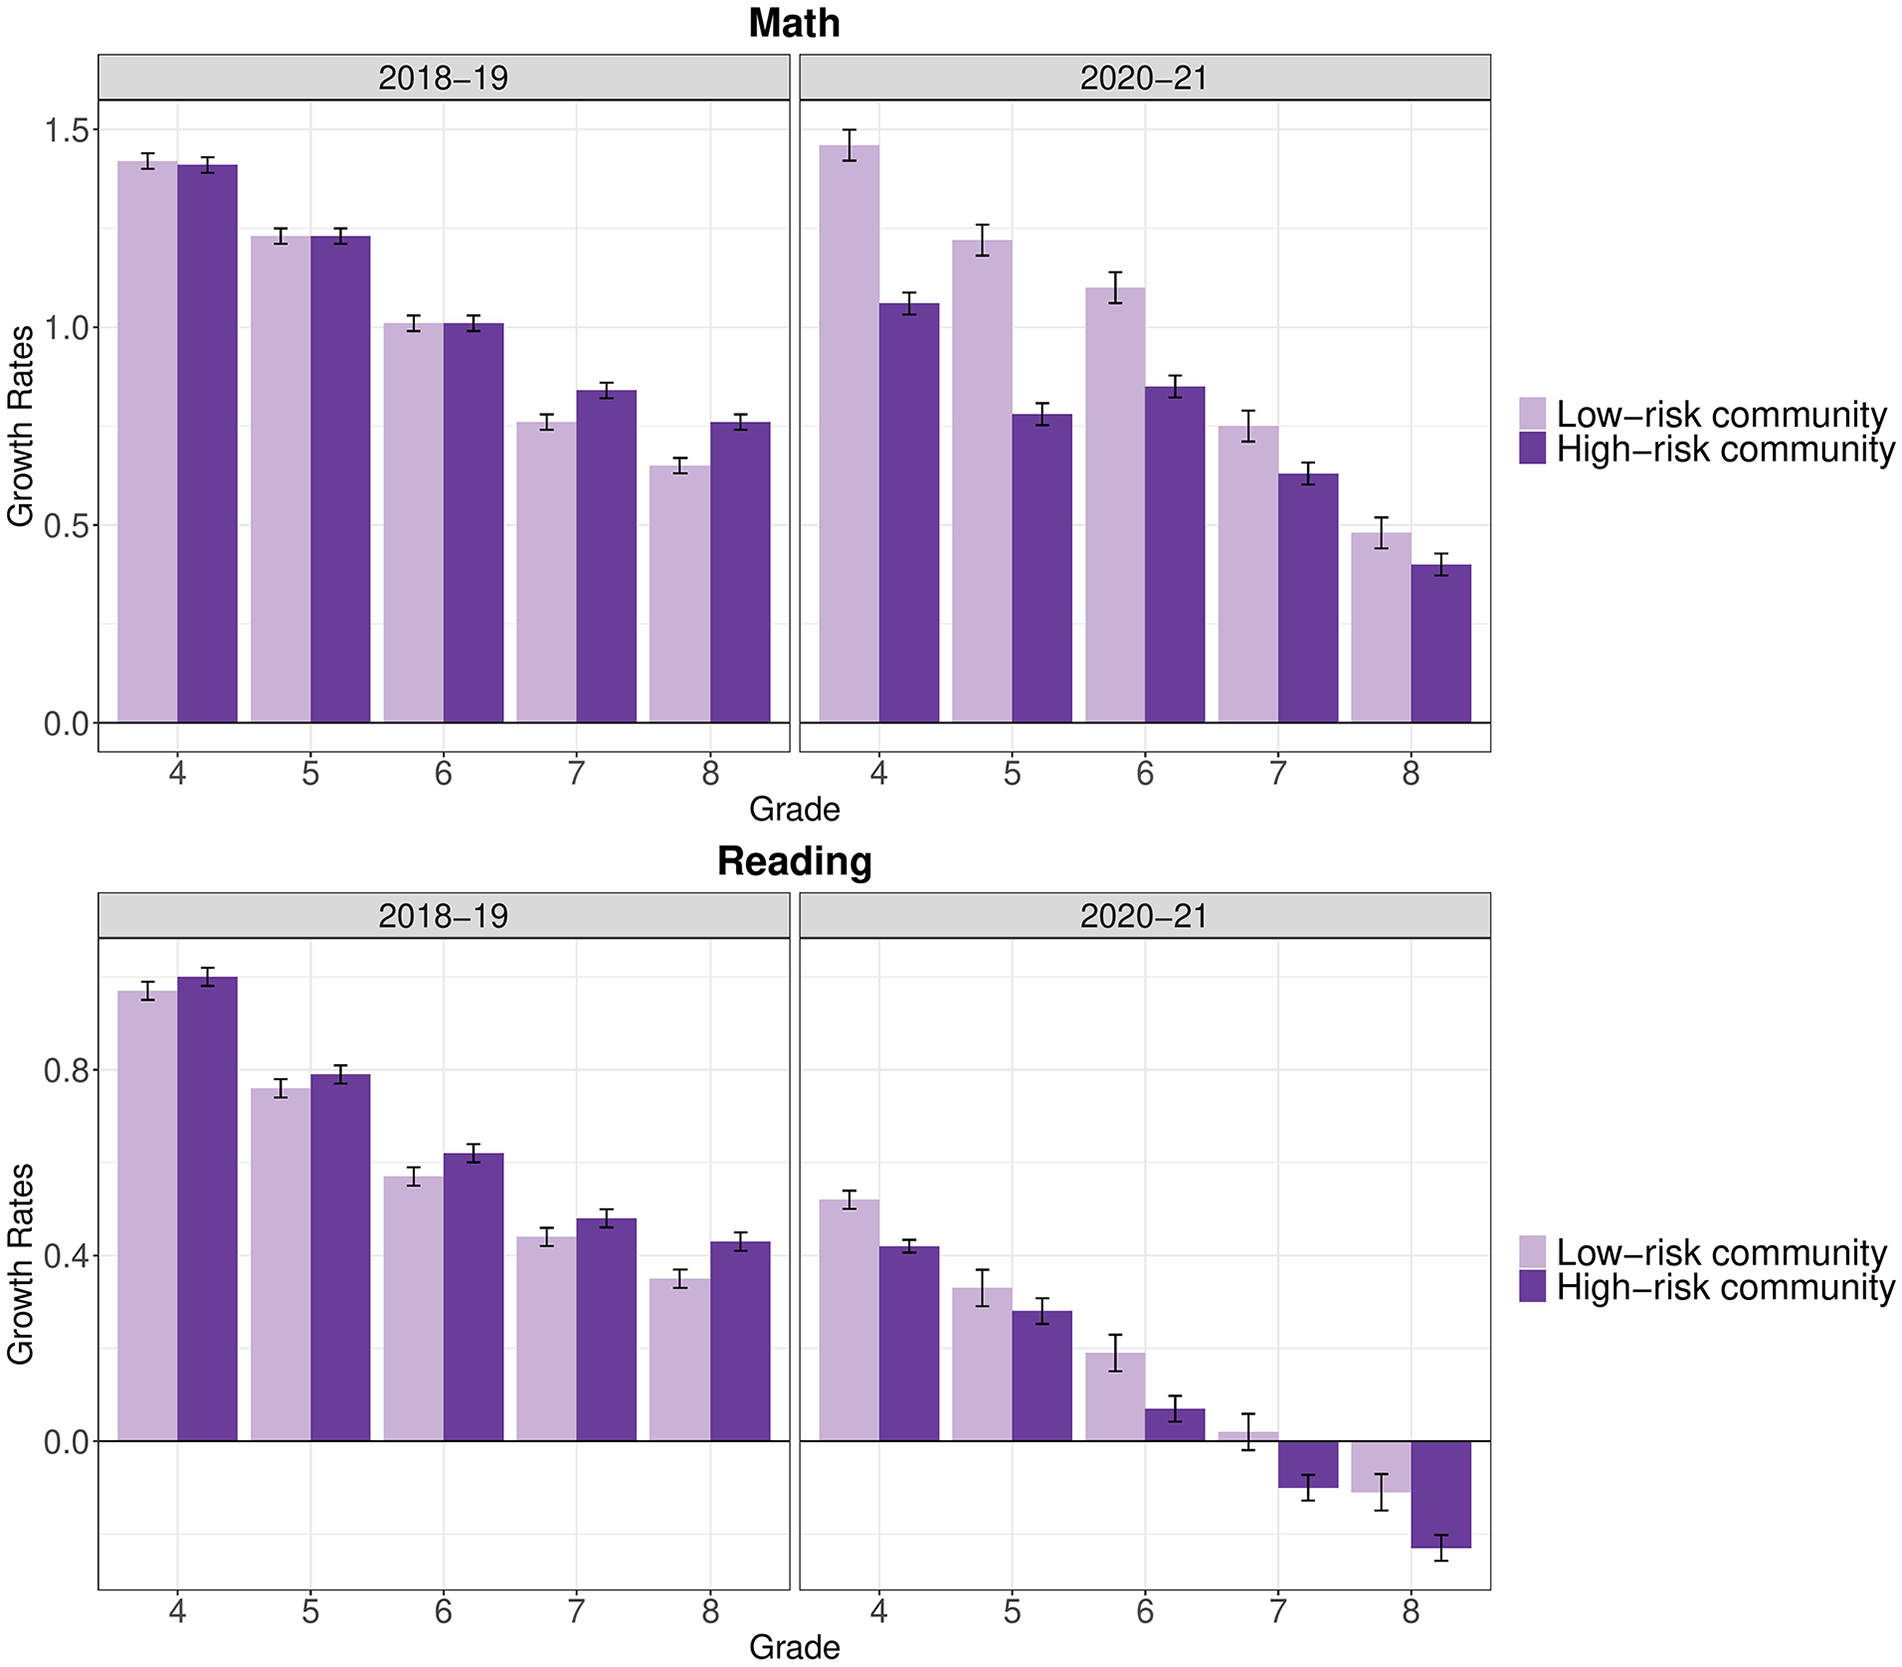
Monthly growth rates during the school year by pandemic risk factors and school year. Medium-risk growth rates were excluded for parsimony.
Discussion
Although a consensus has emerged that the COVID-19 pandemic has negatively impacted student achievement, fundamental gaps in our understanding of achievement during the COVID-19 era remain. For instance, there is uncertainty about how much students learned during the 2020-2021 school year, including how that learning compared with what might have occurred in a more typical school year. Most importantly, we still lack information vital to understanding how the pandemic has impacted students who have historically been marginalized in the United States. In this study, we bring evidence to bear on these gaps in our current understanding of how achievement patterns changed during COVID-19.
First, results show that students demonstrated positive gains in math and reading (on average) during the 2020-2021 school year; however, average growth for most grades and subjects lagged relative to prepandemic years. For example, in reading, growth during 2020-2021 was far lower than in a typical year, and a larger proportion of students showed net reading declines in 2020-2021 relative to a typical year. In math, students lost more ground immediately after school closures but then showed growth that more closely paralleled gains in prepandemic years. Even though reading gains in 2020-2021 appeared worse than math, our data indicated that students were still further behind in math by spring 2021 (0.16 to 0.26 standard deviations behind a typical spring in math relative to 0.06 to 0.11 standard deviations in reading). This is consistent with the findings of our review of 28 state assessment results, which indicated that achievement levels and growth in both subjects declined but that math achievement levels decreased most. Understanding mechanisms driving the divergence in observed trends for math and reading is not something our data allow us to pinpoint. Additional research to understand the mechanisms that lead to differences between math and reading during the 2020-2021 school year is critical.
Second, although these average trajectories describe the typical scenario for growth in 2020-2021, we also saw greater heterogeneity in student growth during the pandemic period, particularly in math. Thus, the typical trajectory does not capture the experience of all students. One potential explanation for this increased variability is that students who made the largest gains in math were the ones who began the pandemic with the highest achievement in math. Conversely, students who began the pandemic behind in math likely showed lower gains during the 2020-2021 school year. Thus, although trends during the 2020-2021 school year in math were comparable to those in prior years, we provide initial evidence that students who started the 2019-2020 school year struggling in math likely fell even further behind their peers during the 2020-2021 academic year. In short, some of the rebound in math during 2020-2021 likely occurred among students who were already doing relatively well in math. Such findings likely have important implications for teachers. For example, if students enter classrooms with a much wider range of content mastery, then teachers will need to differentiate instruction further, finding ways to support students who are even further behind than is typical while also meeting the needs of students who made more typical gains during the pandemic.
Third, we show that racial inequality in achievement widened at both the within-school and between-school levels during the COVID-19 pandemic. For students attending the same school, racial/ethnic inequality tended to widen even further during the 2020-2021 year, as evidenced by lower growth rates among most racial-minority students in comparison to White students. Specifically, school year growth rates were lower among Black students attending the same school than those of their White peers both prior to and during the pandemic. These results imply that unequal access to learning opportunities within the school year certainly predated COVID-19, though the pandemic likely exacerbated the gaps in learning opportunities. Additionally, schools with higher concentrations of Black and Hispanic students showed lower growth rates in the 2020-2021 year. Though not causal, these two analyses provide evidence in line with the theory that gaps are widening both because of differences related to where minority children go to school (between-school inequity) and because inequality is becoming more pronounced for students in identical school settings (within-school inequity). Widening between-school inequities could be indicative of unequal resources between schools that serve higher and lower concentrations of marginalized students. By contrast, growing within-school inequities could be indicative of factors outside school impacting students within the same school differentially or suggest that the instruction and supports within a given school are not having the same effect for, or are unequal between, minority versus nonminority students. Although our study cannot explicate such mechanisms, understanding them in future research is essential.
Fourth, and possibly as a way to better understand widening racial inequality given the association between race/ethnicity and income, we find that students living in communities with greater population density, poverty rates, and COVID-19 infection rates demonstrated lower growth than students living in less impacted locations. Contracting COVID-19 (either the student or a caregiver), losing loved ones to the virus, having a caregiver affected by job loss, and possibly intensified psychological effects of the pandemic in such communities could all understandably be associated with how effectively students can learn and teachers can teach. These findings may also suggest that vulnerability to public health threats also corresponded to slower academic progress in the schools within those communities.
As previously discussed, our findings provide data on how fast students might rebound after an initial shock to the education system and how long we might expect recovery from a major learning disruption to take. Although students did often make gains postpandemic, in total, our findings indicate that recovery is likely to be a very slow process without further intervention. Further, the process will probably be even more challenging for the nation’s most vulnerable students, including those behind academically, students who are racially or ethnically marginalized, and those living in communities more affected by COVID-19, including those living in poverty. Although there is no clear consensus on how best to address these worrying trends in educational equity and opportunity, there is an argument that policymakers will need to consider how best to simultaneously address the health, economic, and educational disparities likely created or exacerbated by COVID-19 and do so in a coordinated manner.
One should also be careful not to necessarily take our adverse findings as reflections of teacher quality or effort. Teacher and principal surveys demonstrate the incredible efforts of educators to adapt their lessons to an online platform as well as the challenges related to these rapid changes in instructional models and health risks associated with in-person instruction (Hamilton et al., 2020). Indeed, our hope is that evidence from our study can provide educators with useful data to support recovery. For instance, the magnitude of overall losses (0.16 to 0.26 standard deviations behind in math, 0.06 to 0.11 standard deviations in reading) are smaller than effect sizes for gains associated with effective one-on-one (or small-group) tutoring programs. A recent meta-analysis found that the overall pooled effect size for tutoring programs was 0.37 standard deviations, with stronger effects for teacher and paraprofessional tutoring programs than for nonprofessional and parent tutoring (Nickow et al., 2020). It will be essential to continue monitoring district responses and spending under the Elementary and Secondary School Emergency Relief Fund to see whether high-quality programs (such as tutoring services and additional instructional time) are being implemented and effectively serving the students most in need.
Limitations
Although this study addressed several critical gaps in the literature on student achievement during the COVID-19 pandemic, our data do not allow us to address all the existing gaps. First, this study provided descriptive comparisons and was not intended for estimating the causal impact of the pandemic or related social and educational changes. Given the descriptive nature of the study, one of its biggest limitations is that we cannot illuminate mechanisms driving these results. Achievement may have suffered due to the pandemic itself (e.g., children losing loved ones), due to pandemic-related mitigation efforts (e.g., children missing school because of mandatory quarantines), through other channels (e.g., less learning on days students did attend), or most plausibly, due to multiple causes that cannot easily be disentangled. For example, a recent study that examined instruction mode and student engagement during the pandemic found that students who were assigned a higher proportion of virtual instruction had higher attendance but lower achievement than students assigned a high proportion of face-to-face instruction, and these associations were even stronger for Black students and students who receive free or reduced-price meals (Darling-Aduana et al., 2022). This suggests that the relationship between school attendance and achievement, and how that relationship is moderated by marginalized group status, is complicated. Understanding which mechanisms are more or less important will be pivotal to addressing the adverse effects of COVID-19 going forward. Although we would ideally examine such mechanisms in this study, we are not in a position to do so. For instance, although covariates to related various factors could be included in models, there is no way to ensure that covariates measuring in-school factors are not strongly correlated with out-of-school factors that are actually the causal mechanism (and vice versa). Unfortunately, as others have pointed out, even beyond our study, identifying causal mechanisms related to the pandemic is incredibly difficult (Bacher-Hicks & Goodman, 2021).
Second, this study focused on math and reading in Grades 3 through 8 but cannot address K-2 or high school academic achievement due to limited available data in those grades. Third, we cannot tie our results to students’ mental or socioemotional health during the pandemic. Findings from nationally representative student surveys indicate that over 60% of students worried that the pandemic would have long-term negative impacts on their education and career (Morning Consult, n.d.), and 46% of students felt depressed, stressed, or anxious (YouthTruth, 2021).
Finally, our analysis does not address the achievement and growth of students whose assessment data were missing in 2019-2020 and/or 2020-2021, including students who were absent from testing and students who were not enrolled in school. Findings from fall 2020 indicate that students of color and students attending high-poverty schools were more likely to be missing assessment data (Johnson & Kuhfeld, 2020). Approximately one third of students in our sample tested only during the 2019-2020 school year, and these students were lower achieving on average compared with students who tested in both school years (see Appendix B in the supplemental materials for a description of the missing data patterns in our sample). Because we cannot rule out the possibility that students with lower test scores prior to the pandemic dropped out of the sample because they were lower achieving, it is worth considering the potential direction of bias from these missing data. Given that we observe lower-achieving students were missing at higher rates and our results indicate that students who were lower achieving in math prior to COVID-19 grew at slower rates during the 2020-2021 school year, we would speculate that our overall estimates of growth in math are likely to be upwardly biased relative to truth. However, we did not see a similar association between initial achievement and later growth in reading, which makes it challenging to speculate the potential direction of bias for our reading results.
Conclusion
Despite growing consensus that COVID-19 has negatively impacted student achievement, little is known about how much academic growth occurred during 2020-2021, the first full school year following the pandemic’s onset. In this study, we show that not only were growth rates often lower in 2020-2021 relative to a typical school year—many more students demonstrated declines in reading during the school year than normal—but growth was also much more variable. Thus, going forward, teachers will likely have to find ways to support students who were disproportionately impacted by the pandemic while simultaneously educating students who did not show slower growth. Further, the students who did show the greatest growth in math tended to be higher achieving before the pandemic, indicating an even greater dispersion of the math skills students will bring to the classroom for the foreseeable future. Growth was also unequal across student racial/ethnic groups and linked to how vulnerable communities were to the pandemic. Therefore, long-standing sources of educational inequality in the United States have almost certainly been exacerbated during the pandemic.
Supplemental Material
sj-docx-1-ero-10.1177_23328584221099306 – Supplemental material for The COVID-19 School Year: Learning and Recovery Across 2020-2021
Supplemental material, sj-docx-1-ero-10.1177_23328584221099306 for The COVID-19 School Year: Learning and Recovery Across 2020-2021 by Megan Kuhfeld, James Soland, Karyn Lewis, Erik Ruzek and Angela Johnson in AERA Open
Footnotes
Notes
Authors
MEGAN KUHFELD is a senior research scientist at NWEA, 121 NW Everett Street, Portland, OR 97209;
JAMES SOLAND is an assistant professor of quantitative methods at Curry School of Education and Human Development at the University of Virginia, Emmet Street South, P.O. Box 400260, Charlottesville, VA 2290;
KARYN LEWIS is a senior research scientist at NWEA, 121 NW Everett Street, Portland, OR 97209;
ERIK RUZEK is a senior research scientist at NWEA, 121 NW Everett Street, Portland, OR 97209;
ANGELA JOHNSON is a research scientist at NWEA, 121 NW Everett Street, Portland, OR 97209;
References
Supplementary Material
Please find the following supplemental material available below.
For Open Access articles published under a Creative Commons License, all supplemental material carries the same license as the article it is associated with.
For non-Open Access articles published, all supplemental material carries a non-exclusive license, and permission requests for re-use of supplemental material or any part of supplemental material shall be sent directly to the copyright owner as specified in the copyright notice associated with the article.