
Abstract
States provide substantial support for higher education through appropriations to public colleges and universities that can be used to maintain relatively low tuition levels and funds for financial aid. Higher education often receives disproportionate cuts during recessionary periods, and it faces potentially unprecedented reductions in coming years amid a pandemic that has left some states with revenue shortfalls. How states approach higher education cuts has the potential to exacerbate existing inequities among racially minoritized and low-income students and historically underfunded institution types. In this study, we document trends in higher education funding over time and use latent profile analysis to identify distinct approaches states have taken to higher education funding. We then examine the trajectories of higher education funding within each approach over time, particularly during prior recessions. We conclude by discussing the implications of each approach for equity, particularly in light of states’ early responses to the current economic downturn.
In 2019, states spent $92 billion in funding for higher education (Laderman & Weeden, 2020). Most state funds are provided as appropriations to public higher education institutions to subsidize instructional costs and help maintain relatively low tuition levels. A smaller share of state funds is provided to students in the form of financial aid based on need and/or merit to reduce the price of college. Research indicates state funding for public institutions and financial aid can support college access and degree completion (Anderson & Zaber, 2021; Bettinger et al., 2019; Cummings et al., 2021; Deming & Walters, 2017; Dynarski, 2004, 2008; Titus, 2006; Toutkoushian & Hillman, 2012).
The economic shock associated with the pandemic is likely to impact state funding for higher education in unprecedented ways. Early in the pandemic, several states made midyear budget cuts to their public higher education systems that were not restored (Open Campus, 2020). State general fund revenue was 2.8% below prepandemic projections for 2020 and 2021, with 40 states seeing revenue falling below initial expectations (National Association of State Budget Officers, 2021). While the federal government has passed stimulus packages in response to the economic crisis, higher education funds will not offset losses (Douglas-Gabriel, 2020; National Center for Higher Education Management Systems, 2020; State Higher Education Executive Officers Association [SHEEO], 2020b).
The full impact of the COVID-19 economic shock is still unknown, but researchers can examine how states have responded to prior recessions for important lessons. Prior research has shown that legislatures often use higher education as a balance wheel for state budgets during economic downturns, cutting funds for public colleges and universities disproportionately to protect funds for K–12 education, health care, and other services (Delaney & Doyle, 2011, 2018). During prior recessions, changes in state funding for financial aid varied. For example, growth in funding for aid slowed in some states, resulting in those states having to make difficult decisions with constrained resources (Bettinger & Williams, 2013).
A major concern surrounding the pandemic is that states will cut higher education funding in ways that exacerbate inequities among underrepresented students (e.g., racially minoritized and low-income students) and historically underfunded institution types, such as community colleges and minority-serving institutions (MSIs), that serve the greatest share of underrepresented students and are more reliant on state funding for revenue (Cunningham et al., 2014; Harris, 2021; Kelchen et al., 2020). 1 For instance, states may reduce funding for both the 4-year and 2-year sectors, but these cuts will be particularly acute for community colleges, MSIs, and other institution types with fewer financial resources and greater reliance on state funding. Additionally, if states reduce funding for financial aid or shift funds toward merit aid in ways that disproportionately benefit middle- and upper-class students (Dynarski, 2004; Heller & Marin, 2002), marginalized students may have less access to aid.
While existing research offers insight into higher education funding trends, we know less about how recessionary cuts vary across sectors (4-year vs. 2-year) and financial aid programs (need- vs. merit-based aid), which has important implications for the institutions and students to whom funds are allocated. In addition, state higher education funding decisions intersect with tuition policy. Debates over higher education funding have coalesced into two distinct approaches: one focused on broadly subsidizing public colleges and universities to maintain low tuition and the other focused on targeting public funds through a combination of high tuition and aid directed to students with financial need (Hearn & Longanecker, 1985; Toutkoushian & Shafiq, 2010). An examination of state approaches to higher education funding through their level of appropriations to public institutions and these institutions’ reliance on state funds for revenue, tuition levels and institutions’ reliance on tuition revenue, and funding for financial aid would provide a more comprehensive picture of state higher education funding. Yet these factors have rarely been examined side by side.
This article draws on historical data from the last two decades to document higher education funding, particularly during prior recessions (2001, 2007–2009; National Bureau of Economic Research [NBER], 2020). Through descriptive analyses, we first document national trends in higher education funding. We then use latent profile analysis to create groupings of states with similar higher education funding approaches and examine how these approaches have evolved over time. To do this, we (a) document, describe, and categorize profiles of states based on their approaches to higher education funding and (b) explore changes in the trajectory of state higher education funding approaches over time, particularly during recessions when budgetary constraints may push states to alter their approach.
Findings indicate that although state funding for public colleges and universities and financial aid has increased over time, institutions’ per-student funding levels and reliance on state funding have declined while tuition and reliance on tuition revenue have increased (particularly in the 4-year sector). However, these national trends mask distinct state approaches to higher education funding. Latent profile analysis documents three distinct state approaches to higher education funding that entail different commitments to higher education funding over time. Findings from one profile highlight a relatively stable retreat from higher education funding in a small number of states. States in the other two profiles indicate a lesser degree of declining commitments to public higher education following recessions, with the second profile indicating moderate subsidies and tuition and the third profile indicating broad subsidies and lower tuition.
We conclude by discussing implications of various state approaches for college access and student success, particularly among racially minoritized and low-income students and historically underfunded institution types. In doing so, this article leverages national data to offer insight into states’ approaches to higher education funding during recessions and how institutions and students are likely to be helped or harmed as state policymakers respond to the COVID-19 economic downturn.
Related Literature
States typically fund higher education to improve the state’s economic health and improve its attractiveness to employers and prospective residents, and much of what public higher education looks like today is due to developments and decisions dating back to the late 19th and early 20th centuries (Goldin & Katz, 1999). Each component of the public higher education system, from flagship research universities to regional comprehensive universities to community and technical colleges, serves the mission of economic development in its own way (Beach, 2012; Fryar, 2014; Liu, 2015). States also provide direct subsidies to students in the form of financial aid to help students with financial need, keep high-achieving students in the state (Winters, 2020), and allow student choice across various public and private institutions (Laderman, 2019). This section discusses literature on state funding for public institutions and financial aid, focusing on the effects on student outcomes and implications for equity.
State Funding for Public Colleges and Universities
Prior research has shown a relationship between increased state appropriations to colleges and universities and improved student outcomes. Bound et al. (2019) and Deming and Walters (2017) found that increased funding to public universities was associated with increased college completion rates. Chakrabarti et al. (2020) did not find a link between appropriations to universities and completion rates but showed that increased funding was associated with reduced time to degree and lower student debt burdens. In the 2-year sector, additional funding had links to increased educational attainment, higher rates of homeownership, and lower delinquency and default rates (Chakrabarti et al., 2020).
A key moderating variable in state funding is whether public higher education institutions absorb budget cuts through reducing expenditures or pass cuts on to students through higher tuition. Webber (2017) showed the pass-through rate to students has risen to nearly one-third since 2000, meaning colleges still bear most state funding cuts. Since educational expenditures, particularly on student services and at less selective universities or community colleges, are associated with higher completion rates (Chakrabarti et al., 2020; Deming & Walters, 2017; Webber & Ehrenberg, 2010), state funding cuts risk reducing completion rates. Additionally, because instructional expenses are associated with improved labor market outcomes (Griffith & Rask, 2016), the effects of reducing services can affect students’ lifetime trajectories.
Many colleges have traditionally relied on tuition increases to replace lost state appropriations, with some increasing out-of-state and international enrollment as a way to boost tuition revenue, but this is becoming difficult for all but the most selective public research universities. A growing number of states place limits on how much colleges can increase in-state tuition (Kelchen & Pingel, 2018). If public universities are able and willing to increase in-state tuition, research shows that racially minoritized and low-income students are more sensitive to price increases than other students (Allen & Wolniak, 2019; Flores & Shepherd, 2014). Even for the small segment of public universities that can recruit more out-of-state and international students who pay full price (Bound et al., 2020; Jaquette & Curs, 2015), these efforts come at the expense of access among underrepresented in-state students (Jaquette et al., 2016). With a drop in new international student enrollment last year (Baer & Martel, 2020), the long-term feasibility of relying on these students for tuition revenue is unclear.
There are long-standing funding disparities within and across public higher education sectors. Four-year universities receive more state funding per student than community colleges (Laderman & Tandberg, 2021), which can be attributed to several factors. One factor is that local governments provide a portion of community college funding in just over half of states (Dowd et al., 2020). Another factor is that upper-division courses tend to cost more to offer than lower-division courses (Hemelt et al., 2021). In addition, state funding formulas often prioritize full-time equivalent (FTE) students over head-count enrollment, which disadvantages community colleges that enroll more part-time students (Romano & D’Amico, 2021). As a result of these factors, community colleges saw state funding decline by 2% in 2021, while public universities saw a 0.4% increase (Laderman & Tandberg, 2021).
There are also disparities between predominantly White institutions and MSIs in the same state. Historically Black colleges and universities have been underfunded by state governments, resulting in funding equity lawsuits and rulings that have yet to be fully satisfied by the state (Palmer et al., 2011; Sum et al., 2004). Research has also found that state funding for public higher education declines when the share of White students declines and Republicans control legislatures (Foster & Fowles, 2018; Taylor et al., 2020). Funding disparities raise concerns about the ability of nonflagship institutions to garner resources to support their students.
State Funding for Financial Aid
State aid programs primarily disburse funds based on students’ financial need (ability to pay for college) or merit (academic achievement; Custer & Akaeze, 2021; Ness & Noland, 2007). Because merit aid programs often ignore structural barriers for certain students to meet academic thresholds, scholars and policymakers often describe merit aid as non-need-based aid. In recent years, non-need-based aid has been the primary driver of increases in state aid (Ma et al., 2020). States’ disbursement of aid can vary widely. The share of aid expenditures out of total higher education expenditures across states ranges from less than 1% (Montana) to over 30% (South Carolina; Ma et al., 2020). States also vary in how they allocate aid, such as the use of priority deadlines (e.g., allocating aid based on whether students were among the first to apply, commonly referred to as first come, first served) and whether state aid contributes before or after other aid (e.g., last-dollar programs in which states apply aid only after federal funds have been applied; Custer & Akaeze, 2021).
Several state characteristics play a role in who is eligible for state aid and the amount of money available, including enrollment levels at public and private institutions, resident wealth, and political dynamics (Doyle, 2012; McLendon et al., 2014). McLendon and colleagues (2014) found that states often reduce need-based aid as the amount of merit-based aid increases. Bell and colleagues (2020) found similar trade-offs when states adopted lottery earmark policies for higher education funding. As the federal government has shifted its approach to allocating financial aid during economic downturns, such as by expanding the Pell Grant during the Great Recession, several states have reduced their commitments to aid (Bettinger & Williams, 2013).
States’ decisions about how to distribute aid impact college access and student success. Across institution types, studies have found a positive relationship between state aid and college enrollment (Dynarski & Scott-Clayton, 2013; Kim, 2011; Ngo & Astudillo, 2019; Page & Scott-Clayton, 2016; Perna & Titus, 2004) and persistence and graduation (Anderson, 2020; Angrist et al., 2020; Mendoza et al., 2009; Nguyen et al., 2019). In a meta-analysis of causal research, Nguyen and colleagues (2019) found that grant aid, regardless of source, increases the likelihood of college persistence and graduation. However, they found that need-based aid may have stronger effects than merit-based aid, suggesting the types of aid states prioritize can mediate the relationship between state aid and student success. These considerations, coupled with states’ decisions about how to fund public institutions that have implications for tuition levels, make it critical to holistically consider states’ commitments to higher education.
Prior studies have classified states based on appropriation strategies (Mullin & Honeyman, 2007; SRI International, 2012) or public institutions based on revenue profiles (Barringer, 2016). There have also been typologies of state aid programs (Custer & Akaeze, 2021) and broad-based merit aid (Delaney & Ness, 2009), free college (Perna & Leigh, 2018; Rosinger, Meyer, & Wang, 2021), and college access (Perna et al., 2008) programs. In addition, Toutkoushian and Shafiq (2010) classified states based on grant aid and state appropriations in 2006. However, we are not aware of a typology that offers a more comprehensive approach to higher education funding by considering state subsidization of public colleges, tuition levels, and financial aid or how these categorizations move over time, especially during recessions.
Data and Methods
Data
We drew on several publicly available data sets to examine state higher education funding approaches from Fiscal Years 2001 to 2018. The selected variables provide measures of the extent to which states subsidize higher education through appropriations to public colleges and universities to maintain relatively low tuition and/or through funding for aid targeted to students with financial need (Hearn & Longanecker, 1985; Toutkoushian & Shafiq, 2010). Data on state funding for public colleges and universities came from the National Center for Education Statistics Integrated Postsecondary Education Data System (IPEDS), which annually collects institution-level enrollment and finance data.
From these data, we calculated per-FTE state funding (dividing state funding by FTE) and the percentage of institutional revenue from state funding (dividing state funding by total revenue and multiplying by 100) for each institution with reported data in a given year. Tuition also came from IPEDS: We created a tuition variable equal to in-state tuition and fees for public 4-year universities and in-district tuition and fees for public 2-year colleges (if in-district values were not available, we used in-state values) and calculated the percentage of institutional revenue from tuition (dividing tuition revenue by total revenue and multiplying by 100).
We excluded tribal colleges because they are subject to a different funding structure (Nelson & Frye, 2016). We also excluded 7.5% of total institution-year observations due to missing data and 0.9% of institution-year observations due to implausible values (defined as more than twice the 99th percentile value for per-FTE figures and as >100% for share of revenue figures). Finally, some IPEDS data are aggregated across colleges within a system through parent-child relationships (Jaquette & Parra, 2014; Kelchen, 2019). We excluded 2.2% of total institution-year observations due to parent-child reporting. To create a longitudinal state-level data set from institution-level IPEDS data, we created enrollment-weighted means for variables for each state and year (weighting institution-year observations with larger FTE enrollment more than institution-year observations with smaller FTE enrollment) using _gwtmean in Stata (Kantor, 2001).
State-level financial aid data came from SHEEO’s (2020a) State Higher Education Finance (SHEF) data, which come from a survey of member agencies, and the National Association of State Student Grant and Aid Programs (NASSGAP) annual survey, which collects data from state higher education policy actors on the amount of funds states allocate to need- versus non-need-based aid (frequently considered merit aid and referred to as such in this article). SHEF reports state spending on aid and net FTE enrollment (FTE enrollment minus noncredit, nondegree, and medical school enrollment). State-level financial aid variables were per-FTE spending on aid (total spending on aid divided by net FTE enrollment, available through SHEF) and the share of aid funds directed toward need-based aid (need-based aid spending divided by total aid spending and multiplied by 100, available through NASSGAP). 2 We merged the state-level IPEDS data set to NASSGAP and SHEF data to create a nearly two-decade panel data set of state-year observations. 3 We adjusted financial figures to 2019 dollars using the Consumer Price Index.
There are several data limitations. IPEDS data include revenue for non-credit-bearing courses, such as continuing education, that are not included in FTE numbers. Because community colleges disproportionately have noncredit enrollments (Romano et al., 2019), using FTE overstates the resources available to community colleges. However, because nearly 90% of systems with enrollment-based funding models rely on FTE instead of head count to allocate funds (authors’ calculations based on analyses of state policy documents), FTE-based measures are appropriate. We also noticed instances where NASSGAP reporting for spending on aid changed dramatically within states over time. Some of the issues could be explained by states starting or ending aid programs, but other issues were less clear. Ultimately, we relied on SHEF data to calculate per-FTE spending on aid because of concerns with data reporting in NASSGAP. However, no other data source contains information on how states allocated aid based on need versus merit over time, leading us to rely on NASSGAP data for this variable. Despite limitations, these data sources reflect the most comprehensive publicly available longitudinal data on state higher education funding.
Analytic Method
Our first research aim seeks to document higher education funding trends. To do this, we report national totals and averages for state-level funding variables from 2001 to 2018. This period included a shallow recession from March through November 2001 (Fiscal Years 2001 and 2002) and the Great Recession from December 2007 through June 2009 (Fiscal Years 2008 and 2009; NBER, 2020). We pay particular attention to years during and following recessions when state policymakers faced tough decisions about allocating funds.
Our second research aim focuses on documenting, describing, and categorizing profiles of states based on their higher education funding approach. To identify distinct approaches, we used latent profile analysis (LPA), a latent variable model that identifies latent, or unobservable, groupings of units (e.g., states) with a distinct pattern of observed variables (Collins & Lanza, 2010). In LPA, the observed variables (per-FTE state funding, reliance on state funding, tuition, reliance on tuition revenue, per-FTE spending on aid, and share of need-based aid) are measures of the underlying latent construct (state higher education funding approaches; Collins & Lanza, 2010). Resulting latent profiles reflect distinct patterns across states in higher education funding. LPA is a type of structural equation model where the equation can be expressed (Peugh & Fan, 2013):

where yi denotes funding variables, K signifies the number of state funding approach profiles, and π k represents the probability of a particular state belonging to latent profile k. Conditional on model parameter estimates (f [yi | θ]), the distribution of variables used to construct the latent profiles (yi) is expected to have a combination of profile-specific divisions (f [yi | θ k ]).
We estimated our LPA with 2001 data 4 and the following 10 variables: per-FTE state funding by sector (2- and 4-year, identified by 2018 Carnegie classification and logged), reliance on state funding by sector, tuition by sector (logged), reliance on tuition revenue by sector, per-FTE spending on aid (logged), and share of need-based aid.
We estimated the LPA using Stata 16’s gsem command along with a series of postestimation commands, following procedures outlined in MacDonald (2018) and Statacorp (2019). The gsem command uses equation-wise deletion for missing data (Statacorp, 2019), using all available data to estimate the model. For Alaska and Kentucky, which were missing data on the 2-year sector, we used available data to estimate our LPA, and these states were assigned to latent profiles based on patterns of variables with available data.
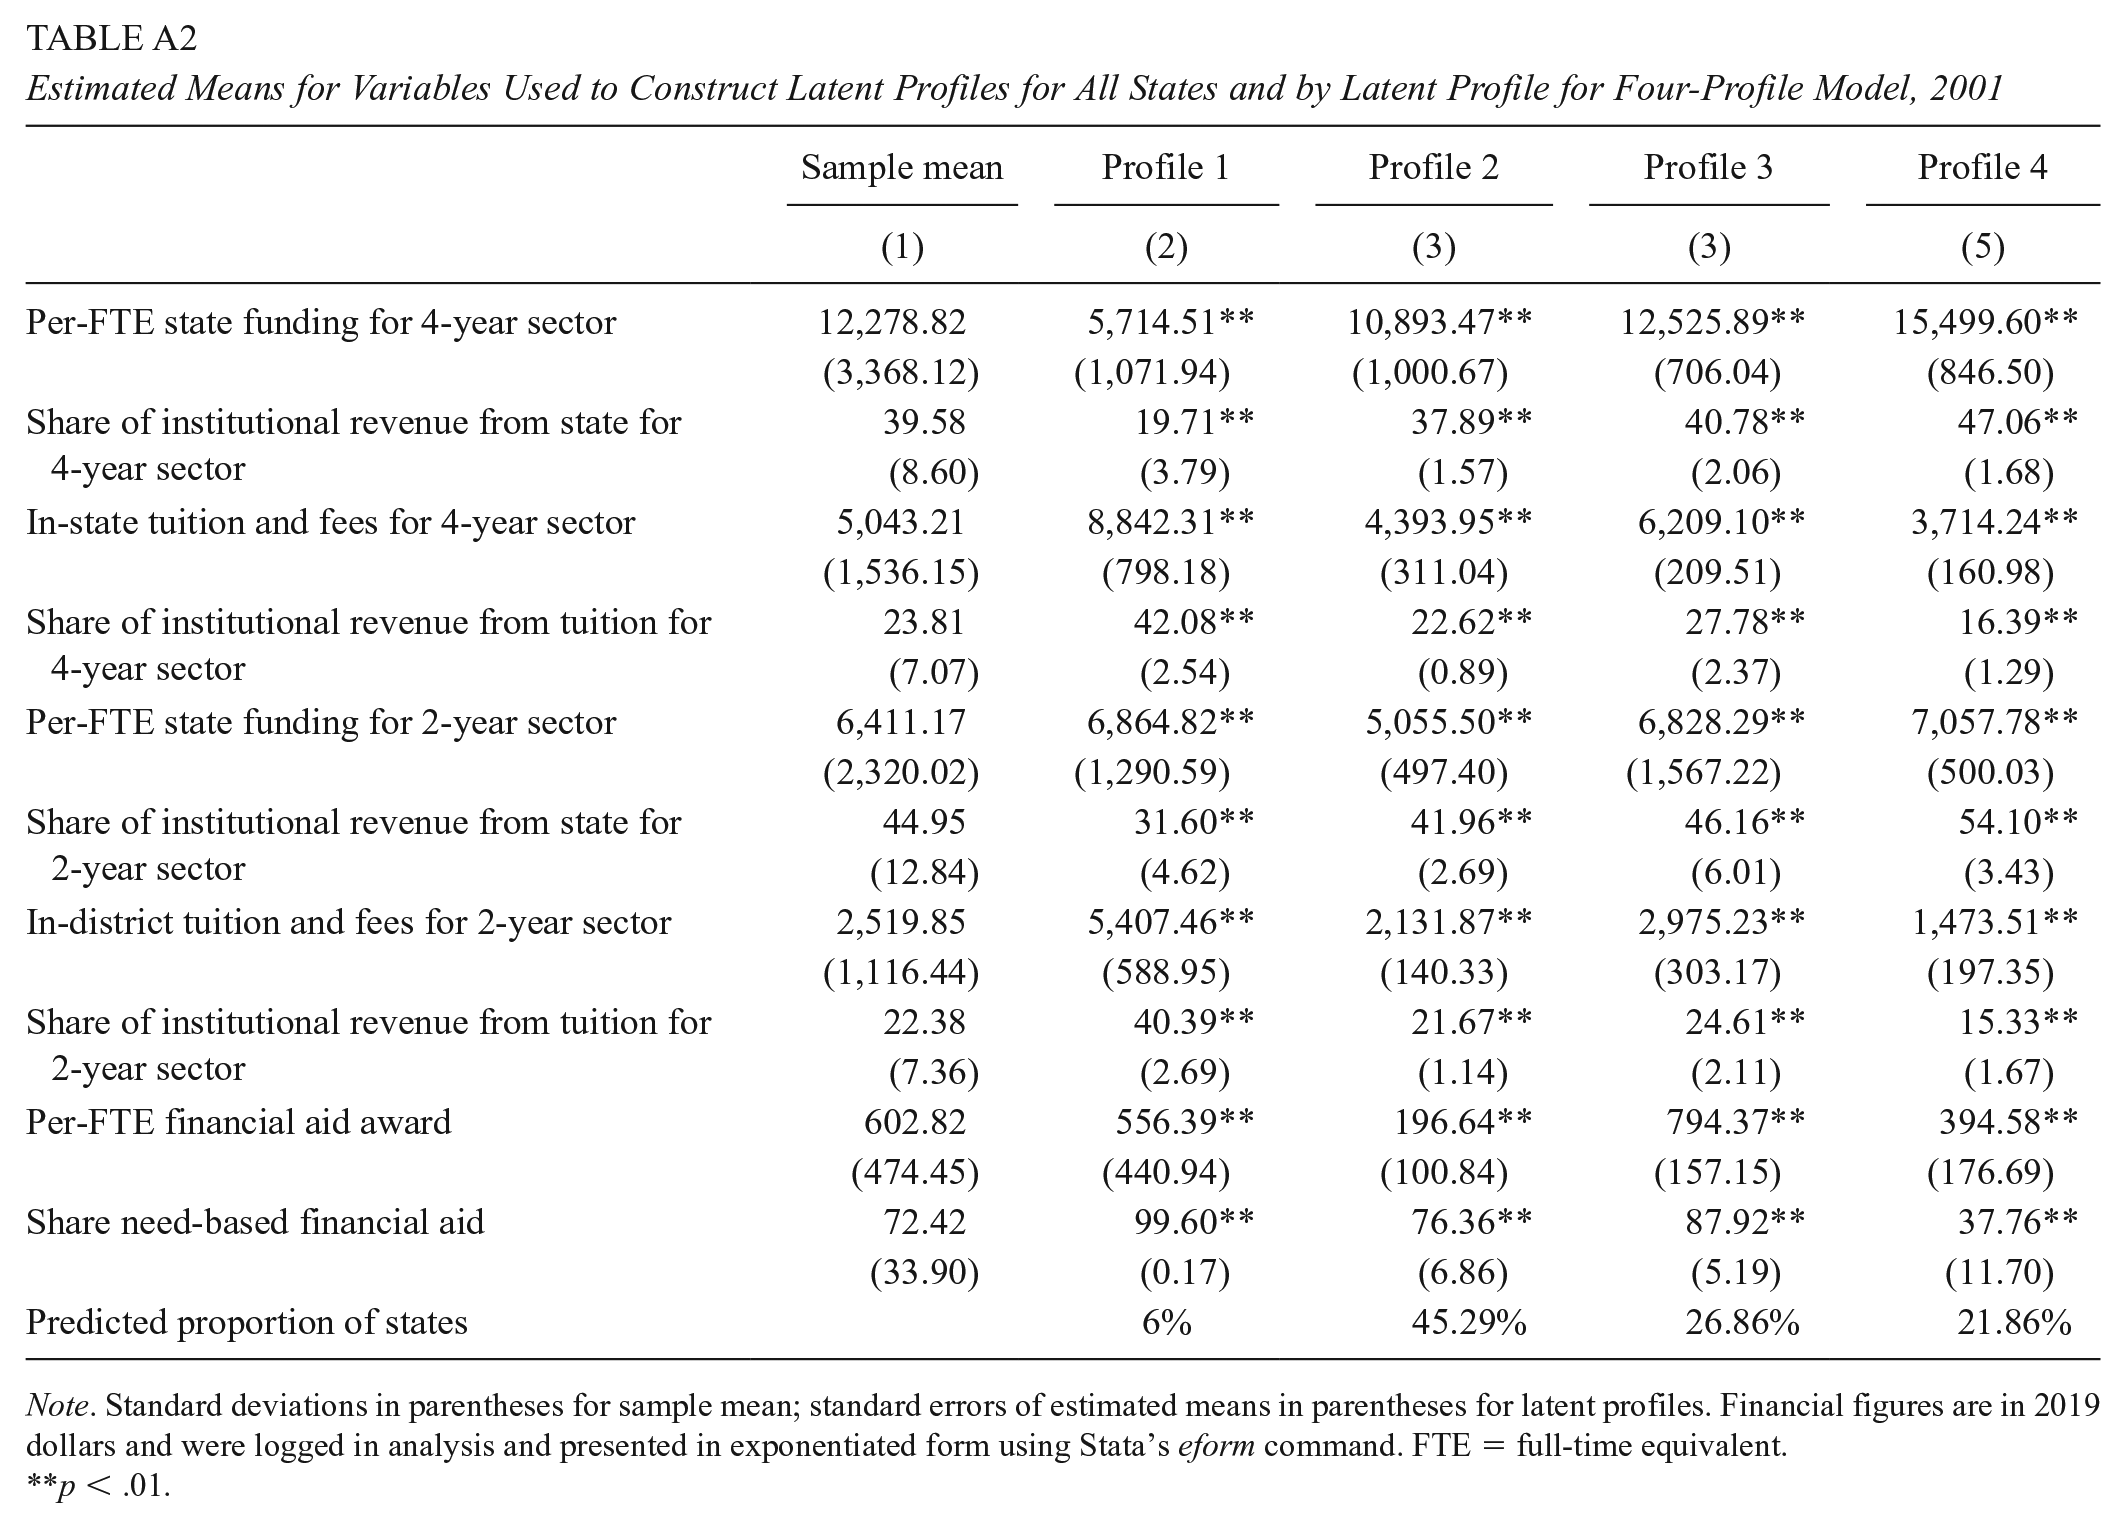
We began by estimating LPAs with two, three, four, five, and six profiles (Oberski, 2016). We then compared two model fit statistics, Akaike information criterion (AIC) and Bayesian information criterion (BIC) values, across models (see Appendix Table A1). In general, lower AIC and BIC values indicate a better fitting model. Given the small number of units used to create latent profiles (50 states), we used AIC and BIC values in model selection in addition to examining whether additional profiles offered new insight into higher education funding approaches. We present results from the three-profile model because there was a large reduction in AIC and BIC values between the two- and three-profile models (with a much smaller reduction for the four-, five-, and six-profile models), whereas the four-profile model offered fewer distinctions across profiles (i.e., there were fewer statistically significant differences in means across profiles). As a result, we present the more parsimonious three-profile model but provide results from the four-profile model in Appendix Table A2.
To explore changes in the trajectory of funding approaches over time, our third research aim, we assigned states to a latent profile based on their highest probability of belonging to a profile (McDonald, 2018; Vermunt & Magidson, 2003). For example, Utah had 0 probability of belonging to the first profile, a .02 probability of belonging to the second profile, and a .98 probability of belonging to the third profile, so we assigned it to the third profile. We then examined how funding variable means changed over time within each profile.
Findings
National Trends in Higher Education Funding
We first examined national higher education funding trends from 2001 to 2018 (Appendix Figure A1). While total state funding for public colleges and universities in 2018 surpassed 2001 funding levels by around $8.2 billion in 2019 dollars, the Great Recession wreaked havoc on state funding. Our analysis indicates total state funding for public higher education institutions rose slowly from 2001 to 2008, increasing from around $79.8 billion to nearly $88.5 billion. Following the Great Recession, total state funding dropped below 2001 levels. Funding then rebounded to peak prerecession levels a decade later, with states directing around $88 billion to public colleges and universities in 2018. Meanwhile, total tuition revenue at public colleges and universities nearly doubled, rising from $36.8 billion in 2003, after a brief decline at the start of the period, to $72.9 billion in 2018. Total state spending on aid steadily increased, rising from $6.3 billion in 2001 to $10.9 billion in 2018.
Figure 1 shows trends by sector with recessionary periods in gray. As the first panel shows, per-FTE state funding was highest in the 4-year sector, with an average of around $12,300 at its peak in 2001 and $9,500 at its lowest in 2012. In 2018, per-FTE state funding remained below early 2000s levels at around $10,200. In the 2-year sector, per-FTE state funding was around $6,400 in 2001, the highest level over the period. Per-FTE funding for the sector dropped to an average of around $4,300 in 2011 and 2012 before increasing to just under $6,000 in 2018.

Trends in state higher education funding, 2001–2018.
Reliance on state funding as a share of revenue declined in both sectors, with the sharpest drops following recessions, particularly the Great Recession (second panel, Figure 1). In the 4-year sector, reliance on state funding fell from 38.5% in 2001 to 28% in 2018. In the 2-year sector, reliance on state funding fell from 44.9% to 37.9%. While the 2-year sector saw a smaller overall change in reliance on state funding, this figure masks a dramatic decline followed by a steady increase after the Great Recession.
The third panel of Figure 1 shows average tuition and fees by sector. Average tuition nearly doubled in 2019 dollars in the 4-year sector, increasing from around $5,000 in 2001 to almost $10,000 in 2018. Average tuition in the 2-year sector rose from around $2,500 in 2001 to $4,100 in 2018. Meanwhile, public 4-year institutions, on average, became more reliant on tuition revenue, with between 21% and 24.5% of revenue coming from tuition in pre-Great Recession years to 29% in 2018 (fourth panel, Figure 1). In the 2-year sector, just over 20% of revenue came from tuition over the period.
The final panels in Figure 1 show state spending on aid. Per-FTE spending on aid grew from an average of around $600 in 2001 to $855 in 2018. Per-FTE spending on aid declined after the Great Recession, perhaps driven by increasing enrollments, but rose again later. The average share of need-based aid declined slightly from 72.4% in 2001 to 70.2% in 2018.
Profiles of State Higher Education Funding Approaches
Given that higher education funding varies substantially across states, our second research aim focused on documenting, describing, and categorizing latent profiles of state higher education funding approaches. Results indicate three distinct approaches among states in 2001. Table 1 presents descriptive statistics for all states (Column 1) and the estimated means for each variable, conditional on latent profile membership, by profile (Columns 2–4). Like other LPA studies, we provide a descriptive name for each profile that highlights key characteristics that qualitatively and quantitatively distinguish the profile from the average state and the other profiles. These profile names can be interpreted relative to the average state and the other profiles’ characteristics (e.g., a moderate funding approach profile has a name that reflects average funding relative to other profiles). Figure 2 maps states according to the profile for which they have the highest probability of belonging.
Estimated Means for Variables Used to Construct Latent Profiles for All States and by Latent Profile, 2001
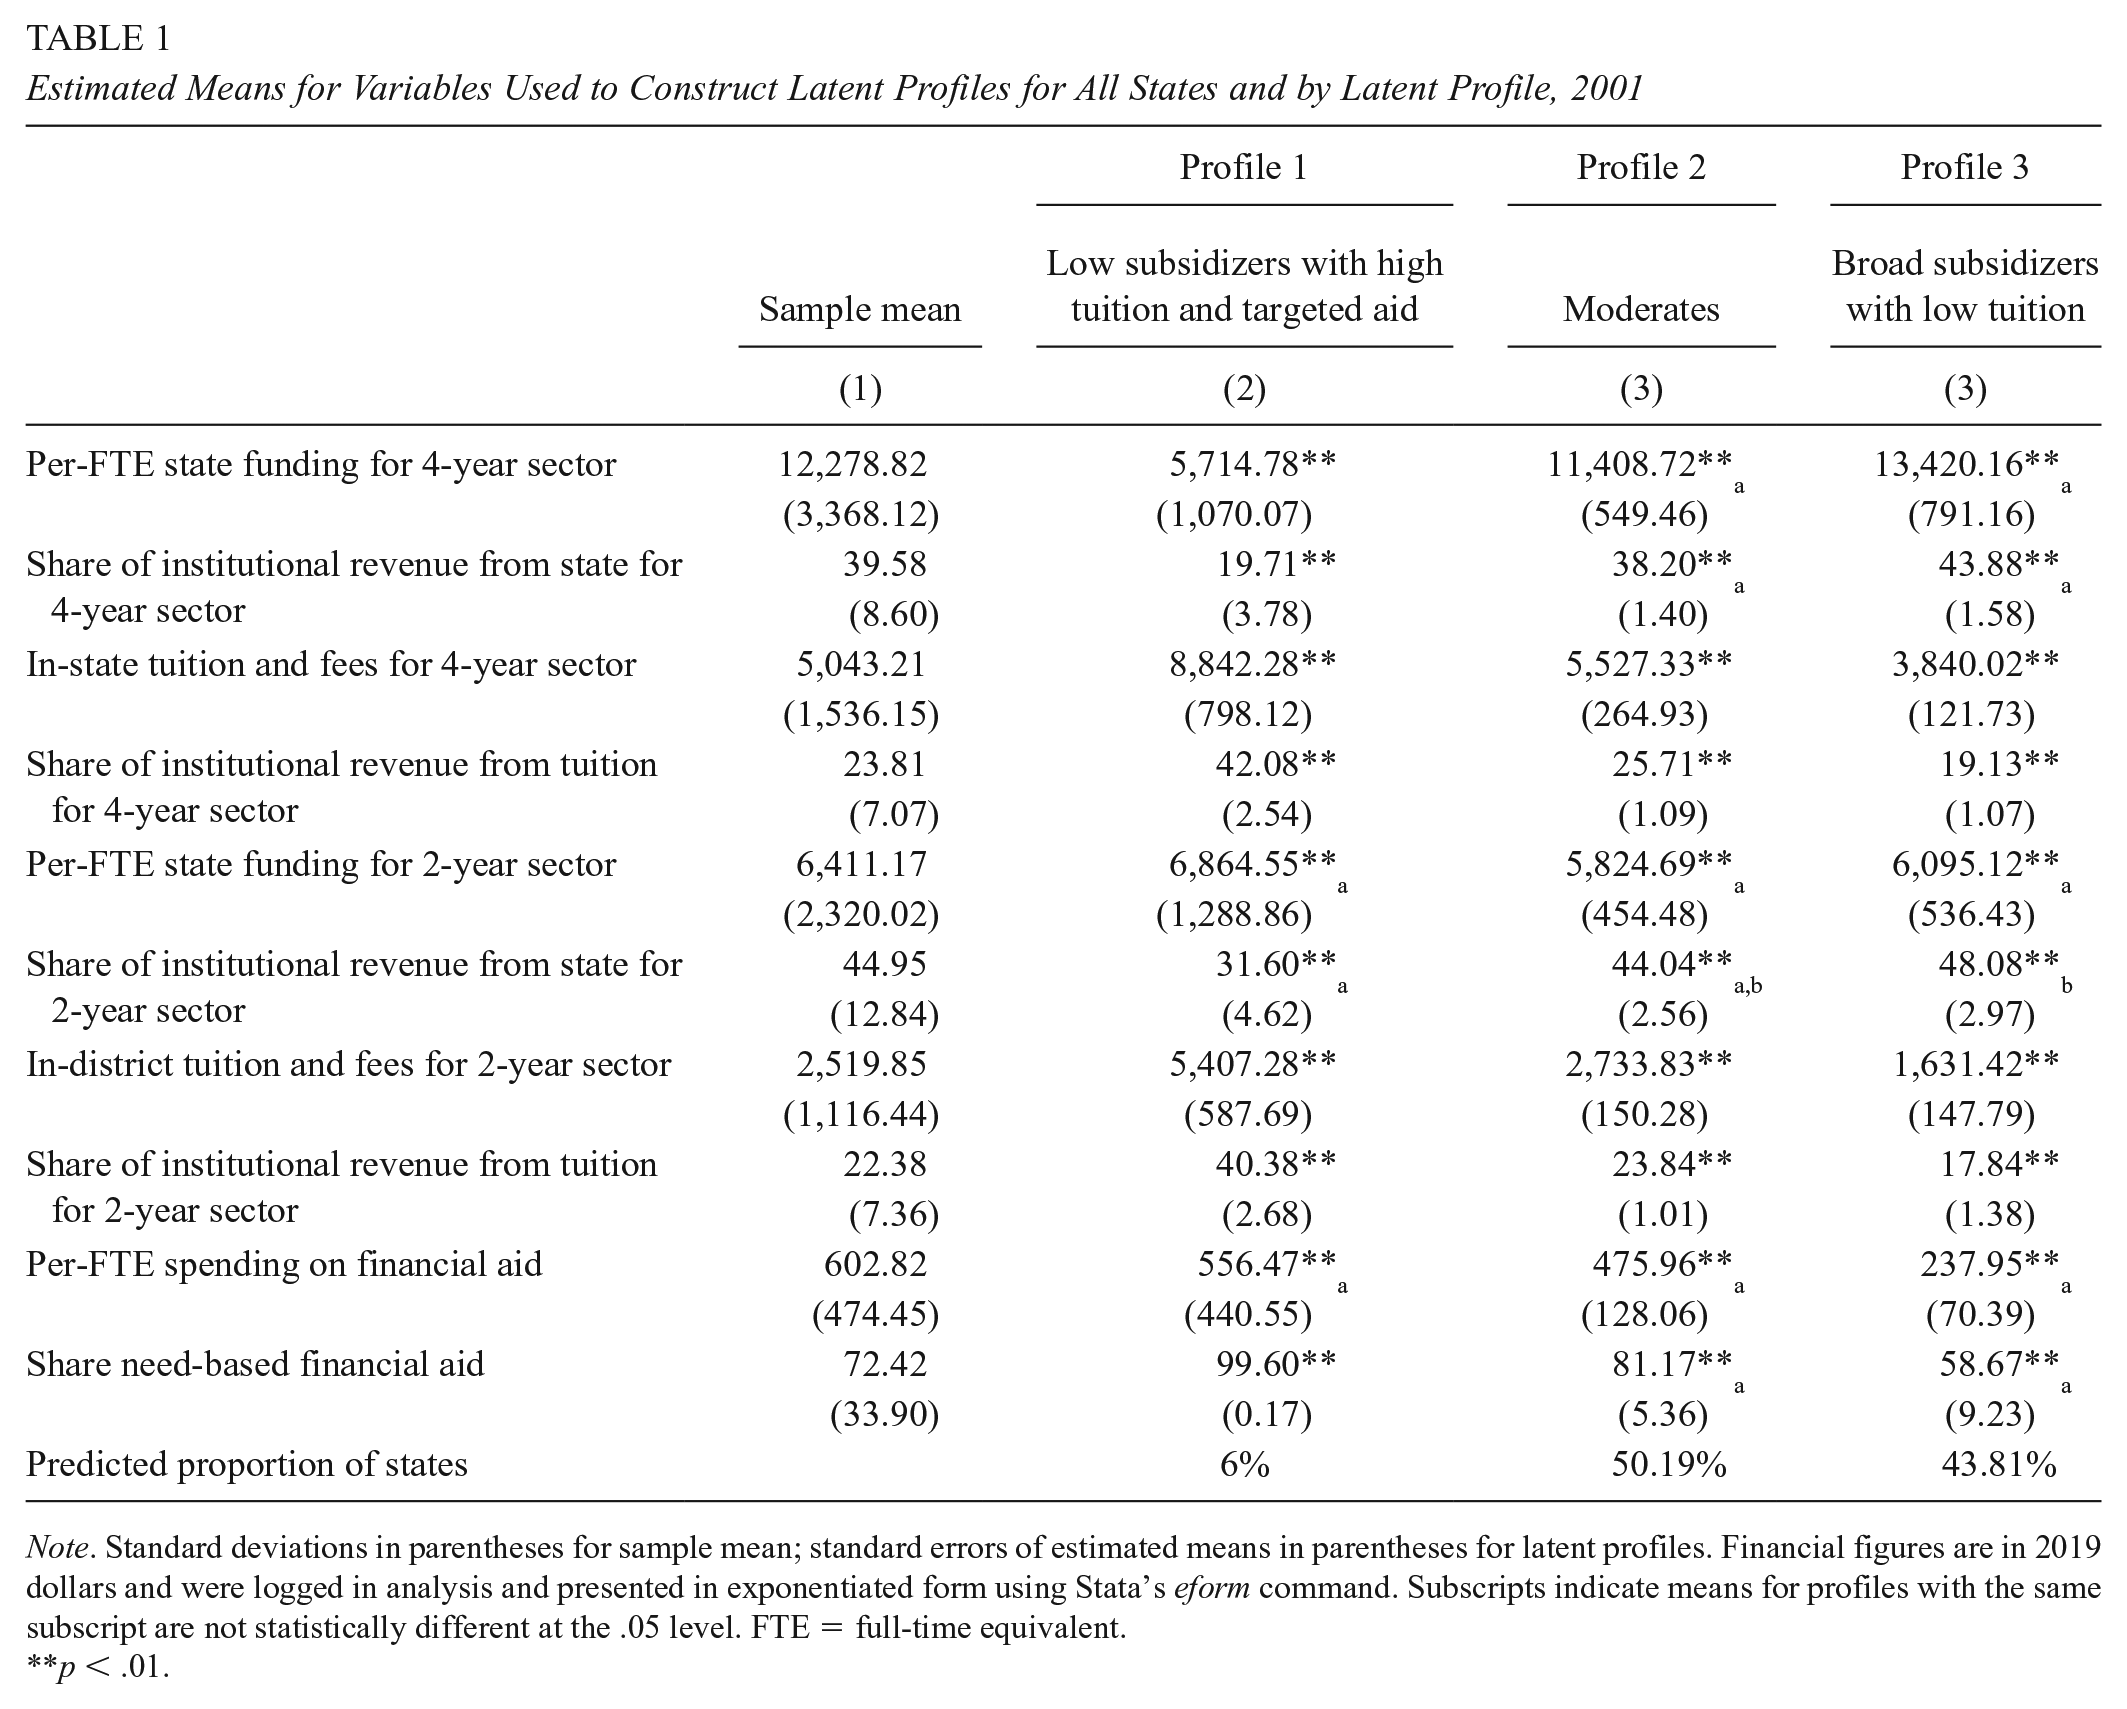
Note. Standard deviations in parentheses for sample mean; standard errors of estimated means in parentheses for latent profiles. Financial figures are in 2019 dollars and were logged in analysis and presented in exponentiated form using Stata’s eform command. Subscripts indicate means for profiles with the same subscript are not statistically different at the .05 level. FTE = full-time equivalent.
p < .01.

Map of states by latent profile.
The first profile was the smallest, with just three states (New Hampshire, Pennsylvania, and Vermont) assigned to the profile. The profile was characterized by low subsidization for the 4-year sector, high tuition and reliance on tuition revenue in both sectors, and financial aid targeted based on need. We termed this the “low subsidizers with high tuition and targeted aid” profile, and it had the lowest per-FTE state funding and reliance on state funding for the 4-year sector of the three profiles. These states allocated an average of $5,715 per FTE to public 4-year universities, and state funding represented less than 20% of total revenue in the sector. In both sectors, tuition and reliance on tuition revenue were the highest of the three profiles. Average tuition in the 4-year sector was $8,842, and tuition revenue represented 42% of revenue. In the 2-year sector, average tuition was $5,407, and tuition revenue represented 40.4% of revenue. Virtually all aid was targeted based on financial need. Per-FTE state funding and reliance on state funding in the 2-year sector and per-FTE spending on aid were not statistically different from the other profiles at the .05 level. Table 2 highlights the key features of each profile.
Key Features of Latent Profiles in 2001 and Over Time

Note. FTE = full-time equivalent.
We termed the second profile, which represented 25 states with the highest probability of belonging to the profile, the “moderates” due to its relatively average subsidization for public colleges and universities, tuition and reliance on tuition revenue, and spending on aid. For the 4-year sector, states in the profile allocated an average of $11,409 per FTE in state funding, with 38.2% of revenue coming from the state. For the 2-year sector, average per-FTE state funding was $5,825, with 44% of revenue coming from the state. These values were close to the mean of all states and were not statistically different from other the profiles, indicating a relatively moderate approach to state funding for public colleges and universities. Average tuition ($5,527 in the 4-year sector and $2,734 in the 2-year sector) and reliance on tuition revenue (25.7% and 23.8%, respectively) fell in between the other two profiles and were similar to the mean of all states, again indicating relatively moderate levels. The profile had similar per-FTE spending on aid as the other profiles, but a smaller share of funds (around 81% on average) was targeted based on need than the low subsidizers with high tuition and targeted aid profile. Rather, the moderate profile reflected a mix of need- and merit-based aid that was more similar to the national average. States with the highest probability of belonging in the moderate profile were primarily clustered in the Northeast (except for three states in the first profile) and Midwest and included some western states (Montana, Colorado, Oregon, and Washington).
We termed the third and final profile the “broad subsidizers with low tuition” approach. Twenty-two states had the highest probability of belonging to the profile, and this approach was predominant across southern states, including much of the Southeast, Southwest, and West. This approach features moderate to high per-FTE state funding and reliance on state funding in the 4-year sector, low tuition and reliance on tuition revenue in both sectors, and a mix of need- and merit-based aid. For the 4-year sector, per-FTE state funding was $13,420, and state funding comprised 43.9% of revenue. Although state support for the sector was the highest of the profiles, it was not statistically different from the moderates profile, so we consider this moderate to high subsidization. The broad subsidizers with low tuition approach had the lowest average tuition of the profiles at $3,840 in the 4-year sector and $1,631 in the 2-year sector. Tuition reliance was similarly low at less than 20% in both sectors. While average per-FTE spending on aid was similar to the other profiles, the composition of aid leaned more heavily toward merit aid than the low subsidizers with high tuition and targeted aid profile, with less than 60% need-based aid on average. One likely driver of the lower share of need-based aid is the existence of broad-based merit aid programs in several states (Florida, Georgia, Louisiana, Nevada, New Mexico, and West Virginia).
We next explored the trajectory of funding across the three approaches over time (our third research aim), focusing particularly on recessions when budget constraints may have pushed states to alter their funding approach. Figure 3 plots the averages for funding variables for the low subsidizers with high tuition and targeted aid profile. 5

Means for variables of interest for low subsidizers with high tuition and targeted aid latent profile.
The profile saw gradual declines in per-FTE state funding and reliance on state funding, particularly in the 4-year sector. These declines appeared larger during recessionary periods but were less pronounced compared to other profiles, which may reflect the already limited commitment these states made to funding the 4-year sector. In addition, per-FTE state funding did not appear to rebound to the same extent in the 4-year sector as the other profiles. The declining state commitment in the sector seemed to reflect an ongoing trend rather than being linked to recessions.
Meanwhile, tuition, already the highest of the profiles in 2001, rose to an average of $15,000 in the 4-year sector and $7,500 in the 2-year sector in 2018. Both sectors continued to rely heavily on tuition revenue, with around 40% of revenue coming from tuition. Per-FTE spending on aid declined while the share of need-based aid dropped from nearly 100% in 2001 to under 70% in 2012. The decline was driven by one state moving away from need-based aid instead of a decline across the states. This profile began with the lowest subsidization of the 4-year sector, the highest tuition and reliance on tuition revenue in both sectors, and an emphasis on need-based aid. Over time, the profile maintained its limited commitment to public universities while steadily increasing tuition, decreasing per-FTE spending on aid, and (in one state) scaling back need-based aid.
Figure 4 shows changes over time for the moderates profile. The profile saw declines in average per-FTE state funding in both sectors following recessions. The 2-year sector saw per-FTE state funding return to near pre-Great Recession levels in 2018, at around $6,000. The 4-year sector also saw a slight recovery in per-FTE state funding following recessions but experienced an overall decline to $9,500 in 2018. Reliance on state funding also declined over time, particularly during recessionary periods, in both sectors and once again regained ground faster in the 2-year sector. By 2018, however, state funding had dropped to 39% of revenue in the 2-year sector and 26.3% in the 4-year sector.

Means for variables of interest for the moderates latent profile.
The moderates profile experienced an increase in tuition and reliance on tuition revenue in the 4-year sector while tuition rose less steeply and without a corresponding steady increase in tuition reliance in the 2-year sector. Per-FTE spending on aid generally increased in pre-Great Recession years and declined after the Great Recession before increasing again, eventually surpassing 2001 per-FTE spending. The share of need-based aid remained around 80%. Overall, the moderates profile largely made up ground lost during recessions in state funding and reliance on state funding in the 2-year sector and per-FTE spending on aid. However, commitments to the 4-year sector did not fully recover from recessionary losses, while tuition became an increasingly important revenue source in the sector.
Figure 5 shows changes over time for the broad subsidizers with low tuition profile. Average per-FTE state funding, reliance on state funding, tuition, and reliance on tuition revenue each followed a similar trend as the moderates profile. Per-FTE state funding declined during recessionary periods in both sectors before almost recovering in the 2-year sector. Reliance on state funding similarly declined in both sectors during recessions but leveled off shortly after. Nonetheless, both sectors became less reliant on state funds. Tuition grew in both sectors (more rapidly in the 4-year sector), while reliance on tuition revenue rose in the 4-year sector and stayed relatively steady with some growth in the 2-year sector. Per-FTE spending on aid also increased, rising to more than $800 in 2018 (putting it in line with other profiles), but just 60% of aid was need-based. Overall, the broad subsidizers with low tuition maintained high per-FTE funding for the 4-year sector, relatively low tuition in both sectors, and increased per-FTE spending on aid relative to the moderates. However, states that embraced broad subsidization and low tuition in 2001 still decreased their commitments to funding public universities while increasing tuition and reliance on tuition revenue.

Means for variables of interest for broad subsidizers with low tuition latent profile.
Discussion
State policymakers allocate funds for public higher education institutions and students in an effort to reduce racial and economic inequities in college access and student success and to align higher education with state workforce goals. However, funding for higher education is often cut to balance budgets when states face shortfalls (Delaney & Doyle, 2011, 2018). Amid the present economic downturn associated with the pandemic, higher education funding is once again vulnerable. The funding decisions made by state policymakers in the coming years will have important implications for racially minoritized and low-income students and historically underfunded institution types (e.g., community colleges, MSIs).
This study examines national higher education funding trends over the last 2 decades. We then document, describe, and characterize distinct state approaches to higher education funding, examining these approaches over time to better understand how states either embrace or lessen their commitments to higher education, especially during recessions. Our national analysis indicates that state funding declines following recessions and is typically slow to recover, particularly for the 4-year sector, with per-FTE funding remaining at or below pre-Great Recession levels. The 2-year sector faces acute funding volatility given the cuts these institutions faced during recessions and their reliance on state funding as a revenue source. Over time, the share of need-based aid declined slightly, while per-FTE spending on aid declined during recessionary periods (perhaps due to increasing enrollments) but increased during nonrecessionary periods. However, tuition in both sectors has also increased (therefore, the net price students pay after accounting for grant aid may not have declined), with tuition revenues becoming increasingly important, particularly in the 4-year sector.
These trends mask various approaches states have taken to higher education funding. However, we know relatively little about how states balance commitments to broadly subsidizing public colleges and universities versus turning to high tuition with targeted financial aid or how states’ higher education funding approaches have evolved during recessions. Latent profile analysis revealed three distinct higher education funding approaches:
Offer limited subsidies for public universities, maintain high tuition with targeted need-based aid (low subsidizers with high tuition and targeted aid).
Offer moderate subsidies to public colleges and universities, maintain moderate tuition with a mix of need- and merit-based aid (moderates).
Broadly subsidize public universities, maintain low tuition with a mix of need- and merit-based aid (broad subsidizers with low tuition).
Prior work has conceptualized higher education funding as centering around two approaches: one focused on broad subsidization of public institutions to maintain low tuition and the other focused on high tuition coupled with targeting subsidies for students with financial need (Hearn & Longanecker, 1985; Toutkoushian & Shafiq, 2010). Our findings both confirm and complicate this narrative and indicate that in practice, the two approaches exist alongside a middle-of-the-road approach that embraces elements of both, with moderate subsidies for public institutions, moderate tuition, and a mix of need- and merit-based aid. In addition, our findings demonstrate that state approaches to higher education fall along geographic lines. Broad subsidization of public institutions with relatively low tuition (and reliance on tuition revenue) is predominant in the Southeast, Southwest, and, to a lesser extent, the West. Meanwhile, states across the Northeast and Midwest and some western states have embraced an approach that balances moderate subsidization with moderate tuition and a mix of need- and merit-based aid. Just three states (all in the Northeast) embraced low subsidization with high tuition and targeted aid.
Over time, all state funding approaches saw declines in per-FTE state funding, particularly in the 4-year sector. State funding declines took two broad forms. The first form, encompassing states with relatively moderate to strong subsidization for public universities in 2001, saw declining per-FTE state funding, with sharper decreases during recessionary periods. There was, however, attempts to regain lost ground following recessionary periods. While these states attempted to maintain commitments to public universities, they lost ground as recessions chipped away at state budgets. On average, states in the two profiles offered a fairly steady mix of need- and merit-based aid and increased per-FTE spending on aid.
The second form funding approaches took over time indicates a further retreat from state funding in a handful of states. These states began the period with the lowest average per-FTE state support for the 4-year sector. States withdrew support for both sectors slowly, steadily, and in ways that appeared exacerbated by but not limited to recessions. These states also saw a decline in average per-FTE spending on aid and the share of need-based aid, again evidencing a retraction of state support.
Although states across all approaches appear to make efforts to restore state funding for the 2-year sector after recessionary periods, these institutions still experienced declines in per-FTE funding and reliance on state funding, putting them in vulnerable positions given the importance of state funding in the sector. Meanwhile, across all profiles, tuition in both sectors increased without always corresponding increases in per-FTE spending on aid. Overall, the profiles ended the period in a similar relative position as where they began. However, the levels of funding were redefined: Per-FTE state spending and reliance on state funding decreased in the 4-year sector, tuition in both sectors increased while tuition revenue in the 4-year sector became increasingly important, and per-FTE spending on aid increased, but not on pace with tuition. In other words, the profiles maintained their position relative to other profiles, but each still saw dramatic changes.
Future research might consider factors that shape states’ higher education funding approaches. Researchers might examine what makes some states in a region embrace a different funding approach than others in the region (e.g., Maryland, Virginia, Tennessee, and South Carolina embraced a moderate funding approach while other states in the Southeast emphasized broad subsidization with relatively low tuition). In addition, future research might examine how political features of states and higher education governance structures shape states’ approaches to higher education funding. Our profiles do not neatly align with partisan political control or governance arrangements, given that regional trends seem to be stronger. Nevertheless, such research would contribute to existing work examining how these factors shape state higher education funding (e.g., Dar & Lee, 2014; Doyle, 2012; McLendon et al., 2014; Tandberg, 2010).
One study limitation is that we do not consider how variation in recession intensity across states shaped responses to recessions. States experienced the Great Recession differently, and state budgets were not uniformly affected; responses to the recession also varied not only by economic characteristics but also political and other state characteristics (Campbell & Sances, 2013). States also face different budget pressures in the current economic downturn (Leachman & Sullivan, 2020). Future research might examine how recession intensity shapes higher education funding, similar to research that has examined K–12 student achievement (Shores & Steinberg, 2017) and higher education enrollments (Ford et al., 2021).
Implications for Equity and Lessons for the Present
What do these findings entail for equity regarding college access and student success in the present moment? Importantly, across all three funding approaches, increases in per-FTE spending on aid do little to counter tuition increases, especially in the 4-year sector. Thus, all approaches lost ground when it came to college affordability, which is likely to disproportionately affect racially minoritized and low-income students, who are more sensitive to tuition changes (Allen & Wolniak, 2019; Flores & Shepherd, 2014).
These findings also entail implications for community colleges, MSIs, and other institution types that are more reliant on state funding yet have been historically underfunded (Cunningham et al., 2014; Harris, 2021). This study shows that in most states, funding commitments to public colleges and universities remain but are dropping slowly, with more volatile declines during recessions. Recessions place institutions that are more reliant on state funding at particular risk. This risk is likely to be sustained and amplified as institutions brace for cuts during the present economic downturn.
States have the ability to create funding formulas for public higher education that focus on protecting historically underfunded institutions that serve larger shares of racially minoritized and low-income students. Base-plus funding models, in which all colleges receive the same percentage change in funding, can disproportionately harm colleges that are heavily reliant on state funding. States have increasingly turned to performance-based funding (PBF), currently in place in 32 states, that ties a portion of state funds to student outcomes (Rosinger, Ortagus, et al., 2021). Although prior research has found null or modest effects of PBF on completion (Ortagus et al., 2020), formulas that prioritize the outcomes of historically underrepresented students may protect already underfunded colleges during economic downturns (Gándara & Rutherford, 2018; Kelchen, 2018). Absent metrics that focus on enrollment and success of underserved students, however, PBF may exacerbate funding disparities.
In the pandemic context, the fact that economically and racially marginalized people in the United States experience inequities that increase risk of infection and serious illness (Centers for Disease Control and Prevention, 2020; Whyte & Zubak-Skees, 2020) and have disproportionately been affected by the economic downturn (Parker et al., 2020) exacerbate these concerns. As a result, cuts to higher education that disproportionately harm racially minoritized and low-income students and institutions that serve these students are likely to compound broader economic and social inequities.
We have yet to see the full impact of the pandemic and the resulting economic downturn on state higher education funding. While federal stimulus funds have mitigated the worst cuts for higher education, 35 states cut funding for public colleges and universities in 2020 and 2021 (Laderman & Tandberg, 2021). Colorado limited the effects of their $493 million cut to public higher education institutions’ operating budgets with $450 million from federal stimulus funds (Colorado Department of Higher Education, 2020). Additionally, the state cut funding for several aid programs. By contrast, Michigan increased support for postsecondary institutions (Laderman & Tandberg, 2021) and invested $30 million to offer adults a tuition-free pathway to a certificate or associate’s degree (Brown & Weiss, 2020). Florida’s senate proposed substantial cuts to public higher education during the upcoming fiscal year while maintaining funding for Bright Futures, the state’s merit-based aid program (Dailey, 2021).
Even if state general fund revenues are higher than expected during the 2020s (and some states have already experienced surpluses), there will be pressure to spend more money on areas such as health care and K–12 education that were more adversely affected by the pandemic than higher education (MacKellar, 2022). These fiscal uncertainties will force policymakers to make difficult decisions in coming years that may redirect funds from higher education to other areas or make funding for higher education especially volatile. Our analysis shows that prior recessions have meant state retractions from commitments to funding public colleges and universities and steadily increasing tuition without similar-sized increases in state need-based aid regardless of the extent to which states embraced broad subsidization and low tuition versus high tuition with targeted aid. These retractions in state support for public colleges and universities reflect a steady declining commitment to higher education in a small number of states and in other states are pronounced and often do not fully recover following recessionary periods. As state fiscal uncertainty shapes budgetary decisions in the coming years, our findings indicate that state policymakers, regardless of their funding approach, may continue to chip away at their commitments to public colleges and universities while failing to increase spending on aid to keep pace with tuition increases. If these patterns continue, particularly absent federal-state partnerships to support public higher education institutions and sustain financial aid (see Harnisch, 2021), racially minoritized and low-income students who are particularly responsive to tuition changes and historically underfunded institution types that are especially reliant on state funding for revenue are likely at greatest risk.
Footnotes
Appendix
Estimated Means for Variables Used to Construct Latent Profiles for All States and by Latent Profile for Four-Profile Model, 2001
| Sample mean | Profile 1 | Profile 2 | Profile 3 | Profile 4 | |
|---|---|---|---|---|---|
| (1) | (2) | (3) | (3) | (5) | |
| Per-FTE state funding for 4-year sector | 12,278.82 | 5,714.51** | 10,893.47** | 12,525.89** | 15,499.60** |
| (3,368.12) | (1,071.94) | (1,000.67) | (706.04) | (846.50) | |
| Share of institutional revenue from state for 4-year sector | 39.58 | 19.71** | 37.89** | 40.78** | 47.06** |
| (8.60) | (3.79) | (1.57) | (2.06) | (1.68) | |
| In-state tuition and fees for 4-year sector | 5,043.21 | 8,842.31** | 4,393.95** | 6,209.10** | 3,714.24** |
| (1,536.15) | (798.18) | (311.04) | (209.51) | (160.98) | |
| Share of institutional revenue from tuition for 4-year sector | 23.81 | 42.08** | 22.62** | 27.78** | 16.39** |
| (7.07) | (2.54) | (0.89) | (2.37) | (1.29) | |
| Per-FTE state funding for 2-year sector | 6,411.17 | 6,864.82** | 5,055.50** | 6,828.29** | 7,057.78** |
| (2,320.02) | (1,290.59) | (497.40) | (1,567.22) | (500.03) | |
| Share of institutional revenue from state for 2-year sector | 44.95 | 31.60** | 41.96** | 46.16** | 54.10** |
| (12.84) | (4.62) | (2.69) | (6.01) | (3.43) | |
| In-district tuition and fees for 2-year sector | 2,519.85 | 5,407.46** | 2,131.87** | 2,975.23** | 1,473.51** |
| (1,116.44) | (588.95) | (140.33) | (303.17) | (197.35) | |
| Share of institutional revenue from tuition for 2-year sector | 22.38 | 40.39** | 21.67** | 24.61** | 15.33** |
| (7.36) | (2.69) | (1.14) | (2.11) | (1.67) | |
| Per-FTE financial aid award | 602.82 | 556.39** | 196.64** | 794.37** | 394.58** |
| (474.45) | (440.94) | (100.84) | (157.15) | (176.69) | |
| Share need-based financial aid | 72.42 | 99.60** | 76.36** | 87.92** | 37.76** |
| (33.90) | (0.17) | (6.86) | (5.19) | (11.70) | |
| Predicted proportion of states | 6% | 45.29% | 26.86% | 21.86% |
Note. Standard deviations in parentheses for sample mean; standard errors of estimated means in parentheses for latent profiles. Financial figures are in 2019 dollars and were logged in analysis and presented in exponentiated form using Stata’s eform command. FTE = full-time equivalent.
p < .01.
Acknowledgements
This article is based on research funded by the Bill & Melinda Gates Foundation. The findings and conclusions contained within are those of the authors and do not necessarily reflect positions or policies of the Bill & Melinda Gates Foundation. We thank Sondra Barringer, Barrett Taylor, and Jason Lee for their thoughtful feedback and suggestions as we prepared the article and are grateful for the excellent research assistance of Junghee Choi and Jiayao Wu.
Notes
Authors
KELLY ROSINGER is an assistant professor at Pennsylvania State University. Her research focuses on the barriers students face during the college-going process and how higher education policies can be designed to reduce racial and economic inequities.
ROBERT KELCHEN is professor and head of the Department of Educational Leadership and Policy Studies at the University of Tennessee, Knoxville. His research interests include higher education finance, accountability policies and practices, and student financial aid.
DOMINIQUE J. BAKER is an assistant professor of education policy in the Annette Caldwell Simmons School of Education and Human Development and a faculty affiliate of the Data Science Institute at Southern Methodist University. Her research focuses on the way that education policy affects and shapes the access and success of minoritized students in higher education.
JUSTIN ORTAGUS is an associate professor of higher education administration and policy and director of the Institute of Higher Education at the University of Florida. His research typically examines the impact of online education, community colleges, and state policies on the opportunities and outcomes of underserved students.
MITCHELL D. LINGO is a postdoctoral fellow at Pennsylvania State University. His research interests include how funding mechanisms affect access and equity of students of marginalized backgrounds and how campus engagement among students helps or hinders student success.