
Abstract
The racial/ethnic disparities and average declines in science, technology, engineering, and mathematics (STEM) motivation during adolescence are worrisome. Although STEM motivational beliefs are theorized to function in conjunction with one another, the unique patterns and how they change over time for different racial/ethnic groups remain understudied. Using data from the High School Longitudinal Study (N = 18,260), we identified four and five patterns of math and science motivational beliefs in 9th and 11th grade, respectively, and examined their prevalence among Asian, Black, Latina/o, White, and Multiracial adolescents. We found patterns with overall high/low beliefs, patterns with varying levels of motivational beliefs, and patterns characterized by domain differentiation. Then, we charted the stability and changes in those patterns from 9th to 11th grade for each racial/ethnic group and how the patterns at 11th grade were associated with adolescents’ STEM career expectations and high school math and science grade point averages.
Keywords
Individuals hold multiple motivational beliefs, including expectancies and value beliefs, that are interrelated and theorized to function in conjunction to shape individuals’ performance and choices (Eccles & Wigfield, 2020). Despite theoretical arguments about their interrelatedness, most empirical work focuses on each belief separately. If, however, these beliefs are interrelated, then individuals should vary not only on each separate belief but also in terms of their specific patterns across multiple beliefs. In other words, individuals should vary in terms of the various combinations or patterns they exhibit across multiple beliefs, wherein some individuals, for example, might have high math and science motivational beliefs whereas others might have high motivation in math but not in science. Although some emerging work describes the unique patterns across multiple math and science motivational beliefs, how these patterns change over time across diverse racial/ethnic groups remains understudied (Dietrich & Lazarides, 2019; Ing & Nylund-Gibson, 2017). The changes in adolescents’ math and science motivational belief patterns are critical to examine due to the typical declines during this developmental period, yet more studies need to describe other nuanced changes beyond the average declining trend (Dietrich & Lazarides, 2019; Hsieh et al., 2019; Lazarides et al., 2020; M.-T. Wang et al., 2017). Hence, our goal was to examine the patterns and changes in those patterns of multiple math and science motivational beliefs at 9th and 11th grades for Asian, Black, Latina/o, White, and Multiracial 1 adolescents. Our second goal was to examine how adolescents’ 11th-grade patterns were associated with their STEM career expectations and high school math and science grade point averages (GPAs) for each racial/ethnic group.
Theoretical Frameworks
Situated Expectancy-Value and Dimensional Comparison Theories
Situated expectancy-value theory is one of the prominent theories developed to understand individuals’ motivational beliefs (Eccles & Wigfield, 2020). According to this theory (Eccles, 2011; Eccles & Wigfield, 2020), people are more likely to pursue STEM if they are more confident in their ability to accomplish a task (i.e., expectancies) and see greater value in it. Individuals’ value beliefs include three promotive aspects: interest (i.e., how enjoyable people find something to be), utility value (i.e., how useful people find something to be), and attainment value (i.e., how central something is to who people are).
Theoretically, expectancy and value beliefs influence each other and co-determine individuals’ outcomes (Eccles & Wigfield, 2020). For example, the effect of one math/science motivational belief should be contingent on an individual’s other motivational beliefs (Durik et al., 2015; Guo et al., 2016; Lauermann et al., 2017; Nagengast et al., 2011; Trautwein et al., 2012; M.-T. Wang et al., 2015). Expressions such as “I can but I don’t want to” (i.e., relatively high expectancies but low value beliefs) and “STEM is useful but too hard for me” (i.e., relatively high utility beliefs but low expectancies) succinctly capture how examining multiple beliefs simultaneously offers more insight than each one in isolation (Ing & Nylund-Gibson, 2017; Lazarides et al., 2020; Simpkins & Davis-Kean, 2005). Though situated expectancy-value theory argues that expectancy and value beliefs need to be analyzed synergistically, researchers have largely focused on each belief separately.
Dimensional comparison theory builds on situated expectancy-value theory’s focus on multiple motivational beliefs to argue that we should also consider individuals’ beliefs across multiple domains. Specifically, individuals’ choices and performance in a domain like math are not influenced by just their motivational beliefs in math but also their motivational beliefs in other domains, like science (Helm et al., 2016; Jansen et al., 2015). Though scholars have tested how individuals’ beliefs in opposing domains, typically math and English, are negatively related, few studies examine the tenets of the theory arguing that beliefs in similar or related domains, like math and science, should be positively related and strengthen individuals’ performance in the related domains (Helm et al., 2016; Jansen et al., 2015; von Keyserlingk et al., 2021). We address these gaps by examining the patterns of adolescents’ expectancy and value beliefs in math and science.
Though the primary focus of situated expectancy-value theory and dimensional comparison theory are motivational processes at the individual level (Eccles & Wigfield, 2020; Helm et al., 2016), the “situated” part of situated expectancy-value theory emphasizes that all motivational processes are influenced by the contexts in which individuals are situated. In the United States, race and ethnicity are social position factors that shape individuals’ contexts in several regards, including the stereotypes socializers hold, access to contextual resources, and the structural barriers and discrimination individuals face (Coll et al., 1996). Thus, the racial/ethnic stratification of STEM means that not all adolescents are on an equal playing field (Carter et al., 2019; Thomson et al., 2020). Rather, STEM fields historically have inequitably rewarded, recruited, and retained certain racial/ethnic groups over others. In fact, STEM educational degrees and occupations are obtained disproportionally by more White and Asian individuals than Black and Latina/o individuals (NSF, 2019). Moreover, Asian adolescents tend to score higher on math and science standardized tests than White and Multiracial adolescents, who score higher than Latina/o and Black adolescents (U.S. Department of Education, 2019a & 2019b). Prior studies also showed racial/ethnic disparities in adolescents’ math and science motivational beliefs (Bouchey & Harter, 2005; Brown & Leaper, 2010; Nasir & Cobb, 2002; Safavian & Conley, 2016; Seo et al., 2019; Shanahan, 2009; Wenner, 2003). Considering the racial/ethnic stratification of STEM in the United States, we set out to examine the patterns of Asian, Black, Latina/o, White, and Multiracial adolescents’ math and science motivational beliefs as posited by the situated expectancy-value theory and dimensional comparison theory. Prior studies have focused primarily on the first four racial/ethnic groups; Multiracial adolescents typically have been excluded or placed in the “minority” group without further specificity (Nishina et al., 2021; X. Wang, 2013), which fails to examine the rich complexities of this heterogeneous, rapidly growing population (Harris, 2016; Nishina & Witkow, 2020).
The Patterns of Adolescents’ Math and Science Motivational Beliefs
Theories and prior research suggest at least four patterns of math and science motivational beliefs (Andersen & Chen, 2015; Chittum & Jones, 2017; Ng et al., 2016; Lin et al., 2018; Perez et al., 2018; Van Soom & Donche, 2014). First, situated expectancy-value theory and dimensional comparison theory both argue that expectancy and value beliefs in math and science should be similar and yield patterns of either all high or all low beliefs across math and science (Denissen et al., 2007; Eccles, 2009; Helm et al., 2016; Jansen et al., 2015; Phelan et al., 2017; Snodgrass Rangel et al., 2020). Relatedly, the compounding structural barriers marginalized youth continually face over the years could lower all of their math/science motivational beliefs, whereas structural supports and privileges might promote math/science motivational beliefs of youth from dominant groups.
Though theories suggest similarities across beliefs, previous research has found patterns where some motivational beliefs are relatively higher than others (Durik et al., 2015; Lauermann et al., 2017). For example, children see a difference between “doing” science versus “being” a scientist (Archer et al., 2010). Thus, some individuals, especially adolescents of marginalized groups, might find math/science both useful and within their ability but have a low attainment value if individuals perceive STEM as discriminatory or incompatible with their racial/ethnic identity (Martin, 2019; McGee, 2013; Shanahan, 2009).
Last, patterns might be characterized by domain-driven differences (Gaspard et al., 2020; Helm et al., 2016; Jansen et al., 2015; Umarji et al., 2018). Although dimensional comparison theory argues for positive relations between math and science, a recent meta-analysis showed mixed correlations between math and science expectancies (Möller et al., 2020). Moreover, scholars have empirically found that some individuals have high math but low science beliefs (Ing & Nylund-Gibson, 2017; Snodgrass Rangel et al., 2020).
These four possible patterns of adolescents’ math and science motivational beliefs were derived by combining suggestions from different theories and empirical studies. No study to date, however, has tested these patterns across math and science and across racial/ethnic groups. Thus, we built on theory and prior studies by examining the patterns that each of them individually highlighted for adolescents from diverse racial/ethnic groups.
Changes in the Patterns of Adolescents’ Math and Science Motivational Beliefs
Motivational beliefs change over time as individuals develop, gain more experience, and face the structural forces that cumulatively elevate or marginalize them (Wigfield et al., 2015). Research charting the trajectories of each motivational belief suggests that individuals’ expectancy and value beliefs typically decline or remain stable during adolescence (Denner et al., 2019; Hsieh et al., 2019; Jacobs et al., 2002; Köller et al., 2001; Musu-Gillette et al., 2015; M.-T. Wang et al., 2017). However, scholars have argued that these average changes do not capture the rich variability in terms of the direction of change or in terms of the extent to which multiple beliefs change in tandem or diverge over time. To address these important gaps, researchers need to examine changes in the patterns of individuals’ motivational beliefs, which is a goal of the current study.
Only a handful of studies have examined changes in the patterns of individuals’ motivational beliefs. These studies suggest four patterns of change: stability, changing to a less favorable pattern, domain convergence, and domain differentiation. First, stability is a common pattern in U.K. adolescents’ physics motivational beliefs (Sheldrake et al., 2017) and German adolescents’ math motivational beliefs (Dietrich & Lazarides, 2019). Second, some 7th and 10th-grade adolescents shifted from very positive to less favorable patterns of math and science interest and utility value (Ing & Nylund-Gibson, 2017). Last, findings suggest two opposing domain-driven changes. Based on dimensional comparison theory and the expectation that math is a gateway for many science fields, individuals’ math and science motivational beliefs should be more similar over time (Helm et al., 2016; Jansen et al., 2015; Maass et al., 2019; Watt et al., 2017). However, math and science are distinct domains, and math is more prominent in some science subjects than in others (e.g., physics vs. biology). As adolescents are exposed to more math and science, they may increasingly identify with only one domain and demonstrate increasing divergence (Denissen et al., 2007; Gaspard et al., 2020; Snodgrass Rangel et al., 2020).
In sum, theories and prior studies suggest four possible changes in the patterns of motivational beliefs; however, few empirical studies chart the changes in these patterns—leaving all of these possibilities largely untested. Furthermore, researchers have rarely tested whether changes in these patterns might look similar or different across racial/ethnic groups, particularly in regard to Multiracial adolescents. This is an important research question, because changes provide insight into how racial/ethnic disparities might emerge, close, or persist. Ing and Nylund-Gibson (2017), for example, found that although there were no racial/ethnic differences in the proportion of adolescents who remained in an overall high pattern of math and science motivational beliefs, the proportion changing from ambivalence to a less positive pattern was greater among those who identified with a minoritized race/ethnicity than among their White and Asian peers. We used the same analytical approach as Ing and Nylund-Gibson to examine the changes and correlates of adolescents’ motivational patterns for each racial/ethnic group.
The Correlates of Adolescents’ Motivational Beliefs
According to situated expectancy-value theory, the patterns of adolescents’ STEM motivational beliefs should predict their STEM career expectations and math/science GPAs (Wigfield & Eccles, 2020). Adolescents with high expectancy and value beliefs (Overall High) tend to have the highest STEM career expectations and math/science performance compared with their peers (Durik et al., 2015; Lauermann et al., 2017; Phelan et al., 2017). In contrast, adolescents with homogeneously low motivational beliefs (Overall Low) either have the lowest STEM outcomes or are similar to individuals with more mixed patterns (Ing & Nylund-Gibson, 2017; Phelan et al., 2017; Snodgrass Rangel et al., 2020). Furthermore, adolescents with higher expectancies typically score higher on performance indicators (Crombie et al., 2005; Eccles & Wigfield, 2020; Rosenzweig et al., 2019), whereas adolescents with higher values typically have stronger career expectations than their peers (Guo et al., 2016; Rosenzweig et al., 2019). Finally, for patterns characterized by math/science domain differences, Snodgrass Rangel and colleagues (2020) found adolescents who were more motivated in math than science reported greater STEM achievement and course taking than those who were more motivated in science than math. However, the relations between these patterns and adolescents’ STEM career expectations and math/science performance have not been tested for different racial/ethnic groups. It is possible that these expected associations might not emerge for marginalized racial/ethnic groups if discriminatory experiences or other structural barriers overwhelmingly block their STEM success. That is, examining how patterns of math and science motivational beliefs are associated with STEM outcomes for each racial/ethnic group could provide insights that might otherwise be masked if we examined only average associations.
These Processes Within Each Racial/Ethnic Group
Focusing on race/ethnicity is critical given how structural factors, such as race/ethnicity-based stereotypes about who are “STEM people,” could translate to STEM racial disparities (Beasley & Fischer, 2012; Grossman & Porche, 2014; McGee, 2016; Museus & Liverman, 2010; Nasir & Vakil, 2017). The patterns of adolescents’ math and science motivational beliefs, changes in those patterns, and their associated STEM outcomes may vary by race/ethnicity (Coll et al., 1996; Eccles & Wigfield, 2021). Though research comparing racial/ethnic groups informs our understanding of the magnitude of the disparities, analyses within each racial/ethnic group refocus the narrative on the rich variability within each group, which is often overlooked (Causadias et al., 2018). For example, racial/ethnic comparisons can (unintentionally or not) imply that racial minoritized adolescents need to be more like White adolescents in order to succeed in STEM. To balance out such a narrative, race/ethnicity-specific analyses can surface positive developmental processes and what works within each group. Within-race/ethnicity analyses also give space to adolescents who show positive STEM development but are nonetheless often labeled marginalized due to their race/ethnicity, such as Black adolescents with high STEM motivational beliefs. Taken together, we position our study to better understand within-race/ethnicity variations in STEM while also attending to between-group differences.
Current Study
Our first research question aims to identify the most prevalent patterns of adolescents’ math and science interest, utility value, attainment value, and expectancies in 9th and 11th grades. Guided by situated expectancy-value and dimensional comparison theory (Eccles & Wigfield, 2020; Helm et al., 2016), we expected at least four patterns, including Overall High, Overall Low, and patterns where adolescents’ motivational beliefs varied across type of belief or domain (e.g., low value but high expectancies, high beliefs for math but not science).
Then, we examined the stability and changes in these patterns across 9th and 11th grades. Based on prior studies (Dietrich & Lazarides, 2019; Gaspard et al., 2020; Ing & Nylund-Gibson, 2017), we expected at least four patterns of change from 9th to 11th grade, namely, stability, change to a less favorable pattern, domain convergence, and domain differentiation. Given our focus on within–racial/ethnic group processes while also attending to between group variability, we describe the prevalence of and changes in these patterns across time for the whole sample and separately for Asian, Black, Latina/o, White, and Multiracial adolescents.
Last, we examined how adolescents’ motivational patterns in 11th grade were associated with their STEM career expectations and high school math and science GPAs. Based on situated expectancy-value theory and prior studies (Eccles & Wigfield, 2020; Snodgrass Rangel et al., 2020), adolescents in the Overall High pattern were expected to have higher STEM outcomes than adolescents in the Overall Low pattern. Adolescents with relatively high expectancies were expected to have higher math and science GPAs, whereas adolescents with relatively high value beliefs were expected to have higher STEM career expectations than their peers (e.g., Rosenzweig et al., 2019).
Method
Data Set and Participants
Adolescents in the current study participated in the High School Longitudinal Study (HSLS), which was designed to examine adolescents’ STEM development and collected by the National Center for Educational Statistics (NCES). From the full HSLS sample (N = 25,210; 51% female, Mage = 16.51), we excluded 6,720 adolescents who had missing data on all math and science motivational beliefs in 9th or 11th grade because these indicators were necessary for the latent transition analysis. Additionally, we dropped 210 adolescents who identified as Native American or Pacific Islander due to small sample size. Our resulting analytic sample (n = 18,260) consisted of 8% Asian (n = 1,450), 10% Black (n = 1,870), 16% Latina/o (n = 2,920), 57% White (n = 10,380), and 9% Multiracial (n = 1,640) adolescents. As shown in Table 1, the analytic sample on average had higher math and science motivational beliefs and GPAs (d = .03–.50), higher STEM career expectations (Φ = .18), and lower representation of Asian and Black adolescents but greater representation of White and Multiracial adolescents (Φ = .01–.26) than the excluded sample. This study was approved by the institutional review board at the University of California–Irvine (HS#:2018-4349).
Descriptive Statistics

Source. U.S. Department of Education, Institute of Education Sciences, National Center for Education Statistics, High School Longitudinal Study of 2009, base year and first follow-up.
Note. STEM = science, technology, engineering, and mathematics; GPA = grade point average.
Cohen’s d effect sizes (.2 small, .5 medium, .8 large) and t tests (significance noted with stars) were calculated for continuous variables comparing the full analytic sample with adolescents in the analytic sample who had missing data.
Cramer’s V effect sizes (.3 small, .5 medium, >.5 large) and chi-squares (significance noted with stars) were calculated for binary variables comparing the full analytic sample with adolescents in the analytic sample who had missing data.
Cohen’s d effect sizes and t tests were calculated for continuous variables comparing the full analytic sample with the excluded sample.
Cramer’s V effect sizes and chi-squares were calculated for binary variables comparing the full analytic sample with the excluded sample.
Racial/ethnic percentages did not add up to 100% for the excluded sample because some adolescents had missing data on race/ethnicity.
p < .05. **p < .01. ***p < .001.
Measures
Math and science motivational beliefs
Adolescents reported four motivational beliefs in math and separately in science using the same items in both 9th and 11th grades (see Online Appendix A for detailed items). The measures were based on situated expectancy-value theory, and similar items have been used in prior studies (Jacobs et al., 2002; Shanahan, 2009; Simpkins et al., 2015; Snodgrass Rangel et al., 2020). The same items were measured in each domain at each grade level and rated on a 4-point Likert scale (1 = strongly disagree, 4 = strongly agree). Math/science interest was the average of three items (math, α = .78 and .80; science, α = .81 and .83, at 9th and 11th grade, respectively). Math/science utility value included three items (math, α = .77 and .81; science, α = .74 and .82). Math/science attainment value included two items (math, α = .84 and .88; science, α = .84 and .89). Math/science expectancies included four items (math, α = .90 and .88; science, α = .88 and .92). We dichotomized the scale score to capture the meaningful distinction between adolescents who agreed (i.e., an average score higher than 3 recoded to 1) or disagreed (i.e., an average score from 1 to 3 recoded to 0) with these statements. With this coding, the results can be interpreted as the percentage adolescents agreeing with statements regarding math/science interest, utility value, attainment value, and expectancies.
STEM outcomes
Three STEM outcomes were examined: adolescents’ STEM career expectations, math GPA, and science GPA. For STEM career expectations, adolescents were asked open-endedly in 11th grade what job or occupation they expect or plan to have at age 30. Their responses were dichotomized by HSLS into whether (0 = no, 1 = yes) the career expectations fell in a STEM domain based on Standard Occupational Classification codes (Bureau of Labor Statistics, 2012). Math and science GPAs were adolescents’ cumulative high school GPAs across all of their math classes and, separately, all of their science classes. Both math and science GPAs ranged from 0 to 4 and were weighted for course level; they came from transcript data collected at the end of high school.
Race/ethnicity
In 9th grade, adolescents were asked to select all categories that described their racial background: White, Black, Asian, Native Hawaiian or other Pacific Islander, and American Indian or Alaska Native. Adolescents were coded as Asian, Black, or White, respectively, if they exclusively chose only one of those racial categories. Adolescents were coded as Multiracial if they chose two or more of those racial backgrounds. Adolescents were also asked if they were of Hispanic or Latina/o origin. Those who responded yes, regardless of their reported racial background, were coded as Latina/o. Adolescents who identified only as Native American or Pacific Islander were excluded from our main analytic sample given their small sample size but were included in the robustness check samples.
Analysis Plan
Data analyses were executed in Mplus Version 8.4 (Muthén & Muthén, 1998–2017). To focus on the rich variability within each racial/ethnic group, all analyses with the main analytic sample were conditional on the five racial/ethnic groups using the Mplus KNOWNCLASS command. In other words, race/ethnicity functioned as a grouping variable that allowed the estimated prevalence of the patterns and changes in patterns to vary for each racial/ethnic group (Lanza & Collins, 2008). Adolescents with missing data (missing ranged from 0.2% for 9th-grade science attainment value to 17.9% for 9th-grade science utility value) were included in the analysis via the full-information maximum likelihood procedure. As shown in Table 1, adolescents in the analytic sample on average had higher math and science motivational beliefs and GPAs (d = .02–.21) except for 9th-grade science interest, higher STEM career expectations (Φ = .03), and lower representation of Black and Latina/o adolescents but greater representation of Asian and White adolescents (Φ = .01–.04) than adolescents in the analytic sample who had missing data.
To address Research Question 1, namely, the patterns of adolescents’ math and science motivational beliefs, latent class analysis with race/ethnicity as the grouping variable was estimated separately for 9th and 11th grades. Latent class analysis (LCA) was chosen over latent profile analysis as the motivational beliefs were dichotomized at a meaningful cutoff. The selection of the pattern solution was based on theoretical significance of the patterns and parsimony of the solution in addition to several standard fit indices (Akaike information criterion [AIC], sample size–adjusted Bayesian information criterion [saBIC], approximate-weight-of-evidence criterion [AWE], relative improvement [RI], size of the smallest group, and correct model probability) as detailed in Online Appendix B (Masyn, 2013; Nylund et al., 2007). Once the final solution was selected, the prevalence of each pattern was estimated within each racial/ethnic group in addition to the averaged prevalence for the full analytic sample. Because replication is particularly crucial for pattern-centered analyses, we replicated the LCAs using the maximum HSLS sample who participated in 9th (n = 21,430) and separately at 11th grade (n = 20,400). For these robustness check analyses, we included participants from all racial/ethnic groups who had motivational belief data at that grade level (see Table 1).
To address Research Question 2, namely, the changes in adolescents’ STEM motivational belief patterns from 9th to 11th grade, latent transition analysis (LTA) was estimated using the patterns identified from Research Question 1 (Asparouhov & Muthén, 2014; Nylund-Gibson et al., 2014). The primary estimates of interest from the LTA are transition probabilities, which are the conditional probability of exhibiting a specific 11th-grade pattern given an individual’s 9th-grade pattern. The transition probabilities were estimated within each racial/ethnic group as well as for the full analytic sample.
To address Research Question 3, three separate models were estimated to examine the relations between adolescents’ motivational patterns at 11th grade and their (a) STEM career expectations, (b) math GPA, and (c) science GPA. Separate models were estimated to address issues of multicollinearity. For each model, STEM career expectations, math GPA, or science GPA was added to the LTA with their means allowed to vary by adolescents’ 11th-grade motivational pattern. Comparing the means of these outcomes across the patterns is statistically analogous to running an ANCOVA but with latent instead of observed groups (Nylund-Gibson et al., 2019). We used Bonferroni adjustment to account for testing multiple comparisons; the conventional p < .05 threshold was adjusted to p < .005 given the number of pairwise comparisons between the five patterns at 11th grade.
Results
Model Identification
As shown in Figure 1, the overall model fit indices (AIC, saBIC, AWE) decreased as the number of patterns increased. The changes, however, were not as pronounced after four patterns for 9th grade. For example, the change in AIC from the two- to the three-pattern model was 2891, from the three- to four-pattern model was 1343, but from the four- to five-pattern model was only 807. The RI index suggested that the four-pattern model did a similarly good job at explaining the data as the five-pattern model. Last, we inspected the five-pattern model, but the additional pattern did not offer a clear theoretical contribution (a pattern with high math utility value but low/mixed level of other motivation beliefs). As a result, we selected the four-pattern model for 9th grade.
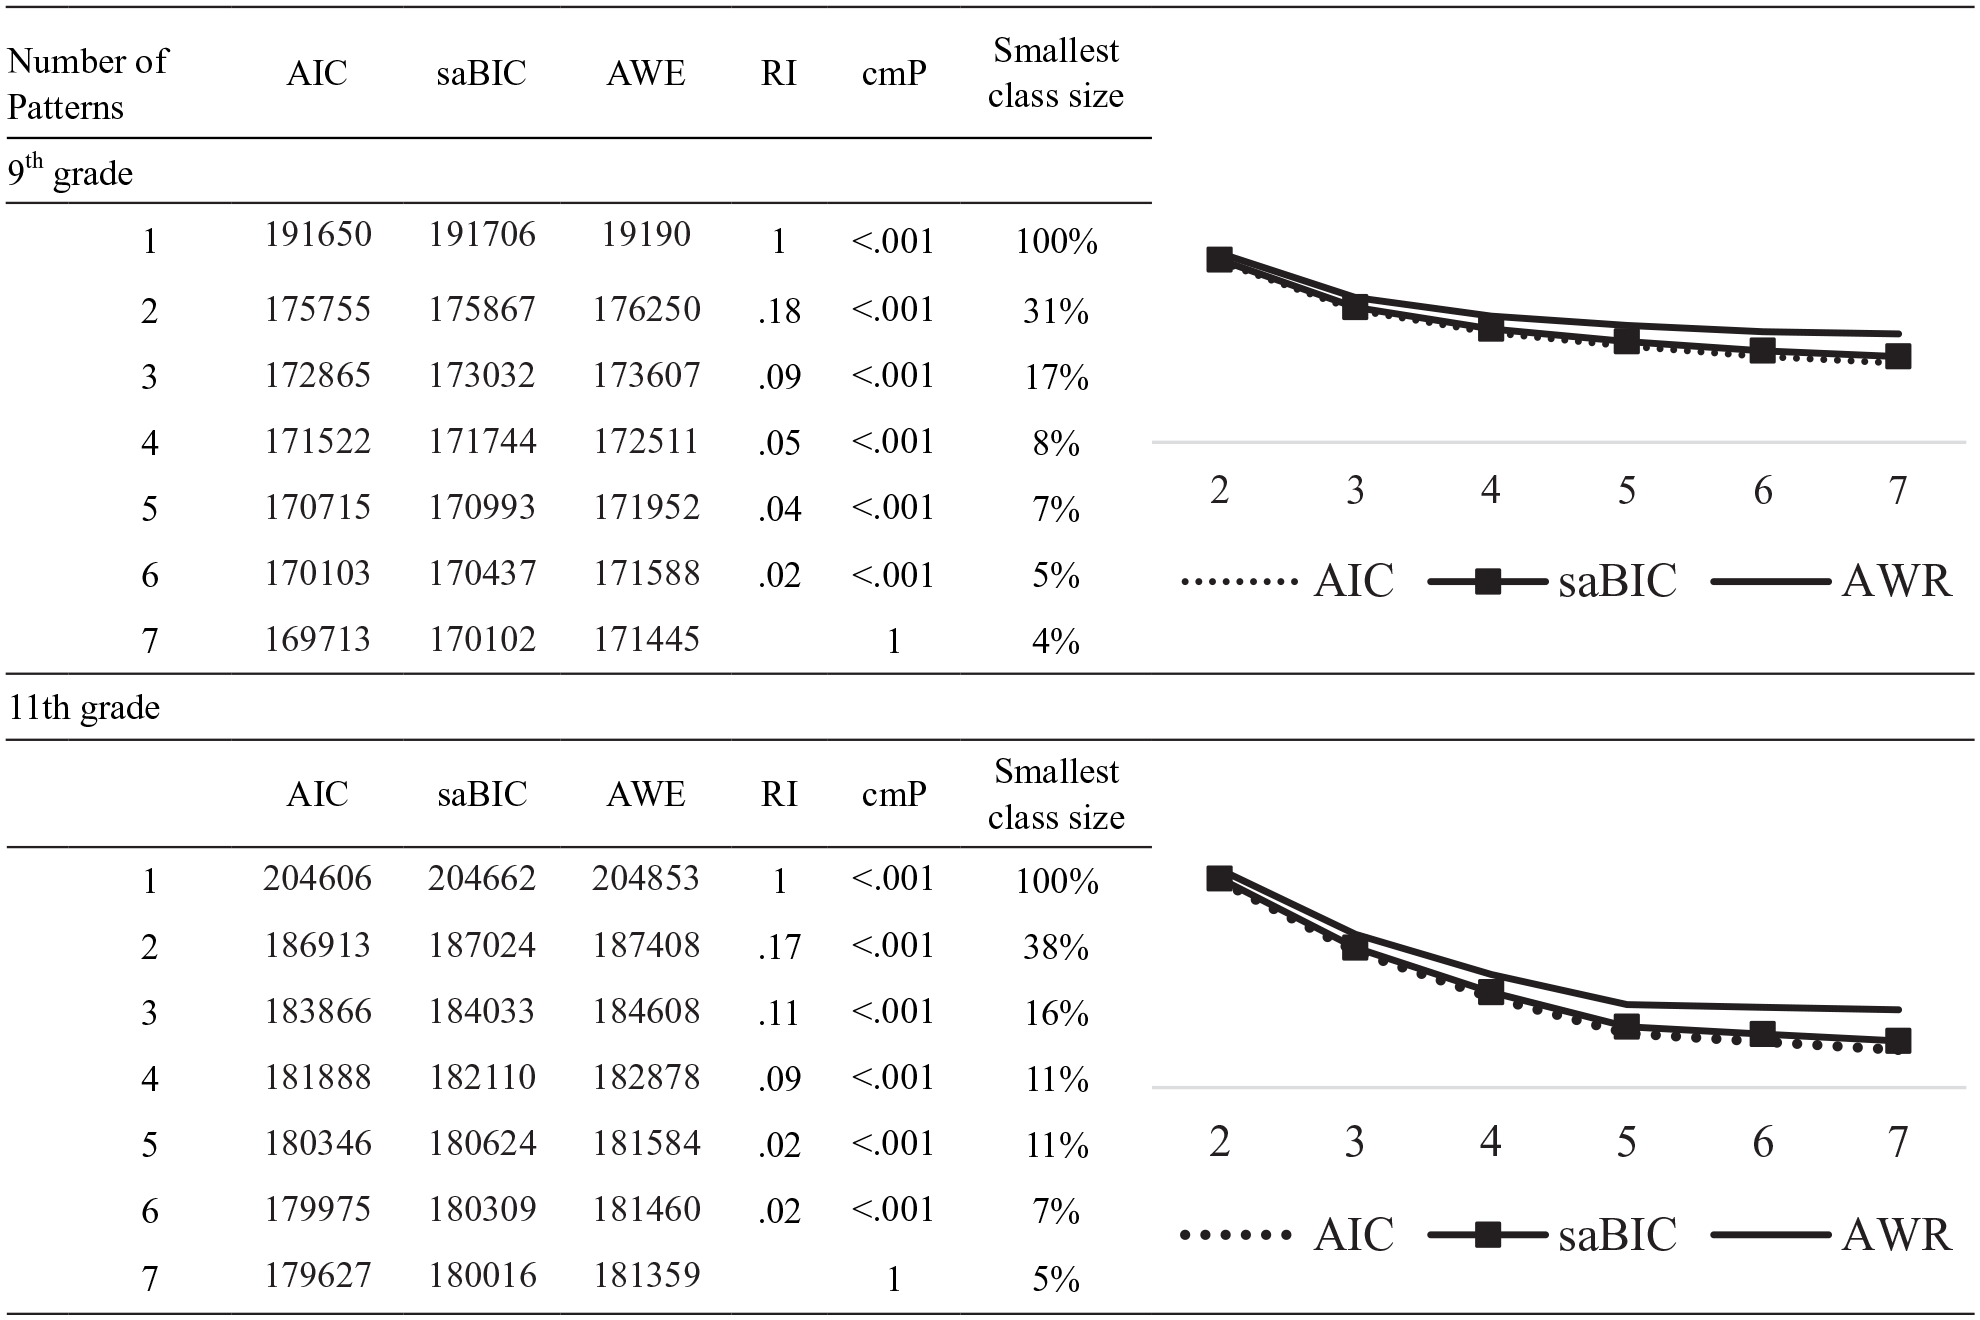
Model fit indices.
For 11th grade, changes in overall model fit indices were all greater than 1500 before the five-pattern model, yet moving from the five- to the six-pattern model yielded only a 371 change in the AIC. Inspecting the RI index and the additional pattern from the six-pattern model again suggested that the five-pattern model offered similar theoretical nuances as the six-pattern model but achieved greater parsimony.
As described earlier, the selected number of patterns was a balance between model fit and theoretical contribution. The findings for model identification (Online Appendix C) and the pattern configurations (Online Appendix D) replicated on the two robustness check samples, both of which maximized the sample sizes at each grade level (n = 21,430 at 9th grade and 20,400 at 11th grade). The results from this point on are based on the analytic sample, so the same participants were included in the analysis for each research question.
Patterns of Motivational Beliefs in 9th and 11th Grades Overall and by Race/Ethnicity
Following standard practices (Masyn, 2003; Nylund-Gibson et al., 2019), Figures 2 and 3 depict line graphs where each line represents a separate pattern of adolescents’ math and science motivational beliefs. The y-axis represents the probability of endorsing each motivational belief. The convention for interpretation is that endorsement greater than 70% (.7) is referred to as high, endorsement less than 30% (.3) is referred to as low, and endorsement in between is considered mixed (or ambivalence, unsure) endorsement (Ing & Nylund-Gibson, 2017; Masyn, 2003).

Math and science motivational beliefs patterns in 9th grade.
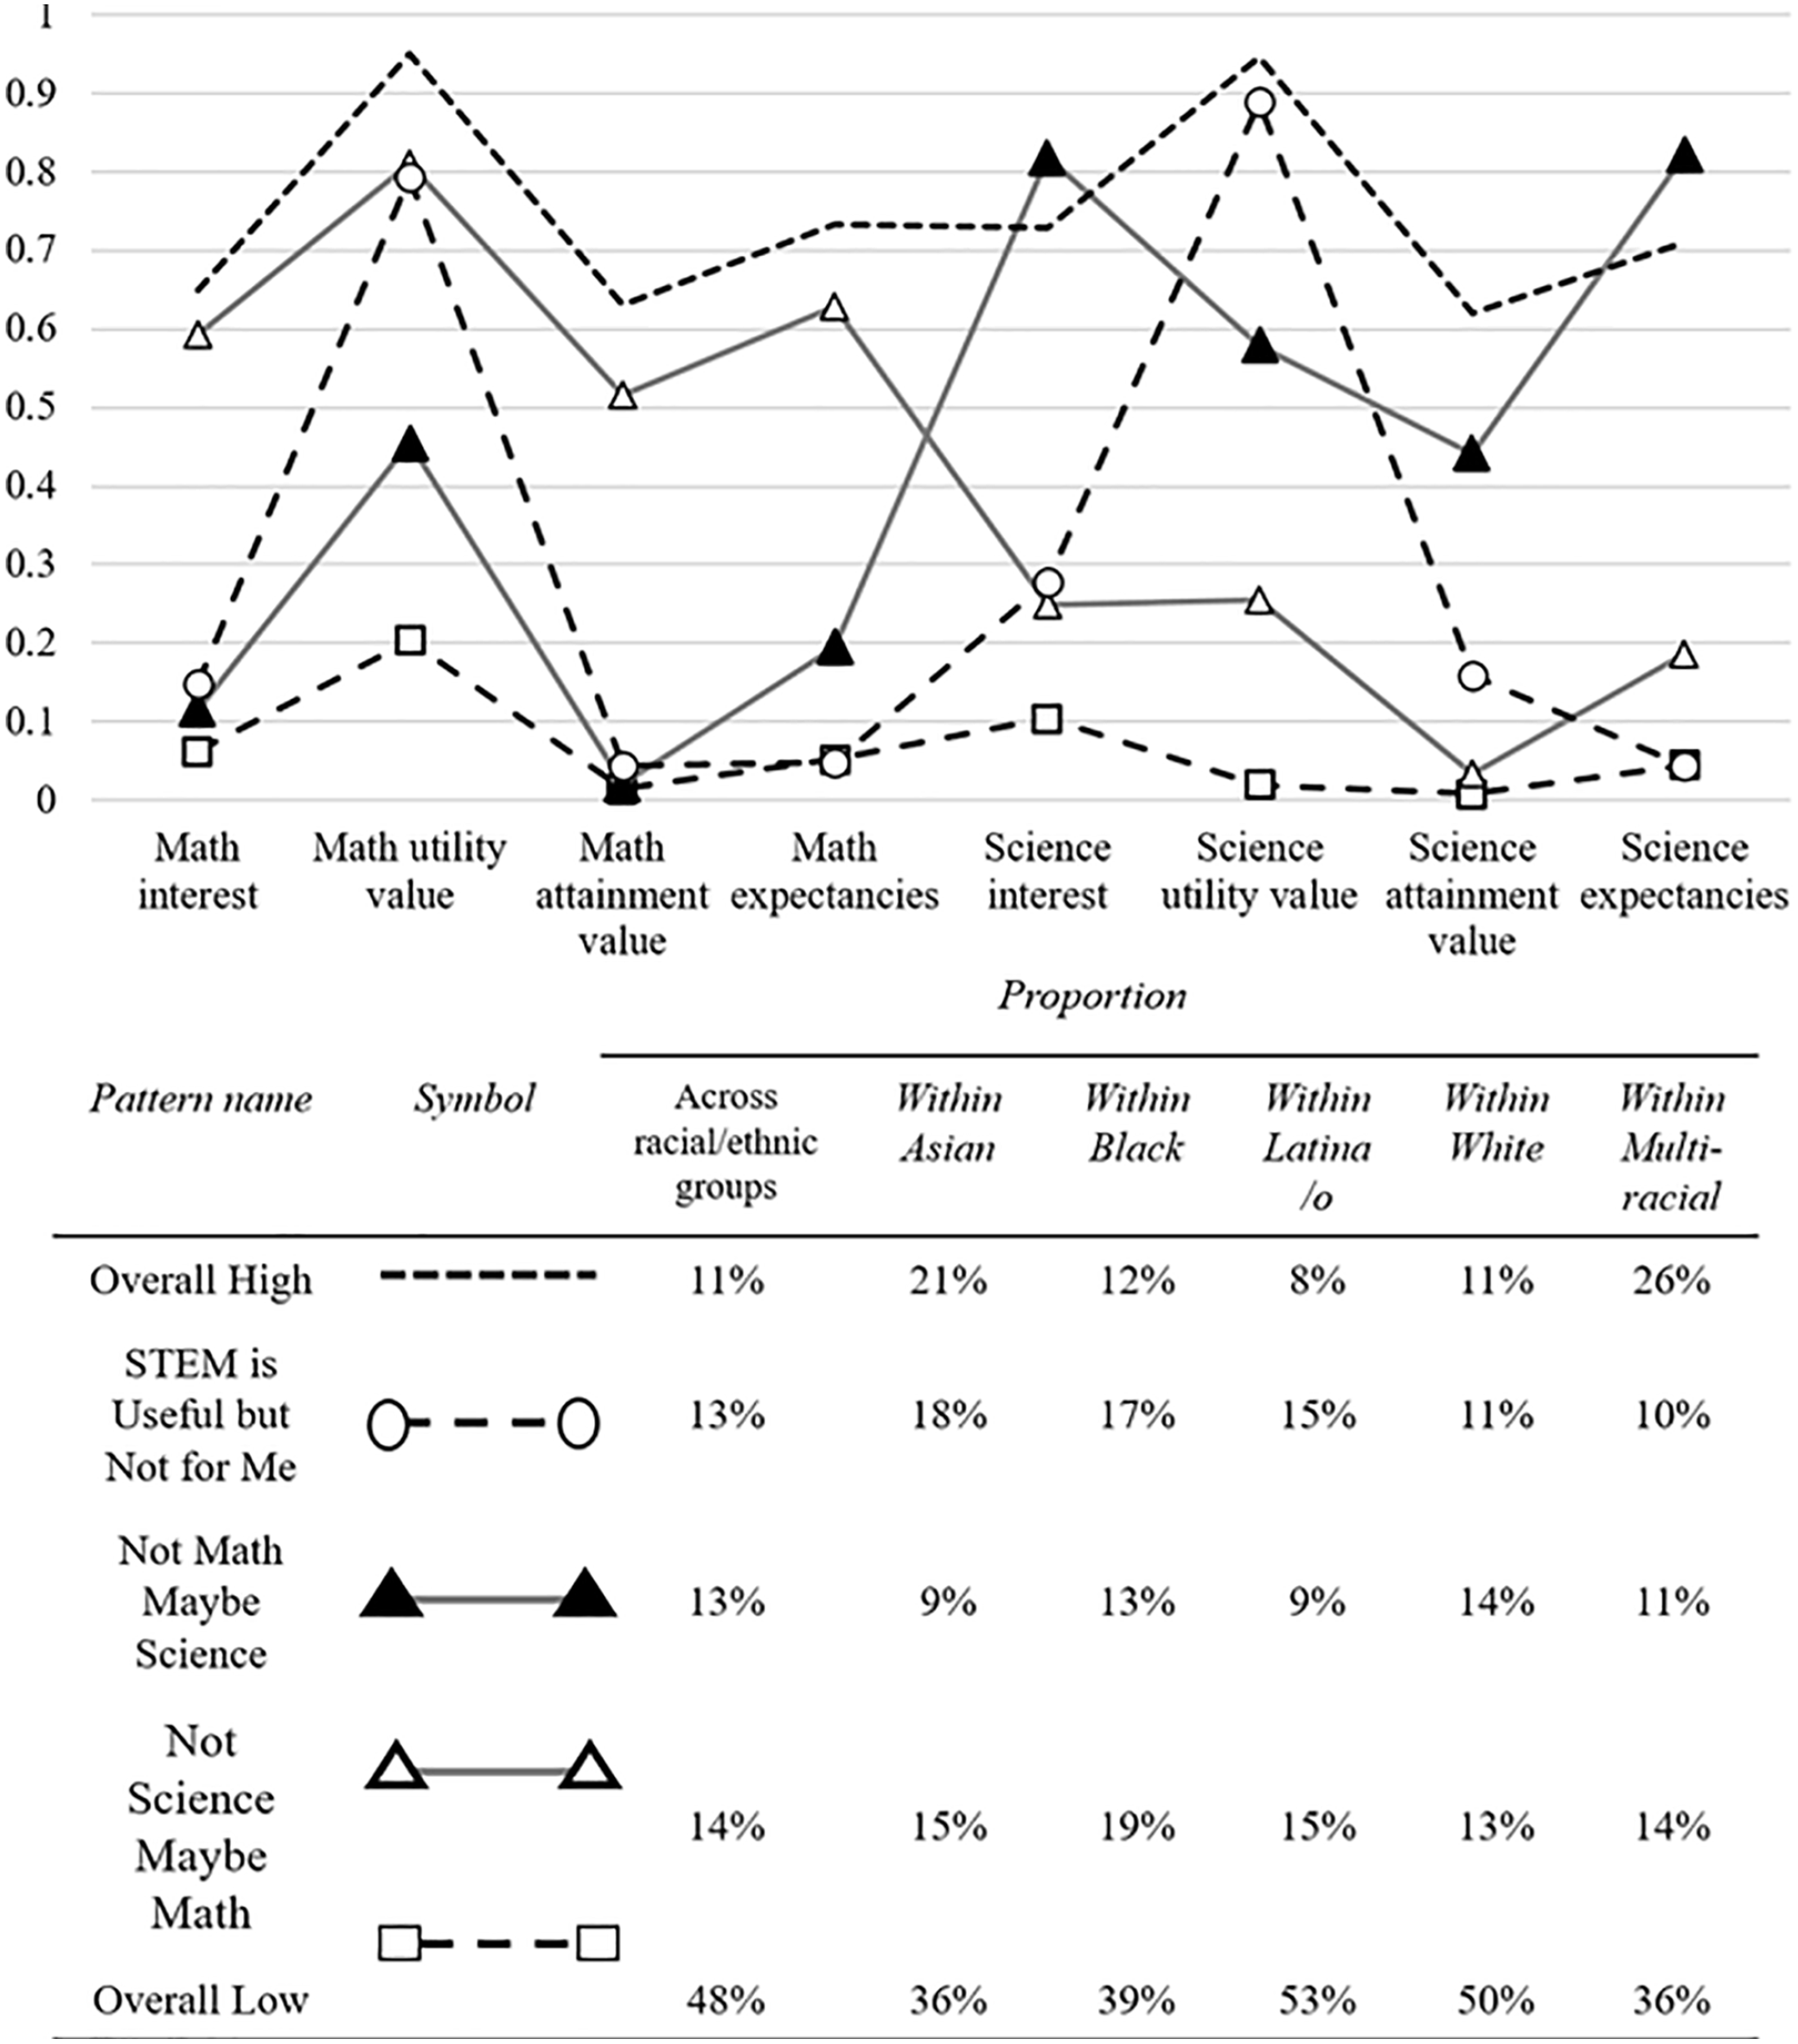
Math and science motivational belief patterns in 11th grade.
Ninth grade
Figure 2 shows the four patterns of adolescents’ 9th-grade math and science motivational beliefs. The most common pattern was Overall Low (shown with empty squares on a dashed line), for which adolescents’ endorsement for all math and science motivational beliefs was below .3. In contrast, the pattern shown with a plain dashed line, Overall High, was the smallest group. In addition, two patterns emerged in which adolescents’ math and science motivational beliefs differed in their relative level. The pattern Not Who I Am (solid squares on a solid line) included adolescents with low math and science attainment values but mixed levels of the other math and science motivational beliefs. Last, adolescents in the Not Science Maybe Math pattern (empty triangles on a solid line) had low science motivational beliefs but mixed math motivational beliefs that were close to high levels.
The lower right part of Figure 2 details the distribution of those patterns within each racial/ethnic group. Overall Low had the largest percentage of adolescents in each racial/ethnic group, followed by Not Who I Am, Not Science Maybe Math, and finally, Overall High. One of the differences across groups was that only 38% of Asian and 37% of Black adolescents were in the Overall Low group, which was lower than the overall average (50%) and the other groups (48%–53%). Another difference across groups was that 35% of Black adolescents reported the Not Who I Am pattern, whereas the percentages of Asian, Latina/o, White, and Multiracial adolescents reporting that pattern were 23% to 28%.
Eleventh grade
Figure 3 shows the five patterns of adolescents’ 11th-grade math and science motivational beliefs. We labeled patterns at 11th grade with the same name as those in 9th grade if they had similar configurations, though they might vary slightly in the level of endorsement. Three of the same patterns emerged in 9th and 11th grades: Overall Low, Overall High, and Not Science Maybe Math. Two new patterns emerged: Adolescents in the Not Math Maybe Science pattern (solid triangles on a solid line) had mostly low math motivational beliefs but high or mixed science motivational beliefs, and adolescents in the STEM Is Useful but Not for Me pattern (empty circles on a dashed line) had high utility values but low interest, expectancy, and attainment values for both subjects.
Figure 3 details the prevalence of these patterns within each racial/ethnic group. Similar to 9th grade, the Overall Low pattern accounted for the largest percentage of adolescents in every racial/ethnic group (36%–53%). In contrast to 9th grade, the prevalence of the other four remaining patterns did not follow a particular order. For example, the second largest pattern among Asian (21%) and Multiracial (26%) adolescents was Overall High but a domain-differentiated pattern among White (14% reporting Not Math Maybe Science), Black, and Latina/o adolescents (19% and 15% reporting Not Science Maybe Math).
Changes in Patterns of STEM Motivational Beliefs Across Race/Ethnicity
All changes across patterns from 9th to 11th grade are described in Table 2, and the two most prevalent changes are depicted in Figure 4 for simplicity; only one change is depicted when the second most prevalent change was reported by <15% of adolescents. Across racial/ethnic groups, 75% of the 9th-grade adolescents were in one of the three patterns that emerged at both grade levels and could demonstrate stability over time. Staying in the same pattern was the most common developmental change between the two time points for these three patterns, which held for all racial/ethnic groups. Adolescents in Not Who I Am at 9th grade had to switch because that pattern did not emerge in 11th grade; the majority of them transitioned into the Not Math Maybe Science (26%) or Overall Low (32%) pattern. As would be expected, some of the least frequent transitions were switching to an opposing pattern, such as between Overall High and Overall Low (12% switching from high to low, 3% from low to high; top section of Table 2); a mere 5% of adolescents switched from Not Science Maybe Math to Not Math Maybe Science. Finally, adolescents who were in the Not Who I Am or the Not Science Maybe Math pattern were likely to move down to Overall Low (32% and 31%, respectively) rather than up to the Overall High pattern (12%; top section of Table 2). In sum, stability across time was the strongest pattern, followed by moving down to the Overall Low pattern; switching to an opposite pattern was the most unlikely change. These changes emerged in the full sample and within each racial/ethnic group.

Most prevalent two paths of change in math and science motivational belief patterns from 9th to 11th grade, among (a) adolescents across race/ethnicity and (b) Asian, (c) Black, (d) Latina/o, (e) White, and (f) Multiracial adolescents.
Change in Math and Science Motivational Belief Patterns From 9th to 11th Grade

Source. U.S. Department of Education, Institute of Education Sciences, National Center for Education Statistics, High School Longitudinal Study of 2009, base year and first follow-up.
Note. (a) Model for adolescents across race/ethnicity and (b) Asian, (c) Black, (d) Latina/o, (e) White, and (f) Multiracial adolescents. Bolding and underline used for 50%-or-higher proportions; bolding alone used for 25%-to-49% proportions. STEM = science, technology, engineering, and mathematics.
Table 2 also shows some of the unique changes that occurred in specific racial/ethnic groups. For example, 38% of Black adolescents and 39% of Asian adolescents in the Overall Low pattern changed into a more favorable pattern over time, which was higher than the other three racial/ethnic groups (25%–31%). Latina/o and White adolescents seemed to have higher rates of adolescents moving from Not Who I Am into the Overall Low pattern (36% and 34%, respectively) compared with Asian (20%) and Black (25%) adolescents. Latina/o adolescents also had the highest proportion of adolescents moving from Overall High to Overall Low (23%) compared with other racial/ethnic groups (4%–14%). These movements into the Overall Low pattern in 11th grade resulted in about 1 in every 2 Latina/o (53%) and White (50%) adolescents reporting the Overall Low pattern in 11th grade, whereas the percentage for Asian, Black, and Multiracial adolescents was 36% to 39%. Last, Table 2 highlights similarities in encouraging changes and stability across racial/ethnic groups, which are often not highlighted in the literature. For example, around 10% of adolescents from each racial/ethnic group showed the encouraging change from the Not Who I Am and Not Science Maybe Math patterns in 9th grade to the Overall High pattern in 11th grade. Additionally, at least 40% of adolescents in every racial/ethnic group maintained the Overall High pattern across time.
Adolescents’ Motivational Patterns and STEM Outcomes
As shown in Table 3, adolescents’ math and science motivational patterns at 11th grade were associated with their STEM career expectations and their math/science GPAs. Significant differences (Bonferroni-corrected p < .005) across the patterns within each racial/ethnic group are noted with different superscripts and are described with words in each section of Table 3.
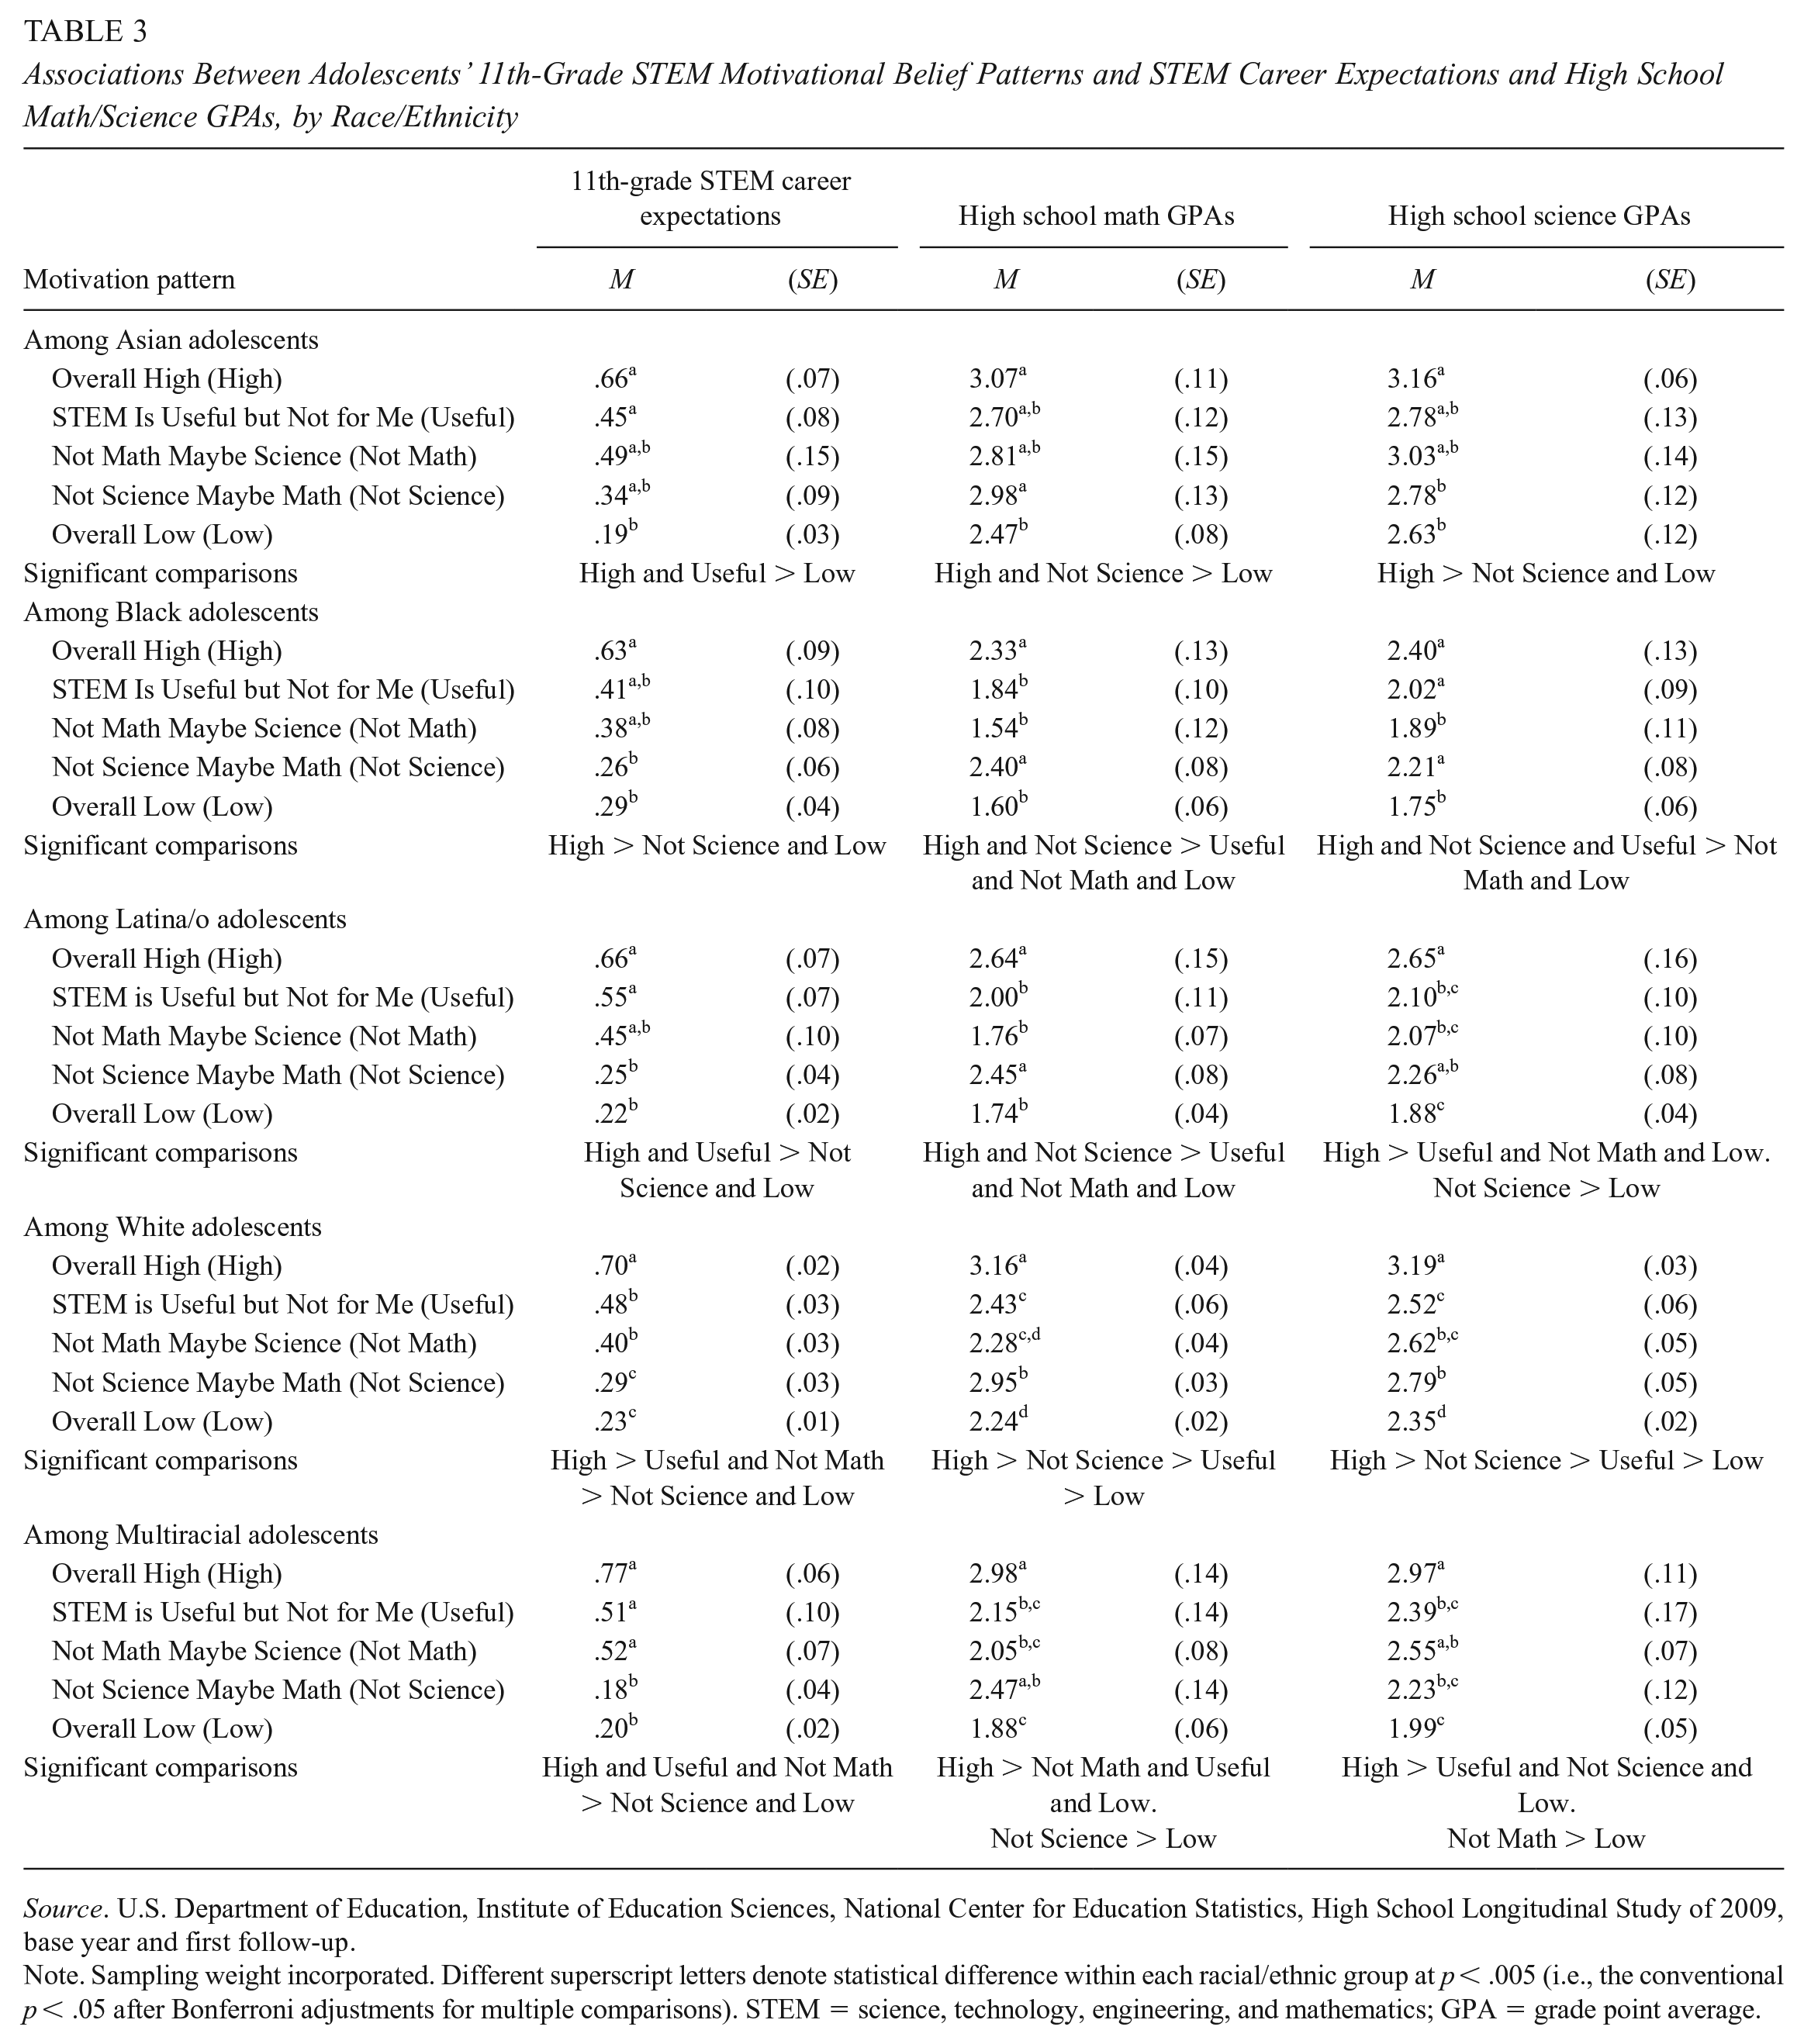
Associations Between Adolescents’ 11th-Grade STEM Motivational Belief Patterns and STEM Career Expectations and High School Math/Science GPAs, by Race/Ethnicity
Source. U.S. Department of Education, Institute of Education Sciences, National Center for Education Statistics, High School Longitudinal Study of 2009, base year and first follow-up.
Note. Sampling weight incorporated. Different superscript letters denote statistical difference within each racial/ethnic group at p < .005 (i.e., the conventional p < .05 after Bonferroni adjustments for multiple comparisons). STEM = science, technology, engineering, and mathematics; GPA = grade point average.
There were several significant differences in adolescents’ STEM career expectations across the five motivational belief patterns. The Overall High pattern had the highest percentage of adolescents reporting STEM-related career expectations (ranging from 63% of Black adolescents to 77% of Multiracial adolescents) compared with the other patterns for all five racial/ethnic groups. Black, Latina/o, White, and Multiracial adolescents in the Not Science Maybe Math or Overall Low pattern had the lowest STEM career expectations (18%–29%) compared with their same-racial/ethnic peers. In contrast, the Not Math Maybe Science pattern had a moderate percentage of adolescents (38%–52%) who expected a STEM career. Last, adolescents in the STEM Is Useful but Not for Me pattern had STEM career expectations as high as those in the Overall High pattern for all racial/ethnic groups except White adolescents (41%–55%). In summary, STEM career expectations were highest among adolescents in the Overall High or STEM Is Useful but Not for Me pattern in 11th grade, whereas those in the Not Science Maybe Math or Overall Low pattern tended to have the lowest STEM career expectations; these findings held for most, but not all, racial/ethnic groups.
Adolescents’ math and science motivational belief patterns at 11th grade were also associated with their math and science GPAs (Table 3). For all five racial/ethnic groups, adolescents in the Overall High pattern had the highest math and science GPAs (math, 2.33–3.16; science, 2.40–3.19), whereas adolescents in the Overall Low pattern had the lowest math and science GPAs (math, 1.60–2.47; science, 1.75–2.63). For all racial/ethnic groups except White, adolescents in the Not Science Maybe Math pattern had math GPAs (2.40–2.98) as high as those in the Overall High pattern (2.33–3.16). The differences in science GPAs, however, were more complex. Black and Latina/o adolescents in the Not Science Maybe Math pattern had science GPAs as high (2.21 and 2.26, respectively) as their same-race/ethnicity peers in the Overall High pattern (2.40 and 2.65, respectively). Asian and Multiracial adolescents in the Not Science Maybe Math pattern, however, had science GPAs as low (2.78 and 2.23, respectively) as their same-race/ethnicity peers in the Overall Low pattern (2.63 and 1.99, respectively). White adolescents in the Not Science Maybe Math pattern had science GPAs (2.79) in between that of those in Overall High (3.19) and that of those in Overall Low (2.35). Table 3 also shows other race/ethnicity–specific nuances. For example, although White, Latina/o, and Multiracial adolescents in the pattern had lower science GPAs (2.52, 2.10, and 2.39) than their same-race/ethnic peers in the Overall High pattern, that was not the case for Asian and Black adolescents (2.78 and 2.02). In summary, adolescents in the Overall High and Overall Low patterns in 11th grade had, respectively, the highest and lowest math and science GPAs; adolescents in the Not Science Maybe Math pattern generally also had the highest math GPAs. The differences in GPAs for adolescents in the other motivational patterns varied by racial/ethnic group.
Discussion
Math and science are increasingly critical for societal advancement and our daily lives; however, stark racial/ethnic disparities in STEM remain. Thus, it is crucial to understand the development of math and science motivational beliefs among adolescents from different racial/ethnic groups. Currently, there is a disconnect between theory and existing findings such that the examination of motivational belief patterns is called for. Few studies to date chart the changes in these patterns and the extent to which these patterns vary across racial/ethnic groups. To this end, we found four and five patterns of math and science motivational beliefs among racially/ethnically diverse adolescents in 9th and 11th grades, respectively. We also charted the stability and changes in those patterns from 9th to 11th grade as well as examined the extent to which patterns at 11th grade were associated with adolescents’ STEM career expectations and their math and science GPAs.
Theoretical Contributions
The patterns of adolescents’ math and science motivational beliefs supported some basic theoretical tenets and provided additional nuances to consider. First, the Overall High and Overall Low patterns aligned with situated expectancy-value and dimensional comparison theories that emphasize similarities across beliefs and across math and science (Denissen et al., 2007; Eccles, 2009; Eccles & Wigfield, 2020). Though these two patterns accounted for up to 63% of adolescents within each racial/ethnic group, around 40% of adolescents reported a different pattern: a pattern where their math and science motivational beliefs varied. For example, in contrast to dimensional comparison theory, we found patterns characterized by domain differentiation (Not Math Maybe Science and Not Science Maybe Math), which together accounted for 24% to 32% of the adolescents in 11th grade. The presence of these domain-specific patterns and overall high/low patterns helps explain the mixed correlations between math and science motivational beliefs in a recent meta-analysis (Möller et al., 2020). In sum, although the various motivational beliefs and domains aligned for some adolescents, there was differentiation among the various motivational beliefs or domains for a sizeable proportion of adolescents.
Adolescence is a period marked by complex developmental systems and growth in identity and autonomy (National Academies of Sciences, Engineering, and Medicine, 2019), all of which could contribute to unique, intricate motivational patterns. For example, adolescents in the Not Who I Am pattern had lower math and science attainment values compared with their other motivational beliefs, which aligns with scholarship highlighting the importance of domain-based identity beliefs during adolescence (Archer et al., 2010; Aschbacher et al., 2010; Eccles & Wigfield, 2020; McGee, 2013; Svoboda et al., 2016; Tan et al., 2013). The current study contributes to understanding complex developmental processes by leveraging modern analytical approaches (LCA and LTA; Ing & Nylund-Gibson, 2017; Lazarides et al., 2020) and by exploring nuances within and between racial/ethnic groups.
A second contribution was charting the changes in adolescents’ motivational patterns over time. As expected, stability was most common among the three patterns that emerged at both grade levels; 46% of the Not Science Maybe Math pattern, 54% of the Overall High pattern, and 70% of the Overall Low pattern evidenced stability. Though many adolescents had stable patterns over time, there were other developmental changes. For example, 4% to 23% (depending on adolescents’ race/ethnicity) of adolescents switched from Overall High to Overall Low over time. Additionally, 20% to 36% of the Not Who I Am pattern and 21% to 39% of the Not Science Maybe Math pattern in 9th grade changed into the Overall Low pattern in 11th grade. Both of these changes align with the finding that STEM motivational beliefs typically decline during adolescence (Denner et al., 2019; Jacobs et al., 2002; Musu-Gillette et al., 2015). It should also be noted that we observed positive changes, such as the 12% of adolescents (across race/ethnicity) in the Not Who I Am and Not Science Maybe Math patterns who shifted upward to the Overall High pattern; documenting such positive changes is a contribution to the literature that often emphasizes declines.
One type of change that has not been emphasized in the literature is that some adolescents showed increased domain-specialization. The Not Science Maybe Math pattern emerged in both grade levels, and an additional domain-specialized pattern emerged in 11th grade, namely, Not Math Maybe Science. These findings extend dimensional comparison theory by suggesting that some adolescents hold more specialized beliefs of these two near subjects (Helm et al., 2016; Jansen et al., 2015), which may, in part, result from gaining a deeper understanding of these subjects over time. Across all five racial/ethnic groups, Black adolescents showed the largest proportion reporting a domain-differentiated pattern in 11th grade (i.e., 32% Black adolescents as compared with 24% to 27% of adolescents from the other racial/ethnic groups). A future direction would be to understand the factors that contribute to developing clear distinctions in math versus science motivational beliefs.
Race/Ethnicity
Throughout our analyses, we focused on within-group nuances while also attending to unique findings across groups. We also included Multiracial adolescents, who are often excluded in prior studies or combined with other minority group (Nishina et al., 2021). Our focus on within-group analyses help identify positive, often underrecognized processes that can demystify racially or ethnically based stereotypes or overgeneralizations. For example, we found that the proportion of Black adolescents who remained in the Overall Low pattern from 9th to 11th grade was similar to that of Asian adolescents (62% and 61%), which was lower than those of Latina/o, White, and Multiracial adolescents (69%–75%). More studies highlighting the strengths and supports of Black adolescents who show positive changes in their motivational beliefs are needed in order to balance out studies that focus on their marginalization and to collectively describe a more comprehensive picture of their STEM motivational belief development (Collins, 2018). As another example, 65% of Asian adolescents reported the Not Who I Am or Overall Low patterns in 9th grade, which counters the model-minority stereotype and enriches the current literature that tends to disproportionally narrate only the “successful STEM stories” of Asian Americans (Chen & Buell, 2018; McGee, 2018). To better understand such under-studied variations, more strength-based studies are needed to understand the processes that underlie these complex motivational patterns that are richer than just average decline.
Limitations and Future Directions
A major contribution of the current study is charting the changes in adolescents’ motivational patterns from 9th to 11th grade. Though high school is a critical juncture, it represents only one segment of individuals’ STEM journeys (Jacobs & Simpkins, 2005; Maltese & Tai, 2011). Thus, a future direction is to examine changes in these motivational patterns before and after high school. Moreover, the current study did not examine what predicts the changes in these motivational patterns. Thus, future directions include understanding what supports help adolescents counter the racial/ethnic stereotypes and structural barriers in STEM as well as examining the structural and systemic factors that fail students. For example, we observed that almost 1 in 4 Latina/o adolescents switched from Overall High to Overall Low in high school. How might this change relate to the negative dynamics that marginalized students face in STEM (McGee, 2016)? Finally, it will be important to understand what supports help adolescents move away from Overall Low to more positive STEM patterns. Prior work has identified multiple sources of support that could be leveraged to promote adolescents’ STEM motivational beliefs, including school, families, peers, and out-of-school programs; thus, a future direction is to examine which contextual supports predict changes in adolescents’ motivational patterns (e.g., Rice et al., 2013; Simpkins et al., 2019; Young et al., 2017).
Another strength of the current study was that we examined adolescents’ motivational beliefs in two domains simultaneously. Although we identified two patterns characterized by domain specialization, many questions remain unanswered. To further employ dimensional comparison theory, it is also important to examine more domains that range in nearness with STEM, such as relatively far domains, like humanities, and relatively near domains, like psychology. Relatedly, there are ample nuances among the multiple domains within science (Hsieh et al., 2019; M.-T. Wang et al., 2017). The differentiation within science domains might be increasingly crucial as disparities within STEM widen. Overall, the increase in breadth and depth of domains might be particularly important to consider during developmental stages, such as college, when individuals face greater number of specialized options.
Last, although attention to race/ethnicity is at the core and a strength of the current study, our approach is not without limitations. Our decision to examine only the five numerically largest racial/ethnic groups is in no way intended to further marginalize Native American and Pacific Islander adolescents. As such, although the data set that we drew from is nationally representative, the exclusion of Native American and Pacific Islander adolescents in the main analyses makes our findings not nationally representative particularly in regard to how adolescents’ 11th-grade patterns were associated with their STEM outcomes. Relatedly, we examined racial/ethnic categories, which are different from racial/ethnic identities. Although racial/ethnic groups are convenient grouping categories, racial/ethnic identities speak to the more nuanced lived experiences that shape individuals’ STEM motivational beliefs. This call to examine racial/ethnic identities is especially important for Multiracial adolescents, a group that encompasses substantial heterogeneities. For example, Black/Asian biracial adolescents and White/Asian biracial adolescents are both Multiracial, but their different intersectional racial identities (Harris, 2016) may have implications for how they position themselves or how others position them in STEM. The label Multiracial erases out such complexities. Furthermore, Multiracial adolescents might demonstrate multiracial identity flexibility, meaning that even Multiracial adolescents with the same racial makeup could experience different identities depending on context (Gaither, 2015), which again could have implications for their STEM experiences. In sum, a future direction is to move from broad racial/ethnic categories to the nuances of individuals’ racial/ethnic identities, which can capture adolescents’ social positions as continuous and elaborate constructs instead of single-dimensionally.
Conclusion
Guided by situated expectancy-value and dimensional comparison theories, we examined the patterns of adolescents’ math and science Motivational beliefs among Asian, Black, Latina/o, White, and multiracial adolescents. Beyond patterns characterized by all high or low beliefs, we also identified patterns characterized by differing motivational beliefs, including differences across domains (e.g., Not Math Maybe Science) and differences across motivational beliefs (e.g., STEM Is Useful but Not for Me). These patterns showcase the complexities and nuances that pattern-centered approaches uncover and contribute to our understanding of adolescents’ math and science motivational belief development. We also examined the changes in these motivational patterns from 9th to 11th grade, highlighting that stability is a common path yet far from the complete picture. For example, we found several trends toward domain differentiation. Last, we showed that the patterns of 11th grade math and science motivational beliefs were associated with varying levels of STEM career expectations and high school math and science GPAs. Overall, our findings have implications for understanding the development of math and science motivational beliefs during high school for Asian, Black, Latina/o, White, and Multiracial adolescents.
Supplemental Material
sj-docx-1-ero-10.1177_23328584221083673 – Supplemental material for The Patterns of Adolescents’ Math and Science Motivational Beliefs: Examining Within–Racial/Ethnic Group Changes and Their Relations to STEM Outcomes
Supplemental material, sj-docx-1-ero-10.1177_23328584221083673 for The Patterns of Adolescents’ Math and Science Motivational Beliefs: Examining Within–Racial/Ethnic Group Changes and Their Relations to STEM Outcomes by Ta-yang Hsieh and Sandra D. Simpkins in AERA Open
Footnotes
Funding
This study is supported by National Science Foundation Grant DRL-1760757 (“Family Support of Math and Science: Examining an Untapped Source of Resilience for Diverse High School Students”) awarded to S. D. Simpkins (principal investigator) and J. Eccles. We thank the members of Project REACH, the first author’s dissertation committee, and three anonymous reviewers for their feedback. Particular thank you to Kayla Puente, Christy Starr, and Josh Dorman for their technical assistance.
Notes
Authors
TA-YANG HSIEH, PhD, is a research scientist at Search Institute, an applied research nonprofit organization that focuses on positive youth development. Her research interests include academic motivation and organized after school activities.
Sandra D. Simpkins, PhD, is a professor at the University of California–Irvine School of Education. She is an expert in youth’s motivation to pursue science, technology, engineering, and mathematics and organized after-school activities and family influences on these choices, particularly for underrepresented minorities and youth from disadvantaged backgrounds.
References
Supplementary Material
Please find the following supplemental material available below.
For Open Access articles published under a Creative Commons License, all supplemental material carries the same license as the article it is associated with.
For non-Open Access articles published, all supplemental material carries a non-exclusive license, and permission requests for re-use of supplemental material or any part of supplemental material shall be sent directly to the copyright owner as specified in the copyright notice associated with the article.