
Abstract
Drawing on Bachrach and Baratz’s first and second faces of interest group power, we explore the relationship between teachers’ union power and reopening decisions during the fall 2020 semester in 250 large districts around the United States. We leverage a self-collected panel data set of reopening decisions coupled with measures of teachers’ union first face power (drawn from social media postings on teachers’ unions’ Facebook pages) and second face power (operationalized as district size, whether the school district negotiates a collective bargaining agreement with the teachers’ union, the length of the collective bargaining agreement, and the amount of revenue raised by the union). We found that school districts where teachers’ unions exhibit strong second face power (but not first face power) were less likely to start the school year with in-person instruction, were less likely to ever open during fall semester with in-person instruction and spent fewer weeks in in-person learning.
The COVID-19 pandemic has stretched education governance systems as state, district, and school leaders strive to set forth new expectations for schooling in the midst of an unprecedented crisis. At the start of the 2020–2021 school year, many state and local decision makers, including state boards of education and local school boards, proposed school reopening plans that provided some in-person instruction with the hope of alleviating the stresses of virtual school on students and parents (Goldstein & Shapiro, 2020). As education leaders announced their plans to return students to classrooms, some teachers and teachers’ unions pushed back, often citing fears for their own or their students’ safety (Goldstein & Shapiro, 2020; Will, 2020). These acts of resistance took on different forms in the late summer and early fall of 2020. For example, the United Federation of Teachers organized a protest against New York’s plan to return to in-person instruction (Rosner & Lapin, 2020; Will, 2020). Other unions filed lawsuits, including the Orange County Classroom Teachers Association who claimed the district refused to negotiate details of their reopening plan (Postal, 2020). Even after the 2020–2021 school year officially started, many districts’ plans were still under negotiation with local teachers’ unions. For example, the Chicago Teachers Union continued to negotiate the terms of the district’s plan well into February 2021.
The dynamic nature of the COVID-19 infection rates coupled with the localized nature of reopening decisions (vs. state or federal reopening mandates) set the stage for an ever-evolving school reopening situation throughout fall 2020. Prior papers establish the relationship between teachers’ unions’ strength and initial fall 2020 district reopening decisions (DeAngelis & Makridis, 2021; Grossmann et al., 2021; Harris et al., 2021; Hartney & Finger, 2021). For example, Hartney and Finger (2021) examined the relationship between political and market factors and reopening decisions at the beginning of fall semester. They found that the political factors, including county partisanship and teachers’ union strength, more so than the changes in COVID-19 infection rates or the accessibility of private school options, were the strongest predictors of reopening for in-person instruction at the start of the fall semester. DeAngelis and Makridis (2021) showed similar results. However, both papers utilized indirect measures of teachers’ union strength—Hartney and Finger (2021) proxied for union strength with district size, and DeAngelis and Makridis (2021) utilized professional worker unionization rates that were not specific to teachers’ unions. Harris et al. (2021) defined union power based on the share of school districts with different collective bargaining statuses (no bargaining agreement, meet-and-confer agreement, and collective bargaining agreement [CBA]). They found that fewer schools started the fall 2020 semester with in-person instruction in counties with a larger share of districts operating under CBAs. Grossmann et al. (2021) utilized a measure of CBA restrictiveness from Michigan and found that restrictiveness coupled with political partisanship were associated with the increased likelihood that Michigan school districts started the year in remote learning.
In this article, we expand on these findings in a few ways. First, existing research has focused primarily on the initial reopening decisions at the beginning of the fall 2020 semester. Yet, teachers’ unions likely sought to shape not only instructional decisions at the start of the school year but also those decisions that occurred later on. Consequently, we concentrated not only on initial reopening decisions in fall 2020 but also tracked decisions throughout the duration of the fall semester. Second, we employed more nuanced theoretical-based measures of union strength than prior work based on the first and second faces of interest group power (Bachrach & Baratz, 1962). A group’s first face power is reactive and comes from their ability to forcefully argue their position and win policy disagreements. Second face power is more proactive in nature compared with first face power and comes from a group’s position to set the policy agenda and anticipate the support of policy makers (Finger, 2019). By employing measures for both faces of power, we explore not only whether teachers’ union power is associated with reopening decisions but also how (i.e., whether the proactive [second face] and/or reactive [first face] actions of teachers’ unions are related to policy decisions). Specifically, in this study we asked, what is the relationship between teachers’ unions’ first and second face power and school district reopening decisions during the fall 2020 semester? We note that we are neutral on whether schools should open for in-person instruction during the COVID pandemic and instead focus on explaining factors related to reopening decisions.
To answer this question, we assembled a novel database that tracked the reopening decisions of 250 districts throughout the United States, including the five largest districts in every state based on student enrollment. We measured local teachers’ union second face power by capturing (1) the size of the district, (2) whether the school district negotiates a CBA with a teachers’ union, (3) the length of the CBA, and (4) the amount of revenue the local union generates annually. We captured first face power by measuring the efforts the union engaged in to try to influence reopening plans as detailed through a content analysis of union Facebook pages. We ran several regression models to analyze the relationship between these different measures of union power and districts’ reopening decisions throughout the fall 2020 semester.
Previous Literature on Teachers’ Unions’ Political Influence
Scholars and policy makers have repeatedly ranked teachers’ unions as one of the most influential groups in education (Moe, 2005; Thomas & Hrebenar, 1999, 2004). Teachers’ unions aim to represent the interests of their members and are able to advocate for teacher policy preferences in a couple of ways (Moe, 2006; Thomas & Hrebenar, 2004). First, teachers’ unions negotiate CBAs with school district administrators. Forty-four states permit collective bargaining, and these contract negotiations provide a venue for teachers’ unions to exert considerable influence on a variety of local education policy decisions (Marianno et al., 2021; Moe, 2009; Strunk & Grissom, 2010). CBAs can cover a broad range of issues from the allocation of district funds to the basic day-to-day duties of teachers (Ballou, 2000; Strunk et al., 2018). Researchers have found that districts with strong teachers’ unions offer teachers higher salaries, smaller class sizes, and longer planning periods—all policies that are negotiated into CBAs (e.g., Hoxby, 1996; Rose & Sonstelie, 2010; Strunk, 2011).
In addition, teachers’ unions can influence education policy decisions through direct lobbying of lawmakers and contributions to election campaigns (Marianno, 2020; Moe, 2011). Finger (2018) found that teachers’ union power, as operationalized by teachers’ union membership rates, was associated with a lower probability of states enacting performance pay policies. Other studies show that teachers’ union power was associated with narrower sets of charter school policies (Shober et al., 2006) but not the prevention of new reforms under No Child Left Behind (Shelly, 2008). Marianno (2020) showed that legislatures in states where teachers’ unions expend more campaign resources relative to opposing groups enact more favorable state-level teacher policies.
This study takes another look at teachers’ unions’ policy influence, this time investigating school district reopening decisions during the COVID-19 pandemic. While school reopening decisions are not directly in the purview of collective bargaining negotiations, they are also not wholly independent. Many of the changes proposed in the reopening and closure of schools required changes to teacher working conditions thereby placing teachers’ unions in a position to influence school reopening through bargaining negotiations (Hemphill & Marianno, 2021). And even when school reopening plans did not impact a negotiated agreement, teachers’ unions still had a vested interest in shaping reopening plans, as already mentioned. Because school reopening decisions were largely left to local school boards and district administrators versus state executives or policy makers (Grossmann et al., 2021), this placed teachers’ unions in a prime position to utilize their power to shape whether and how schools reopened.
Theoretical Framework: Teachers’ Unions and the Two Faces of Power
Bachrach and Baratz’s (1962) conceptualization of first and second face power expounded on Dahl’s (1957) argument that “A has power of B meaning that A’s behavior regularly causes B to do something that B would not otherwise do” (pp. 202–203). The theory of first and second face power puts forward the idea that political actors outwardly participate in policy decision-making processes to try to influence policy proposals and outcomes and do so through two main mechanisms—one that is more proactive in nature and one that is more reactive in nature. The second face of power is proactive and is accomplished when an interest group is powerful enough to establish allies that put forward policy proposals that represent the interest group’s main priorities without requiring a forceful response from the interest group. This generally occurs as policy makers perform the calculus that a group is so influential that cooperating with the group and adopting the group’s favored ideas is in their best interest. Once responsive to the interest group’s position, these allies align their political values with those of the interest group, and thus effectively do the bidding of the interest group when determining which policies to put forward and which policies to enact. The result is a policy agenda that ignores proposals that are contrary to the interest group’s position and favors those that are in alignment (Baumgartner et al., 2009).
Sometimes a group’s second face power is not sufficient to control the policy agenda and unfavorable policy proposals are put forward that run contrary to the interest group’s position. In these situations, an interest group may seek to exercise their first face of power. The first face of power includes reactive measures to policy proposals once those policies are on the agenda. In the case of interest groups, these may include work stoppages like strikes or sickouts, protests, litigation, forceful public statements, and information campaigns. In short, if an interest group does not have access to second face power mechanisms, they can use strategies that rely on first face power to try to influence policy decisions.
Bachrach and Baratz’s (1962) two faces of power theory has been referred to often in political science literature, but it has been primarily used in theoretical pieces about group power and less often in empirical studies (Dowding, 2011). It has been called on to explain policy processes in public sectors including affordable housing, human rights, sustainability, and education. Zaaiman and Mupambwa (2021) used the faces of power framework to demonstrate the multidimensional nature of power between various stakeholders (i.e., regional planning group, local politicians, community members, and housing contractors) that contributed to the stalling of the affordable housing initiative in Khutsong, South Africa. Additionally, Arts (2003) demonstrated how the first face of power was utilized by the International Union for the Conservation of Nature and Natural Resources (IUCN) to influence the Convention of Biological Diversity.
The theoretical framework has also been applied to a sample of education policy studies. Maxcy (2011) used the framework to explain the emergence of performance accountability policies in the late 2000s. Maxcy noted that after the accountability policies were enacted, teachers had more first face power because they often had more flexibility in the curriculum they used, but the administrators and district had increased second face power because they set the priorities and the goals for the district that the teachers were required to meet. Finger (2019) analyzed the impact of first and second face teachers’ union power on education policy outcomes. She found that second face power (union membership rates), was related to policy passage and proposal rates, whereas measures of first face power (campaign contributions) were not.
The dearth of empirical applications of Bachrach and Baratz’s (1962) theory presents a new opportunity here to leverage school reopening decisions during the pandemic to understand how interest group power is associated with policymaking. Bachrach and Baratz’s (1962) argued that policy actors can draw on multiple methods to influence policy, and researchers can overlook a groups’ influence if they only examine one method. Therefore, it is important to capture both the first and second face power mechanisms as they relate to policy outcomes.
Teachers’ Unions and the First and Second Faces of Power
Due to the local nature of COVID-19 school reopening plans, we argue that teachers’ unions’ second face power partly resides in their opportunity to negotiate CBAs with school district management. When members from the teachers’ union have a seat at the bargaining table, they have a voice in policies that affect working requirements for their teacher membership, and thus the opportunity to proactively shape a school district’s policy agenda. Because CBAs dictate almost all aspects related to teachers’ responsibilities including professional development requirements, required work hours and breaks, classroom assignments, and evaluations, unions policy influence can be quite expansive (Ballou, 2000; Goldschmidt & Stuart, 1986; Marianno et al., 2021; Moe, 2009; Strunk & Reardon, 2010). Once negotiated, CBAs go before the school board for final ratification. Not surprisingly, teachers’ unions also exert second face power here because they actively campaign for district school board members by encouraging their members to get out and vote in school board elections, contributing campaign funds to candidates, and distributing informational materials in school board elections to recruit allies that will sit on the other side of their collective bargaining negotiation table (Moe, 2006). Strunk and Grissom (2010) found that district’s with more powerful teachers’ unions (as perceived by school board members) negotiated more restrictive contracts, where restrictiveness was defined as the degree to which a given contract places boundaries on the flexibility of administrators to determine teacher working conditions. Prior research suggests contracts change only marginally over time and take some time to build in strength (e.g., Cowen & Fowles, 2013; Ingle & Wisman, 2018)—thus, the strength of these agreements likely reflect long-standing relationships between teachers’ unions and school districts.
Nevertheless, while the local nature of school reopening decisions in reaction to COVID-19 placed the decisions in a realm where teachers’ unions could leverage their longstanding relationships to have second face power, the dynamic nature of the COVID-19 pandemic may have presented some challenges in using these relationships. In particular, the unprecedented nature of a once-in-a-century global pandemic and the changing nature of the federal and state pandemic responses created some uncertainty around school reopening decisions. As traditional school board meetings were disrupted and moved virtual, face-to-face communication channels had to change. Directives from federal and state leaders sometimes changed with little warning, making it more difficult for unions to anticipate policy responses. In short, unions may have needed to revert to strategies that called upon their first face power to argue their policy position and pushed back on district actions that ran contrary to their interests. The first face power methods that unions employed in the summer and fall of 2020 included protests, broadcasting official statements from union leadership, conducting member surveys, and filing lawsuits to push back against unfavorable reopening plans. Gathering survey data from union members about their opinions regarding remote school and broadcasting those results helps unions define their policy position and present evidence showing how many of their members either agree or disagree with the current policy decision. Strategies such as public protests and official policy statements illustrate a group’s first face power because they are actions where the union presents their own policy position and where they seek to gain support to ultimately win a policy battle. Lawsuits offer a more extreme example of the teacher’s union trying to reverse policies. Unions that did not have collective bargaining laws or strong second face power may have also engaged in these first face power strategies if they knew they could not rely on school board allies to represent their interests.
The unique circumstances surrounding COVID-19 reopening plans present an opportunity to unpack the type of power unions rely on when they attempt to shape education policy. The suddenness and novelty of the crisis puts teachers’ unions’ second face power to the test to see if their allies know their interests and adequately represent them, or if these connections become unreliable and force unions to rely on first face power methods by mobilizing their members to block undesirable policy proposals.
Data
We combined several sources of data to capture the relationship between first and second face teachers’ union power and school reopening decisions throughout the fall 2020 semester.
In order to understand the potential impact of mobilization efforts on reopening decisions, we chose to limit our sample to 250 school districts representing 48% of the total number of students enrolled in public schools across the United States. We created the sample by selecting the five largest districts in each state based on student enrollment. Because Hawaii operates as a single district and because we included Washington, D.C., this brought our total number of districts to 247. We subsequently added the next largest districts in any state, which added districts from California, Florida, and Texas to reach our total of 250 school districts.
Our sample has a few key advantages. Because we selected multiple districts from each state, we can make between-district comparisons on a national scale. Additionally, by including the most populated districts in each state, we can study reopening decisions in urban districts that regionally experienced relatively high concentrations of COVID-19 cases. These districts should be the ones most responsive to the severity of the pandemic. Finally, urban districts are typically characterized as having the strongest CBAs and most active teachers’ unions (Marianno et al., 2018; Olin, 2020; Winkler et al., 2012). Thus, we are not only studying reopening in locations where the pandemic was more severe but also where teachers’ unions are more active. This also means that the union strength measures are easier to construct. Large districts are more likely to maintain updated websites with information on their school reopening plans and their current CBAs. Large unions are more likely to keep active Facebook pages and file IRS 990 tax forms on their annual revenue. While this sample has its strengths, it also has a limitation. Our findings are not generalizable to all districts in the United States, just the largest with the most active unions and the highest pandemic severity.
Measures of Second Face Power
Second face power measures should capture the strength of a group’s position to set the policy agenda and anticipate the support of policy makers. We utilized four measures of second face power.
District Size
Prior research finds that larger school districts have stronger teachers’ unions (e.g., Rose & Sonstelie, 2010). Larger districts employ more teachers (i.e., more potential union members) that make unionization easier to accomplish. With large membership bases, unions have significant influence over the supply of teacher labor to school districts and with that influence can exert more pressure on school districts to align their policy interests with those of the union. Additionally, unions with large membership represent a significant voting block to influence the outcomes of school board elections, and thus put in place allies who would ratify their CBAs. Because measures of local union membership are difficult to come by, we measured district size by the number of students in the school district (natural logged for inclusion in the models).
Collective Bargaining Agreement
One of our measures of second face power is a dichotomous indicator for whether the school district has a CBA. Collective bargaining creates a direct channel for teachers’ unions to influence reopening plans as many of the working condition changes required by the movement from in-person to remote instruction or from remote back to in-person instruction are required to be negotiated with teachers’ unions (Hemphill & Marianno, 2021). Collective bargaining gives teachers’ unions a legal voice in policies that affect working requirements for their teacher membership, and thus the opportunity to proactively shape a school district’s policy agenda.
In our 250-district sample, we located the CBA for all 160 districts in states that require administrators engage in collective bargaining with employee groups. We also procured CBAs for 24 of the 40 districts in states that permit administrators and employee groups to engage in collective bargaining but do not require it. For the remaining 16 districts in this group, we verified that teachers in these districts were not covered by a CBA (by contacting the district directly and through media sources). Consequently, the 187 districts for which we have a CBA represent the totality of the districts in our sample of 250 that have an active CBA.
Collective Bargaining Agreement Length
Our third measure of second face power is more specific to school districts with a CBA and is operationalized as the page length of CBA. We use the length of the CBA as a proxy for a more formal measure of CBA restrictiveness, a common measure of teachers’ union strength in the research literature, and one that captures the degree to which contracts favorably represent teachers’ interests (e.g., Grossmann et al., 2021; Marianno & Strunk, 2018; Strunk & Reardon, 2010). Generating a formal measure of CBA restrictiveness is labor intensive as it involves the detailed content analysis of the agreements (Strunk & Reardon, 2010); however, past work on the measure shows that the length of the agreement is positively and moderately correlated with restrictiveness at 0.43 (p < .001) (Marianno & Strunk, 2018). We note that page length is not a perfect proxy for restrictiveness as both school districts and teachers’ unions are interested in placing language in the CBA that would extend the length of the agreement but not necessarily change its overall restrictiveness. However, if we assume that school district administrators prefer the flexibility to define and change teacher working conditions, then extending the length of an agreement by adding in additional language is likely not the preferred condition for district administrators. When district leaders secure language in the contract, a more permanent policy condition is created such that any future changes must now be negotiated with the union. The mandate to negotiate does not exist if an agreement is silent on an issue. Thus, even when district administrators add language to the contract, it may be in reaction to or anticipation of a union striving to define policy on a given bargaining issue. Therefore, we consider CBA page length a suitable, albeit imperfect proxy for CBA restrictiveness. We obtained the district CBAs through The National Council on Teacher Quality (2019) website, the local unions websites, and the local districts websites.
Union Revenue
Stronger unions are also able to generate more revenue through membership dues for union operations (Lott & Kenny, 2013). They can subsequently spend this money to create larger staff and fund membership outreach efforts to grow their ability to represent teachers’ interests. We generated information on union revenue from IRS 990 tax filings. Unions, as nonprofit organizations, are required to file an annual information return that details their annual revenue. If the organization brings in $50,000 or less, they can file a shortened form (e-postcard) that does not include the revenue information. In our sample, we obtained the IRS 990 tax forms for 215 of the 250 districts. The remaining 35 organizations had not filed an IRS 990 form for a number of years and some even had their tax-exempt status revoked. Of the 215 districts for which we located an IRS 990 tax form, 35 made $50,000 or less. In order to retain these unions in the model, we divided the union revenue measure into quintiles with those unions that made $50,000 or less serving as the reference category (and thus, we did not need to assume the exact amount of revenue these unions brought in). Unions in the top quintile brought in between $1,888,000 and $200,000,000. Unions in the second quintile brought in between $580,900 and $1,888,000. Unions in the third quintile brought in between $181,000 and $580,900. Unions in the fourth quintile brought in more than $50,000 and less than $181,000.
Measure of First Face Power
To measure teachers’ unions’ first face power, we assembled a database of Facebook posts spanning the months before and after school reopening decisions. We initially captured teachers’ unions’ Facebook and Twitter posts for this analysis but found that they repeated their posts across platforms. Therefore, we decided to only code the Facebook posts because that is the platform that the majority of teachers’ unions utilized. We archived all Facebook pages from July 1 through December 18 to capture the entire fall 2020 semester and at least a month before any school district in our sample opened.
Berry (1977) outlined four first face power strategies that interest groups utilize to influence a particular situation. The first, and most forceful, is litigation. We scored litigation posts, or those that reflected union-initiated lawsuits regarding COVID-19 protocols and reopening plans, with a value of three. We combined the next two strategies—confrontation and mobilization. Here we coded posts that mentioned scheduled union protests and official public statements from union leadership that came out against a COVID-19 reopening proposal or protocol. These posts were scored with a value of two. Finally, groups can engage in informational strategies where they release research reports or information about group members’ opinions to add legitimacy to their claims. We coded information posts as those that included surveys of union membership about members’ opinions regarding fall 2020 school reopening. These were scored with a value of one. From this scoring, we created a continuous first face power measure that is a summation of a union’s weekly posting score that ranges from 0 (if they had no posts) and 8 (if they had all of the posts). Examples of each of the four types of posts are displayed in Figure 1.

Examples of first face power in teachers’ unions’ social media posts.
District Reopening Status
We also assembled our own database on the reopening status of our 250 districts each week during fall semester. We found that accurate information on school district reopening status over the course of fall semester was hard to come by from existing large databases of reopening decisions (like the MCH Strategic Data) for most of the districts in our sample. Consequently, we verified the reopening status of each school district in our sample for each week during the fall semester (August 1 to December 18) by searching media reports, school district websites, and school district social media pages for information on school reopening. Because the largest districts in each state are more likely to be covered in media reports or to have readily accessible web pages, we had little trouble verifying districts’ weekly reopening status using this search method. Because many districts reopened schools in phases—often by grade-level—we defined reopening status based on the school option available to first graders in the district. We did this because younger students were often the first to return to in-person schooling. We defined a district’s reopening status as “remote” if first graders learned solely through remote means or “in-person” if first graders spent at least some time in-person during the 5-day week. The hybrid and full in-person instruction categories were collapsed (as done in prior research; Grossmann et al., 2021) due to the small number of districts running hybrid and fully in-person instruction at the start of the school year (54 and 55 districts, respectively).
District Characteristics
Following prior research, we controlled for other key characteristics of districts that may make them more or less likely to reopen (DeAngelis & Makridis 2021; Grossmann et al., 2021; Harris et al., 2021; Hartney & Finger, 2021). First, we controlled for political partisanship as measured by the share of Trump voters in the school district’s county during the 2016 presidential election. 1 We derived these data from the MIT Election Data Science Lab. We accounted for pandemic severity by employing a countywide measure of the 7-day average of COVID-19 hospitalizations per 100,000 residents as collected by the National Center for Research on Education Access and Choice (REACH). We believe the hospitalization rate is a better measure than some other indicators of pandemic severity because it is not reliant on testing availability. 2 We used data from the National Center for Education Statistics to create measures of the percentage of free and reduced-price lunch students, the percentage of Black students, the percentage of Hispanic students, the number of charter schools per 10,000 students, urbanicity (urban or suburban vs. rural), and total per pupil expenditures (natural logged for inclusion in the models). Table 1 contains the descriptive statistics for all outcome and independent variables and Supplemental Appendix Table 1 (available in the online version of this article) shows the bivariate correlations.
Summary Statistics

Note. CBA = collective bargaining agreement; FRL = free and reduced-price lunch.
Analysis
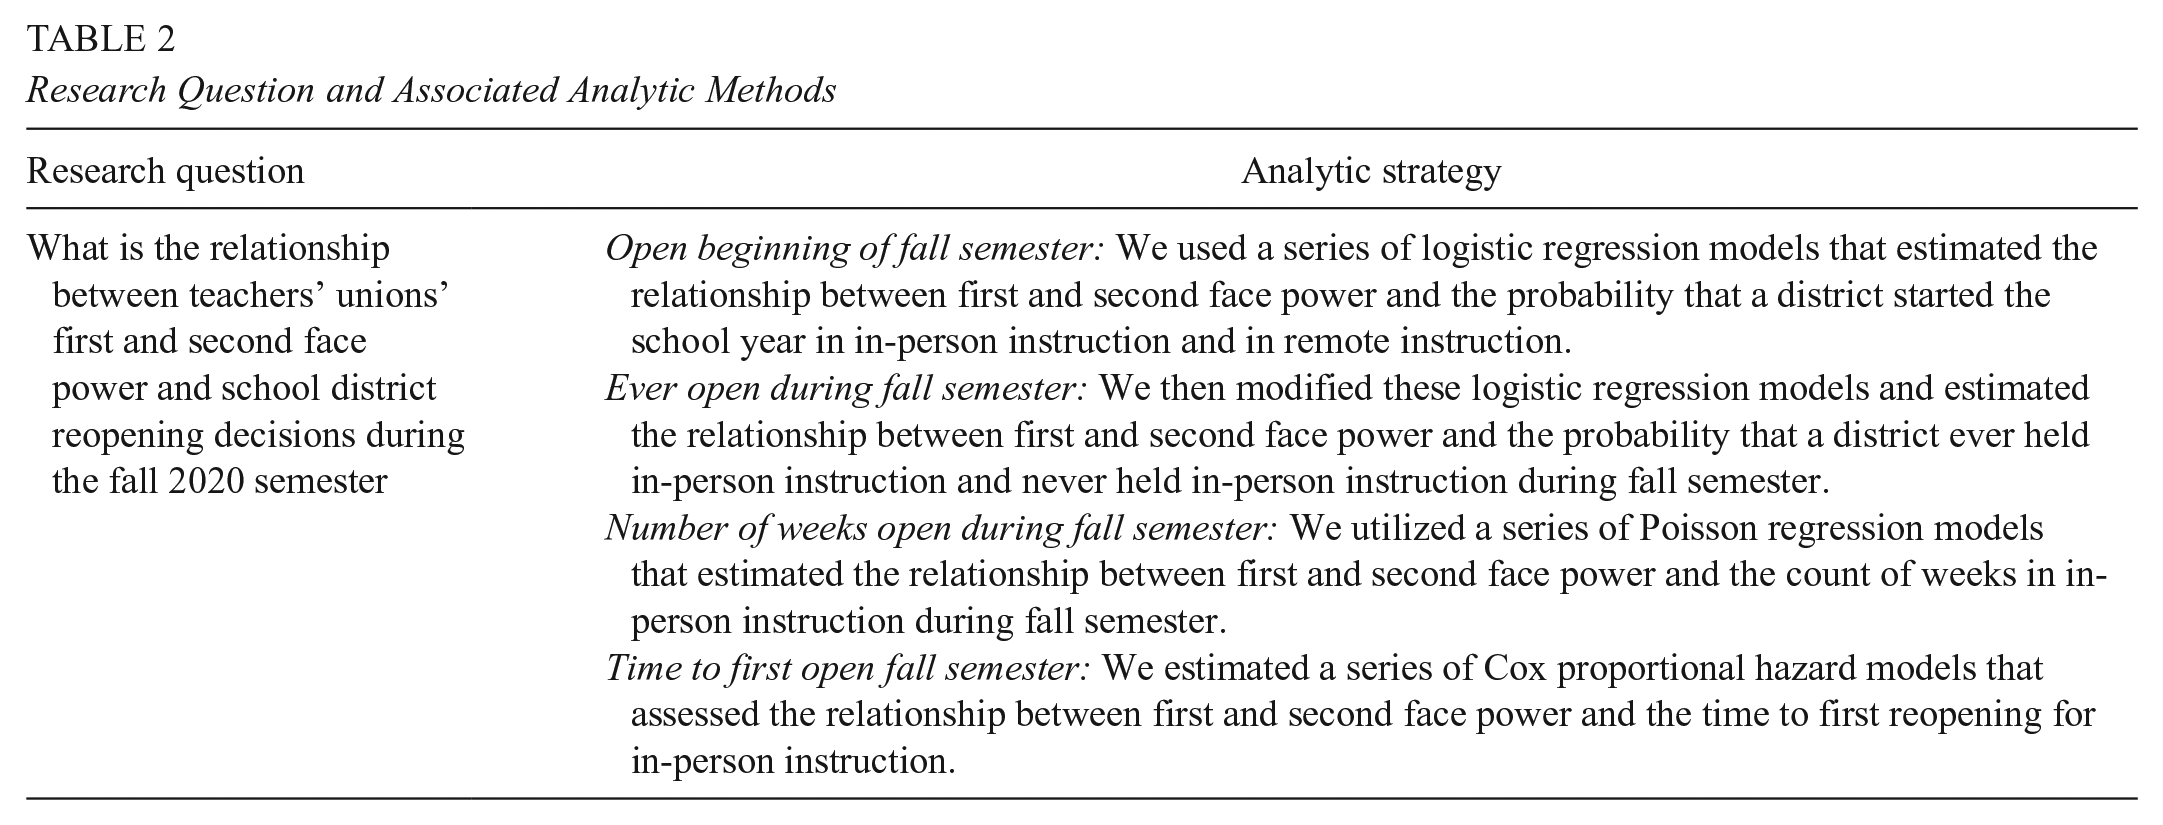
Table 2 shows our research question and the analytic methods employed to answer the research question. Ideally, we would be able to randomly assign teachers’ unions to school districts and observe how union power influences the probability of reopening in a hybrid or in-person model relative to remote. Given that this experiment is not feasible, and in an effort to isolate the impact of teachers’ unions on reopening, we try to control for specific differences between districts that might make school reopening more or less likely.
Research Question and Associated Analytic Methods
Logistic Regression Models Predicting Probability of In-Person Instruction at the Beginning of Fall Semester
We started with a series of logistic regression models, where we defined Pds as the probability that a district starts the school year open for first-grade students (we also show a series of models predicting the probability that a district starts remotely for first-grade students). The model estimated the log odds of the probability of an in-person start relative to a remote start as a function of school district characteristics defined by Xds, where (d) indexes districts and (s) indexes states. The full equation was specified as follows:

The district characteristics included partisan politics (the share of Trump votes in the school district’s county during the 2016 presidential election), pandemic severity (the natural log of new COVID hospitalizations per 100,000 residents in the school district’s county), the percentage of free and reduced-price lunch students, the percentage of Black students, the percentage of Hispanic students, charter school competition (the number of charter schools per 10,000 students in the district), urban or suburban location (vs. rural), and total per pupil expenditures (natural log).
Our key independent variables of interest included our four measures of second face teachers’ union power (which we entered separately in individual models) and first face teachers’ union power. 3 Our results are presented as odds ratios. We clustered the standard errors at the state level to account for the fact that our data included multiple districts per state that likely shared some characteristics.
Logistic Regression Models Predicting Probability of In-Person Instruction During Fall Semester
In a divergence from prior research on the topic (DeAngelis & Makridis, 2021; Grossmann et al., 2021; Harris et al., 2021; Hartney & Finger, 2021), we explored a few additional questions about the relationship between teachers’ unions’ power and reopening decisions beyond the start of the fall semester. This is important because teachers’ unions may not only influence reopening decisions at the beginning of the school year but also the ongoing assessment of instructional delivery mode, including when or whether a district that began the school year remote eventually returns students to the classroom and whether a district returns to remote instruction after initiating a full or partial reopening. First, we explored whether teachers’ unions’ first and second face power was related to whether a school district ever opened/never opened in in-person during fall semester. We assessed this by modifying Equation (1) to predict the probability that a district ever opened and never opened for in-person instruction during the fall semester.
Poisson Regression Models Predicting the Number of Weeks of In-Person Instruction
We also explored whether teachers’ unions first and second face power related to the total number of weeks a school district is open in remote learning. To account for the fact these outcome variables were nonnegative integer counts that did not follow a normal distribution, we employed a Poisson regression model. The Poisson regression models estimated the probability of an event y (i.e., weeks in remote instruction),

µ was the mean incidence rate per unit of exposure, where exposure in our study was defined as the number of possible weeks a school district could be open during fall semester (which was a maximum of 20 weeks in our data for a district that started school by the first week of August). Our model predicted incidence rate µds as a function of the key district characteristics mentioned above, where (d) again indexes districts and (s) indexes states:

We presented the results as incidence rate ratios. The Poisson model has the restrictive assumption that the mean incidence rate is equal to the variance of the incidence rate, which was violated in the case of our study. The violation of the assumption does not affect the estimated coefficients but instead affects the standard errors. However, employing robust standard errors relaxes this assumption. With robust standard errors, the Poisson regression typically performs better than the negative binomial estimator (which is also robust to variance assumptions) when utilizing fixed effects (Wooldridge, 2010).
Cox Proportional Hazard Models Predicting the Time to In-Person Instruction
Our final model leveraged the weekly time-series nature of our data by estimating the relationship between union power and the time to first in-person opening. We utilized a series of Cox proportional hazards models of the following form:

We defined the hazard rate that a district reopens for in-person instruction in t + 1 is a function of the baseline hazard rate
The key assumption of the Cox proportional hazard model is the proportional hazards assumption. We checked for proportional hazards by testing whether the log hazard-ratio function is constant over time for each covariate and overall using STATA’s phtest command. We failed to reject the null hypothesis of a zero slope (i.e., constant hazard ratio) for all covariates, with the exception of charter schools per 10,000, which we excluded from the Cox models.
Results
Open Beginning of Fall Semester
We present the results from Equation (1), a series of logistic regression models predicting the probability of opening the fall semester with remote instruction (columns 1–4) and in-person instruction (columns 5–8) for each measure of second face union power in Table 3. The coefficients are presented as odds ratios.
Logistic Regression Models Predicting Probability of Remote and In-Person Instruction at the Beginning of Fall Semester

Note. Clustered standard errors in parentheses. Coefficients are presented as odds ratios. CBA = collective bargaining agreement; FRL = free and reduced-price lunch.
p < .10. *p < .05. **p < .01. ***p < .001.
As shown in column (1) of Table 3, we found that a one log unit increase in school district size was associated with a 136% increase in the probability of opening the school year in remote instruction (p < .01). Column (5) of Table 3 shows that a 1% increase in school district size was associated with a 58% decrease in the probability of opening the school year in in-person instruction. We further found that for school districts that have a CBA, each one page increase in the length of the CBA was associated with a 13% increase in the probability of opening the school year in remote instruction (column [3], p < .01), and a 13% decrease in the probability of opening the school year in in-person instruction (column [7], p < .01). We did not find a statistically significant relationship between having a CBA and the probability of starting the year in remote/in-person instruction, nor did we find a statistically significant relationship between teachers’ union revenue or first face union power and the probability of remote/in-person instructional decisions. 4 Two other district characteristics were predictive of remote/in-person instruction decisions at the start of fall semester—partisanship and the percentage of Hispanic students. Columns (1) and (2) show that a 1 percentage point increase in the percentage of Trump voters in the county was associated with an 8% decrease in the probability of remote instruction (p < .001) (or an 8% increase in the probability of in-person instruction, p < .001). Furthermore, we found that a 1 percentage point increase in Hispanic students was associated with a 2.7% increase in the probability of remote instruction and a 2.6% decrease in the probability of in-person instruction (p < .10).
Ever Open During Fall Semester
We present the results from Equation (1) predicting the probability of never opening and ever opening for in-person instruction during the fall semester in Table 4. We found that a one log unit increase in school district size was associated with a 67% increase in the probability of never opening for in-person instruction during fall semester (column (1), p < .10) and a 40% decrease in the probability of ever opening for in-person instruction (column (5), p < .10). Furthermore, we found that a one-page increase in the length of a district’s CBA was associated with a 0.07% increase in the probability of never opening for in-person instruction (column (3), p < .05), and a 0.06% decrease in the probability of ever opening for in-person instruction. We found that districts with unions in the top quintile of union revenue had a 380% higher likelihood of never opening for in-person instruction (column (4), p < .10) and a 79% lower likelihood of ever opening for in-person instruction (column (8), p < .10) than districts with unions in the lowest quintile of union revenue. We did not find that first face power significantly predicted the probability of never opening and ever opening. We further show in Table 4 that the percentage of Trump voters was associated with a decrease in the likelihood of never opening and an increase in the likelihood of ever opening. Additionally, per pupil expenditures were associated with an increased likelihood of never opening and an increased likelihood of ever opening.
Logistic Regression Models Predicting Probability of Never Opening and Ever Opening for In-Person Instruction During Fall Semester

Note. Clustered standard errors in parentheses. Coefficients are presented as odds ratios. CBA = collective bargaining agreement; FRL = free and reduced-price lunch.
p < .10. *p < .05. **p < .01. ***p < .001.
Number of Weeks Open During Fall Semester
Table 5 presents the results from Equation (2) predicting the expected count of weeks in in-person learning during the fall semester. The model coefficients should be interpreted as incidence rate ratios (IRRs) that compare the occurrence of the number of weeks of in-person instruction for a one unit change in the independent variable. IRRs are obtained by exponentiating the original coefficients (which reflect the expected log number of weeks of remote instruction) obtained from the Poisson regression model. IRR of 1.000 reflect that the rate of occurrence is equal between groups being compared with the independent variable.
Poisson Regression Models Predicting Count of Weeks Open During Fall Semester

Note. Clustered standard errors in parentheses. Coefficients are presented as incidence rate ratios. CBA = collective bargaining agreement; FRL = free and reduced-price lunch.
p < .10. *p < .05. **p < .01. ***p < .001.
We show that a 1% increase in school district size was associated with a 15% decrease in the expected count of weeks of in-person instruction (column (1), p < .010). Furthermore, we found that a one-page increase in the length of the CBA was associated with a 1% decrease in the expected count of weeks of in-person instruction (column (3), p < .05). The other second face power and the first face power measures were not statistically significant. We found that a 1 percentage point increase in the Trump voters in a county was associated with a 2% increase in the expected count of weeks of in-person instruction (column (1), p < .001). In some models, total per pupil expenditures was negatively associated with the expected count of weeks of in-person instruction.
Time to First Open Fall Semester
In Table 6, we show the Cox proportional hazard model results from Equation (3), predicting the time to first open during the fall semester. The model coefficients should be interpreted as hazard ratios, or the change in the hazard of experiencing a reopening for in-person instruction during the fall semester for a one unit change in the independent variable. We found that the first and second face power measures did not significantly predict the time to experiencing in-person instruction during the fall semester. In fact, only two characteristics were significantly related to the hazard of experiencing in-person instruction—the percentage of Trump voters in the county and per-pupil expenditures. A 1 percentage point increase in Trump voters was associated with a 5% increase in the hazard of experiencing in-person instruction (column (1), p < .05). A one log unit increase in total per pupil expenditures was associated with an 82% decrease in the hazard of experiencing in-person instruction (column (1), p < .001).
Cox Proportional Hazard Models Predicting Hazard of Opening for In-Person Instruction During Fall Semester

Note. Clustered standard errors in parentheses. Coefficients are presented as hazard ratios. CBA = collective bargaining agreement; FRL = free and reduced-price lunch.
p < .10. *p < .05. **p < .01. ***p < .001.
Conclusion
This article is one of the first to explain variation in school district reopening decisions throughout the duration of fall 2020 semester. Leveraging information on weekly school reopening decisions over time, we show that, in a sample of 250 of the largest school districts, teachers’ unions’ second face power (as measured by the size of the school district and the length of a school districts’ CBA) was associated with a lower probability of reopening for in-person instruction at the beginning of the fall semester and with ever opening for in-person instruction during fall. Additionally, we found that larger school districts and school districts with longer CBAs spent fewer weeks in in-person instruction during fall. We did not find that measures of first face power were related to the probability of in-person instruction at the beginning or during fall semester. We further found that politics, demographics, and per pupil expenditures but not COVID-19 hospitalization rates were significantly associated with a return to in-person instruction.
These findings match a growing body of literature that decisions regarding whether to reopen schools were not directly associated with the severity of the pandemic (DeAngelis & Makridis, 2021; Grossmann et al., 2021; Hartney & Finger, 2021). If policy was not being set wholly based on the prevalence of COVID-19, then what might decision makers be responding to when determining whether or not to reopen schools? Our article suggests that districts in counties with a larger share of Trump voters were far more likely to experience in-person instruction during the fall semester. In short, partisan politics were intertwined with the decisions about whether and how to reopen schools. Grossmann et al. (2021) noted that “. . . limited and voluntary state guidance in the fall also meant that political conflict moved to the district level” (p. 644). Managing this conflict primarily fell on school boards. While school board candidates are often elected on a nonpartisan basis, their constituencies certainly have political preferences, and substantial anecdotal evidence indicates that community members made their wishes known at school board meetings (e.g., Heymann, 2021). Additionally, prior research suggests substantial partisan differences in judgments regarding the amount of health risk associated with contracting COVID-19 and the best way manage the COVID-19 pandemic (e.g., Allcott et al., 2020). These same partisan judgments likely informed school reopening policies.
We also show that schools were less likely to open for in-person instruction at the start of the school year in districts with a larger share of Hispanic students. Some evidence exists that Black and Hispanic parents were more likely than White parents to express concern about the reopening of schools and that this concern is likely grounded in the disproportional impact of the pandemic on Black and Hispanic communities (Walsh, 2021). The hesitancy, then of school districts in these communities, to return to in-person instruction could be in response to parents’ preference for remote schooling options.
Beyond partisanship and demographics, we also show that reopening decisions were associated with the second face power of teachers’ unions but not the first face of power. Our findings suggest that teachers’ concern about in-person schooling as voiced through their unions likely played a role in shaping instructional decisions during the fall 2020 semester. The second face of power is proactive power that is established well in advance of the actual policy decision and relies on the entrenched relationships between union leadership and policy decision makers. Our findings are suggestive of the idea that in times of uncertainty, preestablished relationship with policy allies are important for unions in their advocacy on behalf of their membership. We found that forceful and reactive responses, as captured by first face power social media posts like lawsuits, protests, public statements, and information campaigns, were not related to reopening decisions. These strong reactions from unions are most often what is portrayed in popular media accounts as evidence of teachers’ unions obstructing reopening decisions—but if anything, these are likely late efforts, and are unsuccessful efforts to prevent planned policy decisions.
Altogether our paper adds to a body of literature that suggests teachers’ unions’ policy positions are associated with eventual policy outcomes (e.g., Finger, 2019; Marianno, 2020)—this time in local-level school reopening decisions during a worldwide pandemic. Additionally, we provide some evidence of the correlates of school district decision making during emergency situations where there is substantial uncertainty and limited evidence on the best path to pursue. In these situations, school districts might be more likely to rely on the voiced preferences of their interest groups, the political leanings of the electorate as articulated through board members and board meetings, and the stated preferences of their largest demographic groups.
Supplemental Material
sj-docx-1-ero-10.1177_23328584221074337 – Supplemental material for Power in a Pandemic: Teachers’ Unions and Their Responses to School Reopening
Supplemental material, sj-docx-1-ero-10.1177_23328584221074337 for Power in a Pandemic: Teachers’ Unions and Their Responses to School Reopening by Bradley D. Marianno, Annie A. Hemphill, Ana Paula S. Loures-Elias, Libna Garcia, Deanna Cooper and Emily Coombes in AERA Open
Footnotes
Notes
Authors
BRADLEY D. MARIANNO is an assistant professor of educational policy and leadership and director of the Center for Research, Evaluation, and Assessment (CREA) at the University of Nevada, Las Vegas. Marianno’s research focuses on the consequences of local and state education policy change for educational governance with a substantive focus on state and federal teacher labor policy, teachers’ unions, and collective bargaining.
ANNIE A. HEMPHILL is a PhD student in in education policy at Michigan State University.
ANA PAULA S. LOURES-ELIAS is a PhD student in educational psychology at the University of Nevada, Las Vegas.
LIBNA GARCIA is an undergraduate research assistant in educational psychology and higher education at the University of Nevada, Las Vegas.
DEANNA COOPER holds a PhD degree in higher education from the University of Nevada, Las Vegas and is a research associate at the Center for Research, Evaluation, and Assessment.
EMILY COOMBES is a PhD student in Sociology at the University of Nevada, Las Vegas.
References
Supplementary Material
Please find the following supplemental material available below.
For Open Access articles published under a Creative Commons License, all supplemental material carries the same license as the article it is associated with.
For non-Open Access articles published, all supplemental material carries a non-exclusive license, and permission requests for re-use of supplemental material or any part of supplemental material shall be sent directly to the copyright owner as specified in the copyright notice associated with the article.