
Abstract
Youth living in remote rural communities face significant geographic barriers to college access. Even those living near to a postsecondary institution may not have the means for, or may not see the value of, pursuing a college degree within their local economy. This study uses 18 years of national county-level data to ask how local economic shocks affect the postsecondary enrollment and attainment of rural students, as compared to students in metropolitan and metropolitan-adjacent regions. Results from an instrumental variables analysis indicate that each 1 percentage point increase in local unemployment increases local college enrollment by 10.0% in remote rural areas, as compared to a 5.2% increase in metropolitan-adjacent areas and no detectable increase in metropolitan areas. The rise in rural college enrollment is driven primarily by students enrolling in or continuing in associate degree programs, and by students transferring from 2-year to 4-year programs.
Keywords
Introduction
While most urban regions in the United States have enjoyed strong recovery from the Great Recession, rural areas have experienced stagnation or even decline. Yet the community-level consequences of these trends have not been fully explored. Maybe of particular importance are consequences for educational attainment: Adults in rural areas, when compared to those in urban areas, have lower high school completion rates, lower college completion rates, and lower returns to postsecondary education in the labor market (U.S. Department of Agriculture [USDA], 2017). Furthermore, the rural–urban gap in college completion has grown wider over the past decade (USDA, 2017). Although postsecondary attainment represents only one of many forms of success for rural youth (Elder et al., 1996; Howley, 2006; Howley et al., 1996), these gaps are nonetheless important to address given the high social and economic returns to college (Hout, 2012) and the numerous structural barriers to college access faced by many rural students (Morton et al., 2018).
Within this context, our study asks, How has local job loss shaped the decisions of young adults in rural and nonrural areas to enroll in, and persist in, postsecondary education? The expected direction of this effect is theoretically ambiguous (Dellas & Sakellaris, 2003). On one hand, as jobs in the local community disappear, the opportunity cost of schooling lessens, and so more people may choose to pursue additional education (Betts & McFarland, 1995; Foote & Grosz, 2020; Rees & Mocan, 1997; von Simson, 2015). A declining economy may also incentivize students to pursue additional schooling in the hopes of finding better jobs outside their community (Tieken, 2016). On the other hand, returns to schooling may diminish along with the ability to pay tuition, which could instead discourage college enrollment and persistence. Although past research has examined links between local labor market conditions and educational outcomes (e.g., Ananat et al., 2017; Foote & Grosz, 2020; Shores & Steinberg, 2019), less is known about how the effects of community economic shocks on educational choices vary across rural, suburban, and urban contexts. We anticipate that rural communities may respond differently to local economic shocks due to their unique postsecondary landscape, labor market returns to college, and relative geographic isolation.
Rural Communities
Classifying geographic areas as either rural or nonrural is not a straightforward task. 1 The Census Bureau defines “rural” to encompass any population, housing, or territory not included within an urban area of at least 2,500 people (U.S. Census Bureau, 1994, p. 12-1). The Office of Management and Budget (OMB) instead considers all counties as rural that are not part of metropolitan statistical areas (OMB, 2010, p. 37246). We prefer to use this second definition, which classifies rural counties as those existing outside of, and not adjacent to, metropolitan areas. We do so because the estimated impacts of county-level economic conditions on the schooling choices of youth and adults could be misleading in the case of rural counties directly adjacent to metropolitan labor markets.
Rural regions in the United States have recently undergone significant economic and demographic transformation. Although many associate rural economics with agriculture, manufacturing, and mining, in fact these economies rely on a wide variety of industries (Ajilore & Willingham, 2019). During the Great Recession of 2008, rural counties with greater reliance on construction and manufacturing experienced the largest employment declines (Thiede & Monnat, 2016). Over this period, urban areas faced larger increases in unemployment rates, while rural areas faced larger decreases in total employment, a trend perhaps related to the more general trend of rural population decline. Between 2006 and 2016, average annual rates of population change in rural areas fell from 0.7% to less than 0% (Cromartie, 2017). Johnson and Lichter (2019) note that more than 46% of remote rural counties have begun depopulating as compared to 24% of adjacent nonmetropolitan counties and 6% of metropolitan counties. The extent to which these broader social, economic, and demographic forces influence educational attainment in rural regions remains unclear.
Educational Patterns of Rural Youth
Prior research has estimated the gap in educational attainment between rural and nonrural areas and attempted to identify potential explanations for this gap (e.g., Byun et al., 2012; Gibbs et al., 1998; Smith et al., 1995). As of 2015, 33% of adults had bachelor’s degrees or higher in urban areas as compared to only 19% in rural areas (USDA, 2017). A recent study by Byun et al. (2015) concluded that rural youth were less likely to attend a selective institution, more likely to delay entry to postsecondary education, and less likely to be continuously enrolled in college, than their nonrural counterparts.
Why does this rural–nonrural gap in higher education enrollment exist? One common explanation for low postsecondary enrollment in remote rural areas is the obvious geographic constraint—that there are, on average, fewer nearby colleges and universities. Another common explanation is the lack of a strong labor market for college-educated adults in some rural communities. Tieken (2016) describes these two forces as a dilemma that higher education presents for many rural students: whether to remain in their rural home, working in traditional trades and industries that do not require a college degree, or to leave in pursuit of an education that is often the first step toward an adult life lived away. (p. 203)
Indeed, there is significant concern that highly educated young adults in rural areas may ultimately leave home, further contributing to the “hollowing out” of rural America (Carr & Kefalas, 2010). However, there is also evidence refuting this claim, showing that many rural youth choose to return home after pursuing postsecondary education, so as to use their gained knowledge and skills to improve their communities (Farmer et al., 2006). Postsecondary attainment of rural students may lag behind that of suburban and urban students for other reasons, as well. These include socioeconomic barriers (McDonough et al., 2010), financial constraints (Byun et al., 2012), weaker college preparation curriculum (Provasnik et al., 2007), insufficient academic and educational counseling (Sutton & Pearson, 2002), differing educational aspirations of students (Hu, 2003), and/or differing educational expectations of parents (Smith et al., 1995).
Much of this work explaining rural educational trends has used regression analysis applied to large-scale longitudinal student surveys (Byun et al., 2012; Gibbs et al., 1998; Hektner, 1995; Hu, 2003; Smith et al., 1995) or researcher-designed surveys (Petrin et al., 2014; Van Gundy et al., 2016). One limitation of these observational studies is the possibility of bias due to omitted variables or simultaneity. Some exceptions to the multivariate regression approach in rural education research are Guo et al. (2015) and Irvin et al. (2017) who use propensity score matching to evaluate specific educational interventions, and Irvin et al. (2011) who use hierarchical linear models to explore the relation between school context and educational achievement and aspirations. Nonetheless, there are far fewer studies exploring the causal mechanisms underlying rural and nonrural educational attainment.
Of particular interest to this study is the link between local labor market conditions and rural students’ educational trajectories. Petrin et al. (2014) provide an interesting perspective on this link. They note that the perceived availability of employment in the local community is a strong predictor of high school student intentions to leave their rural community. This association is particularly strong for students with high academic achievement (p. 310). They also note that individual plans to attend a 4-year postsecondary institution predict intention of leaving the community, particularly for female students and lower achieving male students. One question is whether this connection between perceived local job prospects and future educational plans is due to a student’s overarching attitude toward their community, or due to actual economic prospects. Speaking to this, Van Gundy et al. (2016) note that youth are quite aware of and in tune with local economic shifts, according to their study of youth living in a rural Northeastern county suffering the consequences of pulp and paper mill closings during the Great Recession. Based on descriptive trends, another recent study noted that the Great Recession “may have influenced rural students to complete shorter-term sub-baccalaureate degrees for either their cheaper costs or more immediate returns in the labor market” (Wells et al., 2019, p. 25). However, they were unable to test these mechanisms empirically.
Within rural communities, we therefore seek to understand how changes in local economic conditions affect the educational decisions of youth, particularly in their decisions to pursue or continue postsecondary degree attainment.
Local Labor Market Effects on Educational Attainment
Local economic shocks may affect an individual’s schooling choices through several potential mechanisms. First, an individual may lose their job and decide to enroll in higher education to train for a different occupation. Second, a family member may lose their job, putting financial strain on the entire household and affecting subsequent educational and career choices (Hilger, 2016). And third, community-level job loss may affect individuals’ aspirations, expectations, and general well-being (Ananat et al., 2017). As Ananat et al. (2011) state in a related study, “In addition to evidence that job loss worsens outcomes for job losers and their children, there is also evidence that firm layoffs and shutdowns affect those who live in the impacted community, whether they lose employment or not” (p. 6). For postsecondary education in particular, traditional human capital models predict that family income, tuition costs, and returns to postsecondary degrees, will each play a role in driving demand (Clotfelter et al., 1991). It is important to understand how these demand factors change when rural economies go into periods of decline.
Betts and McFarland observed in a 1995 study that community college enrollment follows countercyclical trends. That is, when the economy suffers, more students pursue community college degrees. When the economy booms, fewer students do so. More recently, Barrow and Davis (2012) performed a time series analysis to document that increases in unemployment are associated with increases in postsecondary enrollment, with the largest enrollment growth happening at 2-year institutions, then 4-year public institutions, and then 4-year private institutions. Foote and Grosz (2020) performed a panel analysis of commuting zone-level data from 1996 through 2013 to determine impacts of mass layoffs on 2-year college enrollment. These authors found a positive association between mass layoffs and 2-year college enrollment and degrees/certificates within commuting zone areas. They interpreted this association as laid off workers primarily driving the upticks in college enrollment that occur during economic downturns.
Our study makes two primary contributions to the existing higher education literature. First, although prior studies used models that controlled for time and place fixed effects, they have stopped short of identifying plausibly exogenous variation in local labor market changes. Our study applies an instrumental variables method using variation in job loss from heterogeneous recessionary shock magnitudes to reduce bias resulting from measurement error, simultaneity, and omitted variables. Second, our study examines how different types of communities respond differently to local economic conditions. 2 It focuses in particular on the case of potential college students in rural counties geographically remote from any metropolitan area.
Young adults in remote rural areas may respond differently to local economic shocks for a few reasons. First, their job prospects may differ from those available to young adults living in or near metropolitan areas. Therefore, the wage returns to certificates, associate’s degrees, and bachelor’s degrees may vary. Second, their underlying human and social capital may differ from young adults living in or near metropolitan areas, which could affect the likelihood of pursuing additional schooling during economic shocks. And third, the number and variety of postsecondary options available to rural young adults may be limited when compared to options available to urban young adults. These mechanisms specific to rural regions could lead to either higher or lower effects of local economic conditions on educational attainment, something we explore empirically.
Method
Data
The final analytical data set links nearly two decades of postsecondary education and labor market conditions data at the county-year level. Below we describe the main underlying sources of data and measures.
Postsecondary Education Data
The Integrated Postsecondary Education Data System (IPEDS) provides information on all postsecondary institutions that receive or apply for Title IV federal assistance and select other institutions. 3 The structures and functions of higher education institutions in the United States vary widely. In this study, we are interested in any changes in individual higher education choices caused by poor labor market conditions. The analysis therefore focuses first on the outcome of aggregate enrollment at any type of postsecondary institution between 2000 and 2017. Following this, it disaggregates enrollment by undergraduate institution type: (1) at least 2 but less than 4 years (i.e., associate’s degrees), (2) 4 or more years (i.e., bachelor’s degrees), and (3) less than 2 years (i.e., nondegree programs).
IPEDS provides institution-level data, which we sum to the county level (Table 1). This allows us to examine the aggregate influence of community labor market conditions on aggregate postsecondary education enrollment. However, there are difficulties in analyzing these phenomena within a closed system, such as a county. Although the majority of young adults stay close to home to attend college, particularly to attend community college, many move away from their hometowns to seek a college education elsewhere (Mattern & Wyatt, 2009, Porchea et al., 2010). Of relevance to our research design, rural youth are more likely to remain within their home county to attend college (Garasky, 2002; Niu, 2015), and across all geography types more than 80% of college-going students attend in-state (Niu, 2015).
Number of Counties With Postsecondary Institutions in 2013

Regional Category Definitions

Note. USDA = U.S. Department of Agriculture.
The main outcome variable of this study is the 12-month unduplicated head count at postsecondary institutions, aggregated to total enrollment in the county. This variable counts any students who enroll in at least one credit between September to June. Since students enter, leave, or pause their postsecondary education for a variety of reasons, the 12-month unduplicated head count does not clearly indicate underlying mechanisms of enrollment change. We employ five more detailed outcome measures to better understand enrollment changes in 2-year degree programs. 4 The first measure, full-time enrollment, equals the start-of-fall snapshot of full-time student enrollment. The second measure, first-time enrollment, equals the count of students whose fall semester is their first time enrolled at a postsecondary institution. The third measure is the proportion of first-time students enrolled full time. We expect that these measures will provide richer information on student status at the start point of each new school year. The other two measures are the cohort graduation rate and the transfer-out rate. The cohort graduation rate equals the number of students who graduate within 3 years in each cohort of 2-year programs divided by the total number of students in that cohort. The transfer-out rate likewise equals the proportion of students within each cohort who transfer to another program. Reporting transfer out counts is mandatory only for institutions whose missions include preparation for more advanced degree programs. More than 70% of associate’s degree programs, which reported the 12-month unduplicated head count, reported the counts of students transferring out.
Labor Market Conditions Data
The unemployment rate is a popular index of labor market condition. We draw this measure from annual Local Area Unemployment Statistics data from the Bureau of Labor Statistics for the main analysis. The county-level unemployment rate measure is not without its limitations and issues; however (Bartik, 1996; Hoynes, 2000), we return to this in the next section.
Also described in more detail below, our identification strategy depends on the measurement of county-to-county differences in industrial composition. To measure industrial composition, we use a modified version of the U.S. Census Bureau’s County Business Patterns data from Eckert et al. (2020) to build our prerecession industrial composition variable. 5 Specifically, we calculate the share of employment in construction or manufacturing as the number of county employees in construction (NAICS 23) plus the number of county employees in manufacturing (NAICS 31-33) divided by the total employed labor force of the county.
Control Variables
We collect a few additional variables to account for within-county population trends that may affect postsecondary enrollment. 6 The size of regional postsecondary education depends on overall regional population size, especially the local population of young adults. We therefore include logged county annual estimated population between ages 15 and 29 years as a control to account for population size, collected and estimated from the U.S. Census Bureau. Additionally, prior studies observe that demographic characteristics of a population, such as racial composition, are associated with different college enrollment patterns (Perna, 2000). We obtain data on the racial composition of local populations from the intercensal county population data by age, sex, race, and Hispanic origin, estimated by the U.S. Census Bureau.
Regional Categories
There are several different rural classifications used by federal agencies. We employ the USDA classification, which is based on the OMB metropolitan and nonmetropolitan definitions. They generate nine subcategories: three within metropolitan areas, three adjacent to metropolitan areas, and the remaining three not adjacent to metropolitan areas. We aggregate these respectively into “Metro,” “Adjacent,” and “Rural” categories (Table 1). We believe that defining counties as rural based on their proximity to metropolitan areas is appropriate for analyzing rural postsecondary enrollment, since distance is such a significant factor for choosing whether (and where) to attend college.
Table 3 presents descriptive statistics for the full analytical sample, and for each regional category (“metropolitan,” “metro-adjacent,” and “rural”). It is clear that metropolitan counties are much more populous, with average population more than seven times larger than metropolitan-adjacent counties, and almost ten times larger than rural areas. Metropolitan-adjacent and rural areas have relatively lower personal income and higher unemployment rates at 6.9% than metropolitan areas with average unemployment rates of 6.1%. Additionally, rural areas tend to have smaller Black and Hispanic populations than other areas.
Descriptive Statistics For Counties With Locally Dependent Postsecondary Institutions

Sample Restrictions
Since there are many different types of postsecondary institutions, changes to individual students’ decision making may affect enrollment changes differently by institution type. Therefore, we estimate effects of unemployment on postsecondary enrollment separately for 2-year programs and 4-year programs. For the more detailed assessment of impacts on first- and full-time enrollment, transfers, and graduation, we restrict to only 2-year program enrollment, as 2-year programs likely respond more directly to local labor markets (Wells et al., 2019).
The second sample restriction is to focus on institutions with primarily local student populations. The reasoning is that local economic conditions are most likely to affect the decisions of potential students residing in that community, as opposed to the decisions of potential students coming from out-of-state. Although separating institutions by program length partly resolves this issue, there are still both 2-year programs and 4-year programs that draw heavily from out-of-state because of each institution’s unique characteristics. We employ a simple restriction to institutions that on average draw 90% or more of their first-time students from a single state, although we also test sensitivity of our results to alternative thresholds. 7 Over 60% of institutions and 56% of students fit this characteristic (see Table 1 and online Supplemental Appendix Table A1), which allows us to focus on postsecondary institutions where the marginal student is choosing between local jobs or enrolling in a local college.
Analytical Plan
Empirical Challenges
During the Great Recession, higher education institutions experienced a rise in student enrollment (Barrow & Davis, 2012). However, there are a few empirical issues we must address to establish the relation between local recessionary and postsecondary enrollment causally. First, as Foote and Grosz (2020) and others have pointed out, measuring labor market condition using the unemployment rate introduces problems. It creates simultaneity bias, since any additional postsecondary enrollment translates into both a smaller labor force (denominator) and unemployed labor force (numerator) for the unemployment rate calculation. In the same context, out-migration of the newly unemployed could reduce the unemployment rate, and in-migration of the unemployed could increase the rate, even under otherwise identical labor market conditions. 8 County-level unemployment data also presents its own set of issues. Small geographical units tend to have noisier unemployment rates and higher levels of regular labor force migration (Bartik, 1996).
Second, macrolevel factors—including economic, but also social, demographic, and political factors—can simultaneously influence both labor market conditions and potential students. For example, areas with strong labor markets may have consistently stronger college participation, due to historical regional development. Moreover, national trends over time, or major national events, could simultaneously affect U.S. labor market conditions and postsecondary enrollment. For example, the aftermath of the Great Recession of 2008 likely brought about labor market changes around the same time that the Obama administration took other policy actions related to higher education, such as increased spending on community college and Pell grants (Fischer & Parry, 2009). Including county and year fixed effects in empirical models accounts for most of these potential confounders, but not all of them.
Finally, there are inherent simultaneity issues in our research question. Postsecondary enrollment and attainment could—and likely do—directly affect local labor market conditions. The remainder of this section details our approach to addressing the core issues of measurement error, omitted variable bias, and simultaneity.
Instrumental Variables Approach
We propose an instrumental variables (IV) approach to address these identified empirical problems. In addition to correcting for endogeneity associated with omitted variables or simultaneity, IV estimation can help to resolve certain types of measurement error issues (Wooldridge, 2013). In our case, the county-level unemployment rate consists of two parts: (1) the county’s true labor market condition,

This measurement error could arise due to, for example, random or nonrandom changes in the labor market participation and dropout. If the IV is independent from this measurement error, then the IV approach would reduce attenuation bias from measurement error by using only the variation in true labor market conditions of the county.
We use an IV similar in spirit, though not in form, to the Bartik shift-share instrument (Bartik, 1991; Blanchard et al., 1992; Goldsmith-Pinkham et al., 2020). Specifically, our instrument is an interaction term between the proportion of a county’s baseline labor force in 2008 in industries highly affected by the recession (

We define highly affected industries, based on studies of recessionary job loss by industry (Katz, 2010), as construction (NAICS 23) and manufacturing (NAICS 31-33), and further define the postrecession period as the years 2009 to 2011. These years were chosen because the nation as a whole experienced the largest unemployment increases during those years (U.S. Bureau of Labor Statistics, 2018) and because construction and manufacturing industries in particular suffered during those years (see online Supplemental Appendix Figure A1). 9
This approach mimics a fuzzy difference-in-differences method (De Chaisemartin & d’Haultfoeuille, 2018; Jackson et al., in press). It uses variation from the differential changes in the treatment group—in our case, counties with high reliance on construction and manufacturing—as compared to changes in the control group—in our case, counties with low reliance on construction and manufacturing—during the post period following the Great Recession. 10 It relies on the observation that communities with a higher proportion of their workforce in construction and manufacturing were more likely to experience adverse impacts from the recession than were other communities (Figure 1). This is the central idea underlying our IV.

County-year unemployment rate by construction and manufacturing dependence.
It is important to emphasize that we do not assume that the industrial composition of a county is exogenous nor do we assume that the Great Recession would itself meet any exclusion restriction. Rather, our method assumes that the interaction between these two factors is exogenous, conditional on all time-invariant county characteristics. We assume specifically that this interaction term instrument—reflecting differential recessionary shocks based on county industrial composition—is likely independent from changes in postsecondary education, except through its effects on local unemployment. Additionally, we assume that the instrument is uncorrelated with the measurement error component of the unemployment rate and only correlated with the component reflecting true local labor market conditions. To strengthen the validity of this approach, we also control for time-varying population levels and demographic characteristics of the county, as well as county and year fixed effects.
Estimation Model
Our preferred model (Model 1) employs a two-stage least squares estimator as follows:
First stage equation

Second stage equation

In these equations,
One within-county change that Model 1 does not control for directly is the opening or closing of postsecondary institutions. Such openings or closing may show up in the data as large jumps in enrollment numbers. However, they could still reflect at some level student behavioral responses to local labor market conditions. Thus, we report two models, one controlling for, and one not controlling for, within-county changes in the number of postsecondary institutions. The alternative model (Model 2) controls for the log of the number of postsecondary institutions in the county. In this Model 2 specification, the
A final alternative model (Model 3) excludes the IV step, corresponding to a traditional two-way fixed effects approach. We run each model separately over the rural, metropolitan-adjacent, and metropolitan samples. 12
Results
Descriptive Analysis: The Geography of Postsecondary Education
Using the latest version of USDA’s geographic classifications from 2013, there are 3,143 counties in the United States, of which 37% (1,167) are metropolitan, 33% (1,027) are metro-adjacent, and 30% (949) are rural. In 2013, almost 67% of metropolitan counties had postsecondary institutions within their jurisdictions. In contrast, only 40% and 30% of metro-adjacent and rural counties had institutions within their jurisdictions (Table 2). Once you restrict to locally dependent institutions, or degree-granting institutions, the number of counties with any higher education institutions decreases, although the urban–rural gap narrows. Overall, rural areas enjoy significantly less opportunity for offline higher education, as illustrated by the mapping of postsecondary institutions across the United States (Figures 2 and 3).

Regional categories map.
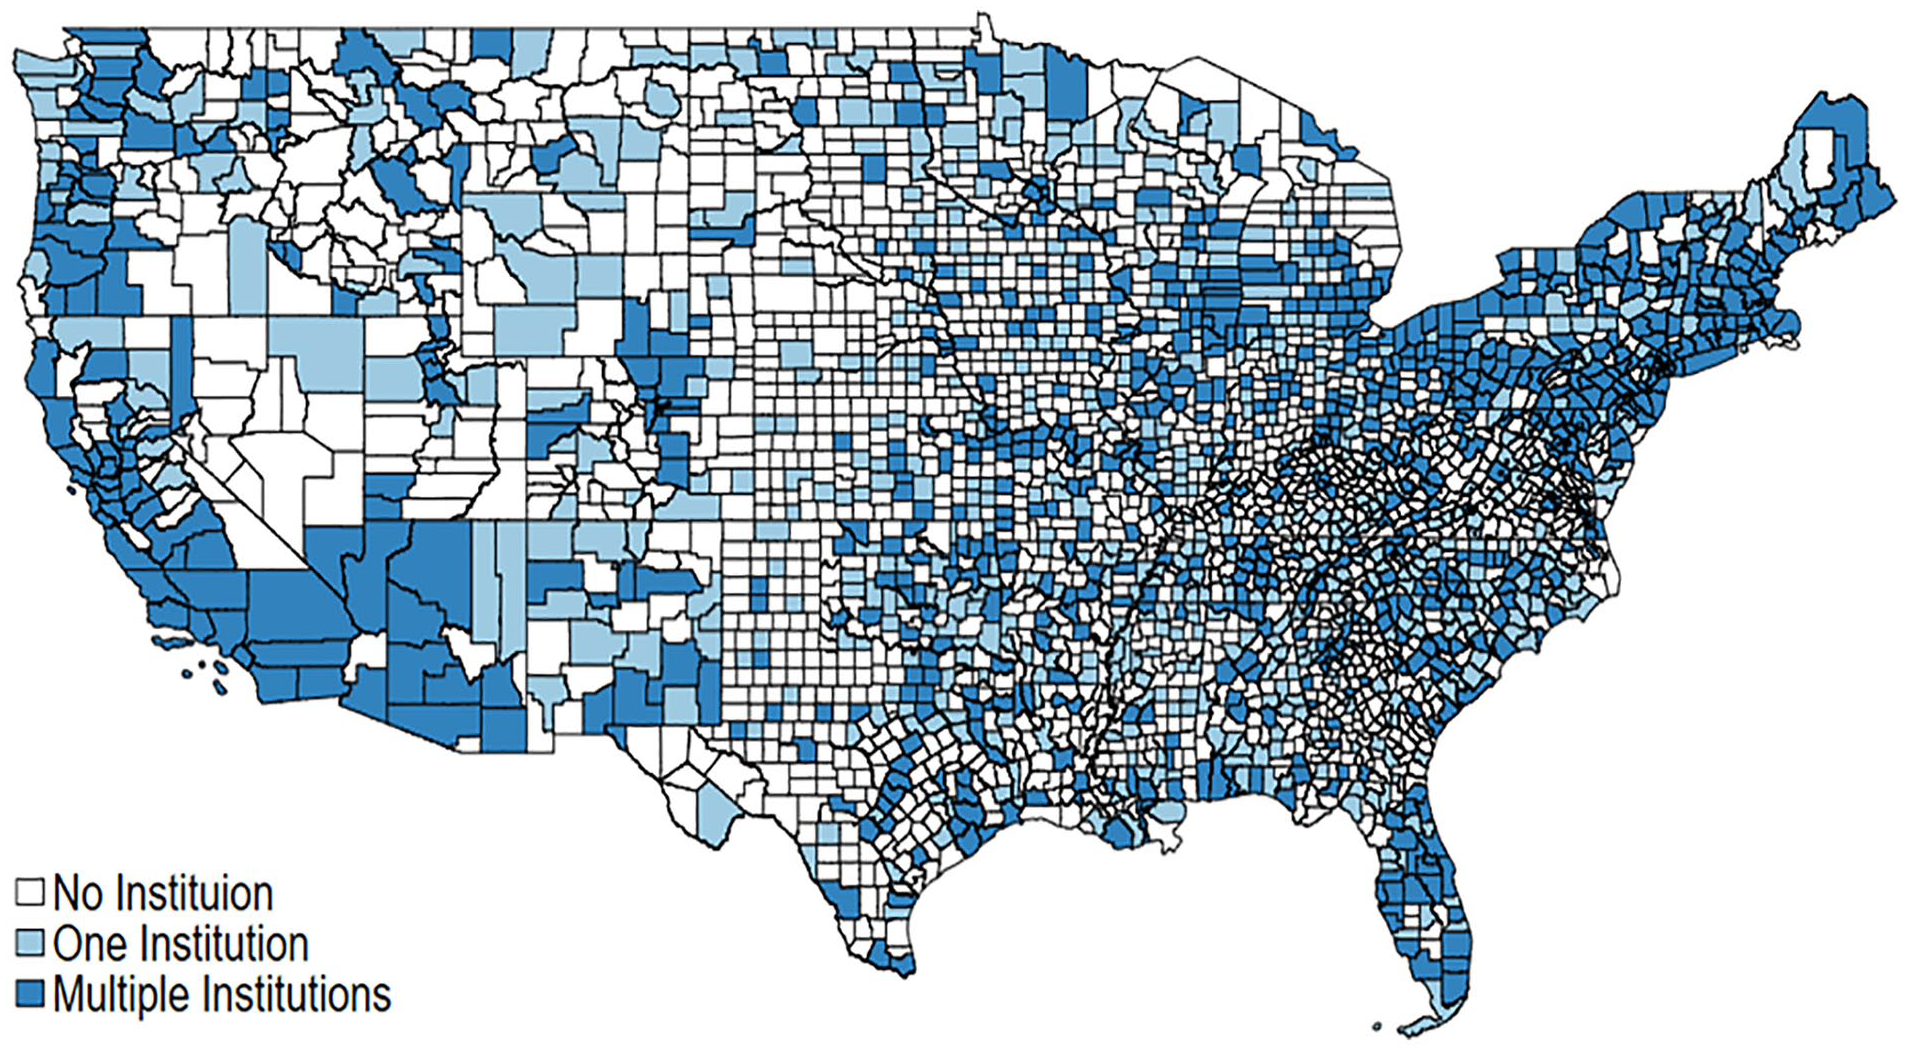
Postsecondary institutions map (2016).
The postsecondary landscape has changed appreciably over the course of the past two decades (Figure 4). In metropolitan areas, the number of institutions providing associate’s degrees has remained low and flat, while the number of institutions providing bachelor’s or other types of degrees increased following the most recent recession. In metropolitan-adjacent areas, associate’s degree–granting institutions have been on a steady decline, whereas bachelor’s degree–granting institutions have risen slightly. Finally, in rural regions, institutions offering associate’s degrees are the most common, but even those are trending downward in number. This descriptive analysis shows that overall trends in higher education, which have been marked by college closures since 2010 due to some mix of demographic trends in enrollment and financial constraints (Eide, 2018), mask underlying regional differences.
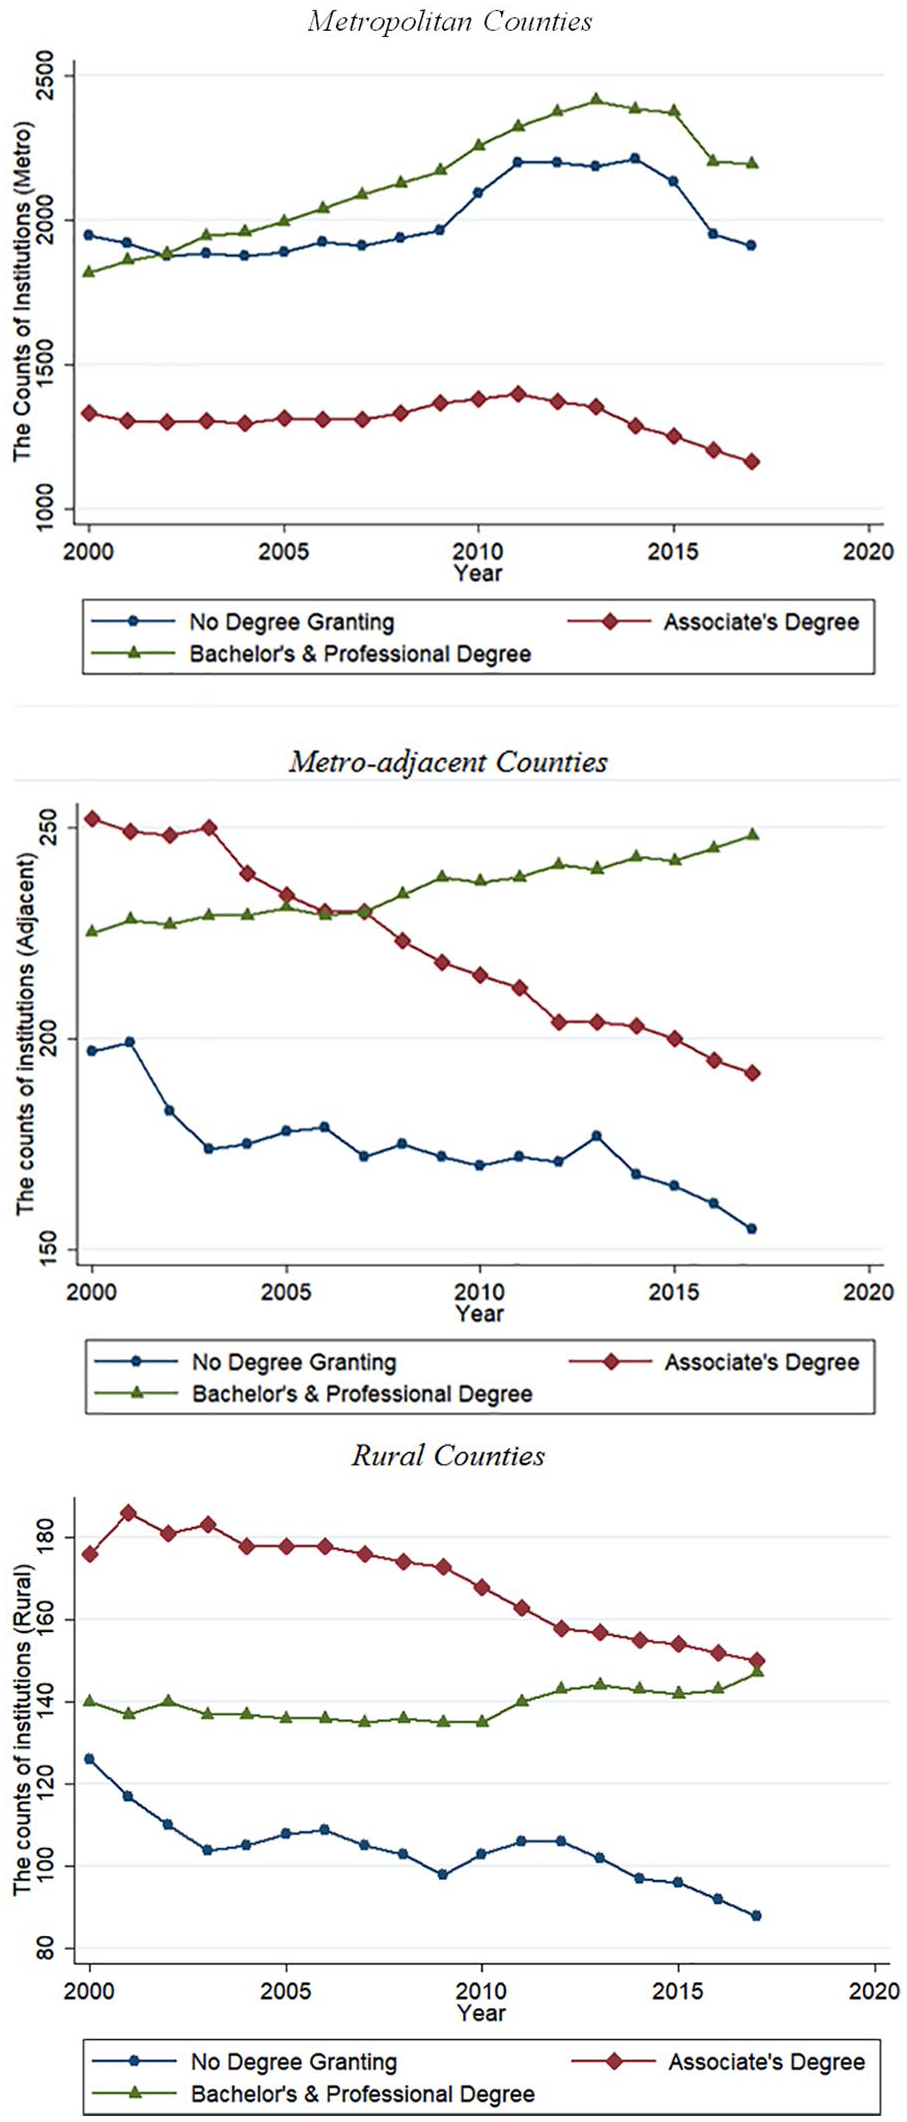
Trends in number of postsecondary institutions by regional category.
Shifting from the number of institutions to the number of enrolled students, Figure 5 plots the change in total postsecondary enrollment by regional category by year (enrollmentrt/enrollmentr,2000). This graph shows strikingly how the number of students enrolled in higher education peaked between 2009 and 2011, immediately following the Great Recession. This descriptive result is consistent with previous studies showing that economic downturn is associated with increased enrollment in higher education (Barrow & Davis, 2012; Betts & McFarland, 1995). The peak of the number of students is approximately 2 years earlier than the peak in the number of institutions shown in Figure 4, implying that growth in college supply lagged slightly behind growth in enrollment demand. Comparing geographic areas, although major trends were similar, rural enrollment grew more rapidly during the prerecession period than did metropolitan or metropolitan-adjacent enrollment.

Twelve-month total student head count change by regional category.
Effects of Local Unemployment on Educational Attainment
Before proceeding to the main results, we examine first stage models. The IV has a large and significant impact on local unemployment rates across every community type and every model specification, with F statistics ranging from 24.3 to 47.9 (Table 4). Each coefficient in the first row of Table 4 represents the differential growth in the unemployment rate during recession years by the baseline share of employment in construction or manufacturing. Rescaled to a more reasonable magnitude, Column 3 indicates that rural counties with a 10 percentage point larger share of industry devoted to construction or manufacturing experienced on average a 0.60 percentage point larger rise in the unemployment rate than other rural counties during recession years. The corresponding differential unemployment rise in metropolitan-adjacent areas was 0.64 percentage points, and in metropolitan counties 0.42 percentage points. These effects are all conditional on county and year fixed effects and demographic controls. Figure 1 illustrates the logic behind the first stage graphically, showing a strong correlation between the construction and manufacturing ratio and unemployment during the recession period, but less or no correlation during other periods.
First Stage Results

Note. Every population is for ages 15 to 29 years. Robust standard errors in parentheses, clustered by county. Instrumental variable (IV) = ratio of construction and manufacturing * recession (Year 2009–2011).
p < .1. **p < .05. ***p < .01.
The second stage models map the causal relation between local unemployment and postsecondary enrollment. Specifically, Columns 1 through 3 of Table 5 show that a 1 percentage point increase in the county unemployment rate leads to a 5.2% increase in enrollment at local postsecondary institutions in metro-adjacent counties and a 10.0% increase in rural counties. There is a null effect of unemployment on enrollment in metropolitan areas. 13 One possibility is that some large fluctuations in local enrollment could be explained by postsecondary institutions opening or closing within the county. Controlling for the log of the number of institutions in Model 2 (Columns 4–6) generates somewhat similar results to Model 1, with slightly larger magnitudes for rural areas. It is interesting to note that the two-way fixed effects models generate null associations between the unemployment rate and postsecondary enrollment across metropolitan and metro-adjacent areas, and a smaller marginal association in rural areas. We believe this is primarily due to attenuation bias from the empirical issues described in the prior section.
Effects of Unemployment on Log Enrollment at Locally Dependent Postsecondary Institutions

Note. Every population is for ages 15 to 29 years. Robust standard errors in parentheses, clustered by county. IV = instrumental variable; TWFE = two-way fixed effects.
p < .1. **p < .05. ***p < .01.
Different types of postsecondary institutions and different types of degrees may exhibit distinct demand responses from labor market shocks. We therefore separate associate’s degree (2-year) enrollment from bachelor’s degree (4-year) enrollment for further understanding (Table 6). From the perspective of costs, the marginal college student is more likely to choose a 2-year program than a 4-year program. Additionally, many associate degree–granting institutions provide contract training for certain job positions (Kane & Rouse, 1999). For these reasons, we anticipated that associate degree enrollment would respond more to local economic conditions than enrollment in other degree programs. However, the findings are more ambiguous (Table 6). According to these estimates, a 1 percentage point increase in the unemployment rate translates into a 7.8% increase in rural associate degree enrollment (p < .1) and has insignificant effects on associate degree enrollment in metropolitan and metro-adjacent areas. Although the number of counties with enclosed colleges or universities offering bachelor’s or professional degrees is much smaller, and therefore our sample is smaller, similar results hold for bachelor’s degree and professional degree enrollment. In rural counties, a 1 percentage point increase in unemployment leads to a 7.0% increase in bachelor’s or professional degree enrollment. In metropolitan areas, although we cannot reject the null hypothesis, the point estimate magnitude is a whopping −13.6%. In short, the countercyclical nature of college enrollment holds for both 2-year and 4-year degree seeking in rural regions but does not hold as consistently in urban or suburban areas.
Effect of Unemployment on Log Enrollment in Different Program Types (Model 1)

Note. Two-year institution is degree granting for programs of at least 2 but less than 4 years; 4-year institution is degree granting for programs of 4 or more years; Robust standard errors in parentheses, clustered by county. All models include county fixed effects, year fixed effects, and controls. Enrollment is only at locally dependent postsecondary institutions.
p < .1. **p < .05. ***p < .01.
Changes in student head counts consist of two parts: inflow and outflow. Inflow includes entering new students, and outflow includes graduation, transfer, and drop out. For a more nuanced analysis of inflow and outflow, we restrict to only associate’s degree–granting institutions. The first panel of Table 7 presents results for metropolitan regions, the second panel for metro-adjacent regions, and the third panel for rural regions. The results from the first two columns show that employment losses predict increases in full-time enrollment in associate degree programs across metropolitan and metro-adjacent areas in the fall semester. There are no significant increases in first-time enrollment, but there are increases in the proportion of first-time students attending full-time in metropolitan areas. These effects are largest and most statistically significant in metropolitan regions, however. For example, a 1 percentage point increase in unemployment creates a 7.6% rise in full-time enrollment in metropolitan areas (p < .05), a 4.1% rise in metro-adjacent areas (p < .1), and a 5.4% rise in rural areas (ns). Although first-time student inflow changes are ambiguous across region types, it is clear that higher unemployment leads to a higher proportion of first-time students enrolled full time in metropolitan and metro-adjacent areas, but this story does not apply to rural areas. The inflow mechanism is most salient for 2-year colleges in metropolitan areas.
Effect of Unemployment on Student Entrance and Exit Mechanisms (Model 1)
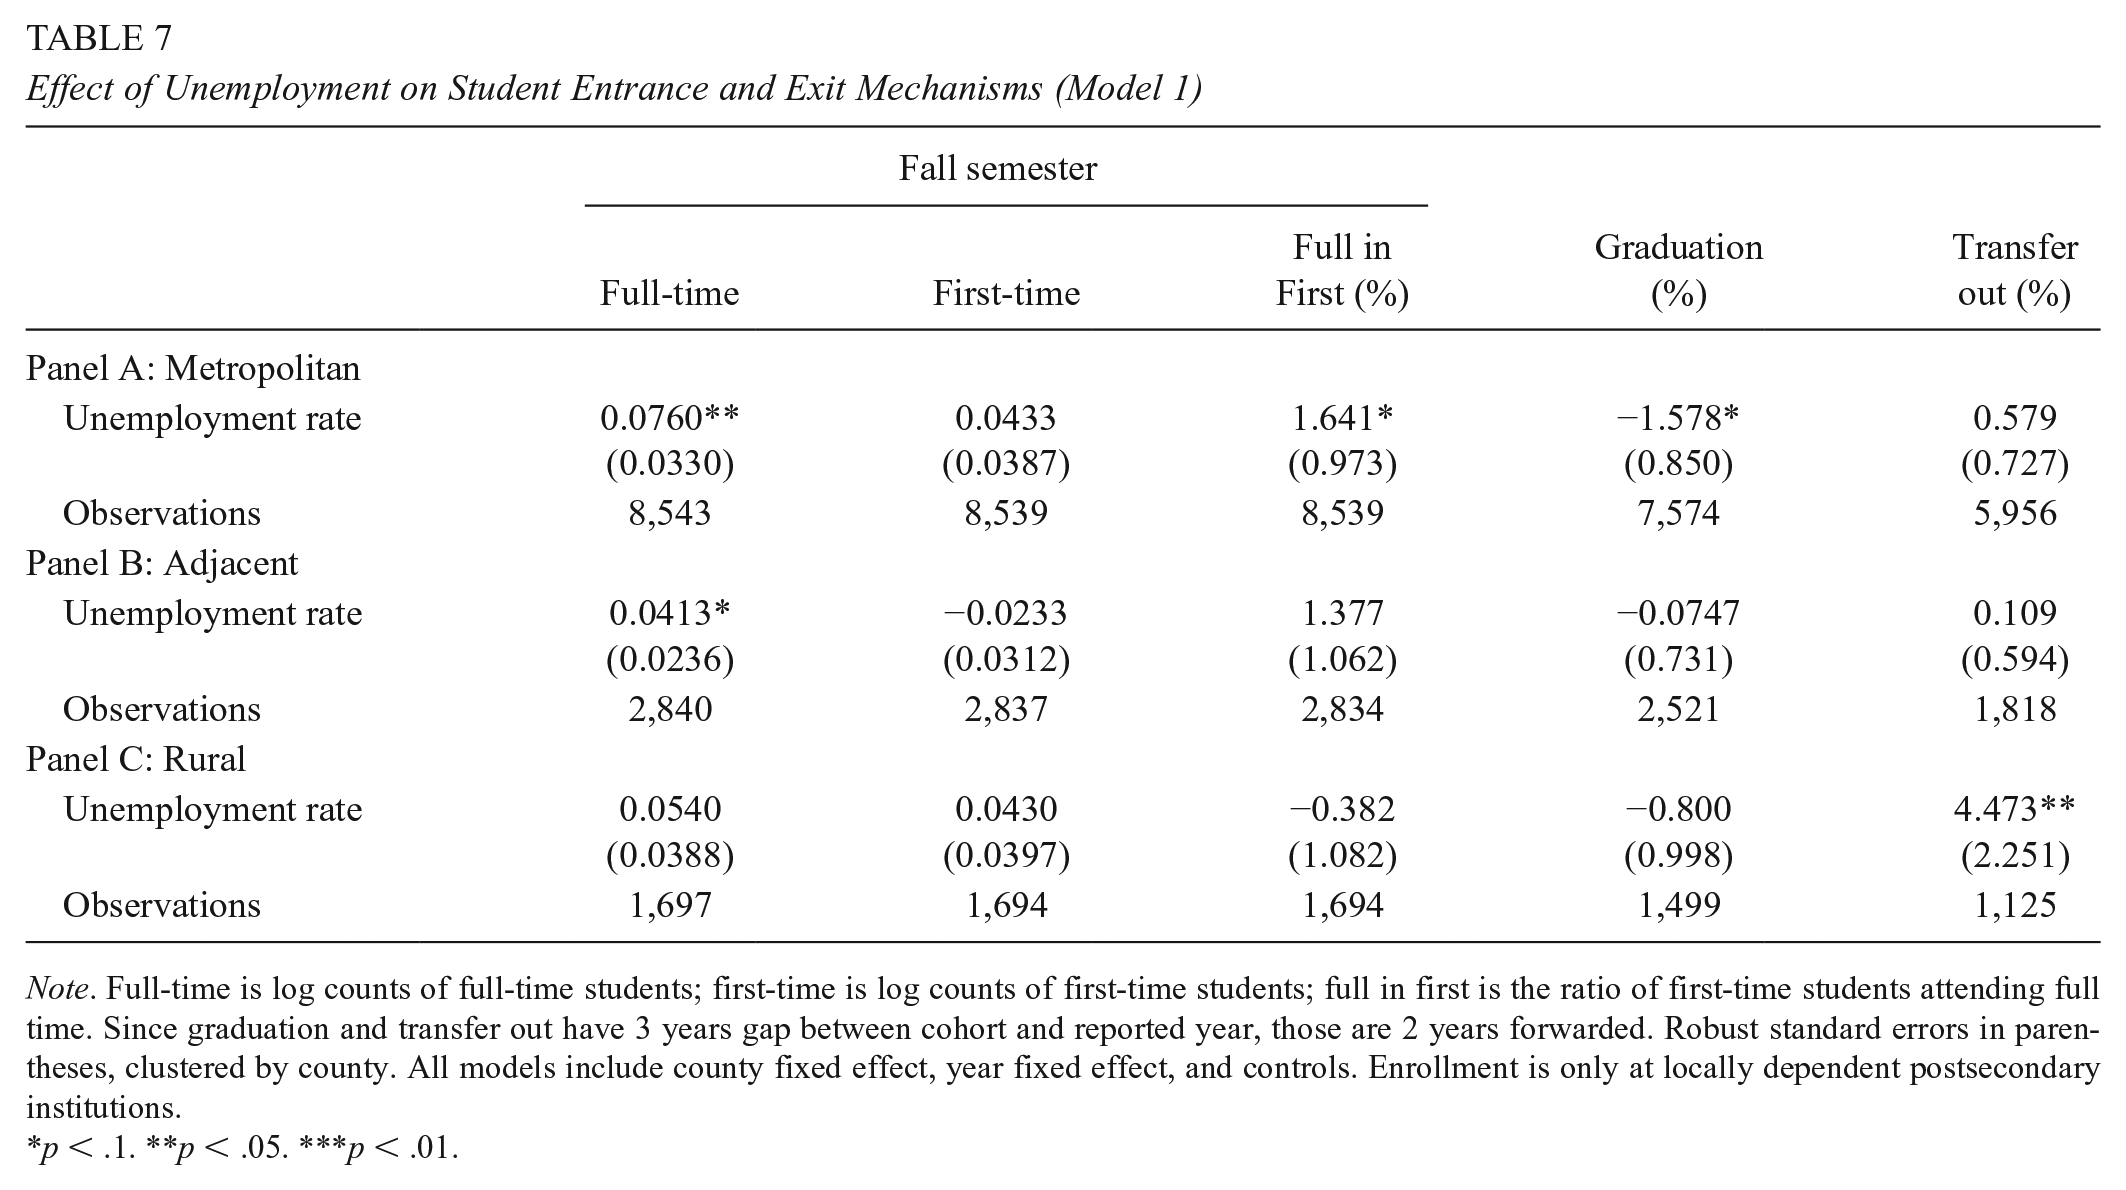
Note. Full-time is log counts of full-time students; first-time is log counts of first-time students; full in first is the ratio of first-time students attending full time. Since graduation and transfer out have 3 years gap between cohort and reported year, those are 2 years forwarded. Robust standard errors in parentheses, clustered by county. All models include county fixed effect, year fixed effect, and controls. Enrollment is only at locally dependent postsecondary institutions.
p < .1. **p < .05. ***p < .01.
We next proceed to examine “outflow” responses to recessionary employment losses. Outflow measures are specified in 2 years after the unemployment measure, to look into the program-completing decisions of students that experienced certain labor market condition during their regular college period. In metropolitan areas, a 1 percentage point increase in local unemployment causes a 1.6 percentage point decrease in the cohort graduation rate (p < .05), and no effect on transferring out. In metro-adjacent areas, a 1 percentage point increase in local unemployment has no effect on the graduation rate or transfer-out rate. College students in rural areas are similarly no more or less likely to graduate due to an increase in unemployment, but their likelihood of transferring out increases by 4.5 percentage points (p < .05). This implies that, particularly in rural regions, increases in postsecondary enrollment during the recession were driven in large part by more students transferring from 2-year programs to 4-year programs rather than stopping or pausing their education.
Alternative Pathways
The unbiasedness of these estimates relies on a central assumption. Specifically, it requires that—conditional on county and year fixed effects and demographic controls—the IV only affects outcomes through its effects on unemployment. Although we believe this assumption is reasonable, there are plausible alternative pathways. For example, counties highly reliant on construction and manufacturing industries could have divergent prerecession trends in postsecondary enrollment, again for reasons unrelated to local job loss.
We interrogate the validity of our method in three tests. For the first, since the results could be due to differential “pretreatment” trends rather than the local labor market conditions, we employ a reverse causation falsification test that replaces the current year student head count outcome with a 3-year lagged student head count. Another robustness exercise considers alternative IV based on the same logic as our instrument, but with slightly different specifications. In these specifications, the postrecession indicator in the interaction term is replaced instead with national aggregate or industry-specific unemployment rates. In addition to the above tests, we also consider the sensitivity of our results to using an alternative measure to the unemployment rate. This sensitivity test replaces the unemployment rate with an employed labor force index. We demonstrate the results of each test in online Supplemental Appendix Tables A4, A5, and A6, which confirm the principal findings of this study and support the logic of our preferred method. Although these robustness tests cannot fully guarantee the validity of our IV, they do rule out certain violations to the exclusion restriction, such as prerecession nonparallel trends, and rule out specification issues with the IV and unemployment measures.
We also consider more generally how to interpret our findings given the relation between educational pursuits and migration patterns. If a rural student, who was otherwise likely to enter a college or university outside of the county, instead enters a local institution, then the increase of enrollment in the local institution reflects only a change of location in postsecondary education. 14 In contrast, if a rural student, who was otherwise likely to enter the local job market, enters a local institution, then the increase of enrollment in the program means a real increase in postsecondary education enrollment. We cannot observe the true counterfactual outcome for students attending local colleges, but we can test the extent to which local unemployment affects the share of college students coming from within that state. If local job loss primarily affects where postsecondary enrollment occurs, rather than how much of it occurs, we might expect a change in the proportion of students from in-state versus out-of-state. We do not observe this phenomenon, however (see online Supplemental Appendix Table A7, and therefore believe the primary mechanism through which local unemployment affects postsecondary enrollment is through students opting out of immediate entry into the local labor market. 15 There are certainly caveats to inference, which we describe further in the section below.
Discussion
The correspondence between labor market conditions and the schooling choices of youth is complex and bidirectional. Prior research has shown that college enrollment is countercyclical, tending to increase as markets go into decline (Barrow & Davis, 2012). We confirm this finding using an IV approach with nearly two decades of national data. We then zoom in to explore how this dynamic occurs at the community level, and how the dynamic varies by the type of community. We hypothesized, in particular, that students in remote rural areas may respond in unique ways to community job loss, due to their relative geographic isolation and fewer local job opportunities associated with college education. Identifying determinants of educational decision making in rural regions is highly relevant for policy, given the low levels of postsecondary enrollment and attainment in these regions.
Our analysis concludes that each 1 percentage point increase in unemployment translates into a 10% increase in postsecondary enrollment in rural counties, a 5% increase in metro-adjacent counties, and no clear increase in metropolitan counties. In other words, the average rural county would gain approximately 270 more enrolled students, and the average metro-adjacent county would gain approximately 180 more enrolled students by 1 percentage point increase in unemployment rates. These effects do not appear to be driven by openings (or closings) of local colleges on the extensive margin. Instead, this large increase in enrollment at rural postsecondary institutions due to recessionary job losses can be explained by (1) more students choosing to enroll in 2-year degree and 4-year degree programs and (2) more students choosing to transfer from 2-year to 4-year institutions. Increases in enrollment in metropolitan postsecondary institutions are alternately explained by increases in full-time enrollment and delayed student graduation. Results are robust to using alternative measures of local labor market conditions instead of the unemployment rate and to a reverse causality falsification test.
These findings confirm descriptive trends presented in earlier research. Marré (2014) noted that during the 2000s decade overall, both rural and metropolitan populations experienced a rise in college educational attainment, but rural populations lagged behind metropolitan populations in college completion and bachelor’s degree completion. The economic returns to bachelor’s degrees also rose significantly during this period, even as unemployment grew. Our findings indicate that youth and adults living in rural counties took particular advantage of these shifting economic circumstances to pursue higher education. They did so, even while facing known barriers to college, such as weaker average high school preparation and counseling (Provasnik et al., 2007; Sutton & Pearson, 2002) and greater financial and socioeconomic constraints (Byun et al., 2012; McDonough et al., 2010). We should note that the increased educational attainment we observe in rural regions during this period, though heartening, certainly pales in comparison to the financial devastation experienced by many. The implication from this study is—of course—not to prescribe economic recession as some sort of educational policy solution. Instead, it is to highlight the vital role that community colleges and other local institutions play in offering training and career preparation during recessionary periods, particularly for rural youth and adults.
This research also speaks more broadly to the role of local economic opportunities in shaping educational trajectories of youth and young adults. Foote and Grosz (2020) showed in a national study that local 2-year college enrollment rose on average by three students for every 100 workers laid off in the local labor market. Using a new IV for local job loss, our study confirms this pattern and illustrates that rural communities are most likely driving this association between local job loss and college enrollment. Our findings therefore also lend empirical support to an analysis by Petrin et al. (2014) of a national survey of rural youth, which underscored student perceptions of the availability of local economic opportunities as the most significant factor predicting student intentions to either stay or leave their rural community. While we do not in this article analyze migration intentions as did these authors, we do find that actual shifts in local economic opportunities change rural students’ real choices about their investments in education.
Study Limitations
This study contains certain limitations. First, this work cannot speak to how community job loss affected educational attainment of young adults in rural areas that lacked a nearby college or university. Among rural counties in the United States, only 30% have a Title IV eligible postsecondary institution within their borders (Table 2). Only 16% have such a postsecondary institution that draws at least 90% of students from within the state. Without information available on how many students move out of their community to attend college elsewhere, we are limited in our inferences about this population. Examining the effects of local economic shifts on student out-migration in areas with no local colleges or universities would therefore be a fruitful area for future research.
A second limitation is the difficulty in ascertaining whether differences across regions are statistically significant. Although job loss in rural areas appears to have at least 7% larger effect on postsecondary enrollment than the same amount of job loss in metropolitan areas, this difference is not significant when formally tested. However, the 90% confidence interval of the rural-metropolitan difference in enrollment effects ranges from negative 1% to positive 15%, and the 90% confidence interval from the alternative IV ranges from 0% to 20% (see online Supplemental Appendix Figure A2). We consequently feel reasonably confident that this unemployment-enrollment dynamic operates most strongly within rural regions.
A final limitation is the degree to which we can explore mechanisms. We did explore the main drivers of enrollment increases in terms of changes to student inflow and student outflow (graduation and transfer). However, we cannot trace student educational decisions that involve moving out of the county or involve moving into the county from elsewhere. This limits our capacity to fully understand enrollment patterns at postsecondary institutions that do not draw primarily from the local community (Table 8). We also cannot fully ascertain which types of students existed on the “margin” and chose to enroll in college due primarily to shifts in local employment opportunities. Are these students on the extensive margin more economically advantaged, or more economically disadvantaged? What would these students have done in the counterfactual if community jobs had not disappeared? And, are these community-level changes in college attendance behavior permanent or transitory changes limited to the recession period? These questions again could provide interesting avenues for future research.
Sensitivity Test: Alternative Definitions of Local Institutions
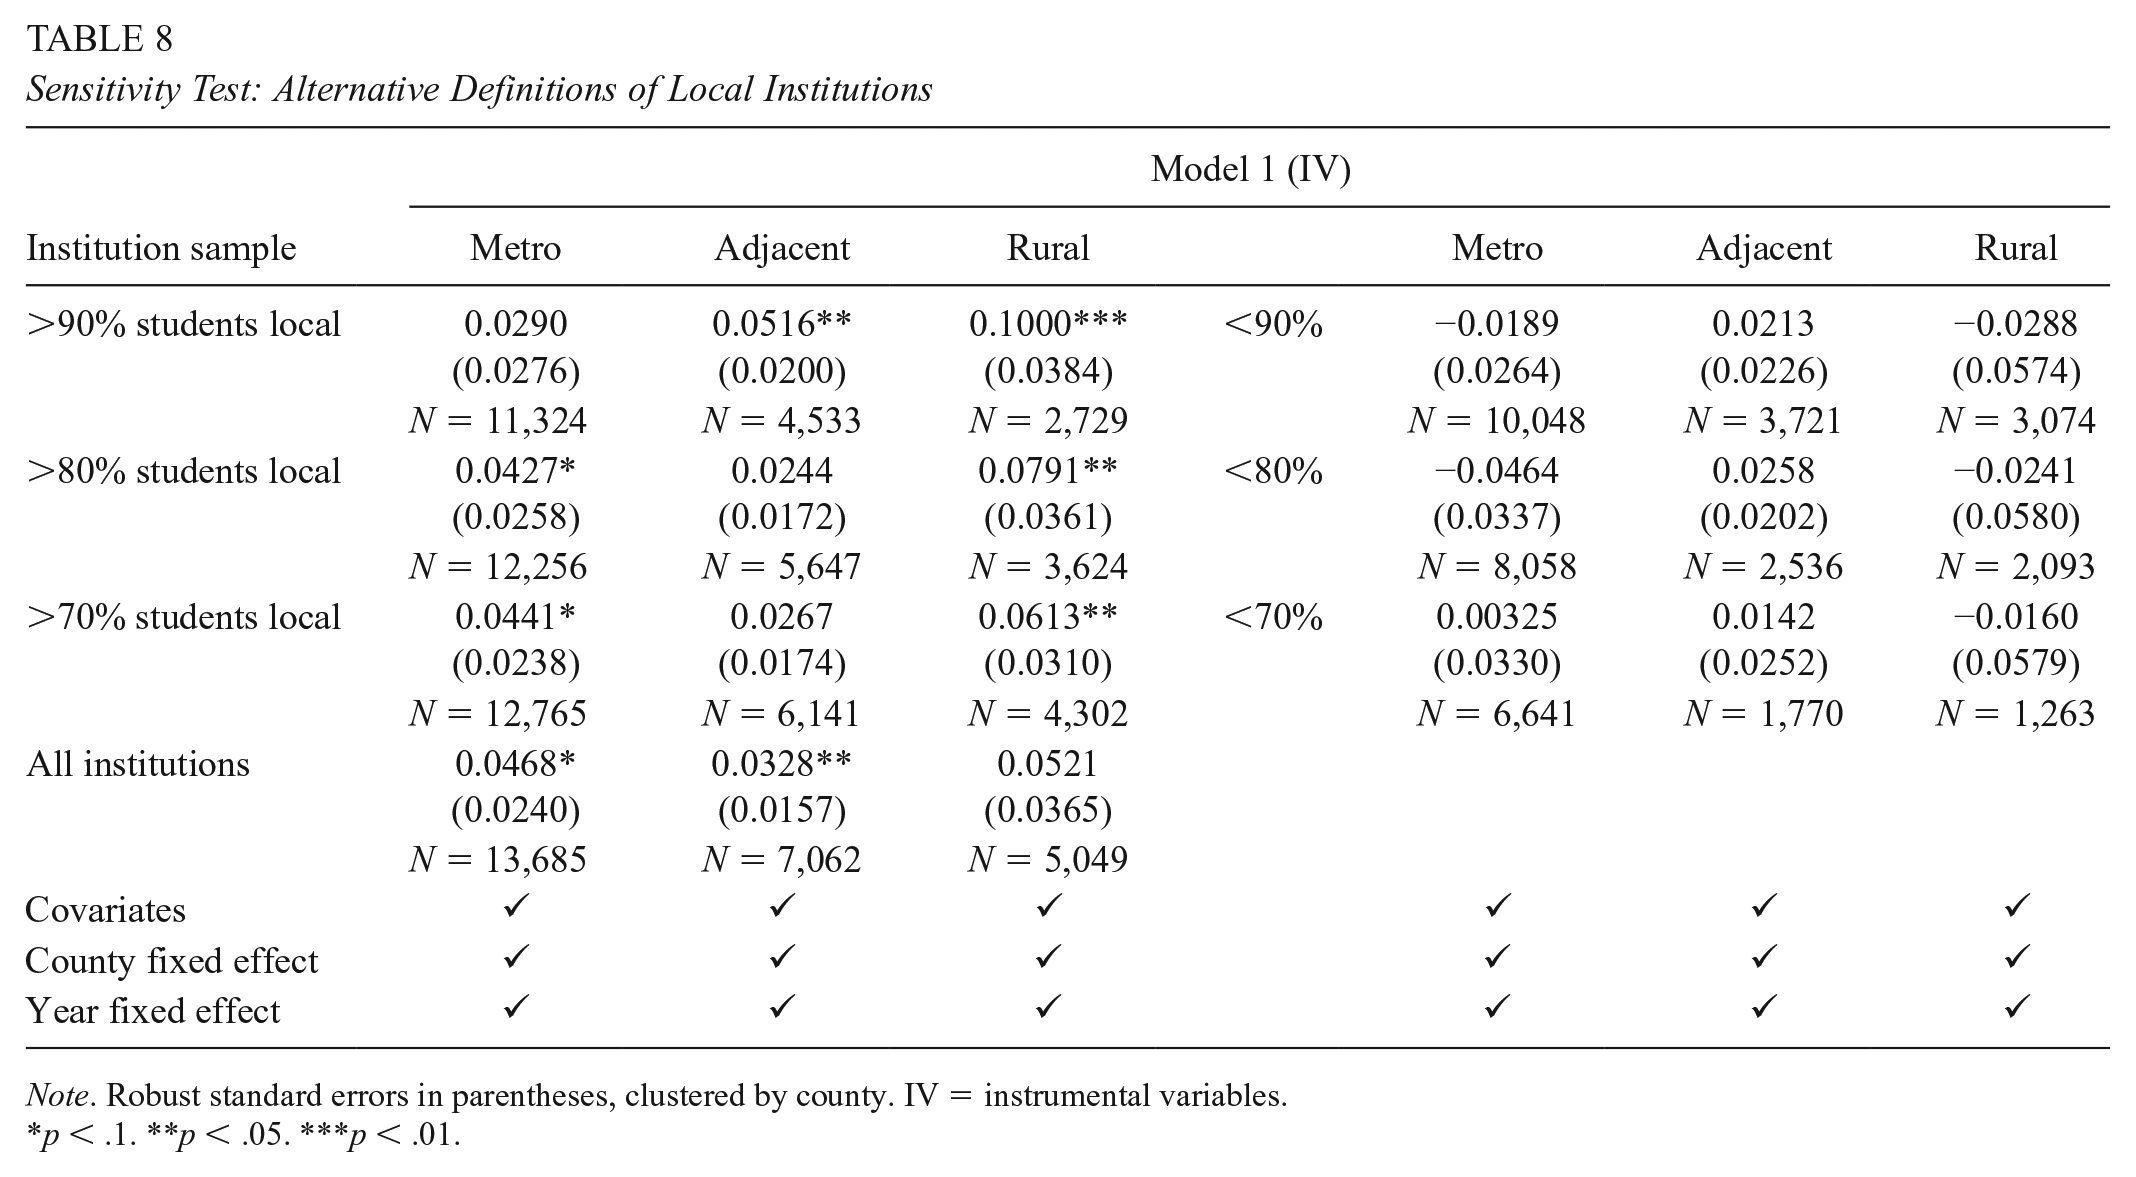
Note. Robust standard errors in parentheses, clustered by county. IV = instrumental variables.
p < .1. **p < .05. ***p < .01.
Policy Implications
The current study explored geographic trends in higher education during the Great Recession. In the midst of a new economic downturn prompted by the global COVID-19 pandemic, our observations from the 2008 recession may nonetheless provide some hope for institutions of higher education now suffering from budget cuts—particularly for those institutions located in remote rural regions of the country. In communities hit hard by recessionary job loss in construction and manufacturing, many individuals either flocked to the nearest college to enroll, delayed graduation, or chose to transfer from their 2-year program to a 4-year program. Colleges operating during the Great Recession benefitted from significant federal aid through the American Recovery and Reinvestment Act of 2009, which partly buffered colleges from the most severe budgetary cuts. Without the same level of federal support during the current crisis, colleges may struggle to survive even if student enrollment rebounds. Furthermore, the Great Recession disproportionately affected employment in construction and manufacturing industries, whereas the current downturn has disproportionately affected the service industry (Dalton, 2020). It remains to be seen whether different forms of job loss differentially affect postsecondary enrollment trends in metropolitan, metro-adjacent, and rural regions.
As another potential silver lining of our findings to the current context, the rapid expansion of virtual schooling may signal an expansion of the availability of postsecondary education options for rural students. Nevertheless, there are still significant obstacles toward achieving high-quality virtual education. Online college classes are associated with lower levels of student success and a lower likelihood of continuing college education (Bettinger et al., 2017). Moreover, rural communities often have limited access to broadband internet services that could facilitate virtual learning (Federal Communications Commission, 2018; LaRose et al., 2007). Without intensive policy attention to these issues, distance learning alone is unlikely to solve rural America’s college access and attainment problem.
Finally, we acknowledge that increased college going in rural areas could present a double-edged sword. According to some scholarship, rural students hold different educational aspirations than do nonrural students due to their unique “attachment to place” (Burnell, 2003; Hektner, 1995; Howley et al., 2009). If rural students value ties to the community over traditional measures of economic mobility, then increased levels of education may not hold as much individual value. Furthermore, if increases in college enrollment and attainment lead to an acceleration of the “brain drain” of rural communities, there could be long-term adverse consequences for rural economies and schools. In any given year, more than 6% of nonmetropolitan bachelor’s degree-holders in the U.S. migrate to a metropolitan area. Carr and Kefalas (2010) describe this out-migration of educated youth from rural communities in stark terms: “The youth exodus is a zero-sum phenomenon: it benefits the destination cities and hurts the regions that migrants flee (p. 5).” This trend makes it more difficult for rural communities to find qualified doctors, business owners, and teachers. It also contributes to the notable aging of rural regions (Glasgow, 2000). Improving college attainment rates is an important first step, but policymakers should invest in efforts to achieve this goal while also encouraging youth to “give back” to their communities (e.g., Farmer et al. 2006), addressing gender disparities in career pathways (e.g., Corbett, 2007), and confronting the implications of out-migration for families and mental health (e.g., Elder et al., 1996; Hektner, 1995).
Supplemental Material
sj-docx-1-ero-10.1177_2332858421997170 – Supplemental material for The Importance of Place: Effects of Community Job Loss on College Enrollment and Attainment Across Rural and Metropolitan Regions
Supplemental material, sj-docx-1-ero-10.1177_2332858421997170 for The Importance of Place: Effects of Community Job Loss on College Enrollment and Attainment Across Rural and Metropolitan Regions by Lucy C. Sorensen and Moontae Hwang in AERA Open
Footnotes
Notes
Authors
LUCY C. SORENSEN is an assistant professor in Public Administration and Policy at University at Albany, State University of New York. Her research uses applied econometrics to address questions related to K–12 education policy, human development, and social inequality.
MOONTAE HWANG is a PhD student in Public Administration and Policy at University at Albany, State University of New York. His research focuses on educational equity from the perspective of public finance.
References
Supplementary Material
Please find the following supplemental material available below.
For Open Access articles published under a Creative Commons License, all supplemental material carries the same license as the article it is associated with.
For non-Open Access articles published, all supplemental material carries a non-exclusive license, and permission requests for re-use of supplemental material or any part of supplemental material shall be sent directly to the copyright owner as specified in the copyright notice associated with the article.