
Abstract
Several large-scale survey efforts have attempted to understand teachers’ experiences in the early months of the pandemic. Our study complements this literature by providing direct evidence of teachers’ work prior to and after the onset of COVID-19. We leverage unique longitudinal time use and affect data on 131 teachers from one district across the 2019–2020 school year. Specifically, we provide a full accounting of teachers’ instructional activities, their reports of their positive affect and negative affect while engaged in these activities, and the extent to which teachers’ work experiences changed post-COVID. Our results suggest a large reduction in teachers’ daily instructional minutes, which were replaced with increased planning, paperwork, and interactions with colleagues and parents. Teachers’ overall positive and negative affect did not change post-COVID. But teachers’ affective responses to specific work activities did. Post-COVID, we saw increases in teachers’ positive affect when with students.
Keywords
Introduction
In the spring of 2020, the COVID-19 pandemic led to a shutdown of school buildings across the United States and a subsequent unplanned nationwide transition to distance learning. For teachers, these school closures resulted in a transformation of many facets of their work, requiring them to take on new and often shifting roles, including learning new technologies and juggling work and home responsibilities (see Hamilton et al., 2020; Kraft et al., 2021, for more details). In-person teaching in schools has long been characterized by its predictable daily structure, 1 but the pandemic, as has been evidenced in several large-scale surveys, introduced unprecedented changes in teachers’ daily time use (Educators for Excellence, 2020; Hamilton et al., 2020; Kraft et al., 2021). And, the pandemic also had adverse effects on many teachers’ overall well-being, with increases in stress, anxiety, and burnout (Diliberti & Kaufman, 2020; Reich et al., 2020; Will, 2020).
It is clear that the pandemic introduced a massive exogenous shock to the work lives of teachers, and a number of studies have begun to shed light on how teachers navigated these rapid, unplanned changes to their working conditions. At the same time, prior COVID-19 research shares a fundamental limitation—most existing studies rely exclusively on evidence collected after schools closed. There remains a need for evidence about how teachers’ work changed as a result of the pandemic, requiring data collected both before and after school closures. There is also a need for data on how teachers experienced specific work activities during this time. We know that COVID-19 resulted in elevated levels of stress and burnout, but how did teachers’ in-the-moment responses to work change as a result of the pandemic? Such evidence would provide researchers, policymakers, and the public with a more accurate and more nuanced portrait of how teachers worked during this unprecedented time.
Our article provides, to the best of our knowledge, the first detailed evidence of teachers’ work before and after schools closed in response to COVID-19. We leverage unique longitudinal data on teachers’ daily work activities and affect collected across the 2019–2020 school year using the day reconstruction method (DRM). The DRM asks respondents to provide an exhaustive accounting of their work activities during a school day and report specific emotions on selected activities. We draw on data from 131 teachers in one large suburban school district. Beginning in fall 2019, participants completed DRMs on up to three timepoints prior to school closures and one additional timepoint in May 2020, after schools had closed. Given the scope of our longitudinal data, we are able to describe in detail the changes in teachers’ daily work in the initial months of the pandemic.
The remainder of the article is organized as follows. We begin by situating the study in research on teacher time use and affect. Then, we summarize the evidence base that has emerged on how teachers have responded to COVID. We introduce the DRM as a tool uniquely suited for capturing the dynamic interplay between time use and affect, particularly in times of rapid transformation of teachers’ work. We describe our sample of 131 teachers before presenting our findings. Throughout the article, we refer to data collected pre-COVID and post-COVID (after schools had shifted to distance learning in spring 2020). 2
Teacher Time Use
Studies conducted prior to the pandemic provide few comprehensive accountings of teachers’ time use. One exception is the American Time Use Survey (ATUS), which includes national data on the work patterns of teachers and other professionals. The ATUS employs a random sample drawn from households that participated in the U.S. Current Population Survey. Each ATUS participant is asked to complete a time diary by describing all of their activities for a 24-hour period. Using ATUS data from 2003 through 2006, Krantz-Kent (2008) reported a number of noteworthy features of teachers’ time use and how it compared with that of other professionals (e.g., teachers are more likely to work on Sundays). More recently, West (2014) used ATUS data from 2003 to 2010, finding that teachers reported working approximately 38 hours per week during the school year and 21.5 hours per week during the summer months.
While the ATUS provides an overall picture on teachers’ hours of work, it does not provide any information on specific work activities. There is some literature on how teachers spend their instructional time. Rowan and colleagues employed teacher instructional logs to investigate teachers’ curricular and instructional practices in literacy and mathematics (Rowan, Camburn, & Correnti, 2004; Rowan, Harrison, & Hayes, 2004). And a recent study by Engel et al. (2021) used detailed observations of teacher instructional time use in kindergarten classrooms, documenting the large amount of noninstructional time embedded in typical kindergarten teaching. But studies like these forgo an examination of teachers’ work activities overall for a close focus on instruction itself.
One of the few sources of evidence of a full complement of teacher activities is the Teaching and Learning International Study (TALIS), an international survey sponsored by the Organisation for Economic Co-operation and Development (OECD). TALIS is administered to nationally representative samples of teachers in 34 participating countries. The 2013 TALIS survey asked teachers in Grades 7 to 9 to report, for a recent calendar week, the number of hours spent on the full spectrum of work activities. U.S. teachers reported working 45 hours per week on average. Compared with other work activities, U.S. teachers spent the most time, by far, on teaching—an average of 27 hours per week. U.S. teachers also reported spending substantial time each week on planning (7 hours), grading student work (5 hours), and extracurricular activities (4 hours). U.S. teachers also reported spending more time on teaching than teachers in any other country. Indeed, the average number of hours teaching for all OECD countries combined 7.5 hours less per week than the U.S. average. We anticipate that our pre-pandemic evidence might resemble the patterns observed in TALIS, and any departure from this pattern observed in post-pandemic evidence could indicate the restructuring of teachers’ work that took place after widespread school shutdowns.
Teacher Affect
A second window into how teachers’ work changed in the wake of the pandemic is evidence about teachers’ affect while working. Throughout this article, we use the term affect to describe the range of emotions individuals experience when engaging with their environment (Coan & Allen, 2007; Watson et al., 1988). Contemporary psychological research suggests that these specific emotions—or affective states—can be characterized by two broad dimensions: positive and negative affect (Ekkekakis & Petruzzello, 2000; Tuccitto et al., 2010; Watson et al., 1988). Positive affect generally corresponds with pleasurable engagement with one’s environment (e.g., feeling content, interested), while negative affect captures unpleasurable affective states (e.g., feeling afraid, stressed). In the context of teaching, positive and negative affect should be thought of as distinct from, but related to, more global attitudes about one’s work. For example, Morgan et al. (2010) found that teachers’ emotions while working were associated with job satisfaction; the absence of positive experiences, rather than the occurrence of negative experiences, undermined teachers’ overall commitment and efficacy. They also observed that teachers’ day-to-day experiences had a greater impact on their affect than experiences that were more distal to the classroom, such as policy messages from outside entities. Similarly, using the experience sampling method (ESM), Jones and Youngs (2012) documented that teachers’ in-the-moment affective responses at work were associated with their year-end levels of burnout and retention plans.
There is evidence that teacher affect can influence students’ achievement, motivation, and emotional states. This influence is believed to occur through nonverbal cues (e.g., nodding or smiling) and behaviors that, in turn, help define the socioemotional classroom climate for students (McLeod, 1995). There is considerable evidence that affect shared through teacher-student relationships has a significant impact on young children’s adaptation to school (e.g., Pianta et al., 1995). A series of studies by McLean and colleagues have explored the role that teachers’ anxiety and depressive symptoms play in classrooms, including their impacts on instructional practice and students’ academic performance (e.g., McLean & Connor, 2015, 2018; McLean et al., 2018). For example, McLean and Connor (2015) measured depressive symptoms among 27 teachers, finding that increases in depressive symptoms were associated with decreases in instructional quality (as measured through classroom observation) and lower levels of mathematics performance. In more recent work (McLean & Connor, 2018), the authors unpacked the impact of depressive symptoms on classroom instruction even further, finding that depressive symptoms were connected with the quality of feedback teachers gave their students (McLean & Connor, 2018). McLean et al. (2018) examined the association between depressive symptoms and a series of common classroom practices, finding that teachers with elevated depressive symptoms are less likely to engage in full-class instruction and to engage in planning. Collectively, these results suggest that teachers’ well-being has direct consequences for the quality of their teaching. At the same time, further research is necessary to understand how these more global characteristics of well-being are associated with teachers’ in-the-moment affective responses to their work.
Measuring Time Use and Affect Together
Measuring how people feel during different activities is a primary purpose of the DRM. This feature reflects a central point of kinship between the DRM and its predecessor, the ESM. To contextualize the DRM’s contemporaneous measurement of activity and affect, we first consider distinctive features of ESM.
The main advantage of ESM over traditional self-report methods is that data generated by the former is believed to have greater ecological validity. Instruments are considered ecologically valid to the extent that they capture a representative sample of stimuli and subsequent responses (both actions and emotions) as they naturally co-occur in an environment. ESM designs thus seek to attain ecological validity by randomly sampling moments of social life as they unfold in a natural environment. Researchers have previously called for the use of the ESM in educational contexts (Keller et al., 2014; Zirkel et al., 2015), but applications with teachers remain relatively uncommon. We found only two recent teacher ESM studies, one conducted by Jones and Youngs (2012) involving 42 early-career teachers in Michigan and Indiana and the other drawing on a sample of 32 German secondary teachers (Keller et al., 2014). Both studies affirmed that the ESM provides useful insight into human experience by revealing “typologies” of subjective experience defined by recurring associations between specific activities and experiences (Csikszentmihalyi & Larson, 2014; Delle Fave & Bassi, 2000; Hektner et al., 2007). In both studies, teaching itself was generally associated with higher levels of positive affect.
The DRM was designed to maintain many of ESM’s advantages while removing some of its disadvantages. As previously discussed, like the ESM, the DRM captures evidence of activity and emotion as they co-occur. When completing the DRM, respondents begin by outlining the episodes of the day, which is intended to “elicit specific and recent memories, thereby reducing errors and biases of recall” (Kahneman et al., 2004, p. 1777). Kahneman et al. (2004) outline multiple advantages of the DRM compared with the ESM: The new method . . . imposes less respondent burden; does not disrupt normal activities; and provides an assessment of contiguous episodes over a full day, rather than a sampling of moments. Finally, the DRM provides time-budget information, which is not collected effectively in experience sampling. (p. 1777)
The developers also argue that the DRM is less expensive and less burdensome than the ESM.
One of the few studies, and perhaps the only other one, that has utilized the DRM with teachers was conducted by Tadić et al. (2013). In that study, 131 teachers completed a DRM instrument three times. Multilevel analysis of the DRM data showed that levels of motivation and happiness experienced by teachers varied significantly within days. The researchers found that, for most work activities, teachers’ motivation during an activity buffered the negative association between work demands and happiness. We note two important differences between this study and ours. First, teachers in the Tadić et al. (2013) study only reported on two activities “in which they spent most of their time,” whereas teachers in the present study reported on all activities occurring during the day. Second, teachers in Tadić et al. (2013) reported on activities that occurred on the preceding day, whereas teachers in the present study completed the DRM at the end of the day.
The preceding review of the literature points out the value of (a) understanding how teachers devote time to specific work activities, (b) being conceptually clear in the emotional constructs used, and (c) accounting for the dynamic way in which affect interacts with specific work responsibilities.
Research on Teacher Time Use and Affect During COVID-19
While there is considerable literature on teachers’ work experiences during the pandemic, this body of research provides mixed, and limited, evidence about how teachers’ work changed in the pandemic, and how teachers experienced these changes. Rather than present an exhaustive accounting of COVID scholarship, we briefly present what we see as the relevant findings for our current investigation. We also provide some information on the methods that researchers have used to understand teachers’ experiences during this time.
Teacher Time Use During COVID-19
To our knowledge, there are no studies that have comprehensively looked at how teachers structured their time during COVID-19, but some studies did provide useful descriptions about teachers’ work nonetheless. One recurring finding is that teachers reported working more hours since schools closed in spring 2020. In a survey fielded by Horace Mann (2020), 77% of educators surveyed reported spending more time working than they were a year ago. A national USA Today poll of more than 500 teachers found that most reported working more than usual (Page, 2020). A survey of more than 10,000 teachers in Arizona conducted by Expect More Arizona (2020) found that more than half of teachers (55%) reported an increase in their weekly work hours during distance learning, with 30% reporting a significant increase. About 25% of teachers reported a decrease of their weekly work hours during this time. It is worth noting that these surveys typically used a single survey item (or a small set of items) to get retrospective estimates of changes in time use, a strategy prone to recall and estimation errors.
With regard to individual instructional activities, Educators for Excellence (2020) asked a nationally representative sample of 600 teachers to estimate how much time they were spending on different facets of teaching compared with the period before distance learning. About 70% of teachers reported spending more time reaching out to students, and 74% reported spending more time than before reaching out to parents. More than half of teachers reported spending somewhat less time (34%) or much less time (19%) on instruction prior to the move to distance learning. In terms of grading and providing student feedback, roughly one third of teachers reported spending more time and about the same proportion reported spending less time on this activity.
Teacher Affect During COVID-19
Surveys and interviews with teachers in the initial months of the pandemic raise concerns about the impact of COVID on teachers’ overall well-being. But they provide little evidence of how teachers responded emotionally to their work. Across repeated surveys with educators in spring 2020, EdWeek (Kurtz, 2020a, 2020b) found widespread declines in teacher morale in the early months of the pandemic. Bintliff (2020) conducted a mixed-methods study examining some of the underlying causes of decreased well-being for teachers working in underresourced schools in southern California. The majority of these teachers reported a deep sense of worry and concern for students, including absenteeism, as well as basic needs and well-being.
The story emerging from COVID research on teachers is about how the pandemic has affected their capacity to engage with their work. Educators for Excellence (2020) found that an overwhelming majority of teachers thought “staying focused on teaching and learning in the midst of a pandemic” was a somewhat serious (46%) or very serious (41%) challenge. And, analyzing interviews with 40 teachers across the country, Reich et al. (2020) found the loss of professional identity, uncertainty, and burnout to be central concerns for teachers in the transition to remote learning. Similarly, Kraft et al. (2021, p. 727) found that the rapid switch to “emergency remote teaching resulted in a sudden, large drop in teachers’ sense of success.” The authors found that supportive working conditions played a protective role, with teachers reporting less of a decline in their sense of success in schools with stronger working conditions.
In sum, it appears that the pandemic led to changes in teachers’ daily time use—including reduced time spent on instruction—as well as largely negative consequences for teacher well-being, although we could find no studies that directly measured teacher affect (i.e., their emotional responses to specific work experiences). Although some studies include nationally representative or diverse teacher samples (e.g., RAND), most studies conducted to date rely on cross-sectional data. The only exception we could find was the EdWeek surveys, which have been routinely conducted with the same set of teachers. Few of these studies have asked teachers to provide a detailed account of either their time use or their affective experiences tied to work activities, and none (to the best of our knowledge) have relevant comparison data from prior to the pandemic. Therefore, the current study adds to this literature by leveraging comprehensive accounts of teachers’ activities and affect over time, including both prior to and post-COVID. Specifically, this study addresses three questions:
How has teachers’ time use changed during the initial period of the pandemic, in terms of overall number of hours worked and teachers’ allocation of time, across an exhaustive set of instructional activities?
How has teachers’ affect while working, including their positive affect and negative affect, changed during the initial period of the pandemic?
How has the relationship between specific teaching activities and affective responses changed during the initial period of the pandemic?
Method
Sample and Data
Data for this study come from a single suburban district serving a large number of students of color and historically underserved populations. To help understand this district, and to contextualize our results, we provide descriptive statistics for the characteristics of students in this district, drawing on the Stanford Education Data Archive 4.0 (SEDA 4.0; Fahle et al., 2021). The total enrollment of our district is in the top quartile in the nation, the percentage of Hispanic and Black students is in the top quartile in the nation, and the district’s average on the SEDA 4.0 socioeconomic status index is in the lowest quartile of the national distribution. The average achievement level of the district falls into the second quartile on the national distribution, indicating lower than average achievement.
A total of 131 teachers participated in the study, representing 69% of eligible teachers in the district. Among teachers who completed the DRM, 90% were female. Sample teachers had, on average, just under 14 years of teaching experience, with just over 12% having 5 or fewer years of experience. Most (72% of the teachers) taught at the elementary school level, while 10% taught in Grades 6 to 8, and 18% taught in Grades 9 to 12. The vast majority of our teachers (89%) were White.
In fall 2019, we set out to use the DRM to sample teachers’ experiences across the school year. Our sampling plan called for two DRM days in the fall (in October and November) and two DRM days in the spring (in February and March). We were able to collect data on three DRM days (two in fall 2019, one in spring 2020) prior to school closures in March 2020. We delayed data collection on the fourth DRM day from March to May on account of the onset of the pandemic. 3 The final analytic sample used for this study contained 299 DRM reports for the 131 teachers. Sixty-nine percent of the teachers in the sample answered the DRM two or more times, and the remaining 31% answered the DRM just once. Our analyses with the mixed-effects models outlined below leverage the full sample by using full information maximum likelihood estimation (e.g., Raudenbush & Bryk, 2002).
Instrument
The DRM measures the activities in which teachers engage, how they feel during each activity, and who teachers were with during the activity. This information is captured in two steps in a web form that is completed at the end of the workday. First, teachers list the episodes of work activity during their day. In line with existing conventions, participants identify their own episodes. The DRM allows the participant to document the length of each work episode capturing the start and end times of each. Listing out the episodes that make up the day has the effect of “reviving” memories about the specifics of each episode (Kahneman et al., 2004). 4 In a second step, teachers answer a brief, structured questionnaire in which they record details (e.g., affect levels, context details) about each episode. Given our data collection regime where teachers reported on up to four DRM days, our data have the following structure: episodes nested within days, nested within teachers.
The DRM was originally designed by behavioral economists to measure individuals’ well-being (Kahneman et al., 2004). As previously discussed, DRM data are believed to have strong ecological validity and is less prone to recall errors that diminish the validity of self-reports. Furthermore, the DRM appears to provide highly similar information on affect intensity as the ESM (Dockray et al., 2010; Kahneman et al., 2004).
Measures
To examine how teachers’ work changed after schools closed in response to COVID-19, we used DRM data to measure three constructs: teacher work activity, positive affect, and negative affect. DRM items were developed and refined through cognitive interviews with 22 K–12 teachers. The major focus of the cognitive interviews was to learn whether activity categories made sense to teachers and to discern teachers’ comfort and willingness to report how they felt while teaching. Feedback from the interviews was incorporated into a revised DRM instrument that was pilot tested with 23 teachers in the study district in a prior year. 5 Each of the study’s three constructs is described below.
Work Activity
Teachers reported their work activity in response to the following question: The first step of this survey is to create a list of work activities you did today. For each activity, choose a start and end time and a category from the drop-down list that best describes it. You can also add a second activity if it occurred at the same time.
The drop-down list included the following 10 activity categories: planning, paperwork, instruction, noninstructional activities with students, grading or working with assessment data, interacting with colleagues, interacting with administrators, professional development, interacting with parent(s), personal activities.
These 10 activity items are intended to capture how teachers allocate their time across broad domains of work. Feedback received in cognitive interviews and pilot data indicated that these activities covered a substantial portion of teachers’ work activities.
Positive and Negative Affect
Teachers’ affect while working was measured with a modified version of the widely used Positive and Negative Affect Schedule (PANAS; Watson et al., 1988). The PANAS is designed to provide valid and reliable measurement of two primary dimensions of affect: positive and negative affect. Watson et al. (1988) found that their 10-item PANAS scales were internally consistent and correlated strongly with lengthier measures. Important for this study, Watson et al. (1988) found that the scales captured fluctuations in affect over time when administered with instructions like “right now” or “today.”
Positive and negative affect scales in the DRM include 12 items measuring positive affect and 12 items measuring negative affect.
Positive: Active, Alert, Attentive, Competent, Content, Determined, Enthusiastic, Excited, Inspired, Interested, Proud, Strong
Negative: Afraid, Ashamed, Distressed, Frustrated, Guilty, Hostile, Irritable, Jittery, Nervous, Scared, Stressed, Upset
The question that asked teachers the degree to which they experienced these 24 emotions during an activity was as follows: How did you feel while you were [providing instruction, planning etc.]? The response choices for these items were: not at all, a little, some, a lot, and very much.
Analysis Plan
To answer the first two research questions examining teachers’ time use, affect, and their relationship before and after COVID, we drew on a series of summary statistics and multilevel models. For each of our outcomes, we began by examining the variability across episodes, days, and teachers along with an assessment of any differences before and after the shift to remote learning. We first fit a three-level model that decomposes the variance in each outcome across episodes, days, and teachers. Our analytic model was as follows:

At Level 1 (episode level), we use
For analyses that examined the composition of all time and activities in a day, we drew on a model that was similar to that of Equation (1) but was reduced to a two-level model. Specifically, we estimated the parameters of a two-level model that nested days within teachers. Like the three-level analysis, we also introduced a fixed effect at the day level to assess the impact of COVID on the daily composition of teachers’ activities and time use.
To summarize differences in affect across activity types, we extended the multilevel models outlined in Equation (1) to include a fixed effect for activity type. Subsequently, we further extended these models to probe the potential moderating effect of COVID on the relationships between activity and affect by adding in an interaction term between activity type and the pre- and post-COVID indicator. In this series of multilevel models, we first draw on the coefficients connected to activity type to summarize the extent to which specific activity types are associated with higher or lower affect relative to other activity types. We then draw on the interaction coefficients to describe how the shift to remote learning moderated the relationships between affect and activity type. 6
Results
Research Question 1
We begin by describing teachers’ reported work time, its distribution across activities, and how time distributions changed in the transition from in-person learning to remote learning. Overall, we found changes in both the overall number of minutes worked pre- and post-COVID, as well as changes in the average episode length, or the number of minutes teachers reported engaged for a single episode (see Table 1). The results indicate that while the average length of an individual episode grew by 16.5 minutes, the total time spent across all episodes within a day dropped by nearly 85 minutes, from 415 to 330.
Average Daily Minutes per Activity Before and After COVID

Although the overall amount of time devoted to teaching activities dropped after COVID, changes in the time allocated to specific activity types were uneven. As shown in Table 1, two of the most notable shifts occurred in instructional time and planning time. Instructional time dropped from an average of 198 minutes per day before COVID to an average of just 61 minutes after COVID, or from 48% of a teacher’s day to 19%. In contrast, the time teachers spent planning rose from a pre-COVID level of 75 minutes to a post-COVID level of 108 minutes—from 18% to 33%. Other notable shifts in time use occurred in noninstructional time with students (decrease from 62 to 24 minutes) and grading/assessment (increase from 5 to 43 minutes).
In Table 2, we present results from our variance decomposition—between teachers, days, and episodes—for activity length and total daily time before and after COVID. When accumulating time use across episodes to summarize daily instruction, the results suggested that the total amount of time a teacher spent on teaching duties in a given day changed considerably from day to day. Of the total time spent each day on teaching duties across all reported days, approximately 26% was attributable to persistent differences among teachers and 74% was attributable to day-to-day variation within teachers. In terms of activity length, approximately 48% of the observed variation was attributable to persistent differences among teachers, 30% was attributable to differences across days within a teacher, and 23% was attributable to differences among episodes.
Variance Decomposition of Time Spent on Activities and Total Daily Time Spent on All Teaching Activities as Well as the Impact of Shifting to Remote Instruction

Note. SE = standard error; NA = not applicable.
p < .05.
Research Question 2
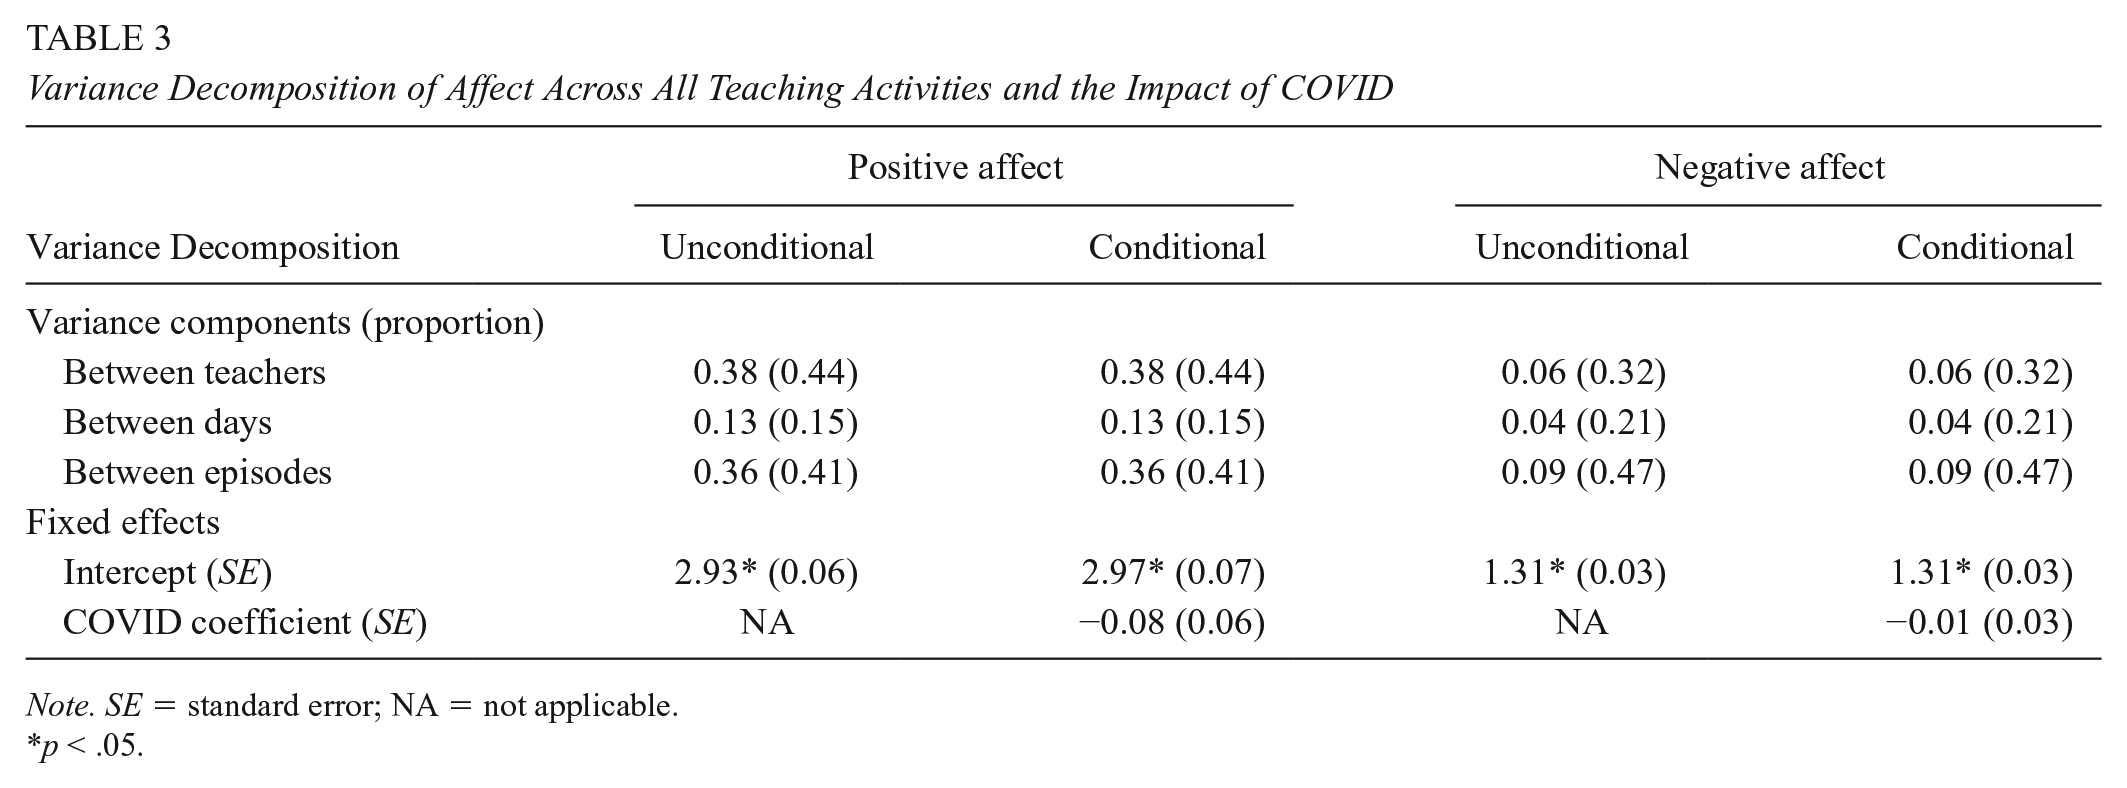
We next examined the extent to which COVID was associated with changes in teacher affect while working. Across all episodes, the average level of positive affect was about 2.93 (on a 1 to 5 scale). Results suggested that COVID had a mild and statistically insignificant dampening influence on teachers’ positive affect, as post-COVID positive affect decreased by about −0.08 on the original 1 to 5 scale or about −0.09 standard deviations. Relative to positive affect, reports of negative affect across activities were substantially less common both before and after COVID. The average level of negative affect was just 1.31 (on a 1 to 5 scale), and similar to the changes in positive affect associated with COVID, the shift to remote learning was associated with a small and statistically insignificant decrease in teachers’ levels of negative affect (see Table 3).
Variance Decomposition of Affect Across All Teaching Activities and the Impact of COVID
Note. SE = standard error; NA = not applicable.
p < .05.
Examining how reports of positive and negative affect varied by teacher, day, and episode, we saw that approximately 44% of the observed variation owed to persistent differences among teachers, 15% to variation within teachers across days, and the remaining 41% to variation among episodes within days (Table 3). That is, the variance decomposition of positive affect suggested that while there was considerable variation in positive affect across episodes and across teachers, much less variation owed to disparities across days. For negative affect, approximately 32% of its variation owed to teachers, 21% owed to days, and 47% owed to activities.
Research Question 3
Last, we use two related queries to probe teacher affect within specific activities to understand how the relationships between teaching activities and affective responses changed post-COVID. First, we examined the degree to which affect was higher or lower for certain activity types relative to other activities. Second, we investigated the extent to which the relationship between teaching activities and affective responses was moderated by COVID. The results are summarized in Table 4. We have italicized the results for the interaction terms to aid the reader in reviewing the table. For each activity, the first row shows the coefficient for the activity predicting affect, irrespective of whether data were collected prior to or post-COVID. The second row shows the overall association between the COVID indicator and the affective outcome. The third row shows the interaction between the instructional activity and the COVID indicator, providing information on the extent to which the association between the activity and affect changed post-COVID.
Relationship Between Activity and Positive Affect and the Extent to Which That Relationship Was Moderated by COVID

p < .05.
Our analyses indicated that affect varied considerably by activity type both in terms of magnitude and direction (Table 4). Overall, positive affect tended to be highest during instructional activities—positive affect, on average, was nearly a half of a standard deviation higher during instruction relative to all other activity types. Positive affect tended to be lowest when teachers were engaged in activities such as professional development and grading/assessment. There were far fewer disparities with negative affect across activity areas as reports of elevated negative affect tended to be infrequent. Two notable exceptions were when teachers were meeting with administrators and interacting with parents. On average, negative affect rose by 0.32 (more than a standard deviation) during meetings with administrators and fell by 0.24 (more than a standard deviation) when teachers were interacting with parents.
Our second query revealed that although COVID was not associated with significant changes in positive affect or negative affect overall, the shift moderated the relationship between affect and several specific teaching activities (Table 4). The most prominent finding in this query was that COVID moderated the relationship between activities and affect for noninstructional activities directly involving students. For example, the relationship between positive affect and noninstructional activities with students saw a reversal in its sign and a qualitative change in its magnitude. Pre-COVID reports of noninstructional activities with students tended to be associated with lower positive affect (i.e., 0.18 unit or 0.21 standard deviation decreased). However, post-COVID reports of noninstructional activities with students were associated with a positive and substantial shift in positive affect (i.e., 0.72 unit or 0.83 standard deviation increase). In other words, it appears that how teachers experienced their noninstructional time with students became significantly more positive post-COVID. Interaction terms for other activities—namely, instruction and meeting with others (including teachers, administrators, and parents) all were in the positive direction post-COVID, but none of these moderating effects were significant, possibly due to our sample size.
Negative affect also demonstrated moderating effects (Table 4). For example, there was a notable shift in negative affect during meetings with administrators and parents. Pre-COVID meetings with administrators were associated with higher levels of negative affect, but post-COVID meetings with administrators were associated with lower levels of negative affect. In contrast, Pre-COVID interactions with parents were associated with lower levels of negative affect, but post-COVID interactions with parents were associated with higher levels of negative affect.
Discussion
In the initial months of the pandemic, several large-scale research efforts were undertaken to try to understand the sudden changes to teachers’ work brought about by COVID-19 (Hamilton et al., 2020; Kraft et al., 2021). We argue that our study makes several unique contributions to this emerging literature. First, our research tool, the DRM, affords us the opportunity to explore in greater detail the nuances of teachers’ daily experiences. The teachers in our sample provide an exhaustive accounting of all of their work activities, in contrast to more common approaches that ask teachers about overall patterns in their time use. Additionally, we are able to track variation in teachers’ affect, including how their positive and negative affect vary across activities. Finally, we have true pre/post data; we provide the first empirical evidence of teachers’ daily timed use and affective responses to work activities in the months leading up to and in the months immediately following COVID-induced school closures. Given these unique design features, our study has resulted in findings that extend—and at times challenge—the field’s emerging understanding of how teachers navigated this unique time period.
Regarding teacher time use, it is clear that the pandemic introduced major shifts in teachers’ overall work hours and their time engaged in specific activities. The most notable finding related to specific activities was the changing role of instruction pre- and post-COVID. Prior to COVID, instruction consumed teachers’ workdays; they reported spending approximately 198 minutes per day on instruction (or 48% of their total work time), an estimate very much in line with 2013 TALIS findings (44%) of work time. But in the transition to distance learning, teachers greatly reduced their instructional time, down to just over 60 minutes (or 19% of their time). This finding is not surprising given what we know about teachers’ time use of other surveys of teachers during this same time (e.g., Educators for Excellence, 2020; Morning Consult, 2021). With teachers and students navigating access to technology, and with teachers having to transition their curriculum to the distance learning context, most districts across the United States were forced to reduce the amount of synchronous instructional time. Our results suggest that teachers filled the reduced instructional time with activities that would support the new challenges placed on them. In comparison to their time use prior to COVID, teachers spent significantly more time planning, grading, meeting with other teachers and their administrators, and interacting with parents. There are relatively few studies that have catalogued—with any level of specificity—the amount of time teachers have devoted to other activities (e.g., interacting with other teachers, administrators, or parents) during this time.
Our more surprising time use result is the reduction in overall hours worked in the initial months of school closures—from 415 minutes before COVID to 330 after. In many of the other survey studies we could find from spring 2020 (Expect More Arizona, 2020; Horace Mann, 2020; Page, 2020), teachers reported increases in their overall hours worked, such as the survey by Horace Mann (2020) where 77% of teachers reported working more time than a year ago. It could be the case that we are systematically underreporting teachers’ work activities. The survey methods literature suggests a different interpretation. Studies of the survey response process have found that when respondents are asked to report on behaviors across long recall periods (as they were in many of the COVID studies of teachers), their responses are often reports of generalities and/or perceptions rather than precise recall of specific events (Menon, 1994; Tourangeau et al., 2000). The fact that we can anchor post-COVID responses in how teachers used the instrument prior to COVID further increases our confidence in our time use estimates.
Even if teachers did work fewer hours overall in spring 2020 than has been reported, it is not altogether surprising. Like Americans in many other professions, teachers were asked to complete their work responsibilities alongside family obligations and the looming threat of a global pandemic. This reality further reinforces the need to pair assessments of teachers’ work activities with their emotional experiences of their work.
Our teacher affect results also add important information to our understanding of teachers’ immediate reactions in the wake of the pandemic. First, at a purely descriptive level, our DRM instrument appears to pick up on important within-person variation that has been commonly overlooked in existing studies of teachers’ responses to their work during COVID. Our variance decompositions show that positive and negative affect varied substantially both within and across teachers. Most of the within-teacher variation seems attributable to within-day differences across activities (e.g., providing instruction vs. planning vs. interacting with colleagues). As we describe in this article’s literature review, it is still relatively rare for studies to collect multiple assessments of affect; this is especially true of research in the wake of the pandemic, where most of all data collection efforts have relied on one-time surveys. Our findings urge caution in interpreting study data where teachers report on their typical time use or their overall responses to their work. Instead, there appears to be meaningful information at the level of teachers’ activities that is missed when we aggregate up to overall assessments of affect. Therefore, we encourage researchers to provide a more careful accounting of what goes on in and across teachers’ days and we see the DRM as a valuable tool for reflecting the fact that teachers’ affect appears to vary considerably depending on what teachers are doing.
Why do our affect-by-activity findings matter? If we only take teachers’ overall assessments of positive and negative affect prior to and post-COVID, our data suggest little movement in positive and negative affect after the onset of the pandemic. But this overall description masks important variation in how teachers responded affectively to their work, both prior to and after the pandemic. Across all administrations of DRM data, teachers reported significantly higher positive affect while directly teaching students. Consistent throughout teachers’ daily experiences are the positive emotions associated with the core work of teaching. These results correspond to Lortie’s (1975) psychic rewards of teaching; students drive teachers more than any other aspect of their work. Further supporting this essential notion is what happened after the transition to remote learning—while teachers reported lower (or unchanged) levels of positive affect in many other activities, activities with students appeared associated with increases in positive affect. Most notably, noninstructional time with students went from being associated with lower-than-average ratings of positive affect to higher-than-average. This is likely because the nature of these interactions changed a great deal—from supervising students at lunch, recess, and other noninstructional times to connecting through virtual interactions. And, even though there was no significant increase in positive affect while teaching post-COVID, it continued to be the activity associated with strong positive emotions. One interpretation is that the consistent reports of positive affect while with students were attributable to teachers’ personal connections with students and their care for students’ well-being. In the midst of dramatic changes to their work and the fears and uncertainty that accompanied the pandemic, teachers could have been buoyed by their interactions with students. It is also possible that the shift to virtual teaching reduced some of the challenges associated with in-person student interactions (e.g., incidents of behavior), which may have facilitated teachers’ sense of success with their students. Regardless, this finding, more than any other in this study, complements our existing picture of the work lives of teachers during this historic time and provides lessons for how we might structure teachers’ work moving forward.
Limitations
The current study has a number of limitations with regard to its design. There are some advantages that come with collecting data from 131 teachers in the same district, but the sampling strategy raises questions about the generalizability of our findings to other contexts. We collected data in Connecticut, a state that has provided clear leadership at the state-level guiding school plans in the transition to distance learning. The district in our study is notable for the close, positive relationship between the district leadership and the teacher union, which may be reflective of a district that paid careful attention to teachers’ needs during the transition to remote schooling.
Furthermore, while our data collection scheme improves on many other studies that were conducted during the initial months of the pandemic, we were still only able to collect data at one time point from teachers post-COVID. Our data provide a snapshot of teachers’ experiences during the month of May 2020, but as we have seen in several news reports, the expectations placed on teachers changed at several timepoints in spring 2020 and continued into fall 2020, when many school districts reopened to at least some of their students. Ideally, we would have longitudinal data that allowed us to put our post-COVID timepoint into better context. Still, the availability of data prior to COVID provides us with the opportunity to understand teachers’ responses to COVID in ways that most other studies have not.
It is also worth noting that fewer teachers overall provided DRM reports after COVID than did before the pandemic. We may systematically be missing reports from teachers whose experiences in the wake of the pandemic varied from their colleagues who did complete DRM surveys. However, we used models that allowed for missing data assuming missing at random, which is the standard assumption. That is, because the missing data occur at the day level, they are comparable to students (days) nested in teachers where we do not sample all the students in a class. The estimator uses all available unbalanced data to estimate relationships and variance components. The assumption here is that the cause of the missingness is not directly related to the outcomes (time use, affect) on those particular days that are missing once we have controlled for covariates (COVID, activity type). Still, we acknowledge that the teachers in our sample may differ from the broader population of teachers in ways that we cannot account for in our data.
Conclusion
Our rich, detailed accounting of teachers’ time use and affective experiences may be valuable strictly as careful descriptive work during this historical time. There is also a case to be made that other disruptions to teachers’ work are likely to occur in the future, and so we need to understand how best to support teachers during such times. Our findings suggest that teachers are likely to make use of additional planning and grading time to ensure they can support students during synchronous instruction.
We would also argue that the study holds implications for how we should think about teachers’ work as we return to fully in-person learning. While we would certainly not advocate that teacher reduce their daily teaching loads from 198 minutes per day to 61, there may be reasons to consider reducing the daily instructional demands placed on teachers. Among OECD countries, the United States is second only to Chile in the number of hours teachers spend directly engaged in instruction, nearly 7.5 hours per week over the OECD average (OECD, 2011). In the wake of the pandemic, some have called for additional flexibility during the school day to provide teachers with additional opportunities to plan and to collaborate with their colleagues (Rotherham, 2021). While it is true that the sudden transition to remote teaching required teachers to take on further planning than they otherwise may have, the increased flexibility in teachers’ daily schedules did allow teachers to spend significantly more time planning for their instruction; they went from spending 19% of their days planning to 33%. They were also more likely to interact with school-based colleagues and administrators. Given the positive role that relationships with colleagues appears to play in teachers’ sense of success and job satisfaction, as Kraft and colleagues have shown both prior to the pandemic and after (Johnson et al., 2012; Kraft et al., 2021), it is worth asking whether we might structure teachers’ work in ways that allow them increased access to their peers.
Beyond the pandemic, arguably the greatest contribution of our study is the evidence of the centrality of teacher-student relations in how teachers experience their work. Across the 2019–2020 school year, teachers in our sample were at their most positive when they were doing the core work of teaching. And, following the transition to remote teaching, teachers reported elevated levels of positive affect when interacting with students. These results remind us that we need to facilitate working conditions that allow teachers to focus their efforts on their students, and that teachers’ experiences at work will largely be driven by what goes on in their classrooms. We are reminded of the pivotal role played by teachers’ pursuit of a “sense of success” in their teaching, and how critical teacher-student interactions are for teachers’ plans to remain in the profession (Johnson & Birkeland, 2003). With this in mind, we should be mindful of the protective role that classroom interactions with students can play in teachers’ experiences of their work. And we should ensure that teachers have the supports they need to derive the benefits that come from the core work of teaching itself.
Footnotes
This research was supported in part by a grant from the Institute of Education Sciences (Award # R305A160293).
1.
It is common for teachers to spend approximately 240 to 300 minutes per day teaching, with daily time dedicated to planning and paperwork (e.g., Smith, 1998).
2.
We are careful to not attribute changes in teachers’ time use and affect to the change to distance learning, given the inseparable nature of school closings and broader changes that occurred during the pandemic (Bacher-Hicks & Goodman, 2020).
3.
Ideally, to make inferences about changes in teachers’ experiences post-pandemic, we would have multiple DRM reports after schools closed. But, given the circumstances, we were fortunate to even capture one timepoint.
4.
We do place additional parameters on the identifying episodes step to reduce burden. Teachers are instructed to only include episodes lasting longer than 5 minutes in duration. And, for episodes that occur while teaching, teachers are directed to treat a lesson or instructional block as a single episode (rather than dividing lessons into specific instructional activities).
5.
Pilot data were not included in our analyses. And, participation in the pilot study did not preclude participants from participation in the full study. In other studies, participating in both the pilot and the full study might invalidate a study’s inferences. In our case, we could not think of a way that having participated in the pilot study could change how someone would use the instrument during the full year of data collection.
6.
We additionally examined whether overall patterns in time use and affect—as well as the moderating effect of COVID—varied across teachers’ instructional level (elementary vs. middle vs. high school) and across categories of teachers (e.g., special education vs. general education, core vs. noncore). However, we exclude these results from our analysis because the analyses yielded virtually no significant differences.