
Abstract
Even though a postsecondary degree can offer economic, social, and civic benefits, many community college students leave without earning a degree—including some who have performed well academically and made substantial progress toward graduation. To better understand the factors contributing to early exit, we surveyed a number of former students in a large community college system. We improve the generalizability of the survey responses through multilevel regression with poststratification, which we use to reweight the responses to better represent the population in our original survey frame. We find that tuition and fees, living expenses, and no longer being eligible for financial aid are the factors contributing to early exit for the largest share of students. We also find variation in both financial and nonfinancial factors across subgroups, suggesting that targeted supports may be useful in helping students persist or return to college and complete their degree.
In an effort to increase the number of individuals who obtain the well-documented benefits associated with earning a college degree, the federal government provides over $120 billion on an annual basis to foster enrollment and persistence in higher education (Scott-Clayton, 2017). Public colleges and universities also invest substantial resources to improve their retention and completion rates, particularly those institutions with state funding linked to institutional performance measures (Ortagus, Kelchen, et al., 2020). Community colleges, in particular, have low completion rates (Snyder et al., 2018) and limited resources to allocate to retention and completion initiatives given their lack of public funding relative to 4-year institutions (Hendrick et al., 2006).
Community colleges can play a democratizing role in higher education by enrolling a disproportionate share of low-income, racially minoritized, and adult students (Bailey et al., 2015), but many community college students are unable to accrue the benefits associated with higher education because they do not complete their degree (Snyder et al., 2018). Only 38% of students who began at a community college completed their associate or bachelor’s degree within 6 years of initial enrollment (Shapiro et al., 2017). For community college students who earn a degree, the decision to go to college is associated with higher earnings in the labor market (Belfield & Bailey, 2011; Doyle & Skinner, 2016; Jepsen et al., 2014) and a host of nonfinancial benefits, such as increased civic participation, improved health, and a longer life expectancy (Doyle & Skinner, 2017a; Trostel & Chase, 2015). Yet the majority of students who begin at a community college drop out of college and fail to accrue the benefits related to completing their degree (Snyder et al., 2018).
Due to the open-access enrollment policies and numerous curricular missions of community colleges, students enroll in courses with varying degrees of academic preparation and multiple coursework objectives (Cohen & Brawer, 2008). Community colleges provide critical developmental education for academically underprepared students (Bailey et al., 2015; Bemmel et al., 2008; Cohen & Brawer, 2008) and mobility pathways for working or low-income students (Armstrong & Hamilton, 2013). Although most community college students who leave college without a degree struggle with their entry-level coursework, a smaller share of noncompleters drop out after performing well in their introductory courses and making significant progress toward degree completion (Ortagus, Tanner, & McFarlin, 2020; Shapiro et al., 2019).
At the national level, roughly 10% of students who leave college have already made substantial progress toward completing their degree, and these previously successful noncompleters are the most likely to graduate on reenrolling (Shapiro et al., 2019). To encourage these students to reenroll and complete their degree, many community colleges launch reenrollment campaigns targeted at former students who have already made considerable progress (Schwartz, 2019). While reenrollment campaigns can increase the probability of former students returning to college (Ortagus, Tanner, & McFarlin, 2020), the likelihood of any student completing college after stopping out for a period of time is significantly lower when compared with students who remain enrolled (Crosta, 2014; DesJardins et al., 2006). 1 For community colleges facing limited resources and low completion rates, the most effective mechanism to optimize completion would be to prevent students from dropping out in the first place (e.g., Mabel & Britton, 2018). Unfortunately, students who leave college are often difficult to contact, leaving institutions with little understanding of why these former students left or how to get them to reenroll.
In this study, we partnered with five high-enrollment community colleges in the state of Florida to email and text 27,028 former students, requesting that they complete a short web-based survey that asked about the specific factors that contributed to their voluntary premature departure. We focus on former students who were previously successful academically given that they are the most likely to complete college on their return. The sample criteria for this study include former students who left college within the past 4 years, earned a 2.0 grade point average (GPA) or higher, made significant progress toward degree completion, had no behavioral or financial holds that would prevent their reenrollment, and who had not enrolled and/or graduated from a different postsecondary institution. By contacting these former students, this study offers insight into the rationale of the early departure decision for students who were performing well in the classroom. Specifically, this study addresses the following research questions:
Among the former students we contacted, 1,877 responded, representing a response rate of 6.9%. To improve the generalizability of our results, we analyze the responses using multilevel regression with poststratification (MRP), a methodological tool from political science often used to produce representative estimates of public opinion from nonrepresentative survey data (Gelman & Little, 1997; Park et al., 2004). In a two-step procedure, we estimate the likelihood that respondents select a given option for leaving college without a degree and then reweight the estimates so that they are representative of the population of early-exiting students at our partner community colleges. Given that each participating community college enrolls a high number of students from the state of Florida—a large state with a diverse postsecondary student population—MRP improves the generalizability of our results to the population of community college students who left college without a degree in the state of Florida and at institutions with similar demographic profiles throughout the United States.
We find that a host of financial constraints—such as costs related to tuition and fees, living expenses, and a loss of financial aid—represent the most prevalent factors that previously successful former students perceived to be associated with their decision leave without a degree. Additional factors include a lack of time to study or prepare for class, increased work or family responsibilities, and substantive challenges associated with online learning. Importantly, we report variation in our findings across subgroups, as Black and Hispanic students were substantially more likely to encounter information and financial barriers that led to their early exit relative to their White peers.
Background
This study is motivated by previous work explaining the role and influence of community colleges and the high rate of community college student attrition, which emphasizes the critical need to better understand why former community college students—who were performing well academically and making significant progress toward completing their degree—dropped out of college. This section focuses on what we know about prior work exploring the specific factors and student-level characteristics associated with students’ voluntary early departure from college.
Previous research has reported that students’ low GPA is correlated with their likelihood of dropping out of college (Hoyt & Winn, 2004; Stratton et al., 2008). Community college student attrition has been linked to former students being academically underprepared for college-level coursework (e.g., Holzer & Baum, 2017), particularly among students who dropped out after earning three quarters of the credit hours required to graduate (Mabel & Britton, 2018). In addition, college students who leave without a degree occasionally cite personal reasons for their early departure. For example, Johnson (2018) reported that former students often referenced a major change in family responsibilities or health concerns when identifying why they dropped out of college. Additional research points to students’ family dynamics as a critical determinant of attrition while highlighting alternative personal reasons related to their decision to drop out of college, such as stress, anxiety, depression, burnout, and a lack of a sense of belonging on campus (Hunt et al., 2012).
Although prior work focuses disproportionately on the academic or personal challenges encountered by college dropouts, previous literature has also shown that many students who drop out of college are unable to complete their degree due to a variety of financial and informational barriers unrelated to their academic performance or personal circumstances (Long, 2007). Many former students cite bureaucratic or confusing administrative processes, poor academic advising, and a general lack of clarity pertaining to graduation requirements as primary reasons related to their early departure (Bers & Schuetz, 2014; Johnson, 2018).
Despite the relatively low price of community college enrollment, students who leave before earning their degree may do so due to financial challenges unrelated to their academic performance (e.g., Goldrick-Rab et al., 2016; Stinebrickner & Stinebrickner, 2008). Previous literature has revealed that former students may leave college due to an inability to pay the required tuition and fees or the practical need to work additional hours (Cox et al., 2016; Johnson, 2018). Financial aid programs have been found to mitigate these financial barriers and decrease the likelihood of student attrition, particularly among low-income, racially minoritized, and academically underprepared students (e.g., Goldrick-Rab et al., 2016).
Prior work also suggests that students with certain types of demographic or academic characteristics are more likely to drop out of college. Several studies have indicated that Black and Hispanic students are significantly more likely to leave college without earning their degree (Juszkiewicz, 2017; Shapiro et al., 2017). Crosta (2013) highlighted the student characteristics that were associated with the decision to drop out of college before completing a degree. The author found that community college dropouts were more likely to be older when compared with students who persisted. Financial barriers have been found to be prevalent for all types of college students but exacerbated among adult students with external responsibilities related to family or work (Bergman et al., 2014). Given that a disproportionate number of community college students are working adults with family obligations, a host of time and location constraints may force community college students to drop out of college (O’Toole et al., 2003; Schatzel et al., 2011; Stratton et al., 2008).
Students who enroll in college on a part-time basis—many of whom are adults, full-time employees, and parents—are significantly more likely to drop out of college than full-time students (Attewell et al., 2012; McKinney & Novak, 2013; O’Toole et al., 2003). Low-income students also have a greater likelihood of dropping out than their more affluent peers. Even when low-income students receive need-based financial aid to pay for college, these financial aid allocations typically do not cover costs beyond tuition and fees or account for familial pressures to remit aid money to cover rent and food expenses (Joo et al., 2008). Prior work in the aforementioned studies offers notable contributions but does not focus on former students who were making excellent progress and performing well academically before early departure or offer findings that can be considered generalizable beyond their individual institutional context.
This study is guided by the economic theory of human capital to explain why former community college students may exit before earning their degree. In the context of higher education, the theory of investment in human capital (Mincer, 1958) suggests that students make decisions about continuing their education based on the costs and benefits associated with enrolling (or reenrolling) in college. The decision to remain in college, for example, is subject to a variety of considerations, such as the direct costs of tuition and the opportunity costs of forgone earnings, before determining whether higher education is a worthwhile investment. Specifically, students can weigh the costs and expected benefits of persisting and decide to stay only if the costs of staying in college are outweighed by the expected future benefits (DesJardins & Toutkoushian, 2005; Paulsen & Toutkoushian, 2008; Turner, 2004).
Human capital theory also suggests that any individual’s ability to generate economic value is associated with the knowledge, skills, and experiences they accrue over time (Becker, 1962). Previous scholars have applied this theory to explain the decision-making process prospective students undertake when debating the merits of enrolling (or remaining enrolled) in college (Levin, 1989). The general logic of human capital theory suggests that investing in additional education will increase employee competencies and, as a result, result in a higher wage after entering the job market (Thomas & Perna, 2004). Because a human capital decision may be constrained by a student’s budgetary limitations (Paulsen & Toutkoushian, 2008), this study explores the financial and nonfinancial reasons behind the decision to leave college before earning a degree.
Informational barriers caused by students’ lack of understanding pertaining to which courses to take and the pathway to graduation represent one type of nonfinancial reason to explain why students may leave college without a degree. Bailey et al. (2015) highlighted the critical challenges students face when navigating the “cafeteria style” of community colleges, noting that students are often “overwhelmed by the many choices available, resulting in poor program or course selection decisions, which in turn cost time and money, and likely lead many students to drop out in frustration” (p. 22). In addition, Bean and Metzner’s (1985) student attrition model indicates that student departure decisions for nontraditional students (e.g., older and part-time students) are often more aligned with external factors, such as work or family responsibilities, than factors related to academic or social integration on the college campus.
We also borrow from Wickersham’s (2020) College Pathway (Re)Selection Model to explain community college students’ decision-making process when choosing between different postsecondary pathways. The College Pathway (Re)Selection Model defines the pathway decisions of community college students under one of two broad categories—lifetime decision making and short-term decision making. Whereas lifetime decision making refers to decisions made in relation to a long-term vision of one’s education, career, and life goals, short-term decision making relates to more immediate educational choices and impacts. The College Pathway (Re)Selection Model allows researchers to leverage the interconnected continuum of decision making to determine the short- and long-term barriers to persistence and influential factors that lead community college students to select a particular pathway, including early departure. In this study, we focus specifically on students who were previously successful academically and eligible to reenroll immediately in order to better understand how colleges can remove the financial and informational barriers that lead otherwise-successful students to make the decision to drop out of college.
Method
Researchers often face one of two challenges when using survey data to make inferences to a population of interest. First, a survey may have been conducted to be representative at one population level, but the researcher wants to make inferences at a sublevel. This is an issue because a survey designed for inference at one level will not necessarily be representative for the sublevel area, particularly when the survey sample is small and there may be too few or even no observations within certain subunits. As an example, this would be an issue for education researchers who want to use a nationally representative longitudinal survey (e.g., Education Longitudinal Study of 2002) to make state-level inferences. Second, the observed demographic characteristics of survey respondents may not match those of the population of interest. For example, a survey sample might end up with more men or persons older than 65 years when compared with the general population. Such that observed characteristics are related to survey response, a mismatch between observed characteristics of the sample and that of the population of interest can bias inferences.
In either scenario, MRP represents a principled way to reweight survey responses so that they are more representative of a population of interest (Park et al., 2004). Fitting the regression, a researcher can predict survey responses for groups of individuals who share similar observed characteristics. These responses can then be poststratified based on the proportion of the population that this group represents. Thus, nationally representative survey responses can be reweighted to allow for inference at the state level; similarly, nonrepresentative samples can be adjusted to better represent the population of interest. Our use case for MRP in the present study falls in the latter scenario.
Approximately 6.9% of the students we contacted consented and took our survey (N = 1,877). Supplemental Appendix Tables A.1 and A.2, available in the online version of the article, compare enrollments, graduation rates, completions, and demographic characteristics of our five partner community colleges to the entire Florida College System (FCS) and all community colleges in the United States. While this low response rate was not unexpected—particularly considering that students in our population of interest had, by definition, stopped out and were therefore more difficult to reach 2 —it could affect the representativeness of our results. Specifically, if student response rates differed across observable demographic dimensions like gender, race/ethnicity, and age, or across levels of educational attainment like earned credit hours and GPA, then average responses among our sample may not reflect the average response of the population of interest.
We improve the generalizability of the survey responses using MRP to reweight the responses so that they better represent the full population of previously successful noncompleters in our partner colleges. While MRP has been used extensively in political science to measure public opinion in the United States (Gao et al., 2019; Gelman et al., 2010; Gelman & Little, 1997; Howe et al., 2015; Kastellec et al., 2019; Kennedy & Gelman, 2019; Lax & Phillips, 2009; Lei et al., 2017; Lipps & Schraff, 2019; Little, 1993; Pacheco, 2011; Park et al., 2004; Wang et al., 2015; Warshaw & Rodden, 2012), and is increasingly used by political scientists outside of the United States (Lipps & Schraff, 2019; Toshkov, 2015), sociologists (Fairbrother & Martin, 2013), and epidemiologists (Downes et al., 2018; Eke et al., 2016; Zhang et al., 2014) to generate representative estimates from nonrepresentative data, it has been seldom used in survey-based educational research. 3
Following our general description above, MRP is implemented using this two-step process:
1. Fit a multilevel model with K varying intercepts, α, whose categories partition J population cells. Typically, each intercept, αk, will represent a demographic group with j unique categories: e.g.,

in which β0 is the grand mean. From this, we can compute the average response for each cell, π j .
Poststratify the average cell responses to the population average, θ, via

2. the population cell sizes, Nj, as weights.
Population cell counts do not need to come from the same data set as the individual survey responses. Whatever the source, however, categorical variable indicators in equation (1) must match population cells in the poststratification matrix. For example, if the multilevel model contains varying intercepts for race/ethnicity and age, αrace/ethnicity and αage, which have 6 and 4 categories, respectively, then the poststratification matrix must have population-level counts for the
In our study, we specifically fit,

in which yi ∈ {0,1} represents a possible reason for early exit selected by the respondent,
Using random intercepts in a multilevel model allows schools with comparatively fewer observations of a particular population cell to “borrow strength” from other schools, meaning that we can return estimates even for sparsely populated cells (Gelman et al., 2013). We assume that the random intercepts for age, gender, race/ethnicity, GPA, and earned credit hours, are normally distributed with mean of zero and group-specific variance,

With a multilevel model, we are able to account for the nested structure of our data—with students in schools—and include covariates at the institutional level that help improve model fit (Park et al., 2004). We model the school-level random intercept with

in which we include the institution’s average 150% completion time and net cost as well as the institution’s county unemployment rate and average weekly wage as second-level covariates. We added these second-level covariates specifically because they might represent institution-specific pushes (graduation rate and costs) and pulls (area unemployment and wage rates) associated with a student’s decision to leave before completing a degree. In all cases,
Due to the nature of the survey (discussed in the next section), we fit equation (3) for each possible response in the survey, r, and in turn compute cell-specific average responses,

in which Nj come from the administrative data set we used to construct and contact our initial sample of students in our population of interest. Once each
Data
Individual-level responses were drawn from a short web-based survey fielded in the summer of 2019 that asked former community college students about their perceptions of factors that may have contributed to their voluntary early departure. We partnered with five high-enrollment, open-access FCS colleges, which were selected due to their large enrollment size (about 64,000 students per institution) and diverse student body compositions. We first identified the subset of former students who, despite having made significant progress, left before earning a degree. To be included among our sampling frame, former students had to have earned a cumulative GPA of 2.0 or higher, made substantial progress toward degree completion by earning at least 30 credits toward a degree (exclusive of remedial or developmental credits), enrolled as a degree-seeking student (i.e., not pursuing a certificate), had no behavioral or financial holds that would prevent their reenrollment, and to have stopped out within the prior 4 years. All students in our sample were classified as associate degree-seeking students who declared a major or degree program of study prior to their early exit.
In addition, we matched student-level data provided by participating community colleges with data from the National Student Clearinghouse to identify and remove any former students who had already reenrolled or graduated from another postsecondary institution prior to administering the survey. Because we were contacting former students, we were concerned about potentially low response rates. We therefore also required that students have an active cell phone number so that we could follow up via text messaging after the initial email request if necessary. We identified and contacted a total of 27,028 former students with a request to complete the survey.
Survey Instrument/Measures
The survey consisted of a total of 19 questions. Of these, the first (Q1) requested consent to participate, the last (Q19) asked if the respondent consented to be contacted for a follow-up interview, one (Q14) was open text response, and most of the remaining allowed respondents to select among a number of options. Questions in the latter group took the form of “select all that apply,” with selections grouped by a general rationale for early exit. As an example, one question that asked about financial expenses took the form:
Please indicate whether each of the following financial expenses describes a reason why you stopped attending [school name] 4
Please check all that apply.
Textbooks
Tuition and fees
Computer and internet access
Transportation to campus
Living expenses (rent, utilities, healthcare, childcare, and food)
Students could click on the boxes to select all, none, or any combination of options before moving on to the next question group. Questions fell into four broad categories: Cost: financial expenses and financial aid issues; Employment: work-related issues; Instructional: course scheduling issues, course-related issues, issues with online courses; and Other: transportation/scheduling issues and personal issues. The survey was adaptive, meaning that students were only asked questions about employment-related issues and online coursework if they first affirmatively answered questions (Q4) “Were you employed while you were taking classes?” and (Q10) “Did you take any online courses?” respectively. We account for this survey skip-logic in our analyses but note that most students were employed while in school (83%) and took at least one online course (61%).
We treat each selection as a binary outcome in a separate model: student selected (1) or did not select (0) the factor as reason for their early exit. Approximately 81% of students who started and consented to the survey completed it. This causes a small issue in the raw survey data since nonselection due to active nonchoice versus not having reached the question are both coded as missing. To differentiate between these two conditions, we used the survey system’s progress indicator to assess whether a student had viewed the question. If they had, we coded all nonselections as 0; if they had not, we left the values as missing.
We fit a total of 43 models. This includes five to six outcomes each for eight question views as well as two outcomes used to account for the survey skip logic. We use all available information for each model. Because of survey skip logic and nonsurvey completion, sample sizes across models range from 1,020 to 1,877 respondents. 5 Online Supplemental Appendix Table A.3 lists each potential factor, which is an outcome for a single model, along with the question and question category to which it belongs.
Second-Level Covariates
Data for the second level covariates come from two primary sources. The 150% completion rate and net cost for each school are taken from the Integrated Postsecondary Education Data System (IPEDS). The other two covariates, county-level unemployment rate and average wage, come from the Bureau of Labor Statistics. These values are associated with the counties in which each college is located. All values are taken from data for the year just before the survey, 2018. We match second-level covariates to survey data by using the institutional identification number (Unit ID) and location information available in IPEDS.
Poststratification Weighting Matrix
To construct our poststratification weighting matrix, we used administrative data from our five partner FCS schools. Unlike most other MRP studies, in which population counts come from another data source (e.g., national census data), we are able to use the same source of administrative data that we used to construct our original sampling frame. Table 1 shows the counts for a few poststratification cells.
Example Poststratification Cell Counts

Note. The full poststratification table contains counts for five schools; three genders: men, women, and missing; six race/ethnicities: Black, Hispanic, more than one race/ethnicity, White, other racial/ethnic groups, and missing; four age groups: 18–25, 26–35, 36–49, and 50+ years; Six GPA bins: [2.0–2.3), [2.3–2.7), [2.7–3.0), [3.0–3.3), [3.3–3.7), and [3.7–4.0); and six earned credit hour bins: 30–35, 36–41, 42–47, 48–53, 54–59, and 60+ hours.
One key benefit of using administrative data to construct our poststratification weighting matrix is that we can use first-level covariates not typically available in external population count data. Specifically, we are able to include bins of GPA and earned credit hours in addition to demographic covariates of gender, race/ethnicity, and age in our models. Because these academic characteristics are likely associated with early student exit, their inclusion provides a better fit to our data.
The sum total of all cell counts in our poststratification matrix is 36,412, which is larger than the 27,028 students we initially contacted to complete the survey. The discrepancy in the numbers reflects the fact that we required students in the initial sampling frame to have active cell phone numbers on file. Without this condition, the potential number of students to whom other conditions apply—2.0+ GPA, 30+ earned credit hours, no holds on the account—is higher. We poststratify to this population rather than to the initial sample frame because we believe this group better reflects the full population of interest: students who had made substantial progress to a degree with good academic standing who nonetheless exited without earning a degree.
Limitations
This study is subject to a number of limitations. First, despite the fact that we use MRP to reweight our survey responses, we only poststratify to the five FCS colleges in the original sample. These are high-enrollment colleges in a large state, meaning that results representative of these institutions may be representative of a larger population of early-exiting students. That said, any claims of external validity beyond the original five colleges in our study must rely on assumptions of similarity or representation beyond what we can directly model using MRP.
Second, the low numbers of some student groups in both our survey and poststratification data means that we are unable to provide useful inferences for these groups. For example, the number of students who identified as Asian, Native American, Pacific Islander, or Native Hawaiian was very low, meaning that we had to group them into a single racial/ethnic category. This lack of information is reflected in the wide poststratified posterior distributions for these subgroups. This limits our ability to speak to the experiences of these groups as they pertain to early exit, either within the five colleges we study, the state of Florida, or the nation on the whole. Third, students who recently left community college might return later. Due to the research design of this study, we are limited in differentiating between survey respondents who stopped out before returning and true dropouts who never return to college.
Finally, our results may be biased if those students who completed the survey are different from those students who did not in ways we cannot observe. A key assumption underlying MRP is that respondents who are similar along observed characteristics will respond similarly to survey question, particularly when their context (e.g., state or school) is taken into account through second-level covariates (Park et al., 2004). MRP is also somewhat conservative in that its multilevel design tends to pull more extreme estimates toward overall means through a process of “partial pooling” (Gelman et al., 2013). That said, we note as a final limitation that even though MRP has demonstrated good properties, even among nonrepresentative polls (Wang et al., 2015), and we perform a number of model checks that provide evidence of good model fit, 6 we cannot test whether our analysis has corrected for any survey response bias due to unobserved differences between survey respondents and the population of interest.
Results
In Table 2, we compare survey respondents (columns 1 and 4, N = 1,877) with two groups: the group of students we initially contacted to complete the survey (column 2, N = 27,028) and the full population of interest (column 5, N = 36,412). In both cases, survey respondents differ across a range of demographic characteristics at conventional levels of statistical significance. Compared with both the contacted student sample and the full population of interest, survey respondents skewed older, were more likely to identify as women, and were more likely to identify as Black. Compared with the contacted sample, survey respondents were less likely to identify as Hispanic only and more likely to identify as White; compared to the full population, survey respondents were less likely to identify as White, as a member of another racial/ethnic group, or have missing information on their race/ethnicity. 7
Comparison of Respondents With Those Who Were Contacted and the Population of Interest Across Characteristics

Note. All numbers are percentages. The contacted (2) sample represents the subset of the population (5) sample with an active cell phone number on file. Columns (3) and (6) indicate the level of statistical significance of differences between the contacted and respondent samples and the population and respondent samples, respectively. Square brackets and parentheses around GPA intervals are inclusive and exclusive, respectively.
p < .1. *p < .05. **p < .01. ***p < .001.
Academically, survey respondents tended to have fewer students with C—average GPAs and more students with GPA averages higher than B than the full sample of those contacted. Respondent GPAs were not statistically different from those of the full population. Compared with the contacted sample, survey respondents tended to have earned more credit hours prior to leaving.
Due to these differences between survey respondents, we reweight our findings to improve their representativeness. Though we make comparisons with the students who were initially contacted, we poststratify using cell counts from the full population frame. All subsequent results, therefore, reflect the full population of early-exiting community college students in our study who had at least a 2.0 GPA, earned 30 or more credits, and had no behavioral or financial holds barring their return as of their last enrolled semester.
We present our primary results in Figure 1. 8 Each row represents a reason that a former student could select as having contributed to their early exit. Because we fit each reason as an outcome in its own model and treat it as binary choice, each row can be interpreted as the percentage of students in the population of interest who cite the reason as one that contributed to their early exit. We group reasons into four broad categories: cost, employment, instructional, and other. The center shape of each line represents the median posterior value and the thick and thin horizontal lines on either side showing the 50% and 95% credible intervals, respectively. 9

Each row represents a cited factor in early exit.
Overall, the two reasons for early exit indicated by more than half of all students involve financial costs to students: tuition and fees (52.8%) and living expenses (e.g., rent, utilities, health care, child care, and food) (48.3%). More than a third of students indicated other costs: being no longer eligible for financial aid (42.8%), lacking time to study and prepare for class (34.5%), having to switch from part-time to full-time work (34.3%), 10 and having an inconsistent weekly schedule (33.3%). Approximately one in four former students cite difficulty learning in an online setting (25.4%), uncertainty about which classes to take next (23.6%), lack of desired classes at the campus location closest to them (25.7%), required math and science courses that were too difficult (25.3%), too little faculty interaction in online courses (23.4%), the cost of textbooks (25.1%), and difficulty in completing assignments (23%), with one in five citing the unavailability of a required course online (20.3%). The remaining reasons were cited by less than 20% of students, with one, that their employer stopped paying for classes, cited by less than 1 in 20 students (3.8%). That said, many were cited by approximately 10% to 15% of students. Furthermore, smaller average percentages may cover heterogeneity in responses among different student groups. We explore some of these heterogeneous responses in the next section.
Results by Subgroup
Figures 2 and 3 show differences in subgroup responses for a selected set of question options. We do not present results for all outcomes but rather focus on a few that show important differences among subgroups. The subgroup affirmative response rates—that is, the percentage of students within the subgroup citing the question option as a reason for their early exit—are shown within their own facet. 11 As with Figure 1, the open circles within the figure represent the poststratified posterior distribution median and the thick and thin lines the 50% and 95% credible intervals, respectively.
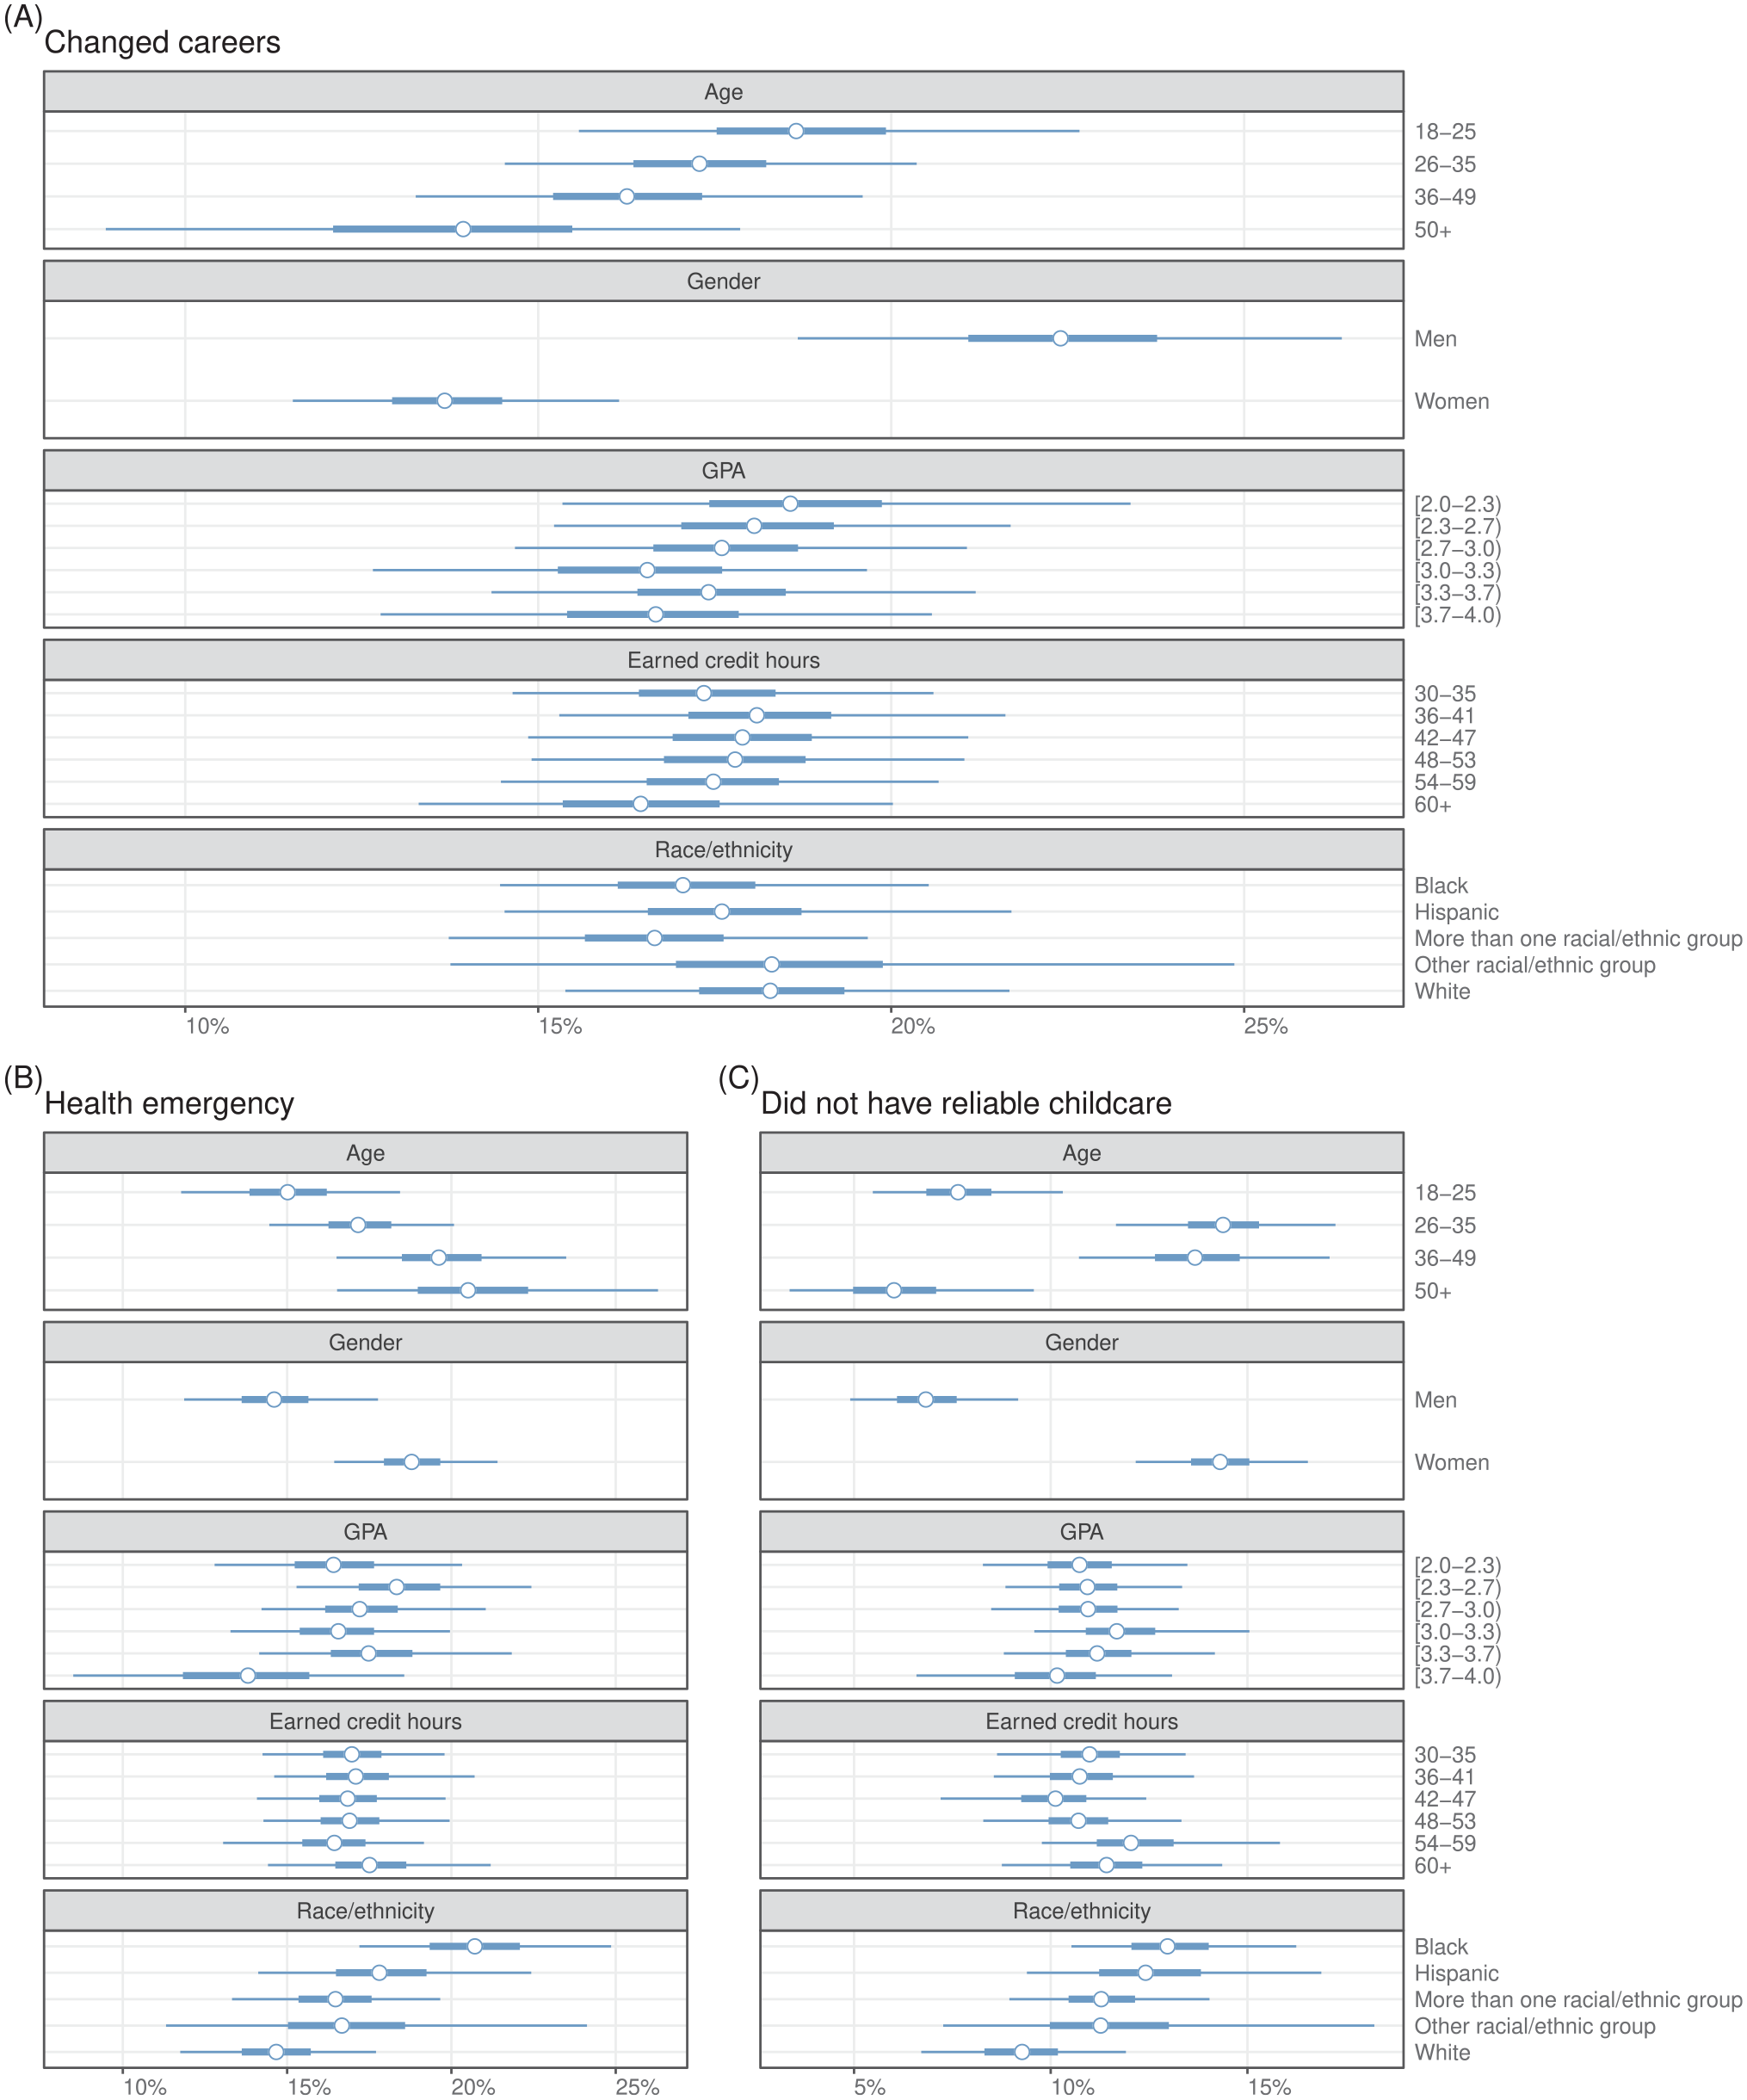
Each row represents a cited factor in early exit.

Each row represents a cited factor in early exit.
Facet (A) in Figure 2 presents the results for the survey response option of changing careers, with 22.4% of men and 13.7% of women citing this factor as a reason for their early exit. In Facet (B), we see that 18.8% of women cited a health emergency as a reason for exit, whereas only 14.7% of men did so. Women were also much more likely (14.4%) than men (6.9%) to say they exited because they did not have reliable childcare (Facet C). For lack of child care, we also note a u-shaped difference among age brackets, with 26- to 35-year-olds (14.4%) and 36- to 49-year-olds (13.8%) citing this reason compared with only 7.7% of 18- to 25-year-olds and 6.2% of those 50 years and older.
In Facets (A) and (B) of Figure 3, we show results from two financial-based response options: missed payment deadline and was dropped and registration hold. Per the second option, we remind that a student was only eligible for inclusion in our sample and population if they did not have any registration holds that would otherwise prevent their return. In both cases, two patterns emerge. First, students with lower GPAs are more likely to cite these financially motivated reasons than those students with the highest GPAs. For example, whereas 7.1% of students with a GPA of 3.7+ cited a missed payment and drop out, 14.5% and 12.8% of students with a C and C+/B− average, respectively, did so. Similarly, only 6% of students with a 3.7+ GPA cited a registration hold, while median responses from students with GPAs lower than 3.0 range from 17.2% to 23.2%. We also note sharp differences between White and Black and Hispanic students for these two outcomes. While 4.9% of White students cited a missed payment that required them to drop, 12.8% of Hispanic students and 16.6% of Black students did so. Black (27.4%) and Hispanic (18.5%) students cited registration holds at much higher rates than White students (7%). We discuss the implications of these findings in the next section.
Facet (C) of Figure 3 indicates the extent to which different subgroups of students indicated difficulty learning on their own in online settings. As an example, greater than 33% of students with the lowest GPAs noted struggles with online learning as related to their decision to leave college without a degree, whereas only 16.6% of students with the highest GPAs cited difficulties with online learning. We also show that a larger share of Black (28.5%) and Hispanic students (32.1%) noted challenges with online learning as a factor behind their decision to exit early relative to the proportion of White students (18.7%) who struggled with online learning. Similarly, we find that difficulties associated with unreliable internet access (Facet D) were more prominent among Black students (11.1%) when compared with White students (4.1%) in our sample.
Discussion and Conclusions
To better understand previously successful students’ perceptions of factors associated with their decision to drop out of college, we surveyed over 27,000 former students in a large community college system who left college without a degree and did not reenroll or graduate elsewhere. Through this work, we address a critical problem in higher education research by improving the generalizability of the survey responses through the use of MRP. Although prior work has focused on the reasons behind academic challenges of students who depart college without a degree, our study provides representative survey data and specifically includes former students who were performing well academically before leaving college without their degree.
Our findings show that tuition and fees, living expenses, and the loss of financial aid eligibility represent primary factors reported by the majority of former students in our sample. We also find considerable variation across subgroups of former students. For example, older students, particularly women, were more likely to highlight a lack of reliable childcare as a primary reason behind their decision to drop out of college. Women were also more likely than men to cite a health emergency, which could have applied to themselves or another person for whom they were a caregiver. Importantly, Black and Hispanic students were found to be much more likely than White students to cite a missed payment or registration hold when noting why they exited early—even though none of the surveyed students had holds that would have prevented their reregistration. This disconnect between students’ perceptions and actual institutional data is ripe for further research and indicative of a greater need for proactive support and services to ensure that students are not dropping out for unnecessary reasons.
Community colleges often represent an important mechanism to allow individuals from underserved populations to climb the socioeconomic ladder (Belfield & Bailey, 2011), but many community college students are unable to accrue the financial or nonfinancial benefits associated with going to college because they do not earn their degree (Snyder et al., 2018). Prior work has shown that family issues or financial disruptions often force students into precarious academic environments that lead to poor grades and may explain why students drop out of college (Hoyt & Winn, 2004; Johnson, 2018; Stratton et al., 2008). Although previous research has not explored the extent to which online learning influences students’ decision to drop out of college, prior studies examining the efficacy of online education have shown that Black students and students with lower levels of educational attainment have a lower likelihood of success in self-directed online learning environments when compared with their peers (Xu & Xu, 2020). Our finding that Black students and those with lower GPAs were more likely to cite troubles with unreliable internet access offers one potential reason for this difference. Taken together, this study advances our understanding of why students leave their community college without a degree by focusing specifically on providing representative survey data that centers former students who were previously successful academically.
Implications for Policy and Practice
Given that community college students who stop enrolling for any period of time are substantially less likely to graduate than their peers who remain enrolled (e.g., Mabel & Britton, 2018), the critical questions facing administrators and policy makers are twofold: (1) Why do these students leave without a degree in the first place? (2) What can community colleges do to prevent their early departure? Our empirical results explain the former question, and we begin to explore the latter question in the remainder of this section. Community colleges are unlikely to be able to simply lower their tuition and fees in response to the financial challenges faced by students leaving without a degree; however, institutions may be able to bolster their efforts to make financial aid information easily accessible online and support Free Application for Federal Student Aid (FAFSA) completion. The consequences associated with not taking advantage of available financial aid are dire, as prior research has shown that FAFSA filing is positively related to student persistence (McKinney & Novak, 2013).
Aside from broad and necessary efforts to ensure financial aid information is more easily available online to all students, community colleges can also provide targeted financial aid packages to students who are close to finishing their degree but running out of financial aid. Unfortunately, community colleges receive substantially less public funding than 4-year institutions (Hendrick et al., 2006; Kelchen et al., 2020) and are already asked to do more with less. For community colleges, the combination of constrained resources and relatively low completion rates outlines the dire need to make targeted, data-driven financial decisions that optimize the impact of institutional practices and policies. This study offers an important look at an understudied student population: community college students who left college despite succeeding academically before their voluntary departure. Prior work reveals that students face the greatest risk of dropping out when taking entry-level courses, particularly math courses, but the former students in our sample are typically well beyond those introductory courses and, as a consequence, more likely to complete college should they return to college (Shapiro et al., 2019).
For administrators and policy makers seeking to prevent voluntary early departures among academically successful students, our study provides additional insights. Aside from FAFSA support or targeted need-based aid, our findings reveal that nonfinancial factors related to both course scheduling and technology should also be addressed. College administrators should ensure that time- or location-constrained students, who enroll disproportionately at community colleges, have the option to enroll in all required coursework outside of normative working hours, at their closest campus location, or via online education. Previous scholarship has shown that taking some online courses can have a positive impact on community college students’ likelihood to remain enrolled in college, transfer to a 4-year institution, and graduate with an associate degree (Ortagus, 2018). However, offered online courses must prioritize faculty-student interaction to prevent online learning environments in which underserved students are forced to become self-directed learners in ways that can be harmful to their academic success (Xu & Xu, 2020).
Our study also shows a clear disconnect between students’ perceptions of why they left college without a degree and their college’s administrative records. Specifically, Black and Hispanic students were more likely than White students to cite a financial or registration hold as a reason for their early departure, but none of the 27,028 students who received this survey had any financial or registration holds preventing reenrollment. For administrators and policy makers, we recommend reaching out in a proactive manner to ensure all students have accurate information related to their holds and eligibility to continue enrolling in coursework—even if that correspondence is merely communicating that they have no holds and are eligible to enroll in remaining courses.
As noted previously, online Supplemental Appendix Tables A.1 and A.2 compare enrollments, graduation rates, completions, and demographic characteristics of the five partner community colleges with the FCS and all community colleges in the United States. Compared with the full FCS and all community colleges in the United States, the five community colleges in our sample are somewhat larger in terms of enrollments and have greater proportions of Black and Hispanic students who enroll and eventually graduate. The share of students in our sample who receive financial aid, however, is relatively similar to the population of community college students in the state of Florida and the United States. In terms of generalizability, the five partner community colleges have high enrollments and more diverse student compositions but appear to represent similar institutional contexts to remaining community colleges in Florida and the United States. Through our novel data source and empirical approach, we offer important takeaways for administrators or policy makers seeking to better understand why these former students left in order to address how to minimize the number of early departures and increase the number of students who complete their degree.
Another important contribution of our study, which outlines why previously successful former students drop out of college, is to provide a clear framework to optimize efforts designed to encourage or incentivize former students to return to college and complete their degree. Due to challenges associated with declining enrollments, inadequate state funding, and low completion rates, a growing number of community colleges have launched reenrollment campaigns that target former students who are close to completing their degree (Schwartz, 2019). By outlining the specific factors previously successful community college students perceived to be associated with their decision to drop out of college, future reenrollment initiatives can focus on removing specific barriers as they incentivize former students to return to college.
Further research can link survey data to transcript data in order to better understand the specific curricular barriers that may have led previous successful community college students to leave without a degree. Specifically, researchers can explore the influence of transitioning to upper-division coursework or enrollment in specific types of upper-division courses to identify the curricular barriers that may decrease the likelihood of degree completion among advanced students. In alignment with previous work suggesting noncompleters who return after less than 1 year have different characteristics than noncompleters who had not returned after more than 1 year (Stratton et al., 2008), future research can examine the extent to which short-term noncompleters (less than 1 year) face different barriers than longer-term noncompleters (more than 1 year). Future studies may also link survey data to administrative financial aid data to explore the role of financial aid status when seeking to better understand the academic outcomes of this understudied student population.
Conclusion
Many survey-based studies in education research address important questions but fail to provide representative findings or, as a consequence, generalize to their population of interest. This study analyzes students’ survey responses using MRP to address why academically successful community college students left college without earning their degree. As community colleges and other institution types continue to employ surveys as a mechanism to engage students and gather evidence to make institutional decisions, our findings represent an important step toward improving the generalizability of surveys used in education research while directly addressing the completion problem facing not only community colleges but also higher education at large.
Supplemental Material
sj-pdf-1-ero-10.1177_23328584211065724 – Supplemental material for Investigating Why Academically Successful Community College Students Leave College Without a Degree
Supplemental material, sj-pdf-1-ero-10.1177_23328584211065724 for Investigating Why Academically Successful Community College Students Leave College Without a Degree by Justin C. Ortagus, Benjamin T. Skinner and Melvin J. Tanner in AERA Open
Footnotes
Acknowledgements
This study was supported by a research grant from the Helios Education Foundation.
Notes
Authors
JUSTIN C. ORTAGUS is an associate professor of higher education administration and policy and director of the Institute of Higher Education at the University of Florida. His research typically examines the impact of online education, community colleges, and state policies on the opportunities and outcomes of underserved students.
BENJAMIN T. SKINNER is an assistant professor of higher education administration and policy and affiliate of the Institute of Higher Education at the University of Florida. His research uses data science techniques to investigate the policies and practices that affect students who attend community colleges and broad access universities.
MELVIN J. TANNER is a doctoral candidate in higher education administration and policy and senior research analyst in the Office of Institutional Planning and Research at the University of Florida. His research primarily examines the barriers to admission, persistence, and completion for underserved students.
References
Supplementary Material
Please find the following supplemental material available below.
For Open Access articles published under a Creative Commons License, all supplemental material carries the same license as the article it is associated with.
For non-Open Access articles published, all supplemental material carries a non-exclusive license, and permission requests for re-use of supplemental material or any part of supplemental material shall be sent directly to the copyright owner as specified in the copyright notice associated with the article.