
Abstract
During the past 15 years, immigration enforcement increased dramatically in the U.S. interior. There is a growing recognition that immigration enforcement in the U.S. interior has spillover effects onto U.S. citizens. I examine the impacts of a type of partnership between Immigration and Customs Enforcement and local law enforcement, 287(g) programs, on school engagement within North Carolina. In North Carolina, nine counties were approved to establish 287(g) programs, and another 15 applied but were not approved to participate. I use a triple difference strategy in which I compare educational outcomes for different groups of students in these two sets of counties before and after activation of 287(g) programs between 2003/2004 and 2012/2013. I find that 287(g) programs decrease school engagement by decreasing attendance. This effect appears to be driven by increabes in chronic absenteeism (missing 15 or more days per year).
During the past 15 years, partnerships between local law enforcement and Immigration and Customs Enforcement (ICE) expanded the reach of immigration enforcement into the U.S. interior (Capps et al., 2018). The best known of these partnerships between ICE and local law enforcement, 287(g) programs, give authority to local law enforcement to act as immigration enforcement agents. When asked about their experiences with 287(g) programs, immigrants express high awareness of these programs, describing increases in contact with local law enforcement following program activation (Nguyen & Gill, 2015). In response, unauthorized immigrants, and immigrant communities more generally, may reduce their contact with public institutions to avoid exposing themselves, their friends, or their family members to detection by immigration enforcement. In deterring families from accessing public services to which they are entitled, immigration enforcement represents a form of administrative burden (Heinrich, 2018). Although prior work finds that immigration enforcement decreases affected families’ engagement with social services and other public institutions (Alsan & Yang, 2018; Hagan et al., 2010; Vargas, 2015; Vargas & Pirog, 2016; Watson, 2014), less work has examined the effects of immigration enforcement on youth engagement with public institutions.
Most youth have substantial contact with public institutions via public schools; one measure of their engagement with schools is attendance. Beyond its usefulness as a measure of short-term engagement, school attendance affects other student outcomes. Each day of increased absence per year is associated with lower achievement (Gershenson et al., 2017; Gershenson et al., 2019). Chronic absenteeism, defined by the U.S. Department of Education’s Office of Civil Rights as missing 15 or more days per school year, is negatively associated with longer term student outcomes. Students who are chronically absent for multiple years in early elementary school are less likely to read on grade level by third grade (Ehrlich et al., 2018). Middle school and high school students with high levels of absenteeism have greatly increased risk of dropping out of high school (Balfanz et al., 2007; Schoeneberger, 2012).
This article adds to the extant literature by examining the effect of immigration enforcement, via the activation of 287(g) programs, on school engagement via student attendance. In North Carolina, nine counties established 287(g) programs in different years, whereas another 15 counties applied for 287(g) programs but were denied. To isolate the causal effect of 287(g) programs on student attendance, I use a triple differences strategy in which I compare attendance for different groups of students in these two sets of counties before and after activation of 287(g) programs. I find that 287(g) programs increase absences for Hispanic students ever classified as limited English proficient (LEP); 287(g) programs also increase absences for Hispanic students never classified as LEP. 1 I also find that 287(g) programs increase chronic absenteeism for Hispanic students ever classified as LEP, a probable sign of school disengagement.
Background on 287(g) Programs
287(g) programs refer to Section 287(g) of the Immigration and Nationality Act (INA) and were first authorized as part of the 1996 Illegal Immigration Reform and Immigrant Responsibility Act (Rosenblum & Kandel, 2011). In 287(g) programs, ICE enters into agreements allowing state and local law enforcement to act as immigration enforcement agents. Under these arrangements, ICE provides training and other capacities to state and local law enforcement agents. In return, state and local law enforcement agents question individuals about their immigration status and issue detainers, or holds of up to 48 hours to transfer individuals into ICE custody.
Between 2005 and 2012, 70 county and city local law enforcement agencies implemented 287(g) programs; another 142 local law enforcement agencies submitted applications or inquiries to the Department of Homeland Security (DHS) but did not implement a 287(g) program (Pedroza, 2019). 2 Of those that did not implement a 287(g) program, about half (71) had the application denied by DHS, whereas another 52 withdrew the application. 3
ICE reported that applications were denied for multiple reasons, mostly related to internal ICE capacity but also related to characteristics of the applying agency. According to a 2010 DHS report, of the 51 applications that had been denied at that time, about three quarters were denied because ICE either had insufficient field staff or insufficient funding for training or other requirements (Skinner, 2010). The remaining applications were denied if ICE determined that the agency did not have sufficient need for the program, if ICE believed another program could better suit community needs, or if the agency had insufficient detention space. Notably, the early application process did not require that law enforcement agencies submit any information related to potential effects on civil rights and civil liberties, such as agencies’ past history with civil rights complaints. Therefore, sites were unlikely to be denied for this reason (Skinner, 2010). Early comparisons of counties that were approved versus not approved to participate in a 287(g) program indicate that approved counties are larger and have higher shares of Hispanic residents (Wong, 2012).
Approved 287(g) programs follow the task-force model, the jail model, and a combined hybrid model. Under the task-force model, 287(g) officers can ask individuals about their immigration status and issue detainers in the community. Under the jail model, individuals are first arrested for a nonimmigration offense; inquiries into their immigration status under the 287(g) program occur after they are booked (Rosenblum & Kandel, 2011). However, particularly in early years of 287(g) programs, there may have been little practical distinction between models: Police reports in North Carolina counties, for example, suggest that law enforcement in some counties with jail models questioned individuals about immigration status prior to arrest (Nguyen & Gill, 2010, 2015).
The express purpose of partnerships with local law enforcement agencies is to target noncitizens who have committed crimes (Rosenblum & Kandel, 2011). However, critics have noted that many individuals identified under 287(g) programs have only low-level offenses, such as traffic violations. Therefore, it is unclear whether these programs are targeting immigrants who have committed crimes or unauthorized immigrants, regardless of criminal status. 4
As a “new destination” for Hispanic immigrants, North Carolina has been at the forefront of immigration enforcement (Nguyen & Gill, 2010). In 2006, Mecklenburg County became one of the first U.S. counties to establish a 287(g) agreement. Mecklenburg County was also the first county to implement a “universal” model, in which local law enforcement did not specifically target serious criminal offenders but identified as many unauthorized immigrants as possible (Capps et al., 2011). As shown in Table 1, between 2006 and 2009, eight more local law enforcement agencies in North Carolina established 287(g) agreements. Law enforcement agencies in another 15 counties attempted to establish agreements during this time period but were rejected by ICE (Capps et al., 2011; Potochnick et al., 2016; Rugh & Hall, 2016).
287(g) Programs in North Carolina Requested, by Application Status

In December of 2012, ICE scaled back on 287(g) programs by not renewing any agreements for task-force programs. 5 In 2013, ICE created a new MOA, and jail programs continued to operate.
Theoretical Framework
Immigration policy, whether at the local, state, or national level, affects students’ educational outcomes and interest in engaging with schools both directly and indirectly. Directly, restrictive immigration policy may decrease the likelihood that students access public benefits or increase their worry about the potential removal of family or friends. Indirectly, restrictive immigration policy signals that immigrant students do not belong, which may decrease students’ school engagement (Filindra et al., 2011).
Students with unauthorized immigrant parents, or who are unauthorized themselves, are likely to be the most impacted by immigration enforcement. As first proposed by Dreby (2012), the burden of immigration enforcement is likely most intense for children who have lost their parents to removal or have been removed themselves. However, immigration enforcement also increases stress for children with an unauthorized immigrant parent via worry about the possibility of parental removal. At the bottom of the pyramid, Dreby (2012) places an additional group, children with authorized immigrant parents. Although these children are unlikely to have a parent removed due to immigration enforcement, they may begin to associate immigration with “illegality” regardless of parental authorization status.
Although children’s general exposure rates to immigration enforcement are unknown, a recent study of youth in Harris County (Houston, Texas) and Rhode Island provides suggestive evidence (Capps et al., 2020). The majority of Latino youth (56%) reported knowing someone who had been deported, with U.S.-born youth being more likely to report knowing a deportee (71%). Additionally, although most discussion of the likely impacts of immigration enforcement on Hispanic students has focused on parental removal, the majority of youth who knew a deportee reported that this person was another relative (44%) or a friend (26%), as opposed to parent (13%). This result illustrates that the effects of immigration enforcement may reverberate not only within the nuclear family unit but within extended families and broader communities. Therefore, Hispanic children and youth who are not unauthorized immigrants, the children of unauthorized immigrants, or even the children of authorized immigrants may still be affected by the deportations of family members, friends, or other community members.
For many families with unauthorized members, worry about potential apprehension by immigration authorities also leads to declines in engagement with public institutions (Alsan & Yang, 2018; Gill, 2018; Nguyen & Gill, 2015). Immigration enforcement produces a chilling effect on public benefit receipt: Families are less likely to apply or recertify for public benefits to which they are entitled (Alsan & Yang, 2018; Vargas, 2015; Vargas & Pirog, 2016; Watson, 2014). Immigration enforcement also reduces crime reporting and use of other public services, such as libraries and parks (Dhingra et al., 2021; Hagan et al., 2010; Nguyen & Gill, 2015). Schools represent another government institution that could pose a danger to families with unauthorized members: Families may fear school authorities’ potential cooperation with ICE. 6 Under conditions of increased immigration enforcement, children may be less likely to attend school because of fear of detection by immigration authorities. Recently, Latino youth reported avoiding school activities due to fear of immigration enforcement, and youth in areas with higher levels of immigration enforcement were more likely to change their behaviors (Capps et al., 2020).
Unauthorized immigrants’ reluctance to be in public spaces in which there is a chance of detection by immigration authorities may have secondary effects on children’s attendance, even if children themselves are not actively avoiding school. First, many unauthorized immigrants end up in ICE custody after initial arrests for traffic offenses. If parents are more afraid to drive children to school or youth are more reluctant to drive themselves, students may end up missing school. Transportation issues may affect all students’ regular attendance but also are likely to lead to chronic absenteeism for some students (Lenhoff et al., 2021). Second, employment by noncitizen men with lower levels of education decreases when immigration enforcement increases (East et al., 2018). Older students may therefore leave school in order to supplement their families’ incomes (Martinez, 2016).
Immigration enforcement may increase student absences through negative effects on mental or physical health. Partnerships between local law enforcement and ICE increase mental health distress for Latino immigrants (Wang & Kaushal, 2019). Children and adolescents concerned about immigration enforcement have poorer mental health (Allen et al., 2015; Capps et al., 2020; Cardoso et al., 2021; Luo & Escalante, 2021; Zayas et al., 2015); adolescents and adults concerned about immigration enforcement exhibit poorer health behaviors (Luo & Escalante, 2021; Mann-Jackson et al., 2018); and immigration enforcement worsens birth outcomes (Rhodes et al., 2015; Tome et al., 2021). Although ICE policy designates health-care facilities as sensitive locations, this does not prevent cooperating local law enforcement from conducting arrests near health care facilities. In North Carolina, sheriff’s deputies have been reported waiting outside of migrant health clinics (Arriaga, 2017). Illness is the main reason students are absent from school, so even small declines in children’s health are likely to increase absenteeism.
Immigration enforcement may also affect child health through reductions in health care coverage, as immigration enforcement decreases take-up for both Medicaid and Affordable Care Act (Alsan & Yang, 2018; Vargas, 2015). Children with breaks in health insurance coverage are less likely to receive preventive care and prescriptions (Olson et al., 2005), which is particularly likely to be detrimental for children with chronic conditions. Approximately 29% of school-age children have chronic conditions, with 8.8% suffering from asthma and 7.9% suffering from attention deficit disorder (ADD) or attention deficit hyperactivity disorder (ADHD), both of which require ongoing care and medication. 7 Students with chronic conditions are already at greater risk for chronic absenteeism; breaks in insurance coverage may increase this risk (Allison et al., 2019).
Immigration enforcement may also increase bullying. In a national study using data from the Civil Rights Data Collection, Kirksey et al. (2020) find no relationship between deportations and bullying rates for Latino students. However, these data likely underreport bullying incidents, given both that Hispanic youth are less likely than White youth to report bullying behaviors as “bullying” and that reports of bullying in the Civil Rights Data Collection must be first filtered through administrators (Lai & Kao, 2018). In contrast, Almeida et al. (2016) find that, in states with more anti-immigrant policies, Latino adults report higher levels of discrimination; this association was strongest for third-generation Latino adults. Regardless of their immigration status, Hispanic students may be perceived by their classmates as unauthorized immigrants; indeed, students who identify as heterosexual are subject to and experience negative effects from homophobic bullying based on their perceived sexual orientation (Poteat & Russell, 2013). During the Trump administration, educators reported increases in bullying related to students’ perceived immigration status (Ee & Gándara, 2020). Bullying has been linked to chronic absenteeism, as students feel lower levels of school connection or fear for their own safety (Balfanz & Byrnes, 2012).
Prior Research
Prior research on the effects of immigration enforcement on student attendance reaches mixed conclusions. In one study, first- and second-generation kindergarten through third-grade immigrant students attend school at higher rates in Enforcement and Removal Operations areas with higher numbers of ICE apprehensions (Sattin-Bajaj & Kirksey, 2019). However, there are only 24 Enforcement and Removal Operations offices that cover relatively large geographic areas, and it is unclear that apprehensions are evenly geographically distributed across areas covered. Alternatively, deportations within 25 miles of school districts are associated with increases in chronic absenteeism for Latino students (as compared with White students; Kirksey et al., 2020).
Immigration raids conducted by ICE agents, whether at worksites or in the community, have negative impacts on student attendance and Head Start enrollment. Following worksite raids, children with an arrested parent are likely to miss school (Chaudry et al., 2010). Reports of immigration enforcement activities have large immediate effects on daily high school attendance, with declines up to 11 percentage points for migrant students (Kirksey, 2020). In the wake of immigration raids, county Head Start enrollment declines for Hispanic children. Although some of this effect is potentially driven by migration, the majority appears to be driven by deterrence, in that families are no longer enrolling children in Head Start (Santillano et al., 2020).
Results may vary because of differences in immigration enforcement policies. ICE raids are a traumatic and salient form of immigration enforcement that may produce larger effects than partnerships between local law enforcement and ICE. Worksite raids, in particular, appear to have large negative effects on student achievement (Zuniga, 2018). In contrast, the relationship between another partnership between ICE and local law enforcement, Secure Communities, and student achievement is negative but small (Bellows, 2019). Understanding the effects of both types of enforcement is important in part because ICE raids represent a fraction of immigration enforcement activity in the U.S. interior: The majority of ICE arrests derive from transfers into ICE custody from federal, state, or local custody, not from community arrests made by ICE (TRAC Immigration, 2018).
Apart from student achievement and attendance, a few prior studies have examined the effects of partnerships between ICE and local law enforcement on other measures of student engagement. In qualitative studies, fear of parental detention and removal under these policies reduces reported participation in extracurricular educational activities (Hagan et al., 2010; Koball et al., 2015). Using an index of policies, including 287(g) programs and Secure Communities, Amuedo-Dorantes and Lopez (2015) find that intensified immigration enforcement increases dropout rates and grade retention rates among the children of likely unauthorized immigrants. Comparing counties that activated 287(g) programs with counties that applied to participate but were not approved by ICE, Dee and Murphy (2019) find that Hispanic student enrollment declined in activating counties. The authors are unable to distinguish between increases in student migration and increases in student dropout rates, although they find that effects are driven by younger students.
Although many of the prior studies focused on the height of immigration enforcement (in terms of removals) during the second term of the Bush administration and first term of the Obama administration, emerging research on the effects of immigration enforcement during the Trump administration suggests large impacts on students’ mental health and well-being, as well as increases in student absenteeism (Capps et al., 2020; Cardoso et al., 2021; Ee & Gándara, 2020). In a national survey, two thirds of educators in the South reported increases in student absenteeism resulting from immigration enforcement (Ee & Gándara, 2020). These impacts may reflect the Trump administration’s larger reliance on community-based arrests by ICE agents, rather than custodial transfers from local law enforcement. Alternatively, they may reflect “a nationalized climate of fear in Latinx communities” during the Trump administration (Cardoso et al., 2021). For example, despite high rates of removals in Harris County and a statewide sanctuary policy in Rhode Island, adolescents did not differ significantly between these two areas in their levels of anxiety about immigration enforcement (Cardoso et al., 2021). As the United States moves into the Biden administration, the effects of this climate of fear may recede, but the effects of immigration-related arrests, detentions, and removals will likely remain.
This project builds on previous work by examining the effects of immigration enforcement on student attendance and uses a quasi-experimental design to recover plausibly causal estimates. This design addresses endogeneity arising from local conditions that would motivate local officials to participate in partnerships with ICE. I also use administrative education data covering the entire student population of North Carolina over the course of nearly a decade. Unlike much work in this area, which uses data at a more aggregated level, I am able to track individual students from grade to grade, as well as identify their location prior to the activation of 287(g) programs. I am also able to identify a more narrowly defined treatment group, Hispanic students ever classified as LEP. I ask how 287(g) programs affect absences for a group of students likely affected by immigration enforcement (Hispanic students ever classified as LEP), as compared with a group of students less likely affected (White students never classified as LEP). I also look at results for Hispanic students never classified as LEP and test two competing hypotheses: (1) That Hispanic students never classified as LEP are affected similarly by 287(g) programs as Hispanic students ever classified as LEP; or (2) that Hispanic students never classified as LEP are unaffected by 287(g) programs, as they are less likely to be the children of immigrants. Finally, I explore whether effects on attendance translate to declines in academic achievement.
Data
Data for this article come from two sources. First, from Immigration and Customs Enforcement (ICE), I use publicly available data on the dates of North Carolina 287(g) programs, as well as more detailed information on historical 287(g) agreements and applications made available to me by Stephanie Potochnick and Juan Pedroza (used in Potochnick et al., 2016; Rugh & Hall, 2016); Dee & Murphy, 2019). Second, I match this information with individual-level student data on attendance for the 2003/2004 through 2012/2013 school years from the North Carolina Education Research Data Center (NCERDC), housed at Duke University. NCERDC maintains all of the administrative records on North Carolina public school students that are collected by the state Department of Public Instruction and makes them available to researchers.
Measures
In primary analyses, I use information on days absent, as well as days in school membership, which is available for every student in Grades 3 through 12 on a yearly (and later semesterly) basis from 2003/2004 forward. Although attendance is sometimes recorded for students in grades PK–2 in later years of data, this information is unavailable prior to the 2005/2006 school year. I therefore exclude students in prekindergarten through second grade in all analyses. Because students switch schools during the year, I total days in membership and days absent over all schools. If a student was absent from school because they had not yet been enrolled in a new school, however, that absence is not included. I also exclude students who have unrealistic values of days in membership or days absent (more days than in the year or more days in absenteeism than in membership).
I also use information on end-of-grade (EOG) test scores in reading and math and end-of-course (EOC) test scores in English 1 and Algebra 1 from the 2003/2004 through 2010/2011 academic years. All third- through eighth-grade students in North Carolina are required to take EOG achievement tests in both reading and math. 8 Most students take the EOC achievement test in English 1 in ninth grade, and many also test that year in Algebra 1 (although some students test in earlier years and many test in 10th grade). I use any student with a valid first (regular administration) test score in either math or reading. I exclude retest scores, as well as students who had only retest scores, because students were scheduled to take retests nonrandomly (students who took retests were mostly students who scored at not proficient levels on the regular administration). I standardize test scores using the entire population of students within the same grade and subject.
Defining Student Treatment Status
NCERDC also contains information about student demographics, which I use to define which students are most likely to be affected by immigration enforcement policies (the “treatment group”). Information on the immigration status of students or their parents is unavailable in NCERDC. Therefore, in main analyses, I use Hispanic students ever classified as LEP as the treatment group, an approach previously employed to identify children who likely have Hispanic immigrant parents (Santillano, 2009). First, immigration enforcement largely affects Hispanic immigrants (Rosenblum & Soto, 2015). Second, students’ English proficiency may serve as a proxy for parental nativity. Among Mexican-origin kindergarteners, 95% of first-generation and 75% of second-generation students spoke only Spanish or predominantly Spanish at home, whereas 85% of third-generation students spoke only English or predominantly English at home (Reardon & Galindo, 2009). I define whether a student was classified as LEP using information on students’ current LEP status and year exiting LEP. In North Carolina during my study period, 73% of Hispanic students are ever classified as LEP. I also show results for Hispanic students never classified as LEP.
In most analyses, I focus on White students never classified as LEP (99% of all White students in North Carolina) as the control group. White students never classified as LEP are the largest subgroup in North Carolina, and Black students never classified as LEP (99% of all Black students) are the second largest group of students. I prefer White students never classified as LEP as the control group to Black students never classified as LEP for several reasons. First, White students are less likely than Black students to be affected by increases in racial animus accompanying increases in immigration enforcement. Second, prior research suggests that Black Americans are more likely than White Americans to view immigration enforcement as discriminatory (Walker et al., 2020). However, I also present robustness checks using Black students never classified as LEP and all non-Hispanic students never classified as LEP as control groups.
In NCERDC, race and ethnicity are captured in most years by a single categorical variable, in which students are identified as American Indian, Asian American, Black, Hispanic, Multiracial, or White (in some years, students are identified as Pacific Islander). I identify students’ modal race and/or ethnicity, or the race and/or ethnicity category they are recorded as most frequently across years. Immigration enforcement might affect the rates of students identifying as Hispanic, as both higher rates of segregation and hate crimes have been linked to Hispanic individuals choosing “Other” rather than “White” as their racial classification (Light & Iceland, 2016). However, fewer than 3% of students classified most frequently as Hispanic are identified in multiple race/ethnicity classifications. 9
Families may migrate in response to 287(g) programs (Capps et al., 2011). Using NCERDC data, I am able to track these migrating families, as long as they remain in North Carolina; I am unable to track any families that move to another state or country. 10 Therefore, in these models I treat students’ county as observed in the 2005/2006 school year as their “permanent county.” In robustness checks, I investigate effects for nonmigratory students as well as effects based on assigning students to the county observed in the 2004/2005 school year. In mapping students to counties, I use the substantial overlap between North Carolina district boundaries and county lines. I exclude students who were located at charter schools. 11
Control Variables
I control for certain student characteristics, particularly grade and gender. 12 I also control for other county-level immigration enforcement policies. Between 2008 and 2011, ICE activated Secure Communities, another type of partnership between ICE and local law enforcement, in all counties in North Carolina. Secure Communities required law enforcement agencies to automatically submit fingerprints of arrested individuals to the DHS’s Automated Biometric Identification System (IDENT). If a match was determined to be a potentially removable individual, ICE might issue a detainer against that individual, or a request to local law enforcement to hold that individual for up to 48 hours for transfer into ICE custody (Kohli et al., 2011; Rosenblum & Kandel, 2011). I control for Secure Communities activation in a particular county school-year using publicly available data on Secure Communities’ activation from ICE. In North Carolina, all 287(g) programs were active in approved counties prior to Secure Communities’ activation.
Sample
Overall, I identify 1,032,136 students in Grades 3 through 12 whom I can observe in a North Carolina county during the spring of 2005/2006. In models, I restrict my sample to 540,180 unique students who were located in a county that applied to participate in a 287(g) program. I only include student-year observations if the student has information on spring absences in that year; I therefore exclude student-year observations where the student is only observed in the fall. 13 If students subsequently move (post 2005/2006) to another county in North Carolina, they remain in my sample. However, if students leave North Carolina, I am unable to observe them.
Analytic Plan
To estimate the effects of increased immigration enforcement via 287(g) programs on student attendance and achievement, I compare students before and after activation of a 287(g) program. The activation of 287(g) programs is an endogenous policy change: Local law enforcement may have applied to host a 287(g) program because of increases in violence in immigrant communities or because of increases in anti-immigrant animus, both of which could negatively impact student attendance. Therefore, I compare only counties that applied to participate in 287(g) programs. This controls for unobserved time-varying factors related to the local county’s desire to participate in 287(g) programs. This approach of comparing individuals in counties that were approved for 287(g) programs only with individuals in counties that were not approved for 287(g) programs is similar to that used in several prior nationwide studies to estimate the effects of 287(g) programs on food insecurity, foreclosure rates, and school enrollment (Dee & Murphy, 2019; Potochnick et al., 2016; Rugh & Hall, 2016).
Although I show results for Hispanic students ever and never classified as LEP in a difference-in-difference specification, my preferred approach introduces a third difference, in most cases comparing Hispanic students ever or never classified as LEP with White students never classified as LEP. This third difference accounts for any trends in participating and nonparticipating counties affecting all students. I also show a falsification check comparing Black and White students never classified as LEP.
The difference-in-difference-in-differences specification uses the following equation:

Here, Y is the number of absences for an individual student
As described earlier, I control for student gender and county-level Secure Communities activation. I also use several layers of fixed effects, including permanent county fixed effects (
In specification checks for effects of 287(g) programs on absences, I estimate negative binomial regressions. 14 Because I reach similar results using all approaches, I use OLS in additional robustness and falsification checks. Since restricting only to counties that applied for 287(g) programs drastically reduces the number of counties in my analysis, I use a wild cluster bootstrap (user-written boottest in Stata) to account for clustering at the county level as well as small numbers of counties (Roodman et al., 2019).
To discern whether results are driven by prior trends in absenteeism for Hispanic students ever or never classified as LEP in activating counties, I modify the equation so that
Results
Descriptive Statistics
Table 2 shows descriptive statistics for the three groups of counties in North Carolina, which are counties that did not apply to host a 287(g) program (76), counties that did apply but were not approved to host a 287(g) program (15), and counties that were approved for 287(g) program (9). Counties that were approved to host a 287(g) program are much larger, on average, than counties that did not apply to host a 287(g) program and counties that were not approved for a 287(g) program. Two of the most populous counties in North Carolina, Mecklenburg and Wake, activated 287(g) programs.
Demographic Information, by 287(g) Application and Approval Status

Note. LEP = Limited English proficient.
I exclude Asian American, American Indian, and multiracial students in all analyses.
Counties also differ in terms of racial/ethnic makeup. Counties that were approved for 287(g) programs have the highest percentage of Hispanic students ever classified as LEP (5.92%), and counties that did not apply for 287(g) programs have the lowest percentage of Hispanic students ever classified as LEP (4.74%). A much larger share of students in counties not approved for 287(g) programs are White, relative to students in either counties that did not apply to host 287(g) programs and counties that were approved for 287(g) programs. Nearly three quarters of students in counties not approved for 287(g) programs are White, as compared with half of students in counties approved for 287(g) programs. Correspondingly, in counties approved for 287(g) programs, approximately 36% of students are Black, whereas only 16% of students are Black in counties not approved. Counties that did not apply to host 287(g) programs fall in between counties that were approved or not approved.
Table 3 shows average days absent and absence rates (number of absences divided by days in membership) for counties by 287(g) application and approval status. In counties that did not apply to host 287(g) programs, students are absent an average of 8.03 days per year, with an absence rate of 4.85%. In approved counties, students are absent slightly less, with an average of 7.82 days per year and an absence rate of 4.81%. In denied counties, students are absent the least, with an average of 7.34 days a year and an absence rate of 4.41%. Overall, nearly 90% of students have at least one absence during a school year, and nearly half of students are absent at least 6 days. A large number of students are absent 10 or more (28%), 15 or more (14%), or 20 or more days (8%). Differences begin to emerge between counties by approval status in terms of high numbers of absences: Counties approved for 287(g) programs have higher percentages of students who are absent for larger numbers of days than counties not approved for 287(g) programs.
Descriptive Statistics on Absences, by 287(g) Application and Approval Status

Main Findings
I first present difference-in-differences results for Hispanic students ever and never classified as LEP, comparing students in counties activating 287(g) programs with students in counties not activating 287(g) programs prior to and following activation. As shown in Table 4, the activation of a 287(g) program appears to increase absences for Hispanic students ever classified as LEP by a little more than a day (
Effect of 287(g) Programs on Absences, Difference-in-Differences Models

Note. p values (in parentheses) and confidence intervals (in brackets) obtained through wild cluster bootstrap, with clustering at the county level (999 replications). LEP = limited English proficient; FE = fixed effect.
p < .10. **p < .05. ***p < .01.
As falsification checks, I estimate similar models with White and Black students never classified as LEP, again comparing students in counties activating 287(g) programs with students in counties not activating 287(g) programs prior to and following activation. White and Black students are less likely to be directly affected by 287(g) programs than Hispanic students, as few White and Black students in North Carolina are immigrants or the children of immigrants. Additionally, all evidence in North Carolina suggests that both law enforcement and community members were aware that 287(g) programs were focused on the identification and removal of Hispanic immigrants. As expected, I find that the activation of 287(g) programs has no effect on attendance for White or Black students never classified as LEP.
I then introduce the third difference for my preferred specification, comparing Hispanic students ever and never classified as LEP with White students never classified as LEP (Table 5). Here, the main coefficient of interest is for the triple difference,
Effect of 287(g) Programs on Absences, Difference-in-Difference-in-Differences Models

Note. p values (in parentheses) and confidence intervals (in brackets) obtained through wild cluster bootstrap, with clustering at the county level (999 replications). LEP = Limited English proficient; FE = fixed effect.
p < .10. **p < .05. ***p < .01.
The lack of a significant relationship between 287(g) program activation and absenteeism among White and Black students never classified as LEP, as compared with the increase in absences for Hispanic students associated with 287(g) program activation, gives me greater confidence that increases in absences for Hispanic students ever and never classified as LEP are due to the activation of 287(g) programs, rather than any other simultaneous policy change.
I employ an event history analysis in which I interact indicators for my treatment group and approved counties with a series of leading and lagged indicators, with the period 1 year prior to activation serving as the base group. As shown in Figure 1, I see no effect of 287(g) activation on leading indicators of program activation, giving me greater confidence that effects do not arise solely from prior trends in counties activating 287(g) programs. Although not all effects remain significant at conventional levels once I interact year of activation and year lags with program approval and treatment group, estimates of the effects of year of activation and lagging indicators appear fairly consistent over the course of the program.

Event study for effects on absences.
Robustness Checks
In addition to the event history analysis and falsification checks, I conduct a variety of specification and robustness checks. As shown in Table 6, results are similar for days absent when I use negative binomial models rather than OLS. Results are also similar when I substitute absence rate for days absent, calculated as the percent of absences out of days in membership (Table 7). The activation of a 287(g) program increases the absence rate by approximately 0.5 percentage points, or about 1 day per year.
Effect of 287(g) Programs on Absences, Negative Binomial Models

Note. p values (in parentheses) obtained through score cluster bootstrap, with clustering at the county level (100 replications). LEP = Limited English proficient; FE = fixed effect.
p < .10. **p < .05. ***p < .01.
Effect of 287(g) Programs on Absence Rate
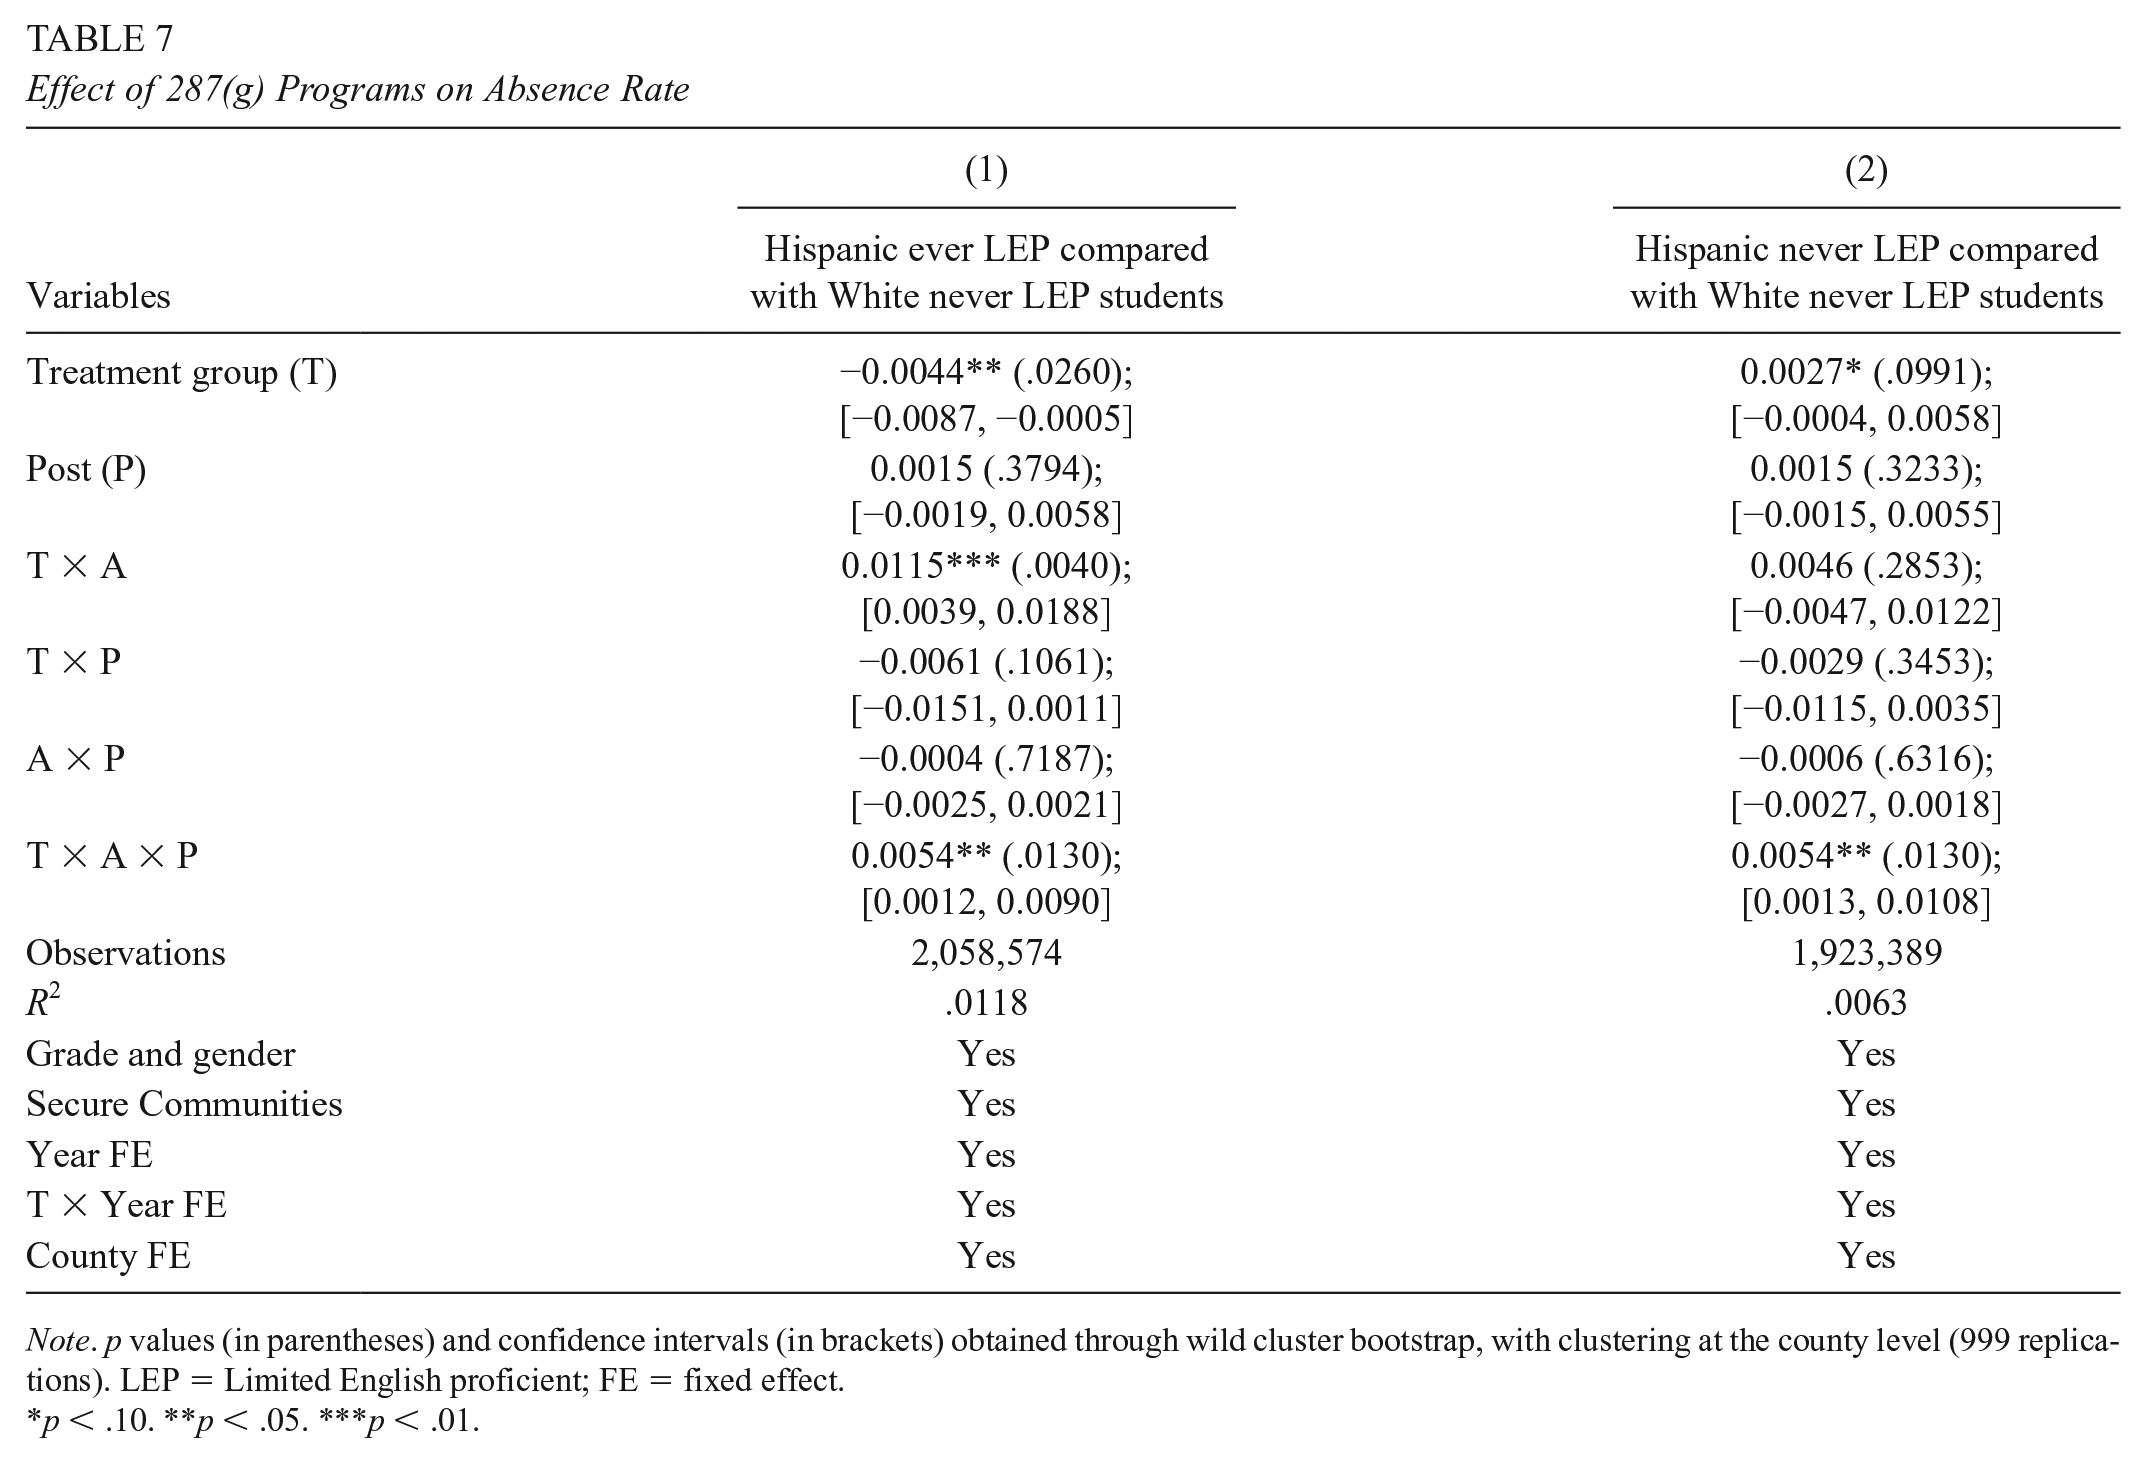
Note. p values (in parentheses) and confidence intervals (in brackets) obtained through wild cluster bootstrap, with clustering at the county level (999 replications). LEP = Limited English proficient; FE = fixed effect.
p < .10. **p < .05. ***p < .01.
In Table 8, I show results when I vary control variables and fixed effects, vary control group, and vary sampling decisions. Estimates for the effects of 287(g) programs on Hispanic students ever classified as LEP range from about two thirds of a day to slightly more than a day and a half when I include or exclude different combinations of control variables and fixed effects. Estimates are also robust to my choice of control group; when I compare Hispanic students ever classified as LEP with Black students never classified as LEP, the activation of 287(g) programs appears to increase absences for Hispanic students ever classified as LEP by about 88% of a day. Similarly, when I compare Hispanic students ever classified as LEP with all non-Hispanic students never classified as LEP, the activation of 287(g) programs appears to increase absences by about 72% of a day.
Robustness Checks for Difference-in-Difference-in-Differences (DDD) Estimates, Comparing Hispanic Students Ever Classified as LEP With White Students Never Classified as LEP

Note. Confidence intervals obtained through wild cluster bootstrap, with clustering at the county level (999 replications). LEP = Limited English proficient; FE = fixed effect; SC = Secure Communities.
p < .10. **p < .05. ***p < .01.
Estimates are also robust to different data decisions. First, I exclude 2013, in which Durham and Alamance had deactivated their 287(g) programs. Second, I include only students who do not move from their permanent county (93% of Hispanic students ever classified as LEP and 92% of White students never classified as LEP). Finally, I use students’ county as identified in the 2004/2005 school year. In main models, I use students’ county as identified in the 2005/2006 school year; Mecklenburg activated their 287(g) program in February of 2006, immediately prior to the collection of attendance data. In all robustness checks, I reach very similar results: The activation of 287(g) programs increases absences for Hispanic students ever classified as LEP by about a day.
Results for Hispanic students never classified as LEP are similarly robust to varying control variables and fixed effects, varying control groups, and varying sampling decisions, as shown in Table 9. The size of the estimated effect is generally slightly lower than for Hispanic students ever classified as LEP, ranging from about half of a day to a little less than a day.
Robustness Checks for Difference-in-Difference-in-Differences (DDD) Estimates, Comparing Hispanic Students Never Classified as LEP With White Students Never Classified as LEP

Note. Confidence intervals obtained through wild cluster bootstrap, with clustering at the county level (999 replications). LEP = Limited English proficient; FE = fixed effect; SC = Secure Communities.
p < .10. **p < .05. ***p < .01.
Counties vary dramatically in population size, with Mecklenburg and Wake together accounting for approximately a third of all students. In order to determine whether one county is driving results, I iteratively drop counties (both approved and denied) and reestimate models using my preferred triple difference specification. As shown in Figure 2, results are largely robust to this test. When I drop Mecklenburg, the triple difference estimate is similar in size but does not reach conventional levels of statistical significance for Hispanic students ever classified as LEP. Similarly, excluding Wake or Durham county does not reduce the estimated size of the effect but does reduce precision so that effects are only marginally significant for Hispanic students ever classified as LEP. Results for Hispanic students never classified as LEP are similarly sensitive to the exclusion of Wake county.

Effect of 287(g) programs on absences, dropping counties iteratively.
Varying Effects Based on Number of Days Absent
Effects on number of days absent may result from increases in a few days absent or increases in many days absent. To identify where in the distribution of absences increases occur, I estimate a series of linear probability models, using the same triple difference approach, in which the outcomes are indicators for number of absences. I divide these into one or more absences, two or more absences, three or more absences, six or more absences, 10 or more absences, 15 or more absences, 20 or more absences, or 50 or more absences.
As shown in Figure 3, I find that increases in absences for Hispanic students ever classified as LEP are driven by increases in chronic absenteeism. There are no effects of the activation of 287(g) programs on the likelihood that students will have up to 10 absences. However, the activation of 287(g) programs appears to increase the likelihood that Hispanic students ever classified as LEP will have 15 or more, 20 or more, or 50 or more absences, relative to White students never classified as LEP. The activation of a 287(g) program appears to increase the probability that Hispanic students ever classified as LEP will be absent 15 or more days by about two percentage points, with a similarly sized increase in the probability that Hispanic students ever classified as LEP will be absent 20 or more days. As shown in Table 3, across all counties, about 14% of students are absent 15 or more days, and 8% of students are absent 20 or more days. The activation of a 287(g) program also increases the probability that Hispanic students ever classified as LEP will be absent 50 or more days by about one percentage point; this represents a doubling in the likelihood of missing 50 or more days from the baseline rate of 0.78% of students overall who are absent 50 or more days. Estimates for Hispanic students never classified as LEP are imprecisely measured, but increases in absences for this group appear less driven by increases in chronic absenteeism.
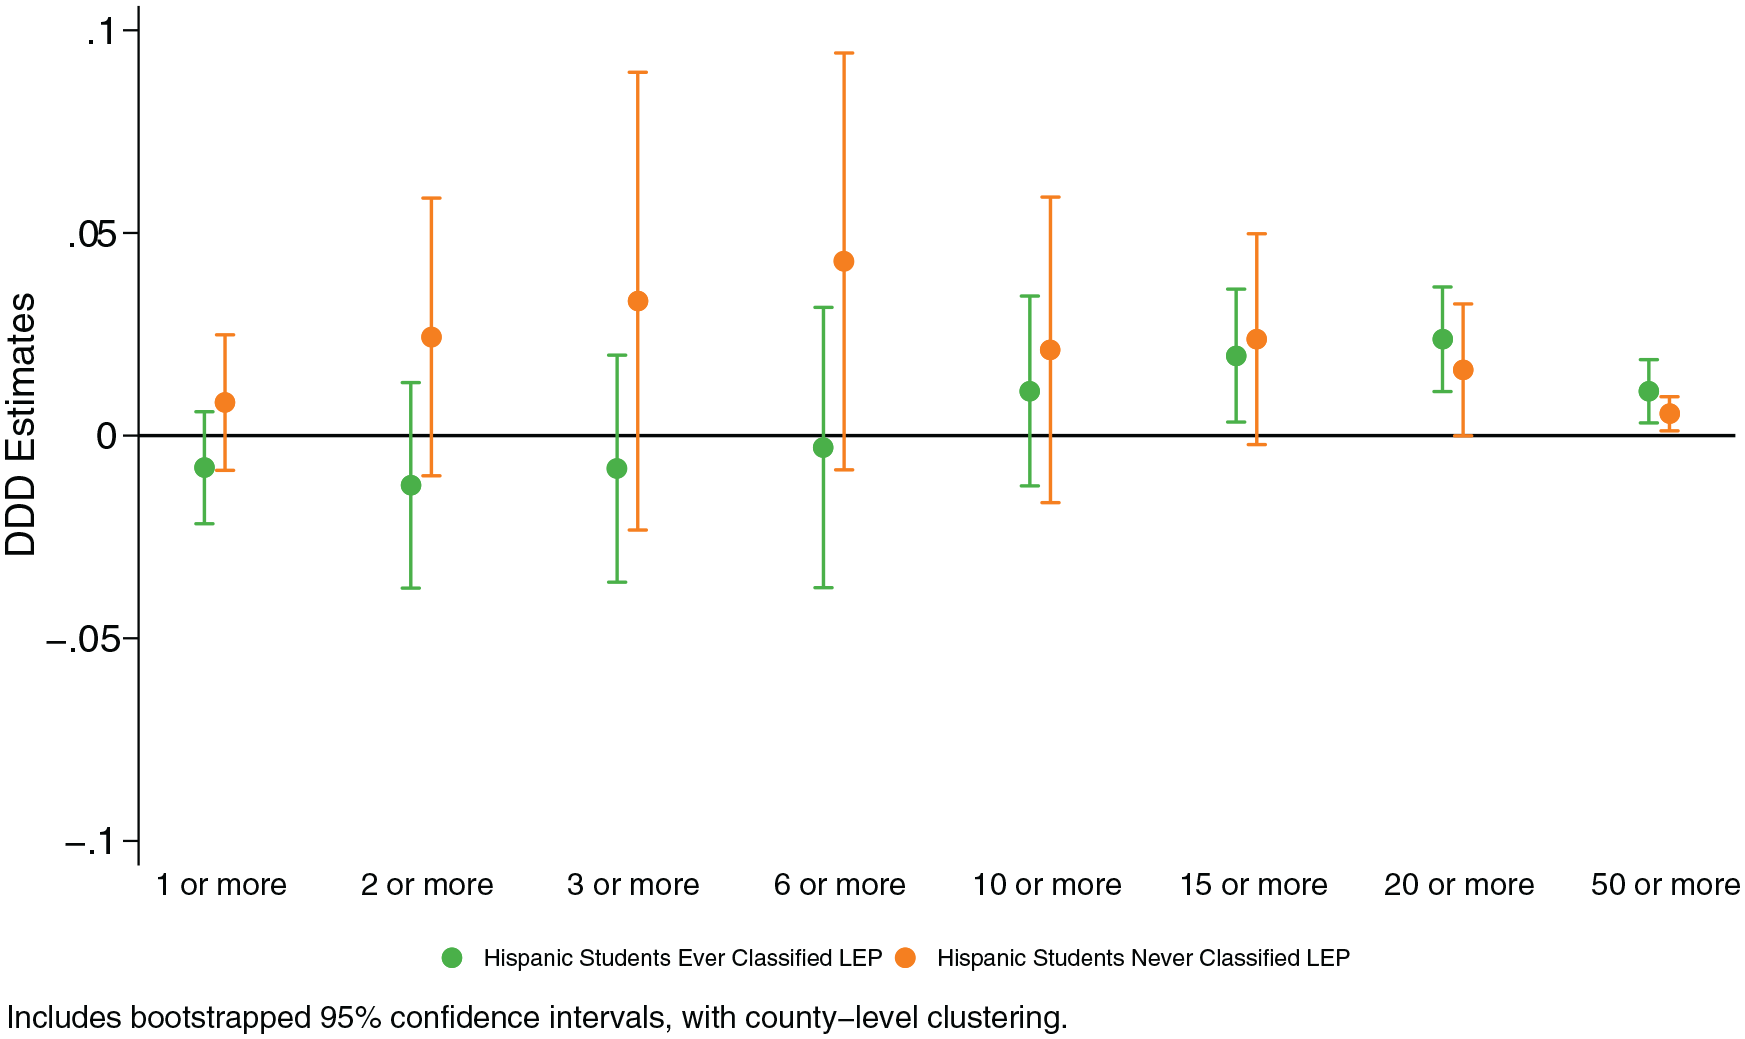
Effects of 287(g) programs on a series of absence indicators.
Student Achievement
Increases in absences are likely to decrease student achievement. Additionally, student achievement may be affected by immigration enforcement through mechanisms other than increases in absences: Students experience increased stress, decreasing their ability to focus in school. However, as shown in Table 10, I find no effect of the activation of 287(g) programs in North Carolina for Hispanic students ever or never classified as LEP in either math or reading achievement. I also find no effects for either group of students on English I or Algebra I test scores (Table 11).
Effect of 287(g) Programs on Achievement in Grades 3 to 8

Note. p values (in parentheses) and confidence intervals (in brackets) obtained through wild cluster bootstrap, with clustering at the county level (999 replications). LEP = Limited English proficient; FE = fixed effect.
p < .10. **p < .05. ***p < .01.
Effect of 287(g) Programs on Achievement in Grade 9

Note. p values (in parentheses) and confidence intervals (in brackets) obtained through wild cluster bootstrap, with clustering at the county level (999 replications). LEP = Limited English proficient. LEP = Limited English proficient; FE = fixed effect.
p < .10. **p < .05. ***p < .01.
Discussion
In prior studies, immigration raids have been found to decrease student attendance (Chaudry et al., 2010; Kirksey, 2020); no prior research has examined the effects of partnerships between local law enforcement and ICE on school attendance. Work on achievement suggests that immigration raids appear to have stronger effects on schooling outcomes than partnerships between ICE and local law enforcement. However, prior studies suggest that partnerships between ICE and local law enforcement may decrease school engagement, via an increase in student dropout rates (Amuedo-Dorantes & Lopez, 2015). My results also suggest that the immigration enforcement decreases student engagement, via decreases in student attendance. Overall, I find that these partnerships increase absences for both Hispanic students ever and never classified as LEP by a day per year.
For Hispanic students ever classified as LEP, this increase is primarily driven by an increase in chronic absenteeism: I find significant increases in the number of Hispanic students ever classified as LEP absent from school 15 or more, 20 or more, and even 50 or more days. These results contrast with work on the effects of immigration raids, which finds that students are more likely to be absent immediately after raids (Kirksey, 2020). Although the mechanism through which 287(g) programs affects attendance is unclear, the relatively small overall effect coupled with the increase in chronic absenteeism suggests that a small number of students dramatically reduce attendance in areas with 287(g) programs. These students may be dealing with the consequences of a household immigration arrest or removal. Alternatively, they may be avoiding school due to harassment or fear of apprehension at school.
Decreasing school attendance has ramifications for students and families. Although I detect no impact of 287(g) programs on achievement, overall, most evidence suggests that absences and chronic absenteeism decrease student achievement (Aucejo & Romano, 2016; Gershenson et al., 2017; Goodman, 2014; Gottfried, 2011, 2014; Liu et al., 2021). Absenteeism, and particularly chronic absenteeism, affects educational outcomes beyond test scores. In one study, high rates of absenteeism had a stronger relationship with ninth-grade students’ course performance and ability to accumulate credit than students’ prior test scores (Allensworth & Easton, 2007). High rates of absenteeism have long been associated with increased risk of dropping out of high school (Balfanz et al., 2007; Schoeneberger, 2012); the size of increased risk is substantial: In one study, sixth-grade students absent 20% of the year were 68% less likely to graduate high school than their peers (Balfanz et al., 2007). Therefore, increases in chronic absenteeism may be a precursor to students leaving school entirely.
Decreasing school attendance also has implications for schools. When students are absent, schools lose federal and state education funding based on daily attendance. Under the Every Student Succeeds Act, states are also required to report chronic absenteeism, and 37 states and the District of Columbia have also incorporated chronic absenteeism as their additional “school quality or student success” accountability indicator required under the Every Student Succeeds Act of 2015. Districts and schools in these states are now held accountable for chronic absenteeism rates. 15 Although in-school interventions can reduce chronic absenteeism (Cook et al., 2017), out-of-school policies are also drivers of chronic absenteeism and can be addressed via policy.
I find no effect of 287(g) programs on test scores. Prior work on the effects of absences suggests that an increase in absences of a day per year might be expected to decrease student test scores by 0.005 standard deviations in math and 0.007 standard deviations in reading (Fitzpatrick et al., 2011). I may be underpowered to detect these effects, or effects may be concentrated among older students, for whom I do not have test scores. Educators report stronger impacts of immigration enforcement for high school, as opposed to elementary, students (Ee & Gándara, 2020). In contrast, as previously noted, large worksite raids appear to have large negative effects on math and reading achievement for Grade 3 through 8 students in the same vicinity (Zuniga, 2018).
Because school attendance is mandatory, any effect on student attendance is possibly larger for nonmandatory educational programming. Under conditions of increased immigration enforcement, students in families with unauthorized members are less likely to attend after-school programs or enroll in early childhood education programs (Ee & Gándara, 2020; Santillano et al., 2020). One limitation is that North Carolina does not consistently collect data on attendance for Grades PK–2. Future work should focus on the effects of different immigration enforcement policies on nonmandatory educational programming.
Conclusion
During the second term of the Obama administration, immigration enforcement activity de-escalated, as the administration focused on identifying and removing serious criminal offenders. In contrast, the Trump administration adopted a universal approach to immigration enforcement, with the goal to identify and remove as many unauthorized immigrants as possible, regardless of criminal status. From 2017 to 2018, the number of active 287(g) agreements grew from 30 to 76, the most in the history of the program (Capps et al., 2018). The Biden administration has reversed course and proposed an array of more immigrant-friendly policies, including a pathway to citizenship for unauthorized immigrants residing in the United States. However, the country remains divided on many questions around immigration policy, including on how to treat unauthorized immigrants living in the U.S. interior.
My results add to a growing body of literature suggesting that harsh immigration enforcement policies have negative consequences for the children of unauthorized immigrants and the broader population of Hispanic children and youth. School attendance is necessary for other positive schooling outcomes, and chronic absenteeism is linked to increases in school dropout rates. Reducing overall levels of educational attainment will negatively impact the U.S. economy and may reduce the likelihood of political engagement. 16
In Plyler v. Doe, the Supreme Court overturned a Texas law withholding state funds for the education of unauthorized immigrant children and authorizing school districts to disenroll unauthorized immigrant children. In the opinion for the majority, Justice Brennan wrote, “It is difficult to understand precisely what the State hopes to achieve by promoting the creation and perpetuation of a subclass of illiterates within our boundaries” (Plyler v. Doe, 1982, p. 230). Although immigration enforcement is a more subtle form of administrative burden than laws restricting access to education based on immigration status, it also has negative effects on educational outcomes both for children who are unauthorized immigrants themselves and the larger population of Hispanic children. When considering the full costs of immigration enforcement, policy makers should consider Justice Brennan’s implied question from nearly 50 years ago: Are the costs associated with leading multiple generations of individuals to disengage from U.S. society worth the benefits?
Footnotes
Acknowledgements
This work has been supported (in part) by the Horowitz Foundation. Any opinions expressed are those of the author alone and should not be construed as representing the opinions of the foundation. This research was also supported by the Institute of Education Sciences, U.S. Department of Education, through Grant R305B170002 to the University of Virginia (PI: Sara Rimm-Kaufman). The opinions expressed are those of the author and do not represent views of the Institute or the U.S. Department of Education. Thanks to Stephanie Potochnick and Juan Pedroza, who made available data on 287(g) program applications and statuses. Thanks to participants at the Summer Institute in Migration Research Methods and the annual conference of the Association for Public Policy Analysis and Management for their many helpful comments on early iterations of this paper (particularly Carolyn Heinrich, who served as a discussant for this paper twice). Many thanks to Anna Gassman-Pines, Liz Ananat, and Seth Sanders for reading and providing comments on multiple drafts of this paper. Finally, thanks to Daphna Bassok, Lucy Sorensen, and Ying Shi to their helpful comments on final iterations.
Notes
Author
LAURA BELLOWS is an IES postdoctoral fellow with the School of Education and Human Development at the University of Virginia. Her work focuses on how U.S. social policies relate to child outcomes.