
Abstract
This two-part study explored whether discrimination encoded into U.S. school absenteeism policies leads to racially minoritized students being overrepresented in the juvenile court system. First, we examined unexcused absenteeism policies in a nationally representative school district sample (n = 97). All districts excused absences for reasons White students often miss school but not necessarily for reasons racially minoritized students do. Next, in three school districts we documented large racial disparities in both the proportion of absences designated unexcused (Whites 13%, Asians 18%, Hispanics 21%, Blacks 24%, and American Indians 24%) and risk of court petition for truancy, even after accounting for the total number of absences: Whites hazard ratio (HR) = 1.0; Asians HR = 1.15, 95% confidence interval (CI) [0.98, 1.36]; Hispanics HR = 1.60, 95% CI [1.34, 1.92]; Blacks HR = 2.17, 95% CI [1.88, 2.50]; and American Indians HR = 3.94, 95% CI [3.12, 4.97]. Disproportionality in unexcused absenteeism fully explained the Hispanic/White and partially explained the Black/White and American Indian/White court petition disparities.
U.s. schools enforce compulsory education laws by disciplining students for unexcused absences. Disciplinary responses occur at two levels—the school and the justice system. School-level responses include not allowing students to make up homework or exams, denying course credit, requiring Saturday school, linking families to supports and resources, and suspending students (Carpenter & McNeely, 2018). Justice system responses are used in the 43 states that codify unexcused absenteeism (referred to as truancy) as illegal. These responses include court diversion programs, petitions to juvenile court, student driver’s license suspension, and parental fines (Conry & Richards, 2018). School and justice system responses to unexcused absences contrast sharply with those for excused absenteeism (e.g., help with missed assignments, opportunities to make up exams, and in-home tutoring; Carpenter & McNeely, 2018).
Compared with White and middle-class students, Black and low-socioeconomic-status students have a substantially greater proportion of their school absences designated unexcused, making them disproportionately eligible for justice system interventions (Gershenson et al., 2017; Gottfried, 2009; Holt & Gershenson, 2019; Klein et al., 2020; Whitney & Liu, 2017). In 2018, American Indian and Black students were approximately 25% more likely than White students to be petitioned to juvenile court for unexcused absenteeism (Hockenberry & Puzzanchera, 2020). These disparities have persisted for decades.
Research is needed to understand why racially minoritized students have a greater proportion of their absences designated as unexcused and the extent to which this disproportionality explains the long-standing racial disparities in juvenile justice involvement for unexcused absenteeism. Although a large body of research has documented that racial and ethnic disparities in juvenile court involvement for in-school rule breaking are inequitable and result, in part, from racist school discipline policies (Welsh & Little, 2018), a parallel investigation of school attendance policies and their inequitable consequences is yet to be undertaken. Data challenges contribute to the paucity of research on unexcused absenteeism policies and juvenile court involvement. Because most states do not provide information about whether student absences are excused or unexcused, such data typically must be obtained from individual districts. Furthermore, data on juvenile court petitions for unexcused absenteeism are maintained by county attorneys’ offices and are neither publicly available nor easily linked to educational data. If this topic remains unstudied because of these difficulties, severe inequities could remain hidden in plain sight.
The purpose of this article is twofold: (1) to present the theoretical argument for how seemingly race-neutral attendance policies could result in school staff disproportionately petitioning racially minoritized students to juvenile court for unexcused absenteeism and (2) to provide preliminary evidence to test this argument’s plausibility. Due to the complexities of obtaining relevant school district and juvenile court data, we used a sequential research design with two different samples and data sets. First, we created a policy database for a representative sample of 97 medium-sized U.S. school districts and critically examined their definitions of excused and unexcused absenteeism. This analysis established the plausibility of the hypothesis that widely used definitions of excused and unexcused absences could cause racial and ethnic disparities in the proportion of absences designated unexcused.
We then used 15 years of individual, linked administrative data from three school districts with normative attendance policies to determine (1) whether the pattern of disparities in unexcused absences predicted by the policy review occurred in these districts and (2) whether this disparity explained the racial and ethnic disparities in juvenile court petitions for unexcused absenteeism. These analyses established the plausibility of the second causal link in our conceptual framework, namely that racial and ethnic disparities in unexcused absenteeism rates account for disparities in juvenile court petitions for unexcused absenteeism.
This study could not directly test the proposed theoretical mechanism through which race-neutral attendance policies contribute to racial and ethnic disparities in juvenile court petitions for unexcused absenteeism. However, this study does offer multiple innovations. To our knowledge, this is the first critical analysis of U.S. public school attendance policy content and the most complete theoretical explanation of how systemic racism is sustained through the practice of daily attendance taking. We also included several racially minoritized groups in the analysis, including American Indians, who too often are excluded in education research.
Unexcused Versus Excused Absenteeism: What Is the Difference?
School attendance became compulsory in the United States beginning in the 1850s, largely in response to fears about increased immigration. Early boosters of free, compulsory education saw public schools as a way to inculcate Christian morality and democratic patriotism in the newly arrived children (Katz, 1976). These compulsory education laws were largely unenforceable until enforcement policies and structures emerged in the early 1900s. These policies, which remain in place today, included requiring schools to take attendance and granting the justice system the authority and responsibility to fine or sentence noncompliant families and students. Legal enforcement of school attendance concomitantly required the means to exempt absences for legitimate reasons. Consequently, most state education laws added the requirement that schools distinguish excused from unexcused absences, and restricted enforcement of compulsory school attendance to unexcused absences (Conry & Richards, 2018).
In most states, excused absences are legally defined as being either outside the student’s control or for the student’s social or educational benefit (Conry & Richards, 2018). Examples of excused absences include those due to illness, spending time with a parent in the military, and visiting colleges. Schools respond to excused absences by helping children make up homework and exams and providing in-home instruction (Carpenter & McNeely, 2018). In contrast, unexcused absences for students over age 11 years are legally defined as deviant or willful (Birioukov, 2016; Jonasson, 2011; Lyon & Cotler, 2007). Staff must designate as unexcused all absences without proper documentation (e.g., a parental note) of a legitimate absence and apply disciplinary action once a student accrues given number of unexcused absences (Conry & Richards, 2018).
Schools typically apply a mix of supportive and punitive responses to unexcused absenteeism. Supportive responses include calling or sending texts or letters to parents, making home visits, and linking students and families to social services. Punitive responses include requiring Saturday school, suspending students, forbidding extracurricular activity participation, and denying homework, exam, or course credit (Carpenter & McNeely, 2018). When such measures fail to reduce unexcused absenteeism, schools can request justice system involvement. In some districts, school personnel can directly petition students to juvenile court after a specified number of unexcused absences, typically five to seven (Conry & Richards, 2018). More commonly, however, school personnel first refer students to a court diversion program (Carpenter & McNeely, 2018) run by the county attorney’s office or a designated agency. If their attendance does not improve in the court diversion program, students can be petitioned to juvenile court. Such petitions can result in court-ordered school attendance, parental fines, students’ loss of their driver’s license, or, in extreme cases, student removal from the home.
Critical Race Theory, Color-Blind Policies, and Unexcused Absenteeism
Critical race theory can be used to understand how racism is institutionalized in day-to-day unexcused absenteeism policies, even when school leaders explicitly craft those policies to be color-blind (i.e., not taking race or ethnicity into account; Bonilla-Silva, 1997, 2006; Gillborn, 2005; Roithmayr, 2014). This seemingly paradoxical situation results from the way humans process information (Gillborn, 2005; Roithmayr, 2014).
To process information rapidly, humans rely on mental models (Roithmayr, 2014) or frames (Bales & Gilliam, 2004; Bonilla-Silva, 2006), which consist of a set of unquestioned assumptions. People use frames to quickly conceptualize an issue, identify who is responsible, and choose the best solution. While multiple frames coexist in society, there is typically a dominant frame constructed by the dominant group—in this case, Whites. This group naturally adopts a frame that protects its interests (Roithmayr, 2014). Dominant frames persist through time and circumstances because the default psychological pattern is to fit new information into a dominant frame rather than adjust the frame to accommodate the new information (Bales & Gilliam, 2004). The end result is that educational laws and policies automatically perpetuate unearned educational advantages for White students and families (Bonilla-Silva, 2006; Roithmayr, 2014).
Bonilla-Silva (2006) identified three frames underpinning color-blind education policies, including absenteeism policies: (1) the abstract liberalism frame, (2) the cultural racism frame, and (3) the naturalization frame. The overarching abstract liberalization frame prioritizes merit, individual responsibility, and equal opportunity (Bonilla-Silva, 2006). School absenteeism policies emanating from this frame classify absences considered responsible or meritorious as excused, while those considered irresponsible or deviant are categorized as unexcused and even illegal (Conry & Richards, 2018). While both Black and White Americans value merit, responsibility, and opportunity (Manning et al., 2015), White Americans typically control the definition of what is responsible and meritorious (Bonilla-Silva, 2006; Roithmayr, 2014).
While this dominant frame results in educational inequities, two additional frames are applied to explain them as inevitable, natural occurrences (Bonilla-Silva, 2006). The cultural racism frame posits that racial and ethnic disparities in unexcused absences result from racially minoritized families either valuing education less than White families or failing to understand the importance of school attendance (Zirkel & Pollack, 2016). Minimizing the logistical challenges disproportionately experienced by racially minoritized families due to segregation and poverty (e.g., transportation barriers, lack of reliable child care, and unpredictable work schedules) is an example of conflating impoverished circumstances with impoverished values. Ironically, these logistical challenges can be greatest for racially minoritized parents who are highly engaged in their children’s education and take advantage of open enrollment policies to send their children out of their home school zone to safer, higher-performing schools (Stein & Grigg, 2019).
The third frame used to justify color-blind educational policies, the naturalization frame, attributes racial and ethnic disparities in unexcused absenteeism to societal sources outside the school. This frame manifests as the argument that overburdened schools should not be expected to fix problems beyond their control (Zirkel & Pollack, 2016), which allows Whites to maintain an ethos of fair play even as attendance policies grant them unmerited advantages. As Bonilla-Silva (2006) wrote, “Whites can appear ‘reasonable’ and even ‘moral’ while opposing almost all practical approaches to deal with de facto racial inequality” (p. 28).
Color-blind frames are evident in assertions, without evidence, that the association between unexcused absenteeism and academic difficulties is due to student delinquency, parental disinterest, or parental lack of knowledge about the importance of education (Eaton et al., 2008; Gottfried, 2009). Many students with unexcused absences have disengaged parents or are disengaged themselves. However, when student or family disengagement is offered as the only explanation for the association between unexcused absenteeism and low academic achievement, it obscures any role that color-blind attendance policies may play in shaping student outcomes.
Method
Our analysis consisted of two separate components that, taken together, test the plausibility of the theoretical claim that attendance policies intended to be race-neutral are not race-neutral in their effect on juvenile court involvement for unexcused absenteeism. We followed a transformative study design guided by critical race theory (Creswell & Plano Clark, 2011). In this design, the qualitative research phase illuminates the social processes that produce the disparities, while the quantitative phase examines hypotheses about the size and scope of the disparities, as well as their effects. The link between the qualitative and quantitative components in this study is interpretive rather than empirical.
Study Component 1: Policy Content Analysis
Data Sources
We used a random sample of 97 U.S. public school districts from the 1,256 public school districts with between 7,000 and 40,000 students listed in the National Center for Education Statistics (NCES) 2018 Common Core of Data (NCES, 2020b). To draw the sample, we created and used a uniform random variable to sort the medium-sized districts into a random order, and then selected the first 97 districts. The sample contained rural, suburban, and urban districts in 30 states. Only three of the districts were charter districts because few charter districts have more than 7,000 students. States with many medium-sized districts (California, South Carolina, and Alabama) were overrepresented relative to their share of the school-age population. States with many small districts (Ohio, Oklahoma, Iowa, and Nebraska) or few, very large districts (Hawaii and Florida) were underrepresented in terms of their share of the school-age population. The median number of students per district was 12,979 (M = 15,063; SD = 8,150), compared with the median of 11,740 students for all 1,256 public school districts in the United States with between 7,000 and 40,000 students (M = 14,726; SD = 7,790; NCES, 2020b). The two largest school districts in the country—Los Angeles and New York City—are listed as multiple, smaller districts in the Common Core of Data and therefore are represented in this sample.
Data Extraction and Content Analysis
From each school district’s website, we extracted the definitions of excused and unexcused absences, how and when excuses are to be submitted, who has to provide them, and the consequences of unexcused absenteeism. In most cases, this information came directly from the district’s student-parent handbook. In cases where the handbook referred to district or state policies without describing them, we drew the information from the relevant state statute or district policy.
We coded three pieces of information for each district: (1) the definition of excused absences, (2) the definition of unexcused absences, and (3) rules regarding illness verification by a medical provider. We first coded the reasons for excused absences based on the verbatim policy language. After coding policies from 25 school districts, we combined conceptually similar codes (e.g., illness, temporary illness, and quarantine). We then continued the coding process using these codes and adding new ones as appropriate, for a total of 17 codes (Figure 1). All coding was done in Microsoft Excel.
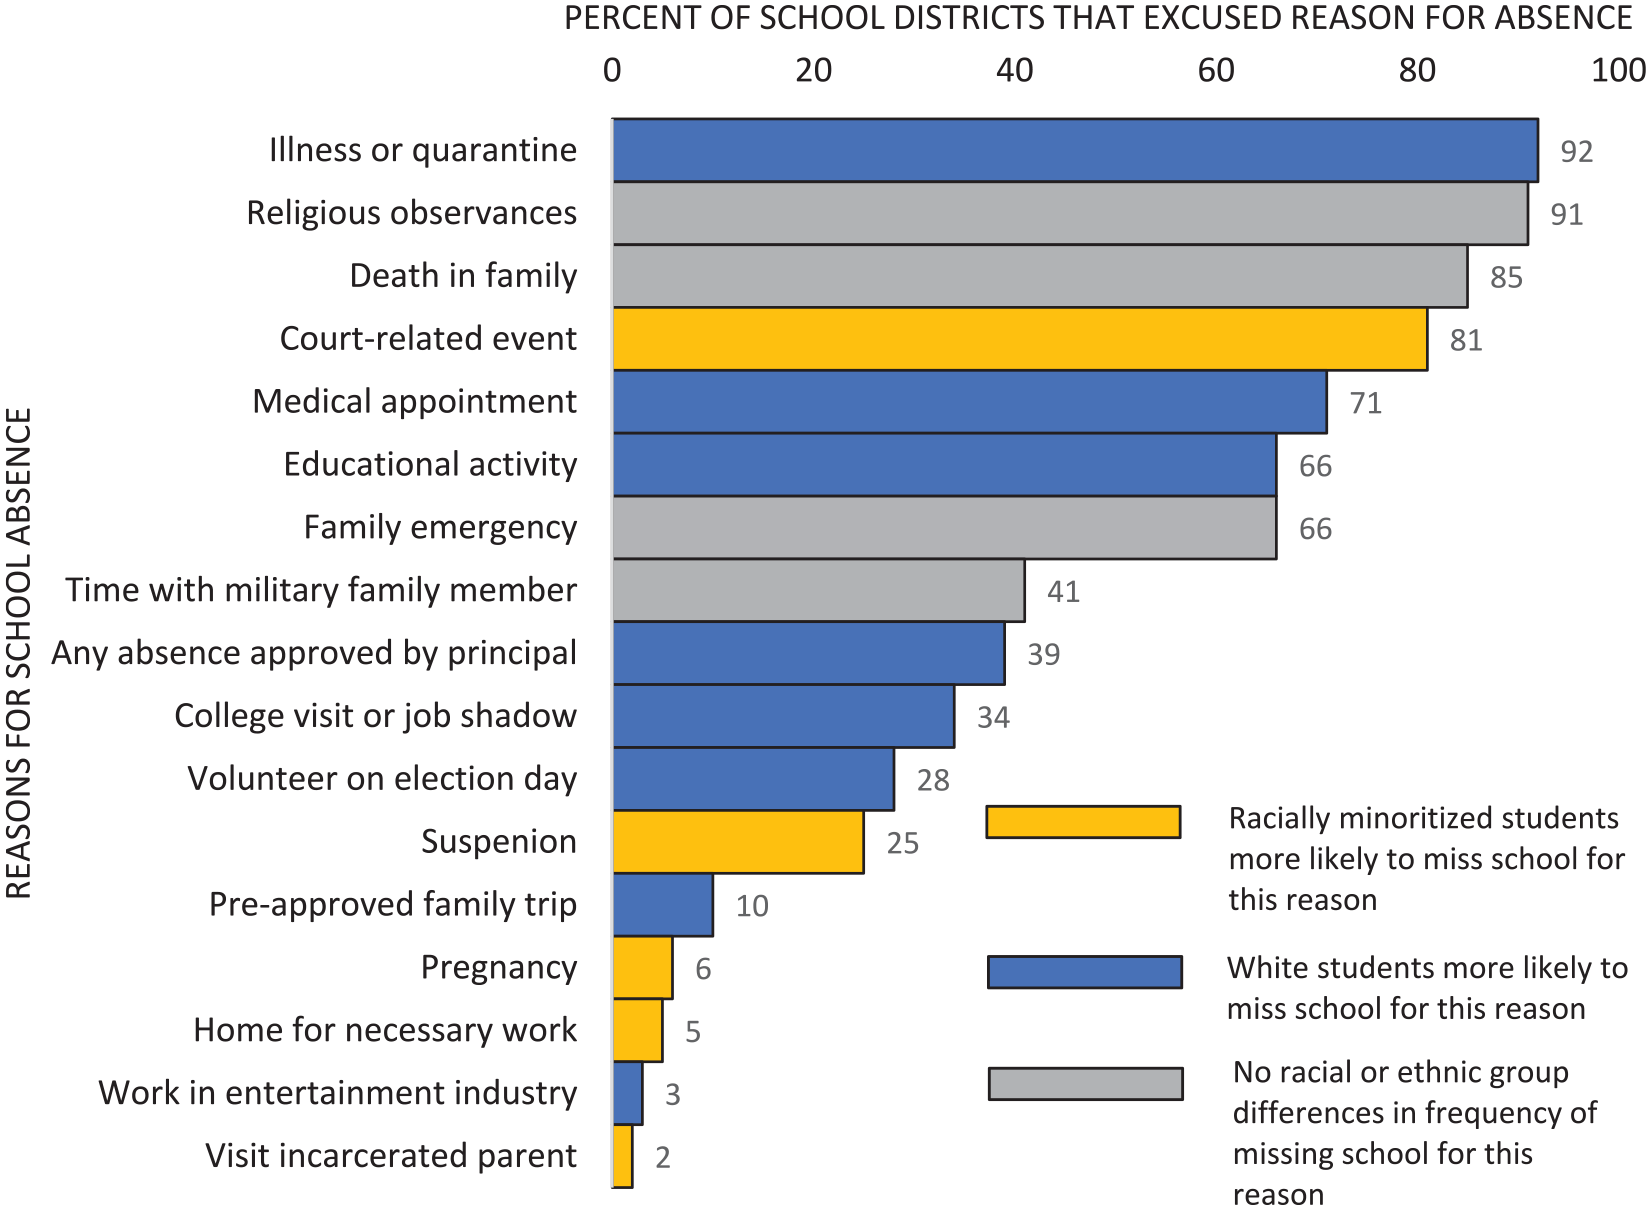
Definitions of excused absences in 97 randomly selected U.S. school districts with between 7,000 and 40,000 students.
We further categorized the 17 codes for excused absence reasons into three predetermined code groups: (1) reasons we expected to be given with equal frequency by all racial and ethnic groups, (2) reasons we expected to be given most often by White students, and (3) reasons we expected would be given most often by American Indian, Black, Hispanic, and Hmong American students. We focused on Hmong American students because the Asian students in the second study component were primarily Hmong American, whose backgrounds and educational experiences are distinct from those of other Asian groups (Her, 2014). Our decisions regarding this classification were guided by prior research (Council on Foreign Relations, 2020; Ehrlich et al., 2014; Henry, 2007; Kearney, 2008; Ngo & Lor, 2013; Pew Charitable Trusts, 2010). For example, the racial and ethnic composition of enlisted U.S. military forces old enough to have children in grades 7 to 10 is representative of the overall U.S. population (Council on Foreign Relations, 2020). Consequently, we coded absence to visit a military parent in the first code group. In contrast, because racially minoritized students are much more likely than White students to have an incarcerated parent (Pew Charitable Trusts, 2010), visiting an incarcerated parent, when excused, was coded in the third code group.
The same coding process was completed separately for unexcused absences, resulting in nine reasons for unexcused absences. The entire data extraction and coding process was done independently by the first and fourth authors for all 97 schools, with few between-coder discrepancies (<3%). Every discrepancy was due to one of the coders failing to see a reason for absence in the district policy text. Together, the first and fourth authors reviewed and corrected all the discrepancies.
Study Component 2: Event History Analysis
Data
The event history analysis involved 7th- to 10th-grade students who attended three public school districts in a Midwestern metropolitan county between 2006 and 2015. This study grew out of a program evaluation (McNeely et al., 2019; Lee et al., 2020), which determined the district selection. One district was urban, one contained first-ring suburbs, and one contained second-ring suburbs. Unexcused absenteeism data for the 2006 and 2007 academic years were missing for the second-ring suburban district, making that district’s follow-up period 2 years shorter.
Nearly half (48%) of the students in the sample were eligible for free lunch, compared with 43% nationally; 19% had an individual educational plan, compared with 15% nationally; and 17% identified as Black, compared with 16% nationally (NCES, 2020a). These average characteristics masked considerable diversity, however. The three districts varied in size from 8,000 to 38,000 students and ranged from 6% to 34% Asian, 5% to 28% Black, 5% to 13% Hispanic, and 20% to 80% White. In all three districts, American Indian students constituted less than 2% of the student body. Due to data-sharing agreements, we do not report district-specific characteristics.
The absenteeism policies in the three districts were typical of those from the nationally representative sample of 97 school districts. One district excused absences only for illness, extreme family emergencies (death or fire), and religious observances. The other two districts also excused absences for prearranged vacations, suspensions, visiting a parent in the military, school activities, and death of a close friend.
All three districts participated in the same court diversion program, which was structured like many U.S. court diversion programs. Students could be petitioned to court only through the court diversion program. In brief, the program consisted of a group parent meeting with a county attorney after five unexcused absences, a legal hearing to develop an attendance contract after five more unexcused absences, and, finally, a petition to juvenile court after five more unexcused absences. Students could not skip steps and advanced to the subsequent step only when they had accumulated five more unexcused absences. Because students referred to the program stayed in it until they graduated or left the county, the number of unexcused absences making them eligible for the next step in the court diversion program was accumulated across years.
School staff were not required to refer all eligible students to the court diversion program. Between 2006 and 2015, school staff referred 18.6% of 7th- to 10th-grade students with five or more unexcused absences to the court diversion program, and 17.0% of these students were subsequently petitioned to juvenile court. Both the proportion of eligible students referred to the diversion program and the proportion subsequently petitioned to court were similar across the three districts.
We obtained longitudinal administrative data on the students from four sources. Education data came from the state’s department of education. Data on juvenile court petitions for unexcused absenteeism were provided by the county attorney’s office, and longitudinal data on child welfare involvement were provided by the state’s department of human services. Daily absenteeism data (containing the date of each absence and whether it was excused or unexcused) were provided by the school districts. All data were linked and de-identified by staff of the Minnesota Linking Information for Kids Project. Students who transferred to other schools within the three districts were maintained in the data set. We created a person-year data set containing all the years a student attended school in the three districts. This data set consisted of 179,237 person-years from 75,276 individual 7th- to 10th-grade students.
Measures
Petition to juvenile court for unexcused absenteeism
We measured students’ first petition to juvenile court for unexcused absenteeism as a time-varying indicator of whether the student received their first juvenile court petition in the academic year.
School absenteeism
We defined three types of absenteeism: excused, unexcused, and total. From the school districts’ daily attendance data, we calculated the total number of full-day excused absences and full-day unexcused absences in each year for each student. For districts that reported absences by periods within days, we applied the schools’ definitions of the number of periods absent that constituted a full-day absence. Because court diversion program involvement did not reduce excused or unexcused absenteeism (McNeely et al., 2019), we did not distinguish whether the absences occurred before or after program referral. We summed full-day excused and unexcused absences to calculate the total number of days absent in the school year. We summed absences across schools if a student transferred to other schools within the three districts during the school year.
We categorized each type of absenteeism into four levels: 0 to 14 days absent, 15 to 24 days absent, 25 to 40 days absent, and 40+ days absent. The cutoff point of 15 absences was chosen because students with 15 or more unexcused absences were eligible to be petitioned to court. Because eligibility for court petition accumulated across years, students with fewer than 15 unexcused absences in the current year still could be eligible to be petitioned to court if they had 15 or more unexcused absences in the prior year. Therefore, we divided students with 0 to 14 unexcused absences in the current year into two groups: (1) students who had 15 or more unexcused absences in the prior year (and therefore were eligible to be petitioned to court in the current year) and (2) those who had fewer than 15 unexcused days absent in the prior year (and therefore were unlikely to be eligible to be petitioned to court in the current year).
For descriptive purposes, we used average daily attendance, a measure provided by the state department of education that is used for mandated reporting. Average daily attendance is defined as the number of days the student attended school divided by the number of instructional days enrolled. Average daily attendance was not used by the schools to determine eligibility for or progression through the court diversion program.
Race and ethnicity
Students’ race and ethnicity were provided by the state department of education using the categories defined by the U.S. Department of Education (2008): American Indian or Alaskan Native; Asian or Pacific Islander; Hispanic; Black, not of Hispanic origin; and White, not of Hispanic origin. We refer to the American Indian or Alaskan Native category as “American Indian” because very few Alaskan Natives lived in the state. In all other cases, we used the U.S. Department of Education’s terminology.
Race and ethnicity data were collected by parent report or self-identification for all students except the American Indian students. In each district, the procedure for identifying American Indian students was determined by an American Indian education parent advisory committee in consultation with American Indian parents. By state law, the advisory committee could use the procedure used for all other students (parent report and self-identification), or they could use the criteria of being a member or a first- or second-degree descendant of an Indian band or tribe.
Analytic Strategy
For descriptive purposes, we calculated the mean value of time-varying measures for each student across the years they were in the data set. We estimated the probability of receiving a petition to juvenile court for unexcused absenteeism using nonparametric Kaplan-Meier survival analysis. We conducted multivariate analyses using Cox proportional hazards models with time-varying covariates. The first model contained indicator variables for race and ethnicity to identify any racial or ethnic disparities in the court petitions. The second model added the total number of days absent each year as a time-varying covariate to determine whether racial and ethnic disparities in the hazard of a court petition were simply due to the fact that some racial and ethnic groups had higher total absenteeism than others. The final model replaced the measure of total absences with time-varying measures of the number of excused and unexcused absences each year, as follows:

where h(t) is the hazard of petition to juvenile court for unexcused absenteeism and h0(t) is an unknown baseline hazard function. “Race” is a set of time-invariant indicator variables for American Indian, Asian, Black, and Hispanic, with White serving as the referent category. “Unexcused” and “Excused” are time-varying indicators of attendance levels, with 15 to 24 absences serving as the referent category. The exponentiated coefficients can be interpreted as hazard ratios (HRs), which are assumed to be constant across time. This assumption was evaluated by assessing for the presence of linear interactions between the covariates and time and by testing the null hypothesis of a zero slope in a generalized linear regression of scaled Schoenfeld residuals on time (Grambsch & Therneau, 1994; Schoenfeld, 1982). Finally, models with alternative measures of excused and unexcused absenteeism were estimated to assess the finding’s stability.
By state law, no student could be petitioned to juvenile court for unexcused absenteeism before age 12 years because courts treated unexcused absenteeism at this age as parental neglect. Therefore, we started the risk period for a court petition when the student first appeared in the data set after starting seventh grade. The 69 students who had a court petition for unexcused absenteeism before the first year of observation (2006) were excluded from the sample. Students were right-censored after their first truancy petition, at the end of 10th grade, or if they permanently left the sample. Students were reentered into the risk pool if they left the sampled districts, returned before 10th grade, and had not been petitioned to court within the county during the gap period. All the analyses were adjusted for the complex sampling design using the svy commands in Stata 15/MP (StataCorp, 2017).
The purpose of this study was to determine the extent to which, after accounting for the total number of absences, racial and ethnic disparities in court petitions for unexcused absenteeism were explained by a single factor—the balance of excused and unexcused absences. When race or ethnicity is the focal independent variable, including the typical set of confounders used in educational studies (e.g., reduced and free lunch status, language status, academic achievement, and school fixed effects) biases estimates of the total association between race or ethnicity and court petition because these variables lie on the causal pathway between race or ethnicity and court petition (Aneshensel, 2004; Hernán et al., 2002). Students’ race and ethnicity shape their residential location, economic well-being, and resource access (Massey & Denton, 1993), variables that in turn affect the reasons they miss school and therefore their probability of being assigned unexcused absences and petitioned to juvenile court. Because our goal was to assess the total association between race or ethnicity and juvenile court petitions, and the extent to which disparities in unexcused absenteeism explained that association, we did not include additional individual or school characteristics in the models.
Instead, we attempted to reduce bias by identifying and addressing the most likely threats to internal validity, as recommended by Shadish et al. (2002). Our estimate of racial and ethnic disparities in juvenile court petitions for unexcused absenteeism could be biased by demographic compositional effects if districts with greater proportions of racially minoritized students petitioned students to court at higher rates than districts with predominantly White student bodies. This situation could happen if the districts with more racially minoritized students did one or more of the following: (1) increased the pool of eligible students relative to the other districts by defining a greater proportion of absences as unexcused, (2) referred a greater proportion of eligible students to the court diversion program, or (3) court petitioned a greater proportion of referred students. As noted above, the last two conditions did not hold. There were no across-district differences in mean referral rates to the court diversion program or in the rates of court petition after diversion program referral. However, the district with the most racially minoritized students also was the district with the strictest attendance policy, and students in that school had, on average, a higher proportion of their absences defined as unexcused than students in the other two districts.
We took two steps to ensure that demographic compositional effects did not bias the findings. First, we created probability weights that forced the same racial and ethnic distribution within each school district. Specifically, we assigned to each district the overall racial and ethnic composition of all schools participating in the court diversion program. Separate weights were developed for each racial and ethnic group in each district. In the majority-White districts, the White students were down-weighted, and the Black, Hispanic, and Asian students were up-weighted. The weights for the American Indian students remained close to 1 in all the districts. Second, we conducted separate analyses for the two majority-White districts to verify that the pattern of findings was not confounded by the fact that fewer students were eligible for juvenile court petition in these districts.
Results
Study Component 1: Policy Content Analysis
Definitions of Excused Absences
All 97 districts explicitly listed the reasons for excusing absences (Figure 1). Almost all the districts excused absences for illness or quarantine (92%), religious observances (91%), a death in the immediate family (85%), and court-ordered events or court appearances (81%). Most districts allowed students to miss up to 4 days per year for religious observances and 1 day for a death in the family, unless travel was required, in which case 3 days were allowed.
Two thirds (66%) of the school districts excused absences for family emergencies, with the decision regarding what counts as an emergency left to the principal or their representative. A significant minority (39%) allowed principals full discretion for determining whether absences were excused, as long as their decision was in accordance with state education laws. The districts that granted principals discretion for classifying absences tended to list fewer reasons for excused absences. This occurrence accounts for why illness/quarantine and religious observances were not explicitly excused in all school districts, even though such absences were required by law to be excused.
School districts were less likely to excuse absences due to life circumstances that were more likely to be experienced by racially minoritized students. One in nine Black children (11.4%), one in 28 Hispanic children (3.5%), and one in 57 White children (1.8%) have an incarcerated parent (Pew Charitable Trusts, 2010). Yet 98% of the districts did not excuse absences to visit incarcerated parents. Similarly, American Indian, Black, and Hispanic students are disproportionately suspended from school (Bradshaw et al., 2010; Skiba et al., 2011), which only 25% of districts in the nationally representative sample excused. In the county of study for the quantitative analysis, Black students were more than 4 times more likely to be suspended than White students (Riddle & Sinclair, 2019), and all three districts defined suspensions as unexcused absences. Moreover, even though American Indian and Hmong funeral ceremonies often require more than 1 day of absence, only 1 day was excused (Allis, 2016; Lor, 2019).
In some cases, an excused absence was defined in a way that privileged White students, even when racially minoritized students were more likely to miss school for that reason. For example, while racially minoritized students miss more school due to illness than White students (Ehrlich et al., 2014), they are less likely than White students to receive medical care for illness (Agency for Healthcare Research and Quality, n.d.). All school districts that excused absences for illness required students to produce illness verification from a medical provider after a certain number of consecutive absences due to illness, typically 3 days (range 0–10; mode = 3.0, M = 3.6, and SD = 2.6).
Definitions of Unexcused Absences
All 97 districts defined unexcused absences as absences for any not excused reason or for an excused reason if a valid excuse (e.g., a parental note) was not provided. Just over half (n = 52) of the districts provided examples of reasons for unexcused absences in their parent-student handbook or in guidance for attendance monitors. Following the same coding process used for excused absenteeism, we identified nine categories of unexcused absences (Table 1). Six of the nine categories, taken at face value, do not indicate disengagement or willful delinquency on the student’s part. These include not having a medical provider note for an illness, lack of clothing, being needed at home, family trips, parental neglect, and transportation issues. Several of these reasons, particularly those related to the logistical challenges of poverty (e.g., lack of clothing, medical care, or transportation), also may be involuntary on the parent’s or guardian’s part. The remaining three categories of explicitly defined unexcused absenteeism—personal business, tardiness and truancy, and unapproved employment—contained a mix of behaviors traditionally considered delinquent (e.g., ditching, willful truancy, and tanning appointment), those traditionally considered developmental milestones (e.g., getting a driver’s license and senior-picture appointments), and those driven by poverty (e.g., unapproved employment).
Reasons for Unexcused Absences Listed in Parent-Student or Staff Handbooks From a Nationally Representative Sample of 97 U.S. School Districts With Between 7,000 and 40,000 Students.
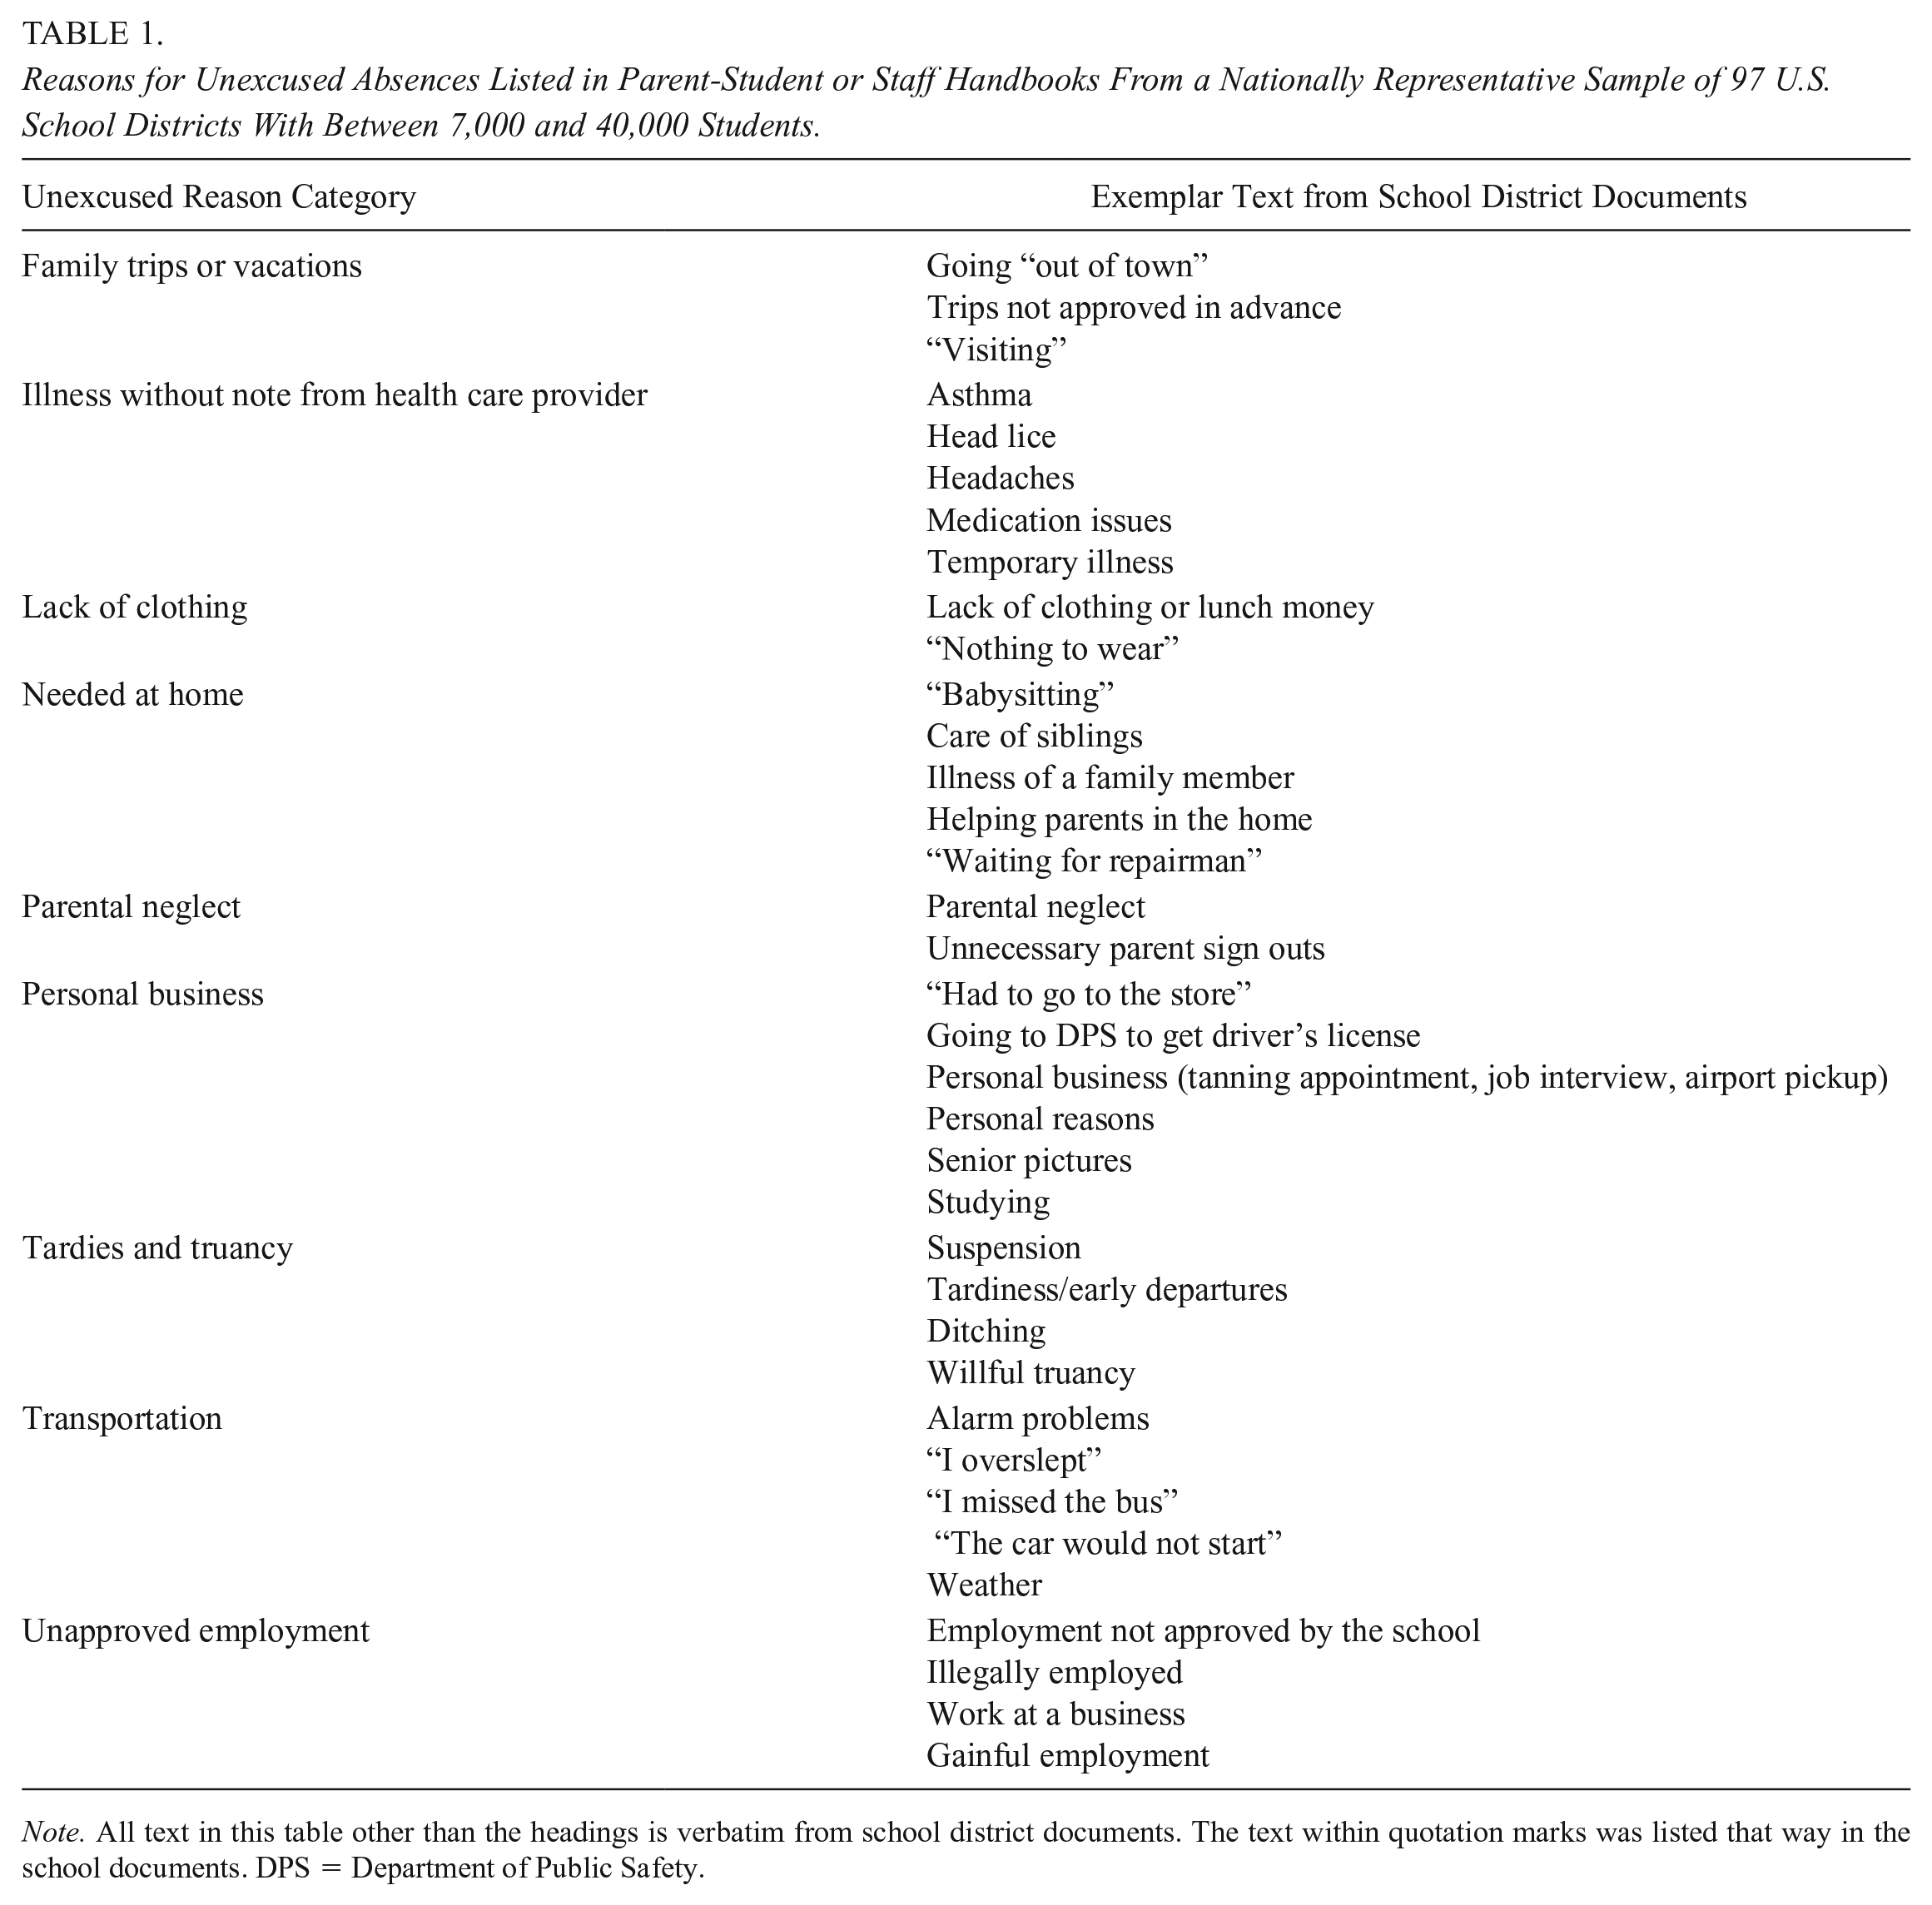
Note. All text in this table other than the headings is verbatim from school district documents. The text within quotation marks was listed that way in the school documents. DPS = Department of Public Safety.
In several districts, unexcused absence reasons were placed in quotation marks: “I missed the bus,” “The car would not start,” “Going out of town,” and “Had to go to the store.” Such use of quotations has been called sneer quotes (Pinker, 2014), as doing so when not required implies that the response is considered deceitful.
Study Component 2: Event History Analysis
Descriptive statistics are presented in Table 2. In the study sample, American Indian students had the lowest average daily attendance rate (86%), followed by Black students (90%), Hispanic students (91%), White students (93%), and Asian students (95%). On average, 24% of American Indian and Black student absences were defined as unexcused, compared with 21% for Hispanic students, 18% for Asian students, and 13% for White students. By the end of 10th grade, 16% of American Indian students, 8% of Black students, 6% of Hispanic students, and 3% of Asian and White students had been petitioned to juvenile court for unexcused absenteeism.
Weighted Descriptive Characteristics of Students by Race and Ethnicity (Unweighted n = 75,276)

Tukey post hoc tests were conducted only if one-way analysis-of-variance F tests were statistically significant at p < .05. Pairwise differences are reported if p < .05.
Estimated using Kaplan-Meier survival analysis.
Racial and ethnic disparities in the proportion of absences designated unexcused occurred at every level of total absenteeism (Figure 2). Among the group of students with fewer than 15 absences in a year, on average White students had 11% of their absences coded as unexcused, compared with 16% for Asian and American Indian students, 17% for Hispanic students, and 18% for Black students. Among students with 15 to 24 absences each year, White students had 18% of their absences coded as unexcused, compared with 30% for Asian students, 33% for Hispanic students, 36% for American Indian students, and 38% for Black students. This pattern also held for students with even greater numbers of absences.

Weighted proportion of total unexcused absences by race/ethnicity (179,237 person-years).
We used Cox proportional hazards models to test the hypothesis that racial and ethnic disparities in the proportion of absences defined as unexcused accounted for disparities in juvenile court petitions. Model 1 (Table 3) included indicator variables for race and ethnicity. Compared with White students, American Indian students were 5.5 times more likely (95% confidence interval [CI; 4.39, 6.94], Black students were 2.6 times more likely (95% CI [2.24, 3.01]), and Hispanic students were 1.9 times more likely (95% CI [1.59, 2.27]) to be petitioned to court. In contrast, Asian students received court petitions at the same rate as White students (HR = 0.97, 95% CI [0.83, 1.15]). Even after accounting for total absenteeism, substantial racial and ethnic group differences in the risk of court petition for unexcused absenteeism remained (Model 2). Compared with White students, American Indian students still were 3.9 times more likely to be petitioned to court (95% CI [3.12, 4.97]), and Black and Hispanic students were 2.2 (95% CI [1.88, 2.50]) and 1.6 (95% CI [1.34, 1.92]) times more likely, respectively.
Weighted Hazard Ratios of Truancy Petitions to Juvenile Court in Grades 7 to 10 (Unweighted n = 75,276 Students)

Note. CI = confidence interval; df = degrees of freedom.
Model 3 (Table 3) tests the proposition that racial and ethnic disparities in petitions to juvenile court result from racially minoritized students having a higher proportion of their absences defined as unexcused, conditional on the total number of absences. To test this hypothesis, we included categorical measures of the number of excused and unexcused absences, which were entered into the model separately. The correlation between excused and unexcused absences was .26 (p < .001), and we found no evidence of multicollinearity in the model containing both absenteeism measures (Allison, 2014).
Relative to White students, the HRs for Black and Hispanic students were not significantly different from 1. American Indian students, however, still were 1.9 times as likely as White students to be petitioned to juvenile court (95% CI [1.54, 2.37]). Asian students were 19% less likely than White students to be petitioned to court (95% CI [0.69, 0.94]).
In Model 3, we disaggregated students with 0 to 14 absences into those who still could be eligible for court petition based on prior-year absenteeism and those unlikely to be eligible. As expected, students with consistently low levels of unexcused absenteeism were rarely petitioned to court compared with students with 15 to 24 unexcused absences (HR = 0.06, 95% CI [0.07, 0.11]). As the number of unexcused absences increased, so did the likelihood of being petitioned to court. After controlling for the number of excused absences, students with 40 or more unexcused absences were 8.2 times more likely to be petitioned to court than students with 15 to 24 unexcused absences (95% CI [6.69, 10.09]).
We repeated the analyses for the subset of the two majority-White school districts that excused more reasons for absences than the urban, majority-minority school (Table 4). The pattern of findings for these two districts was similar to that for the full sample, suggesting that the results are not biased by demographic compositional effects.
Weighted Hazard Ratios of Truancy Petitions to Juvenile Court in Grades 7 to 10 in the Suburban, Majority-White Districts (Unweighted n = 24,537 Students)
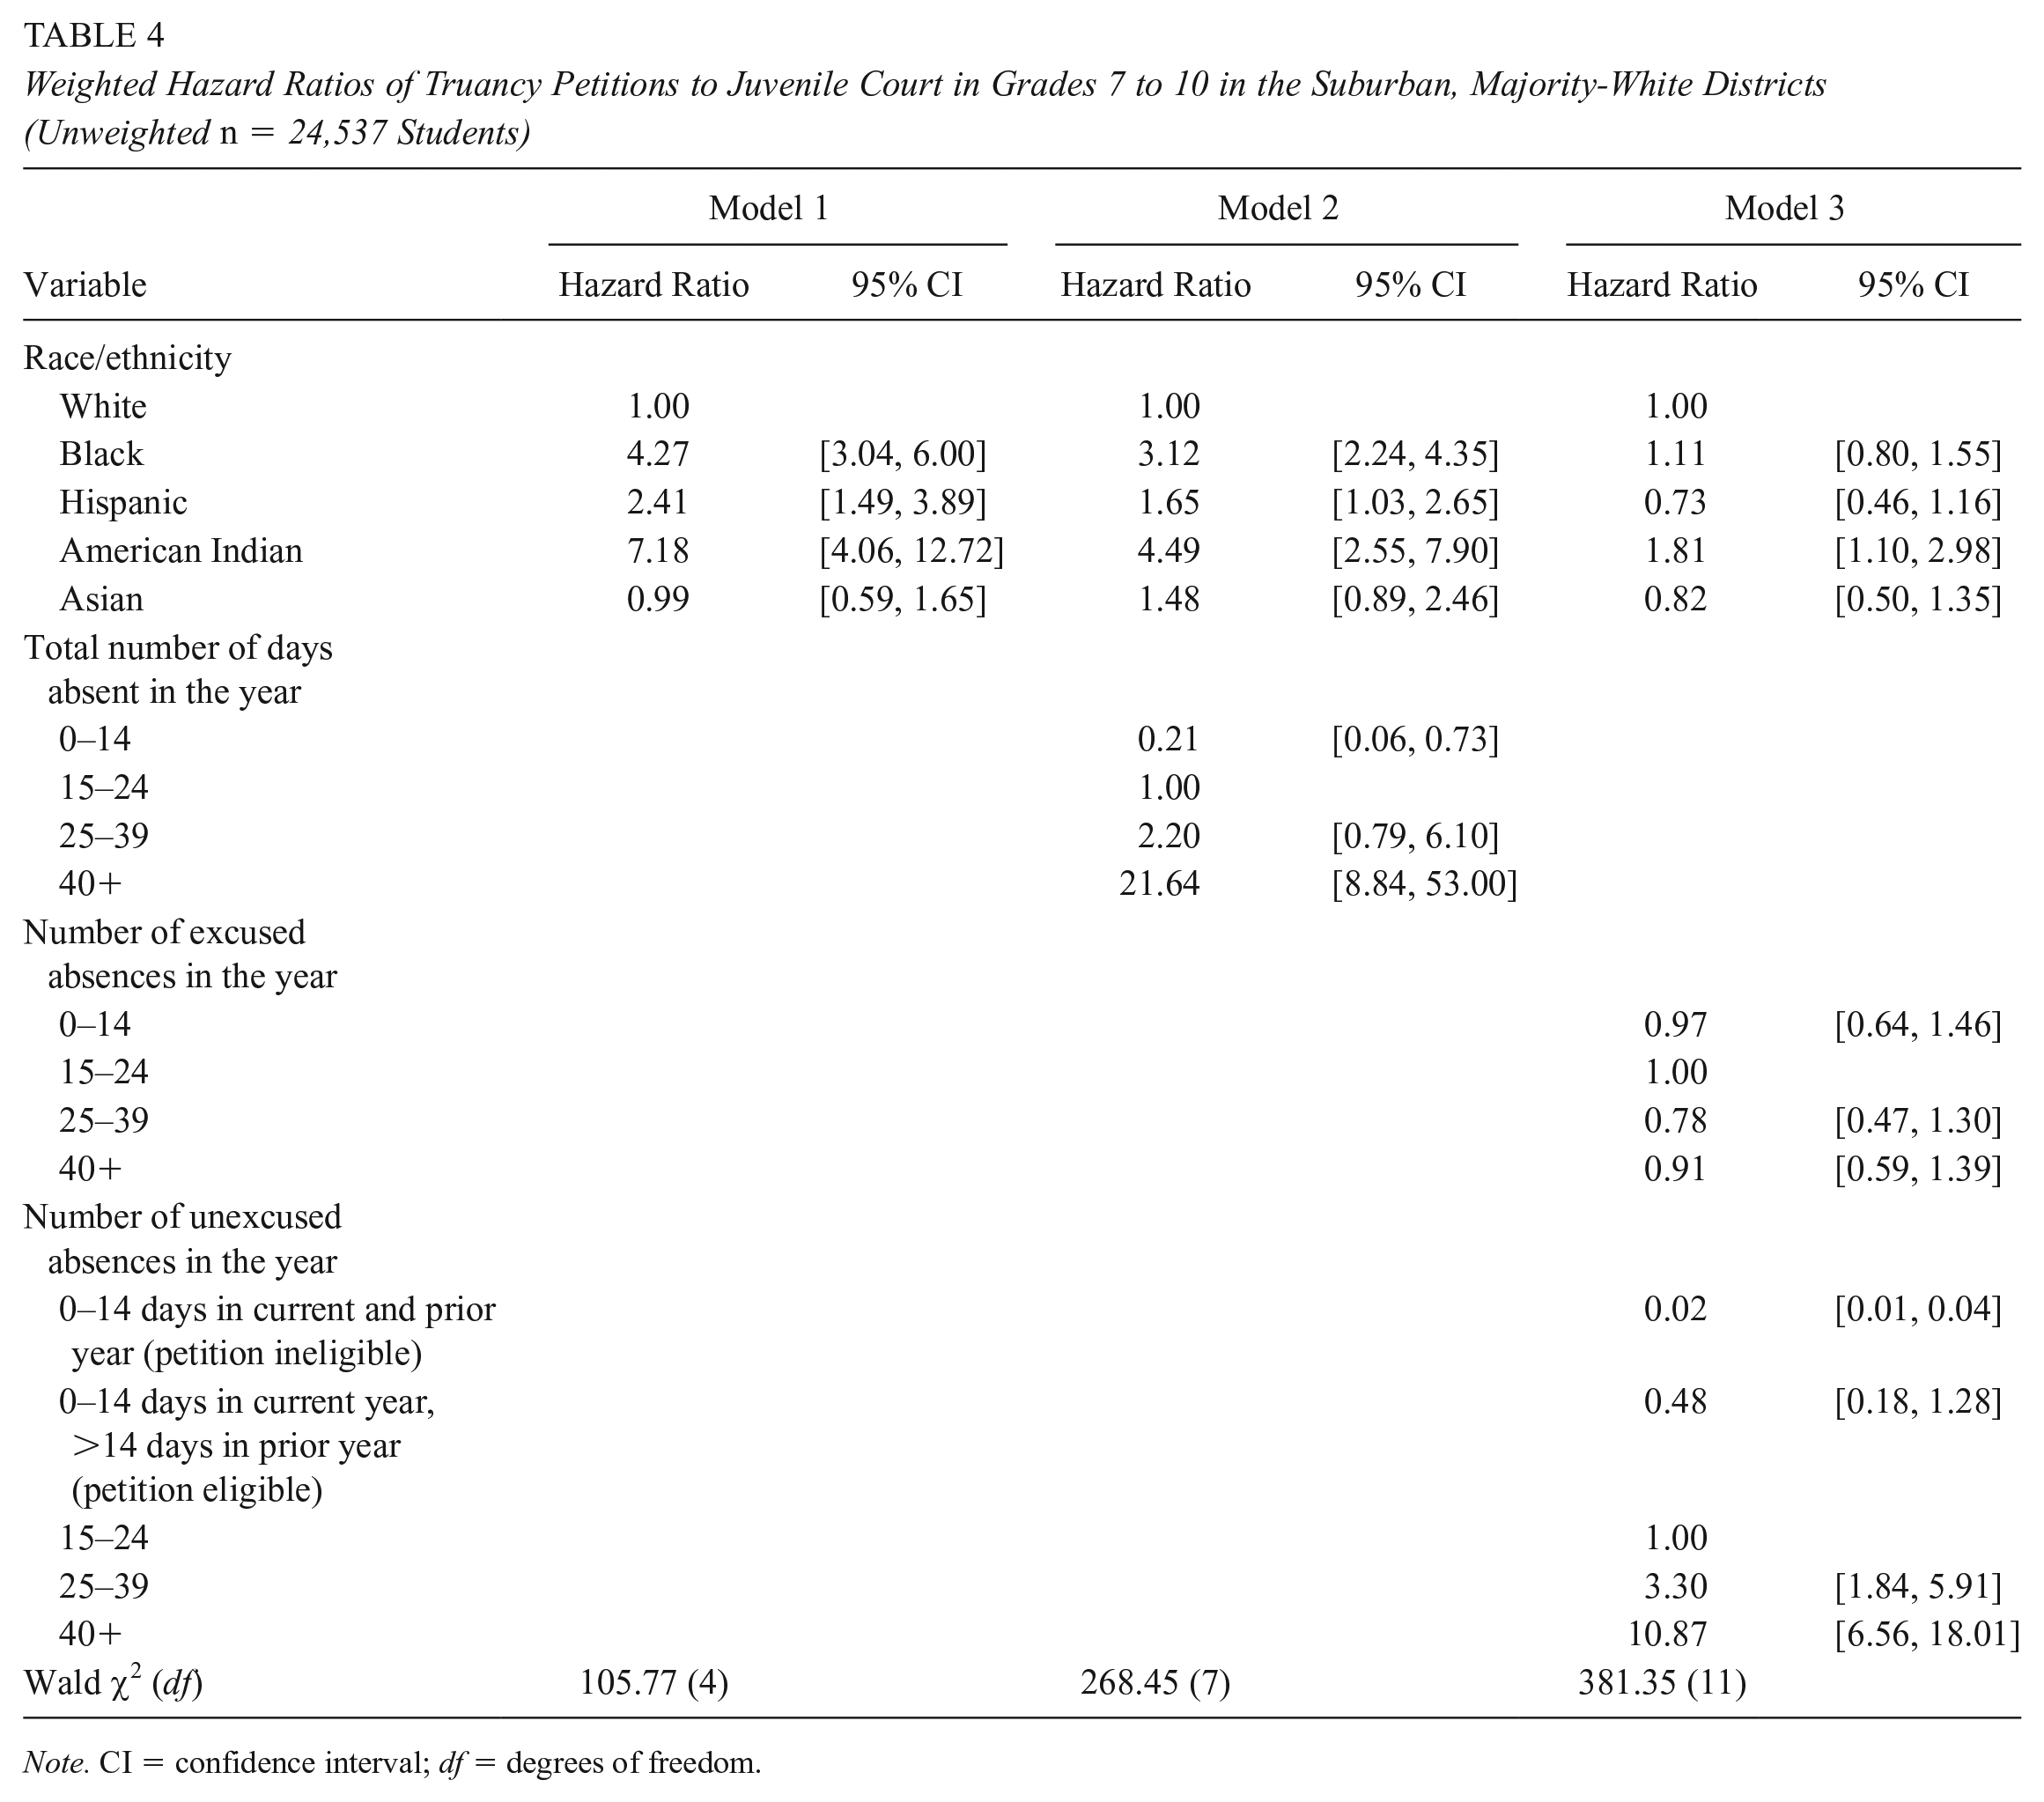
Note. CI = confidence interval; df = degrees of freedom.
Finally, we conducted tests to determine the extent to which the findings remained stable under different absenteeism specifications (Table 5). In the models that explicitly included the number of unexcused absences (Models 1 and 2), the racial and ethnic disparities in court petitions were accounted for more fully. This is logical given that the number of unexcused days is the single criterion for court petitions. The Black/White court petition disparity was not fully explained by any of the four alternative specifications. Models 3 and 4 also did not fully explain the Hispanic/White court petition disproportionality, and in contrast to Table 3, these models showed no disproportionality between Whites and Asians in court petition hazard by the end of 10th grade.
Weighted Hazard Ratios of Truancy Petitions to Juvenile Court in Grades 7 to 10 (Unweighted n = 75,276), Estimated With Alternative Measures of Excused, Unexcused, and Total Absenteeism
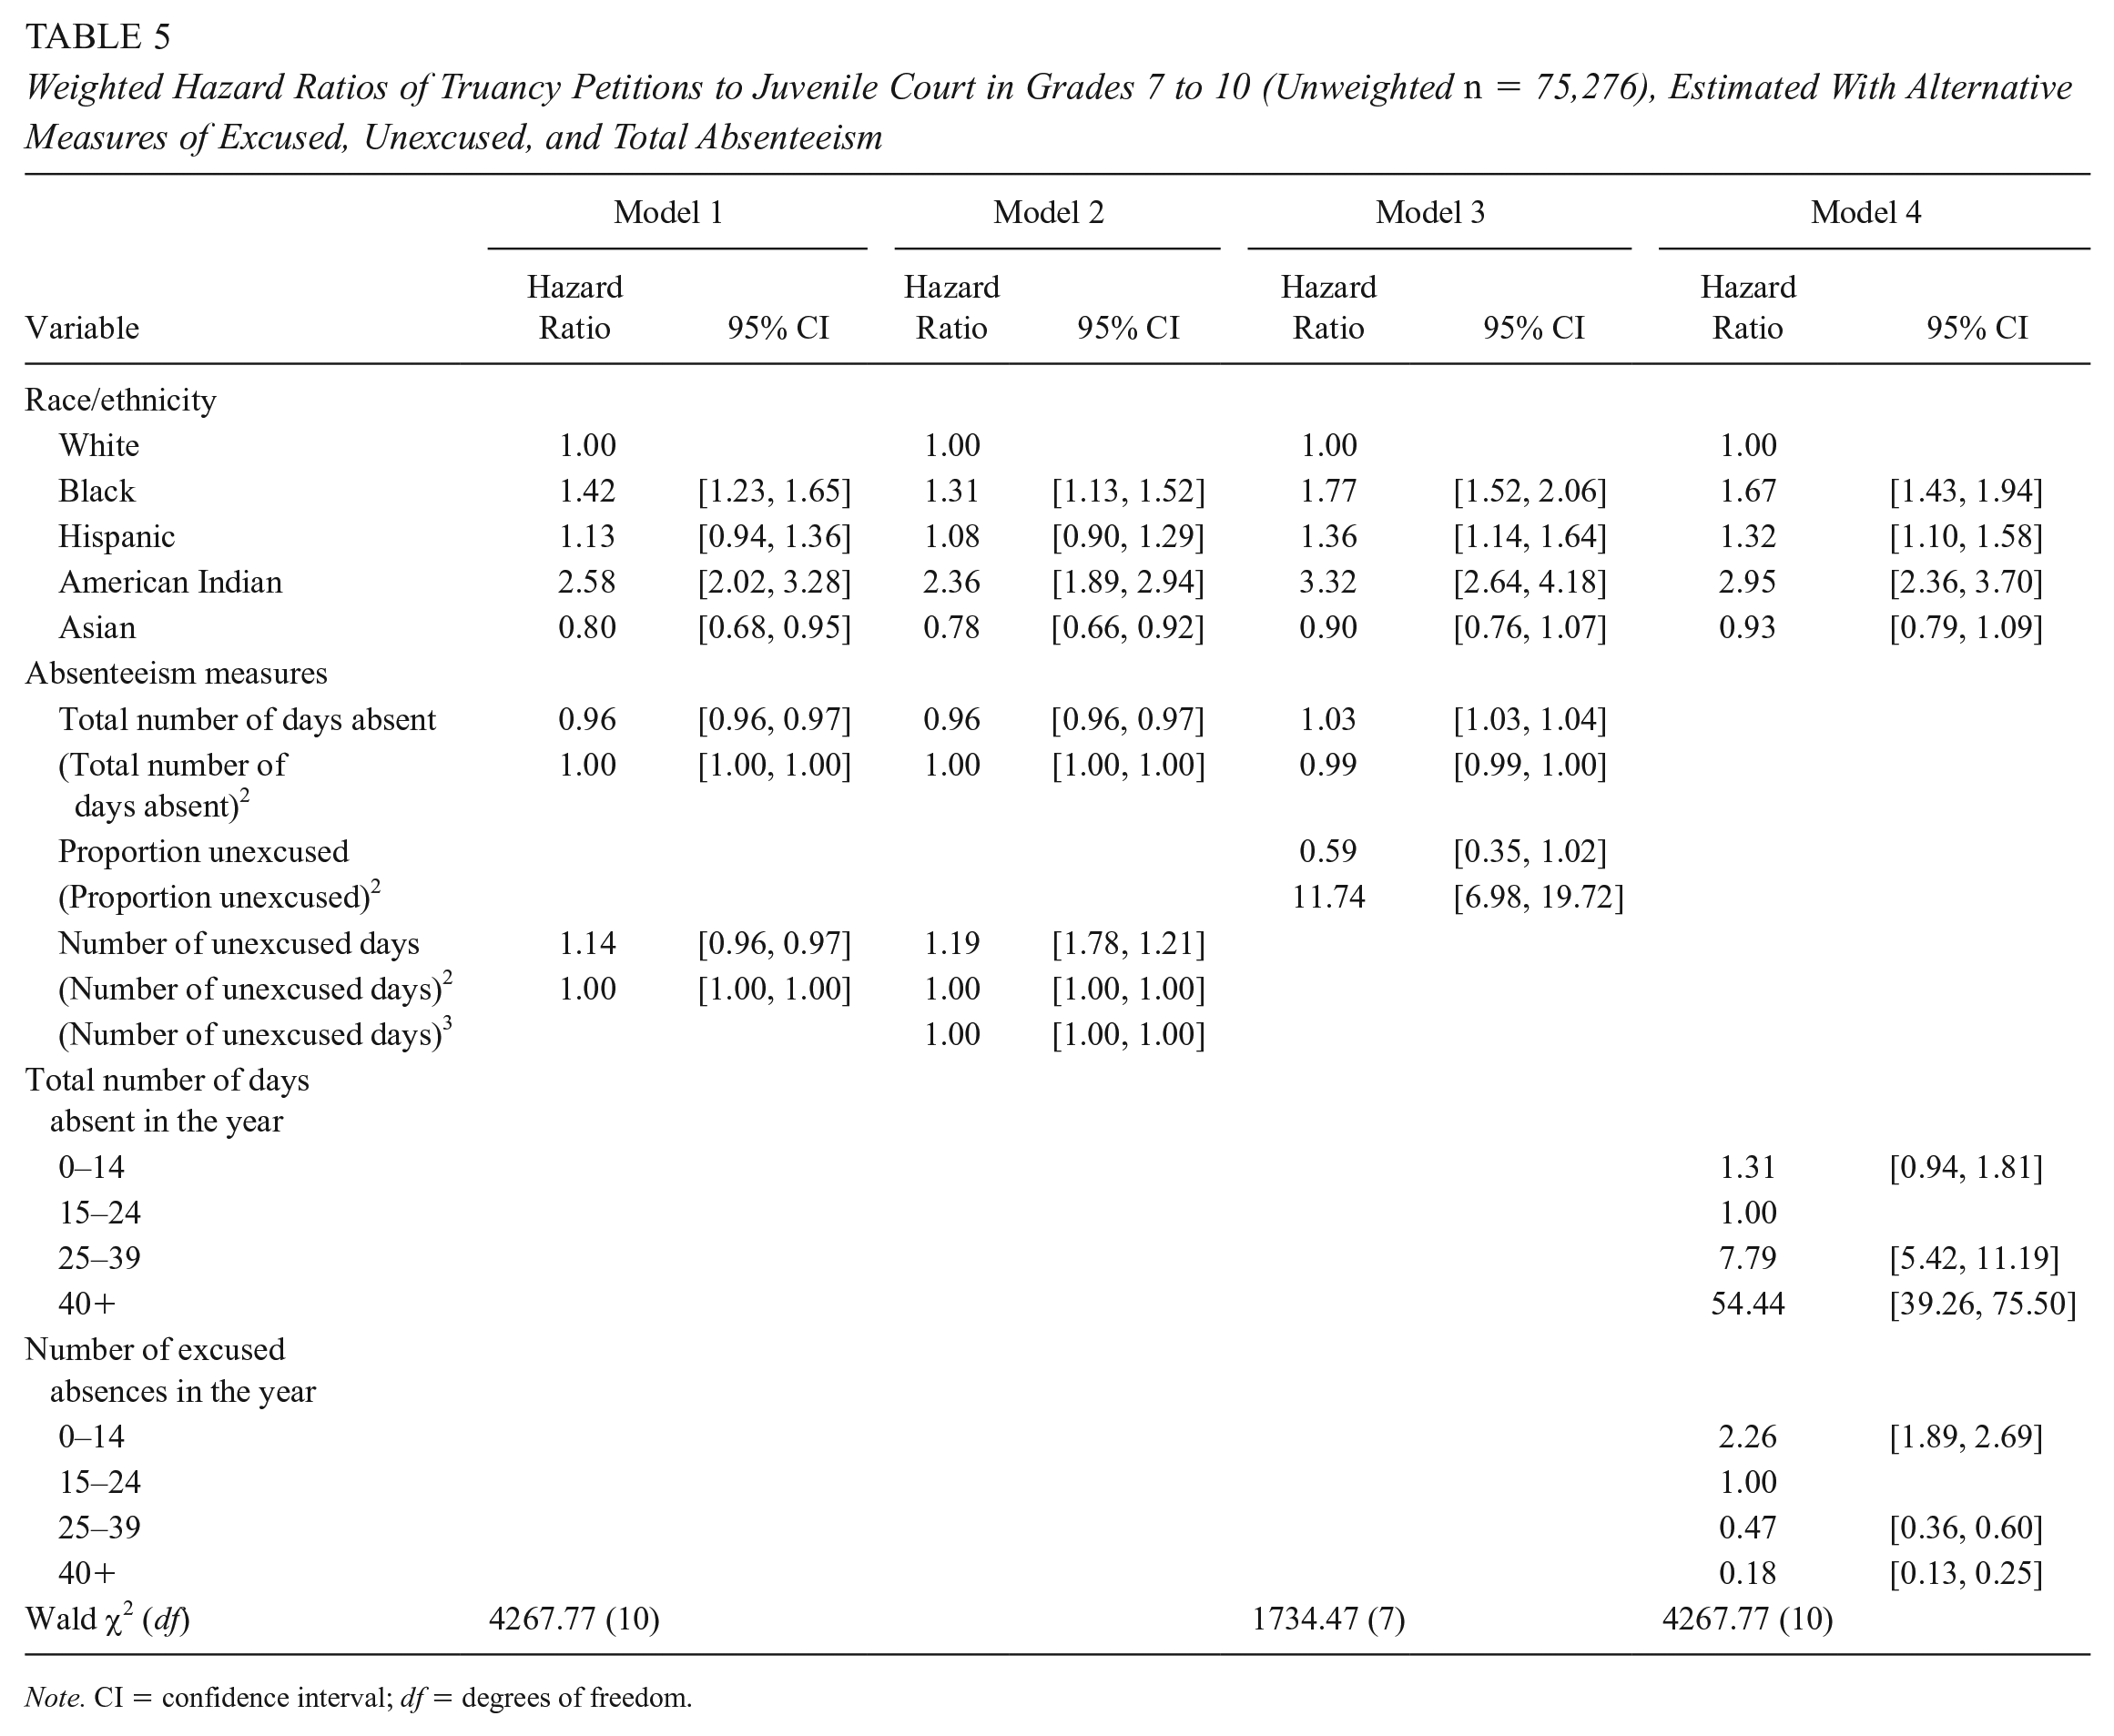
Note. CI = confidence interval; df = degrees of freedom.
Discussion
In this study, we explored the hypothesis that color-blind definitions of unexcused absenteeism perpetuate racial and ethnic inequities in court petitions for school absenteeism. Our conceptual model contained two logical steps: (1) Color-blind definitions of excused and unexcused absences cause racial and ethnic disparities in the proportion of absences designated unexcused, and (2) these disparities, in turn, lead to racial and ethnic disparities in juvenile court petitions for unexcused absenteeism. Due to the paucity of data, we could not directly test this two-step mechanism. Instead, we documented the plausibility of each step in the conceptual model using distinct data and methods for each step. Nonetheless, this is the first study to describe and provide preliminary evidence for the process by which day-to-day attendance policies may create racial and ethnic inequities in juvenile court petitions.
Color-blind absenteeism definitions are grounded in mental frames emphasizing individual merit, personal responsibility, and equal opportunity, often thought of as core American values (Bonilla-Silva, 2006). In a nationally representative sample of 97 mid-sized school districts, we documented how school absences are excused for reasons deemed responsible or meritorious: medical appointments, illness verified by a medical provider, extracurricular activities, time spent with a parent in the military, and prearranged family trips. Absences not fitting into these categories are deemed irresponsible and hence are unexcused, even though they may have merit or be responsible choices if seen through a different lens. Absences due to poverty (no note from a medical provider when ill or no alternative transportation after missing the bus), prioritizing family care over self (sibling and elder care), and the disproportionate policing of racially minoritized people (school suspensions or visiting an incarcerated parent) were unexcused in most districts. These policies logically would result in racial and ethnic disparities in the proportion of absences unexcused, because racially minoritized students are more likely to experience poverty, be needed to support their family, and be policed (Lor, 2019; Pew Charitable Trusts, 2010; Skiba et al., 2011).
In a sample of three metropolitan school districts, the proportion of absences designated unexcused varied dramatically by race and ethnicity, as predicted by critical race theory and the policy content analysis. American Indian and Black students were nearly twice as likely to have their school absences defined as unexcused compared with White students, even after controlling for aggregate absenteeism levels. Hispanic and Asian students were approximately 50% more likely than White students to have their school absences designated unexcused.
There were also substantial racial and ethnic group differences in the risk of court petition for unexcused absenteeism. After controlling for aggregate absenteeism, American Indian students were nearly four times more likely than Whites to be petitioned to court for unexcused absenteeism, Black students were approximately twice as likely, and Hispanic students were 50% more likely. Across all groups, the racial or ethnic disparity in the proportion of absences designated unexcused accounted for approximately half of the racial or ethnic disparity in juvenile court petitions for unexcused absenteeism. The general size and direction of the findings were consistent across multiple approaches to measuring absenteeism.
These findings suggest that multiple factors contribute to racial and ethnic disparities in court petitions for unexcused absenteeism and that these factors operate differently across groups. Other possible causes of disparities in court petitions include implicit staff bias (Holt & Gershenson, 2019; Ispa-Landa, 2018) and school-level biases (e.g., the consistent enactment of more punitive discipline in majority-minority schools; Welch, 2018).
The size of the court petition disparity for American Indian students compared with White students (7% vs. 1%) clearly indicates that American Indian youth are uniquely targeted for justice system discipline. Disproportionality in unexcused absenteeism accounted for just half of this disparity in juvenile court petitions. American Indian families also are disproportionately reported for child abuse and neglect (Kim & Drake, 2019; Lawler et al., 2012). Additionally, early involvement in the courts through the child welfare system is associated with later involvement in the juvenile justice system, including for unexcused absenteeism (Goodkind et al., 2020). The legacy of educational coercion of American Indians also has resulted in distrust of public schools, which limits parent-staff communication and reinforces stereotypical staff assumptions about why American Indian students miss school (Bryk & Schneider, 2002). The size of the disparity in justice-based discipline for American Indian students makes it urgent to understand the full range of the mechanisms at play.
The Asian students in this sample were predominantly Hmong American. In contrast to American Indian students, we found that Asian students were petitioned to juvenile court for unexcused absenteeism less than or at the same rate as White students, even though Asian students’ absences were more likely to be coded as unexcused (18% vs. 13% for White students). Although the Hmong American students in this sample had the highest average daily attendance rates of any group, the reasons Hmong American students miss school are more likely to fall into the unexcused category: working long hours to financially contribute to the family, participating in multiday funerals and ceremonies, caring for siblings, and interpreting for parents (Lor, 2019; Ngo & Lor, 2013). In qualitative research, Hmong students reported that teachers do not provide supports to help them overcome these barriers to education, instead expecting them to conform to the commonly held “model minority” bias that Asian students are harder working, smarter, and “better behaved” than other racially minoritized groups (Ng et al., 2007; Ngo & Lor, 2013). These assumptions about Hmong students may have led school staff to determine that they did not need court assistance to improve their attendance.
Future research is needed to directly test the full theoretical mechanism of how color-blind policies produce juvenile justice inequities. A long-term goal along these lines is to encourage states to compile and share data on excused and unexcused absences. Until further research is completed, it would be premature to conclude that the distinction between excused and unexcused absenteeism should be abolished in favor of using aggregate absenteeism measures (i.e., chronic absenteeism). Advocates (e.g., Attendance Works, 2016) argue for nonpunitive, prevention-focused interventions, such as brief parent interventions grounded in behavioral theories (Kraft & Rogers, 2015; Lasky-Fink et al., 2019; Robinson et al., 2018; Rogers & Feller, 2018), schoolwide strategies focused on improving school climate or school engagement (MacIver & Sheldon, 2019), and targeted mentoring of students with high absenteeism levels (Sinclair et al., 2005).
All of these nonpunitive interventions modestly increased attendance in settings that simultaneously applied justice-based approaches to unexcused absenteeism. It is not known what would happen to absenteeism rates if all punitive responses were abolished and only nonpunitive approaches were used. While Anderson (2020) found that disallowing suspensions for unexcused absenteeism did not affect attendance rates, other punitive responses to absenteeism remained in place in the study site. In 2015, after Texas barred jailing youth for unexcused absenteeism except in extreme cases, court filings for truancy declined by 90% (Texas Office of Court Administration, 2016) without concomitant attendance declines. However, the same law also increased other punitive measures, such as parental fines. Two papers using econometric techniques found that compulsory education laws explained just 5% of the large increases in secondary school attendance that occurred in the first half of the 20th century (Goldin & Katz, 2011; Stephens & Yang, 2014). However, compulsory education laws were largely unenforced during this period.
Although evidence regarding abolishing compulsory education approaches does not yet exist, immediate changes can be made to make unexcused absenteeism policies more equitable. For example, visits to incarcerated parents should be excused absences, as they support family functioning in exactly the same way as visits with military parents and can be objectively documented. Additionally, American Indian, Hmong American, and other students who have multiple-day mourning periods after a death should not be penalized by policies excusing only 1 day for a death in the family. Similarly, the definition of death in the immediate family should be expanded to include all essential caregivers, regardless of whether they are a member of the student’s nuclear family.
Two other incremental changes in unexcused absenteeism policies merit investigation. Some school districts in our nationally representative sample allowed students a certain number of unexcused absences without providing an explanation and then defined all absences thereafter as unexcused unless allowed by the school principal. To our knowledge, this approach has not been evaluated. Another potential policy reform is to change the current frame of meritorious (excused) and unmeritorious (unexcused) absences to involuntary and voluntary absences (Birioukov, 2016; Driver & Watson, 1989). In this framework, involuntary absences are due to circumstances not under either parent or student control (e.g., illness without a medical provider note or difficulty accessing safe transportation). The clear dichotomy of voluntary and involuntary absence breaks down when students are absent because they feel unsafe or excluded at school. Consequently, organizing a discipline system using these concepts also might have equity challenges. However, considering the pros and cons of another framework helps shed light on the deeply held, unquestioned frames that guide current color-blind policies and perpetuate White privilege in education.
Finally, research is needed on how school staff negotiate absenteeism policies to minimize racial and ethnic disparities in disciplinary responses. The decision to intervene in unexcused absenteeism is largely discretionary at the school level (Conry & Richards, 2018). If an effective means for staff to minimize the negative effects of color-blind attendance policies could be better understood, harm could be reduced while alternative policy approaches are being tested.
Footnotes
Authors
CLEA A. McNEELY is a research professor at the University of Tennessee, Knoxville. She studies how schools affect adolescent health, with a particular focus on health disparities.
BESUFEKAD ALEMU studies labor economics and education at the University of Minnesota.
WON FY LEE is a research analyst at Stanford University. His research is focused on understanding the impact of various types of education and school choice on student outcomes.
ISIS WEST is a graduate research assistant in the Department of Public Health at the University of Tennessee, Knoxville. She is studying epidemiology and has an interest in reducing health disparities.