
Abstract
This article reviews research on the achievement outcomes of elementary mathematics programs; 87 rigorous experimental studies evaluated 66 programs in grades K–5. Programs were organized in six categories. Particularly positive outcomes were found for tutoring programs (effect size [ES] = +0.20, k = 22). Positive outcomes were also seen in studies focused on professional development for classroom organization and management (e.g., cooperative learning; ES = +0.19, k = 7). Professional development approaches focused on helping teachers gain in understanding of mathematics content and pedagogy had little impact on student achievement. Professional development intended to help in the adoption of new curricula had a small but significant impact for traditional (nondigital) curricula (ES = +0.12, k = 7), but not for digital curricula. Traditional and digital curricula with limited professional development, as well as benchmark assessment programs, found few positive effects.
Keywords
In recent years, there has been an increasing emphasis on the identification and dissemination of programs proven in rigorous experiments. This emphasis has been clear in federal funding for education research, especially at the Institute for Educational Sciences (IES), Education Innovation Research (EIR), and the National Science Foundation (NSF). The establishment of the What Works Clearinghouse (WWC) has helped establish standards of evidence and has disseminated information on the evidence base for educational programs. In England, the Education Endowment Foundation has similarly supported rigorous research in education. In 2015, the Every Student Succeeds Act defined, for the first time, criteria for the effectiveness of educational programs. Every Student Succeeds Act (ESSA) places particular emphasis on three top levels of evidence: strong (statistically significant positive effects in at least one randomized experiment), moderate (statistically significant positive effects in at least one quasi-experiment), and promising (statistically significant positive effects in at least one correlational study). ESSA encourages use of programs meeting these criteria, and requires schools seeking school improvement funding to adopt programs meeting one of these criteria.
One of the subjects most affected by the evidence movement in education is mathematics, because there is more rigorous research in mathematics than in any other subject except reading. The rapid expansion in numbers and quality of studies of educational programs has provided a far stronger basis for evidence-informed practice in mathematics than once existed.
The advances in research have been noted in reviews, cited later in this article. However, the great majority of reviews have focused only on particular approaches or subpopulations, using diverse review methods. This makes it difficult to compare alternative approaches on a consistent basis, to understand the relative impacts of different programs. The most recent meta-analyses to systematically review research on all types of approaches to mathematics instruction were a review of elementary mathematics programs by Slavin and Lake (2008) and one by Jacobse and Harskamp (2011). A meta-analysis of all secondary mathematics programs was published by Slavin et al. (2009).
The present article updates the Slavin and Lake (2008) review of elementary mathematics, incorporating all rigorous evaluations of programs intended to improve mathematics achievement in grades K–5. The review uses more rigorous selection criteria than would have been possible in 2008, and uses current methods for meta-analysis and meta-regression, to compare individual programs and categories of programs, as well as key mediators, on a consistent basis.
Need for This Review
Two reviews considering all elementary mathematics programs have been published since 2008. Slavin and Lake (2008) identified 87 qualifying studies of outcomes of elementary mathematics programs and concluded that mathematics programs that incorporate cooperative learning, classroom management, and tutoring had the most positive effects on mathematics achievement. Another review of experimental studies by Jacobse and Harskamp (2011) examined the impact of mathematics interventions in grades K–6 and identified 40 studies. The authors reported that small group or individual interventions had greater effects on mathematics achievement than did whole-class programs.
An important contribution of the present review is its focus on coherent categories of mathematics interventions. Most previous reviews of mathematics interventions have focused on variables rather than programs or categories of similar programs (e.g., Gersten et al., 2014; Lynch et al., 2019). Yet to inform practice in elementary mathematics, it is important to identify specific effective programs and categories of programs, because this is how educators and policymakers interested in evidence-based reform make choices (Morrison et al., 2019). For example, the 2015 ESSA defines program effectiveness, and the WWC (2020) is similarly focused on evaluating evidence for programs, not variables.
The importance of program categories stems from the importance of programs. A daunting problem in evidence-based reform in education is that few programs are supported by large numbers of rigorous studies. The vast majority of practical programs with any rigorous evidence of effectiveness at all have just one or two studies that would meet modern standards. If there are several similar programs that also find positive impacts in rigorous experiments, this may buttress the claims of effectiveness for all of them. On the contrary, if a given program shows positive impacts in a single rigorous experiment, but other equally rigorous studies of similar programs do not, this should cause educators and researchers to place less confidence in the one study’s findings.
In the present meta-analysis, we included all studies that met a stringent set of inclusion criteria, regardless of the type of program used. We then grouped the programs into six mutually exclusive categories. These are described in detail later in this article, but in brief, the categories are as follows:
Tutoring (e.g., one-to-one or one-to-small group instruction in mathematics)
Professional development (PD) focused on mathematics content and pedagogy (at least 2 days or 15 hours)
PD (at least 2 days or 15 hours) focused on classroom organization and management (e.g., cooperative learning in mathematics)
PD focused on implementation of traditional (nondigital) and digital curricula (at least 2 days or 15 hours)
Traditional and digital curricula with limited PD (less than 2 days or 15 hours)
Benchmark assessments
A major feature of the present review is its use of modern approaches to meta-analysis and meta-regression that enable researchers to control effects of programs, categories and variables for substantive and methodological factors, and to obtain meaningful estimates for key moderators (see Borenstein et al., 2009; Borenstein et al., 2017; Lipsey, 2019; Pigott & Polanin, 2020; Valentine et al., 2019).
Another important contribution of the present meta-analysis is its use of stringent inclusion standards, similar to those of the WWC (2020). For example, the review of research on elementary mathematics programs by Slavin and Lake (2008), mentioned earlier, required that studies use random assignment or quasi-experimental designs, excluded measures overaligned with the treatment, and required a minimum duration of 12 weeks and a minimum sample size of 30 students in each treatment group. This review found positive effects for PD approaches, such as cooperative learning, mastery learning, and classroom organization and management, which had a mean effect size (ES) of +0.33 (k = 36). Technology-focused programs had a mean ES of +0.19 (k = 38), and curriculum approaches (mostly textbooks) had a mean ES of +0.10 (k = 13). These ESs are in a range similar to those reported by WWC (2013) studies of K–12 mathematics. The Lynch et al. (2019) review used similar inclusion standards, and reported an overall impact on mathematics learning of +0.27. Yet other reviews of mathematics interventions find much larger overall impacts. This is due to their inclusion of studies with design features known to significantly inflate ESs. For example, the third meta-analysis to include all studies of elementary mathematics, Jacobse and Harskamp (2011), reported an average ES of +0.58, about twice the size of the Slavin and Lake (2008) and Lynch et al. (2019) mean ESs. They noted that the review studies using non-standardized measures obtained significantly larger ESs than those using standardized measures, yet they did not control for this difference, known from other research (e.g., Cheung & Slavin, 2016) to be a powerful methodological factor in achievement ESs.
In recent years, research has established the substantial inflationary bias in ES estimates introduced by certain research design elements. Particularly important sources of bias include small sample size, very brief duration, use of researchers rather than school staff to deliver experimental programs, and use of measures made by developers and researchers (Cheung & Slavin, 2016; de Boer et al., 2014; Wolf et al., 2020).
The problem is that despite convincing demonstrations of the biasing impact of these factors, most reviews of research do not exclude or control for studies that contain factors known to substantially and spuriously inflate ESs. As a result, meta-analyses often report ESs that are implausibly large. As a point of reference, a study by Torgerson et al. (2013) found an ES of +0.33, the highest for one-to-one tutoring in mathematics by certified teachers in the current review. How could studies of far less intensive treatments produce much larger effects than one-to-one tutoring?
As one example, a review of research on intelligent tutoring systems by Kulik and Fletcher (2016), mostly in mathematics, reported an implausible ES of +0.66. The review had a minimum duration requirement of only 30 minutes. The review reported substantial impacts of “local” (presumably researcher-made) vs. standardized measures, with means of +0.73 and +0.13, respectively. It reported ESs of +0.78 for sample sizes less than 80, and +0.30 for sample sizes over 250. Individual included studies with very low sample sizes reported remarkable (and implausible) ESs. A 50-minute study involving 48 students had an ES on local measures of +0.95. Another, with 30 students and a duration of one hour, found an ES of +0.78. A third, with 30 students and a duration of 80 minutes, reported an ES of +1.17. Yet in its overall conclusions, Kulik and Fletcher (2016) did not exclude or control for inclusion of very small or very brief studies or inclusion of “locally developed” measures and did not weight for sample size. In a separate analysis, the review reported on 15 mostly large, long-term studies of a secondary technology program called Cognitive Tutor, showing ESs of +0.86 on “locally developed” measures and +0.16 on standardized measures, but simply averaged these to report an ES of +0.45, an implausibly large impact. As a point of comparison, the WWC, which uses inclusion criteria similar to those used by Slavin and Lake (2008) and Lynch et al. (2019), accepted five studies of Cognitive Tutor Algebra I, which had a median ES of +0.08, and one of Cognitive Tutor Geometry with an ES of −0.19.
As another example, Lein et al. (2020), in a review of research on word problem solving interventions, reported mean ESs of +0.68 for researcher-made measures, compared with +0.09 for norm-referenced measures. They also reported a mean of +0.71 for interventions delivered by researchers, compared with +0.28 for those delivered by school staff. Yet the review did not control for these or other likely biasing factors and reported an implausible mean ES of +0.56.
In the present meta-analysis, we used inclusion criteria more stringent than those used by the WWC or by Slavin and Lake (2008) or Lynch et al. (2019), and substantially more stringent than those of the great majority of reviews of studies of mathematics programs. We excluded all measures made by developers or researchers, post hoc quasi-experiments, very small and very brief studies, and those in which researchers, rather than staff unaffiliated with the research taught the experimental program. We also weighted studies by their sample sizes (using inverse variance) in computing mean ESs. Then we statistically controlled for relevant methodological and substantive moderators. These methods are described later in this article.
The importance of these procedures should be clear. Whatever outcomes are reported for studies included in the present meta-analysis, readers should be able to be confident that these outcomes are due to the actual likely effectiveness of the interventions, not to methodological or substantive factors that are known to bias ES estimates from extensive prior research. Failing to exclude or control for these factors not only spuriously inflates reported ESs but it also confounds comparisons of ESs within reviews, as a program’s large ES could be due to use of study features known to inflate ESs in the studies evaluating it, rather than to any actual greater benefit for students.
The inclusion of studies with certain study features not only risks substantial inflation of mean ESs, but also may undermine the relevance of the study for practice. A study of 30 minutes’ duration, one that has a sample size of 14, one that uses researchers rather than school staff to deliver the intervention, or one that uses outcome measures created by developers or researchers, is of little value to teachers or students, because educators need information on what works over significant time periods, is implemented by school staff, and is evaluated using universally accepted assessments, not ones they themselves made up.
Method
Inclusion Criteria
The review used rigorous inclusion criteria designed to minimize bias and provide educators and researchers with reliable information on programs’ effectiveness. The inclusion criteria are similar to those of the WWC (2020), with a few exceptions noted below. A PRISMA (Preferred Reporting Items for Systematic Reviews and Meta-Analyses) flow chart (Figure 1) shows the numbers of studies initially found and the numbers winnowed out at each stage of the review. Inclusion criteria were as follows:
Studies had to evaluate student mathematics outcomes of programs intended to improve mathematics achievement in elementary schools, Grades K–5. Sixth graders were also included if they were in elementary schools. Students who qualified for special education services but attended mainstream mathematics classes were included.
Studies had to use experimental methods with random assignment to treatment and control conditions, or quasi-experimental (matched) methods in which treatment assignments were specified in advance. Studies that matched a control group to the treatment group after posttest outcomes were known (post hoc quasi-experiments or ex post facto designs) were not included.
Studies had to compare experimental groups using a given program to control groups using an alternative program already in place, or “business-as-usual.”
Studies of evaluated programs had to be delivered by school staff unaffiliated with the research, not by the program developers, researchers, or their graduate students. This is particularly important for relevance to practice.
Studies had to provide pretest data. If the pretest differences between experimental and control groups were greater than 25% of a standard deviation, the study was excluded. Pretest equivalence had to be acceptable both initially and based on pretests for the final sample, after attrition. Studies with differential attrition between experimental and control groups of more than 15% were excluded.
Studies’ dependent measures had to be quantitative measures of mathematics performance.
Assessments made by program developers or researchers were excluded. The WWC (2020) excludes “overaligned” measures, but not measures made by developers or researchers. The rationale for this exclusion in the current review is that studies have shown that developer/researcher-made measures overstate program outcomes, with about twice the ESs of independent measures on average, even within the same studies (Cheung & Slavin, 2016; de Boer et al., 2014; Gersten et al., 2009; Kulik & Fletcher, 2016; Lein et al. 2020; Lynch et al., 2019; Nelson & McMaster, 2019). Results from developer- or researcher-made measures may be valuable to researchers or theorists, and there are situations in which independent measures do not exist. However, such findings should only be supplemental information, not reported as outcomes of the practical impact of treatments.
Studies had to have a minimum duration of 12 weeks, to establish that effective programs could be replicated over extended periods. Also, very brief studies have been found to inflate ESs (e.g., Gersten et al., 2014; Kulik & Fletcher, 2016; Nelson & McMaster, 2019).
Studies could have taken place in the United States or in similar countries: Europe, Israel, Australia, or New Zealand. However, the report had to be available in English. In practice, all qualifying studies took place in the United States, the United Kingdom, Canada, the Netherlands, and Germany.
Studies had to have been carried out from 1990 through 2020, but for technology a start date of 2000 was used, due to the significant advances in technology since that date.

PRISMA (Preferred Reporting Items for Systematic Reviews and Meta-Analyses) flow diagram of study search and review process.
Literature Search and Selection Procedures
A broad literature search was carried out in an attempt to locate every study that might meet the inclusion requirements. Then studies were screened to determine whether they were eligible for review using a multistep process that included (a) an electronic database search, (b) a hand search of key peer-reviewed journals, (c) an ancestral search of recent meta-analyses, (d) a Web-based search of education research sites and educational publishers’ sites, and (e) a final review of citations found in relevant documents retrieved from the first search wave.
First, electronic searches were conducted in educational databases (JSTOR, ERIC, EBSCO, PsycINFO, ProQuest Dissertations & Theses Global) using different combinations of key words (e.g., “elementary students,” “mathematics,” “achievement,” “effectiveness,” “RCT,” “QED”). We also reviewed studies accepted by the WWC, and searched in recent tables of contents of eight key mathematics and general educational journals from 2013 to 2020: American Educational Research Journal, Educational Research Review, Elementary School Journal, Journal of Educational Psychology, Journal of Research on Educational Effectiveness, Journal for Research in Mathematics Education, Learning and Instruction, and Review of Educational Research. We investigated citations from previous reviews of elementary mathematics programs (e.g., Dietrichson et al., 2017; Gersten et al., 2014; Jacobse & Harskamp, 2011; Kulik & Fletcher, 2016; Li & Ma, 2010; Lynch et al., 2019; Nelson & McMaster, 2019; Savelsbergh et al., 2016).
We were particularly careful to be sure we found unpublished as well as published studies, because of the known effects of publication bias in research reviews (Cheung & Slavin, 2016; Chow & Ekholm, 2018; Polanin et al., 2016). Finally, we reviewed citations of documents retrieved from the first wave to search for any other studies of interest.
A first screen of each study was carried out by examining the title and abstract using inclusion criteria. Studies that could not be eliminated in the screening phase were located and the full text was read by one of the authors of the current study. We further examined the studies that were believed to meet the inclusion criteria and those where inclusion was possible but not clear. All of these studies were examined by a second author to determine whether they met the inclusion criteria. When the two authors were in disagreement, the inclusion or exclusion of the study was discussed with a third author until consensus was reached.
Initial searching identified 18,646 potential studies. After removing 4,157 duplicate records, these search strategies yielded 14,489 studies for screening. The screening phase eliminated 13,366 studies, leaving 1,123 full-text articles to be assessed for eligibility. Of these full-text articles that were reviewed, 1,039 studies did not meet the inclusion criteria, leaving 84 contributions included in this review, with two studies including multiple interventions, for a total number of 87 studies (see Figure 1).
Coding
Studies that met the inclusion criteria were coded by one of the authors of the review. Then codes were verified by another author. As for the inclusion of the studies, disagreements were discussed with a third author until consensus was reached.
Data coded included program components, publication status, year of publication, study design, study duration, sample size, grade level, participant characteristics, outcome measures, and ESs.
We also identified variables that could possibly moderate the effects in the review distinguishing between substantive factors and methodological factors. Substantive factors are related to the intervention and the population characteristics. The factors coded were grade level (K–2 vs. 3–6), student achievement levels (low achievers vs. average/high achievers), socioeconomic status (low SES vs. moderate/high SES), and study locations in the United States. versus other countries. Methodological factors included research design (quasi-experiments vs. randomized studies). For tutoring programs we also coded the group size (one-to-one vs. one-to-small group) and the type of provider (teacher, teaching assistant, paid volunteer, or unpaid volunteer). The coded data are available on GitHub (Pellegrini et al., 2021).
Effect Size Calculations and Statistical Procedures
ESs were computed as the mean difference between the posttest scores for individual students in the experimental and control groups after adjustment for pretests and other covariates, divided by the unadjusted standard deviation of the control group’s posttest scores. Procedures described by Lipsey and Wilson (2001) were used to estimate ESs when unadjusted standard deviations were not available.
Statistical significance is reported for each study using procedures from the WWC (2020). If assignment to the treatment and control groups was at the individual student level, statistical significance was determined by using analysis of covariance, controlling for pretests and other factors. If assignment to the treatment and control groups was at the cluster level (e.g., classes or schools), statistical significance was determined by using multilevel modeling such as hierarchical linear modeling (Raudenbush & Bryk, 2002). Studies with cluster assignments that did not use hierarchical linear modeling or other multilevel modeling but used student-level analysis were re-analyzed to estimate significance with a formula provided by the WWC (2020) to account for clusters.
Mean ESs across studies were calculated after assigning each study a weight based on inverse variance (Lipsey & Wilson, 2001), with adjustments for clustered designs suggested by Hedges (2007). In combining across studies and in moderator analysis, we used random-effects models, as recommended by Borenstein et al. (2009).
Meta-Regression
We used a multivariate meta-regression model with robust variance estimation (RVE) to conduct the meta-analysis (Hedges et al., 2010). This approach has several advantages. First, our data included multiple ESs per study, and RVE accounts for this dependence without requiring knowledge of the covariance structure (Hedges et al., 2010). Second, this approach allows for moderators to be added to the meta-regression model and calculates the statistical significance of each moderator in explaining variation in the ESs (Hedges et al., 2010). Tipton (2015) expanded this approach by adding a small-sample correction that prevents inflated Type I errors when the number of studies included in the meta-analysis is small or when the covariates are imbalanced. We estimated three meta-regression models. First, we estimated a null model to produce the average ES without adjusting for any covariates. Second, we estimated a meta-regression model with the identified moderators of interest and covariates. Third, we estimated an exploratory meta-regression model which added tutoring provider as a moderator. Due to the small sample size, this model is considered exploratory and results of statistical tests such as p values are not reported. All moderators and covariates were grand-mean centered to facilitate interpretation of the intercept. All reported mean ESs come from this meta-regression model, which adjusts for potential moderators and covariates. The packages metafor (Viechtbauer, 2010) and clubSandwich (Pustejovsky, 2020) were used to estimate all random-effects models with RVE in the R statistical software (R Core Team, 2020).
Categories of Mathematics Programs
Studies that met the inclusion criteria were divided into categories according to the main and most distinctive components of the programs. Category assignments were based on independent readings of articles and websites by the authors. All authors read all accepted studies, and if there were disagreements about categorizations they were debated and determined by consensus among all authors. The categories and their theoretical rationales were as follows.
Tutoring. Tutoring refers to one-to-one or one-to-small group instruction intended to help students struggling in mathematics. The theoretical base for tutoring draws on research in reading, which has long made extensive use of one-to-one and small group tutoring (see, e.g., Elbaum et al., 2000; Gersten et al., 2020; Slavin et al., 2011; Wanzek et al., 2016) as well as in mathematics (e.g., Fuchs, Schumacher, et al., 2013; Fuchs, Schumacher, et al., 2016; Jacobse & Harskamp, 2011; Nelson & McMaster, 2019). Tutoring may involve one teacher or one teaching assistant (paraprofessional) with one student, or one teacher or teaching assistant with a very small group of students, usually from two to six at a time.
There are several ways in which tutoring is likely to improve student mathematics outcomes. First, tutoring (especially one-to-one) permits tutors to substantially adapt their instruction to the needs of the student(s). Tutoring programs in mathematics generally provide well-structured, sequential materials for students, but tutors are trained to explain and demonstrate concepts for students who are struggling with it. Tutors are trained to start with struggling students where they are and move them forward rapidly. They are able to explain and model mathematical concepts and processes, observe how students are working, and give them personalized feedback and encouragement. Tutors can enable students to work in small steps, experiencing success at each step. Furthermore, tutors are likely to be able to build close personal relationships with tutored student(s), giving them attention and praise that many students crave, and enhancing their motivation as students seek to please a valued adult. Previous reviews of research on elementary mathematics approaches have found that tutoring is among the most effective of all interventions for students struggling in mathematics (e.g., Jacobse & Harskamp, 2011; Slavin & Lake, 2008).
2. PD Focused on Mathematics Content and Pedagogy. Interventions in this category provide intensive content-focused PD intended to advance teachers’ understanding of current standards-based content and effective pedagogy (teaching methods). To be included in this category, PD had to be provided for at least 2 days or 15 hours. This category of strategies emphasizes giving teachers knowledge about mathematics content and about ways of explaining it (Desimone, 2009; Desimone & Garet, 2015; Kennedy, 2014; Penuel et al., 2011). Ideally, such approaches emphasize mathematics content, active learning, coherence, sustained duration, and collective participation to help teachers learn and apply to their teaching new understandings of mathematics content and mathematics-specific pedagogy (Desimone, 2009; Desimone & Garet, 2015; Kennedy, 2014; Penuel et al., 2011). Almost all of these PD programs (as well as those in Categories 3, 4, and 5) provided some degree of on-site coaching to follow up after initial training. Coaching has been found to be an effective component of PD in mathematics (Kraft et al., 2018).
3. PD Focused on Classroom Organization and Management. This mathematics-specific category includes programs that provide teachers with PD and materials to help them implement innovations in classroom organization and management, such as cooperative learning (e.g., Slavin, 2017) and classwide behavior approaches (e.g., Weis et al., 2015). This category had the highest ES (ES = +0.33, k = 36) of any category in the Slavin and Lake (2008) meta-analysis. Previous research on cooperative learning has shown positive effects on mathematics and other subjects (e.g., Rohrbeck et al., 2003; Webb, 2008).
4. PD Focused on Implementation of Traditional and Digital Curricula. Interventions in this category provide teachers with moderate to extensive PD (at least 2 days or 15 hours, combining training and follow-up coaching) to support informed, thoughtful implementation of innovative traditional (i.e., non-digital) or digital curricula for students. There were two subcategories: (a) PD Focused on Implementation of Traditional Curricula, with minimal use of technology and (b) PD Focused on Implementation of Digital Curricula, such as computer-assisted instruction.
5. Traditional and Digital Curricula With Limited PD includes two subcategories: (a) Traditional (i.e., nondigital) curricula (textbooks with associated teaching materials) and (b) Digital curricula for students. Limited PD (less than 2 days or 15 hours) was provided in such strategies.
6. Benchmark Assessments consist of tests given periodically (three to five times a year) to find out how students are proceeding toward success on state standards. The rationale is to give teachers and school leaders early information on student performance so they can make changes well before state testing (e.g., Konstantopoulos et al., 2016).
Results
A total of 87 studies evaluating 66 programs met the inclusion standards of this review. The studies included were of high methodological quality: 74 (85%) of the studies were randomized trials and 13 (15%) were quasi-experimental studies. Also, 75 (86%) of the studies were reported in 2010 or later, indicating the extraordinary pace at which rigorous studies of elementary mathematics are appearing. Only four of the studies included in the current review overlapped those cited by Slavin and Lake (2008). Studies cited in 2008 but not in the current article were released before 1990, or did not meet the much more stringent inclusion requirements of the current synthesis.
Table 1 shows the meta-regression outcomes. The full model controlled for program category and subcategory, research design, grade level, student achievement level, SES, the United States versus other countries, and tutoring group size. Table 2 shows adjusted means for each category and subcategory. Tables 3 to 8 summarize the main characteristics and outcomes of the individual studies, grouping them by category, and Table 9 shows effects of moderators. Across all included studies of programs on elementary mathematics, we found an average weighted ES of +0.09, p < .01 (k = 87), with outcomes that vary substantially among different categories.
Meta-Regression Results

Note. Meta-regression model also controlled for cross-age and online tutoring. PD = professional development; SES = socioeconomic status.
Mean Effect Sizes of Program Categories and Subcategories
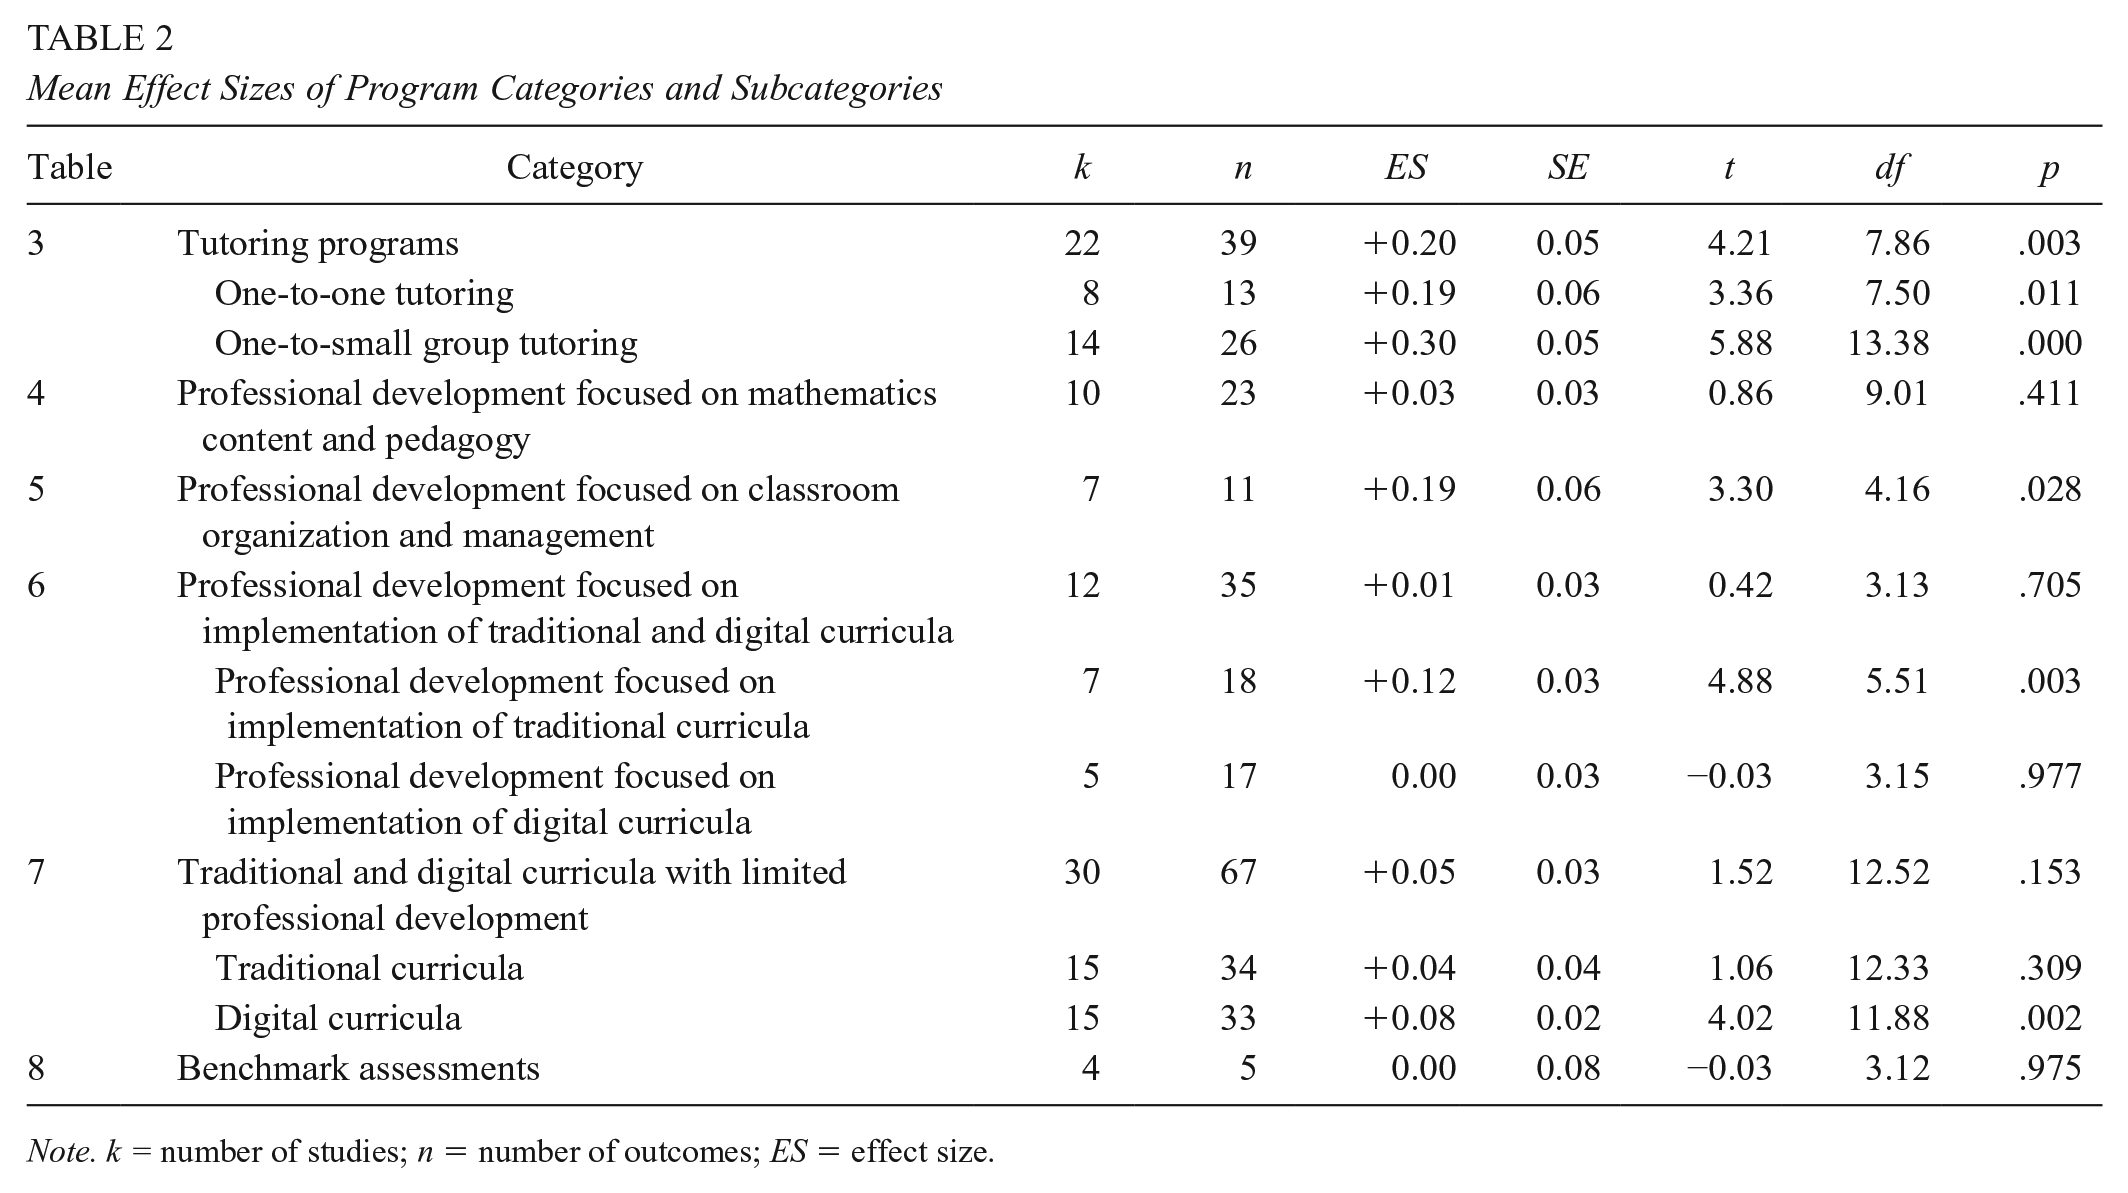
Note. k = number of studies; n = number of outcomes; ES = effect size.
Tutoring Programs

Note. Design/treatment: SR = student randomized; CR = cluster randomized; QE = quasi-experiment; CQE = cluster quasi-experiment. Measures: BAM = Balanced Assessment in Mathematics; CAT = California Achievement Test; CMT-Math = Connecticut Mastery Test; CST = California Standards Test; CSAP = Colorado Student Assessment Program; ECLS-K = Early Childhood Longitudinal Program; FCAT = Florida Comprehensive Assessment Test; GMADE = Group Mathematics Assessment and Diagnostic Evaluation; HCPS II = Hawaii Content and Performance Standards; ICAS = Interactive Computerised Assessment Systemin; CAS = Interactive Computerized Assessment System; ISAT = Illinois Student Achievement Test; ISTEP+ = Indiana State Test of Educational Proficiency; ITBS = Iowa Test of Basic Skills; MAP = Measure of Academic Progress; MAT = Metropolitan Achievement Test; MEAP = Michigan Educational Assessment Program; NAEP = National Assessment of Educational Progress; NJASK = New Jersey State Test; NSB = Brief Number Sense Screener; Nevada CRT = Nevada Criterion Referenced Test; NWEA = Northwest Evaluation Association; PTM = Progress Test in Maths; SAT 10 = Stanford Achievement Test 10; SESAT = Stanford Early School Achievement Test; SOL = Virginia Standards of Learning; STAR Math = Standardized Testing and Reporting; TAKS = Texas Assessment of Knowledge and Skills; TEMA–3 = Test of Early Mathematics Ability 3; WJ III = Woodcock-Johnson III. Demographics: A = Asian; AA = African American; H = Hispanic; W = White; FRL = free/reduced-price lunch; ELL = English language learner; LD = Learning disabilities; SPED = special education.
p < .05 at the appropriate level of analysis (cluster or individual).
Professional Development Focused on Mathematics Content and Pedagogy

Note. Design/treatment: SR = student randomized; CR = cluster randomized; QE = quasi-experiment; CQE = cluster quasi-experiment. Measures: BAM = Balanced Assessment in Mathematics; CAT = California Achievement Test; CMT-Math = Connecticut Mastery Test; CST = California Standards Test; CSAP = Colorado Student Assessment Program; ECLS-K = Early Childhood Longitudinal Program; FCAT = Florida Comprehensive Assessment Test; GMADE = Group Mathematics Assessment and Diagnostic Evaluation; HCPS II = Hawaii Content and Performance Standards; ICAS = Interactive Computerised Assessment Systemin; CAS = Interactive Computerized Assessment System; ISAT = Illinois Student Achievement Test; ISTEP+ = Indiana State Test of Educational Proficiency; ITBS = Iowa Test of Basic Skills; MAP = Measure of Academic Progress; MAT = Metropolitan Achievement Test; MEAP = Michigan Educational Assessment Program; NAEP = National Assessment of Educational Progress; NJASK = New Jersey State Test; NSB = Brief Number Sense Screener; Nevada CRT = Nevada Criterion Referenced Test; NWEA = Northwest Evaluation Association; PTM = Progress Test in Maths; SAT 10 = Stanford Achievement Test 10; SESAT = Stanford Early School Achievement Test; SOL = Virginia Standards of Learning; STAR Math = Standardized Testing and Reporting; TAKS = Texas Assessment of Knowledge and Skills; TEMA–3 = Test of Early Mathematics Ability 3; WJ III = Woodcock-Johnson III. Demographics: A = Asian; AA = African American; H = Hispanic; W = White; FRL = free/reduced-price lunch; ELL = English language learner; LD = learning disabilities; SPED = special education.
p < .05 at the appropriate level of analysis (cluster or individual).
Professional Development Focused on Classroom Organzation and Management
Note. Design/treatment: SR = student randomized; CR = cluster randomized; QE = quasi-experiment; CQE = cluster quasi-experiment. Measures: BAM = Balanced Assessment in Mathematics; CAT = California Achievement Test; CMT-Math = Connecticut Mastery Test; CST = California Standards Test; CSAP = Colorado Student Assessment Program; ECLS-K = Early Childhood Longitudinal Program; FCAT = Florida Comprehensive Assessment Test; GMADE = Group Mathematics Assessment and Diagnostic Evaluation; HCPS II = Hawaii Content and Performance Standards; ICAS = Interactive Computerised Assessment Systemin; CAS = Interactive Computerized Assessment System; ISAT = Illinois Student Achievement Test; ISTEP+ = Indiana State Test of Educational Proficiency; ITBS = Iowa Test of Basic Skills; MAP = Measure of Academic Progress; MAT = Metropolitan Achievement Test; MEAP = Michigan Educational Assessment Program; NAEP = National Assessment of Educational Progress; NJASK = New Jersey State Test; NSB = Brief Number Sense Screener; Nevada CRT = Nevada Criterion Referenced Test; NWEA = Northwest Evaluation Association; PTM = Progress Test in Maths; SAT 10 = Stanford Achievement Test 10; SESAT = Stanford Early School Achievement Test; SOL = Virginia Standards of Learning; STAR Math = Standardized Testing and Reporting; TAKS = Texas Assessment of Knowledge and Skills; TEMA−3 = Test of Early Mathematics Ability 3; WJ III = Woodcock-Johnson III. Demographics: A = Asian; AA = African American; H = Hispanic; W = White; FRL = free/reduced-price lunch; ELL = English language learner; LD = learning disabilities; SPED = special education.
p < .05 at the appropriate level of analysis (cluster or individual).
Professional Development Focused on Implementation of Traditional (Nondigital) and Digital Curricula

Note. Design/treatment: SR = student randomized; CR = cluster randomized; QE = quasi-experiment; CQE = cluster quasi-experiment. Measures: BAM = Balanced Assessment in Mathematics; CAT = California Achievement Test; CMT-Math = Connecticut Mastery Test; CST = California Standards Test; CSAP = Colorado Student Assessment Program; ECLS-K = Early Childhood Longitudinal Program; FCAT = Florida Comprehensive Assessment Test; GMADE = Group Mathematics Assessment and Diagnostic Evaluation; HCPS II = Hawaii Content and Performance Standards; ICAS = Interactive Computerised Assessment Systemin; CAS = Interactive Computerized Assessment System; ISAT = Illinois Student Achievement Test; ISTEP+ = Indiana State Test of Educational Proficiency; ITBS = Iowa Test of Basic Skills; MAP = Measure of Academic Progress; MAT = Metropolitan Achievement Test; MEAP = Michigan Educational Assessment Program; NAEP = National Assessment of Educational Progress; NJASK = New Jersey State Test; NSB = Brief Number Sense Screener; Nevada CRT = Nevada Criterion Referenced Test; NWEA = Northwest Evaluation Association; PTM = Progress Test in Maths; SAT 10 = Stanford Achievement Test 10; SESAT = Stanford Early School Achievement Test; SOL = Virginia Standards of Learning; STAR Math = Standardized Testing and Reporting; TAKS = Texas Assessment of Knowledge and Skills; TEMA−3 = Test of Early Mathematics Ability 3; WJ III = Woodcock-Johnson III. Demographics: A = Asian; AA = African American; H = Hispanic; W = White; FRL = free/reduced-price lunch; ELL = English language learner; LD = learning disabilities; SPED = special education.
p < .05 at the appropriate level of analysis (cluster or individual).
Traditional (Nondigital) and Digital Curricula With Limited Professional Development

Note. Design/treatment: SR = student randomized; CR = cluster randomized; QE = quasi-experiment; CQE = cluster quasi-experiment. Measures: BAM = Balanced Assessment in Mathematics; CAT = California Achievement Test; CMT-Math = Connecticut Mastery Test; CST = California Standards Test; CSAP = Colorado Student Assessment Program; ECLS-K = Early Childhood Longitudinal Program; FCAT = Florida Comprehensive Assessment Test; GMADE = Group Mathematics Assessment and Diagnostic Evaluation; HCPS II = Hawaii Content and Performance Standards; ICAS = Interactive Computerised Assessment Systemin; CAS = Interactive Computerized Assessment System; ISAT = Illinois Student Achievement Test; ISTEP+ = Indiana State Test of Educational Proficiency; ITBS = Iowa Test of Basic Skills; MAP = Measure of Academic Progress; MAT = Metropolitan Achievement Test; MEAP = Michigan Educational Assessment Program; NAEP = National Assessment of Educational Progress; NJASK = New Jersey State Test; NSB = Brief Number Sense Screener; Nevada CRT = Nevada Criterion Referenced Test; NWEA = Northwest Evaluation Association; PTM = Progress Test in Maths; SAT 10 = Stanford Achievement Test 10; SESAT = Stanford Early School Achievement Test; SOL = Virginia Standards of Learning; STAR Math = Standardized Testing and Reporting; TAKS = Texas Assessment of Knowledge and Skills; TEMA–3 = Test of Early Mathematics Ability 3; WJ III = Woodcock-Johnson III. Demographics: A = Asian; AA = African American; H = Hispanic; W = White; FRL = free/reduced-price lunch; ELL = English language learner; LD = learning disabilities; SPED = special education.
p < .05 at the appropriate level of analysis (cluster or individual).
Benchmark Assessments
Note. Design/treatment: SR = student randomized; CR = cluster randomized; QE = quasi-experiment; CQE = cluster quasi-experiment. Measures: BAM = Balanced Assessment in Mathematics; CAT = California Achievement Test; CMT-Math = Connecticut Mastery Test; CST = California Standards Test; CSAP = Colorado Student Assessment Program; ECLS-K = Early Childhood Longitudinal Program; FCAT = Florida Comprehensive Assessment Test; GMADE = Group Mathematics Assessment and Diagnostic Evaluation; HCPS II = Hawaii Content and Performance Standards; ICAS = Interactive Computerised Assessment Systemin; CAS = Interactive Computerized Assessment System; ISAT = Illinois Student Achievement Test; ISTEP+ = Indiana State Test of Educational Proficiency; ITBS = Iowa Test of Basic Skills; MAP = Measure of Academic Progress; MAT = Metropolitan Achievement Test; MEAP = Michigan Educational Assessment Program; NAEP = National Assessment of Educational Progress; NJASK = New Jersey State Test; NSB = Brief Number Sense Screener; Nevada CRT = Nevada Criterion Referenced Test; NWEA = Northwest Evaluation Association; PTM = Progress Test in Maths; SAT 10 = Stanford Achievement Test 10; SESAT = Stanford Early School Achievement Test; SOL = Virginia Standards of Learning; STAR Math = Standardized Testing and Reporting; TAKS = Texas Assessment of Knowledge and Skills; TEMA–3 = Test of Early Mathematics Ability 3; WJ III = Woodcock-Johnson III. Demographics: A = Asian; AA = African American; H = Hispanic; W = White; FRL = free/reduced-price lunch; ELL = English language learner; LD = learning disabilities; SPED = special education.
p < .05 at the appropriate level of analysis (cluster or individual).
Methodological and Substantive Moderators

Note. k = number of studies; n = number of outcomes; ES = effect size. Exploratory model is the same as the full model, adding the tutoring provider moderator. Because of the limited sample size and exploratory nature, statistical tests are not reported.
Tutoring Programs
Twenty-two studies evaluated tutoring programs. Combining all forms of tutoring, the mean ES was +0.20, p < .01 (k = 22). Table 3 shows the tutoring programs, study details, and findings. Eight of these evaluated face-to-face, one-to-one tutoring. An additional study evaluated one-to-one tutoring from tutors in India or Sri Lanka delivered online to students in the United Kingdom, and another evaluated cross-age peer tutoring. These two approaches were so different from other tutoring models and had such limited evidence (one study each) that they are not averaged with the others. Fourteen studies evaluated programs taught by tutors to small groups. Overall, the weighted mean ES for one-to-one face-to-face tutoring was +0.19, p < .01 (k = 8), while the single study of one-to-one online tutoring program had an ES of −0.03 and the one study of cross-age peer tutoring had an ES of +0.02. One-to-one tutoring by certified teachers (ES = +0.22, k = 2), and by teaching assistants (ES = +0.16, k = 5) were not significantly different from each other in the exploratory model. Teaching assistants were relatively well qualified (e.g., most had bachelor’s degrees), and both certified teachers and teaching assistants used structured programs and received extensive professional development. One program used paid AmeriCorps volunteers 1 as tutors, and the ES was +0.20.
Tutoring to small groups had an overall mean ES of +0.30, p < .01, k = 14). Surprisingly, outcomes of one-to-small group tutoring using structured programs were (nonsignificantly) higher than those of one-to-one tutoring. The only one-to-small group program that used certified teachers (ES = +0.36, k = 1) was similar in outcomes to one-to-small group approaches that used teaching assistants as tutors (ES = +0.30, p < .01, k = 13). The numbers of studies in some categories of tutoring were small, so these findings must be interpreted with caution, but it is interesting that while all forms of face-to-face tutoring by paid adults had quite positive impacts on achievement, the outcomes were highest for one-to-small group approaches.
Professional Development Focused on Mathematics Content and Pedagogy
Ten studies evaluated 10 programs focused on teacher professional development to improve teachers’ knowledge of mathematics content and content-specific pedagogy. The programs use various types of support for teachers such as workshops, training, continuous professional development, in-school support, and coaching. They may focus on improving teachers’ content knowledge, content-specific pedagogy, general pedagogy, or some combination of these. Table 4 shows the programs, study details, and outcomes. The adjusted mean ES was +0.03, ns (k = 10) for all professional development programs focused on mathematics content and pedagogy.
Professional Development Focused on Classroom Organization and Management
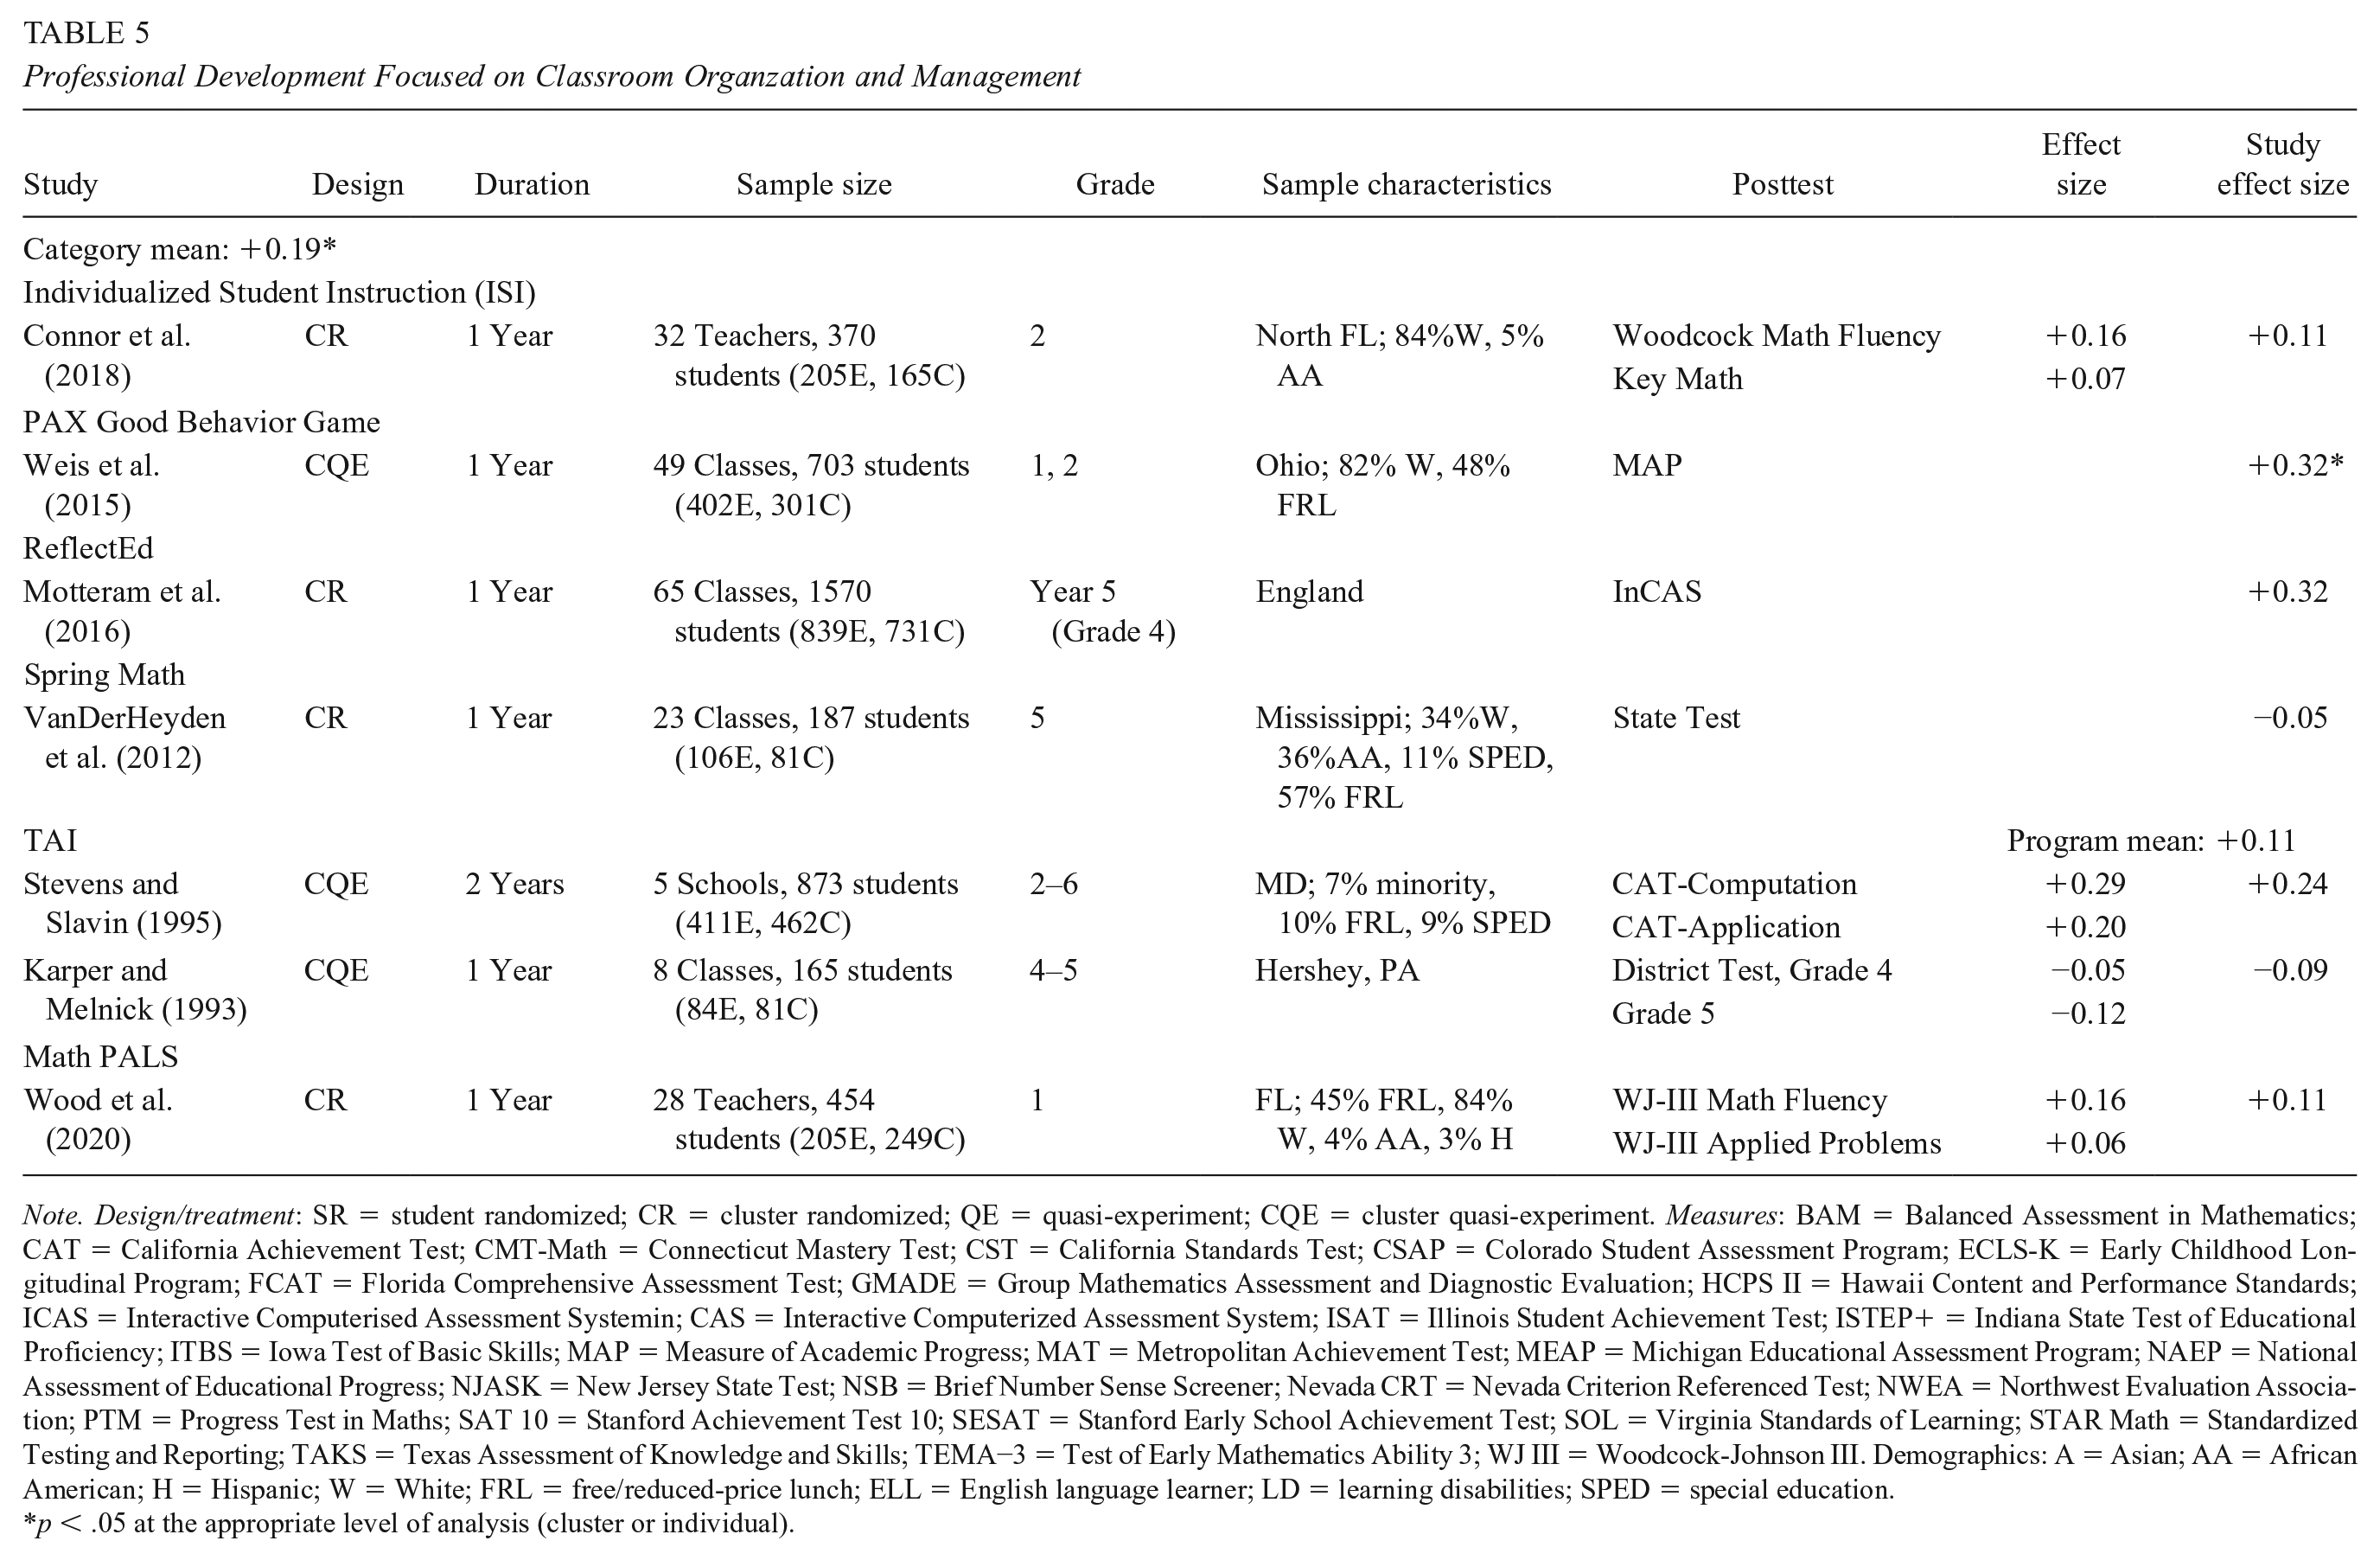
Professional development approaches in this category focused on helping teachers use models such as cooperative learning and classroom management strategies (see Table 5). Across seven studies of six diverse programs, the average ES for mathematics was +0.19, p < .01 (k = 7).
Professional Development Focused on Implementation of Traditional (Nondigital) and Digital Curricula
Twelve studies evaluated 10 programs in which significant professional development supported the implementation of new curricula or software. Table 6 shows study details and outcomes. The mean ES was +0.01, ns (k = 12). ESs averaged +0.12, p < .01 (k = 7) for traditional (nondigital) curricula, but 0.00, ns (k = 5) for digital curricula.
Traditional and Digital Curricula With Limited Professional Development
Thirty studies evaluated 19 mathematics curricula, primarily traditional (nondigital) or digital textbooks with teacher materials and limited professional development. Study details and outcomes are summarized in Table 7. Across all qualifying studies, the adjusted mean ES was +0.05, ns (k = 30). Fifteen studies of traditional curricula, mostly textbooks, found a mean ES of +0.04, ns (k = 15), and 15 studies that evaluated digital curricula found a mean ES of +0.08, p < .01 (k = 15).
Benchmark Assessments
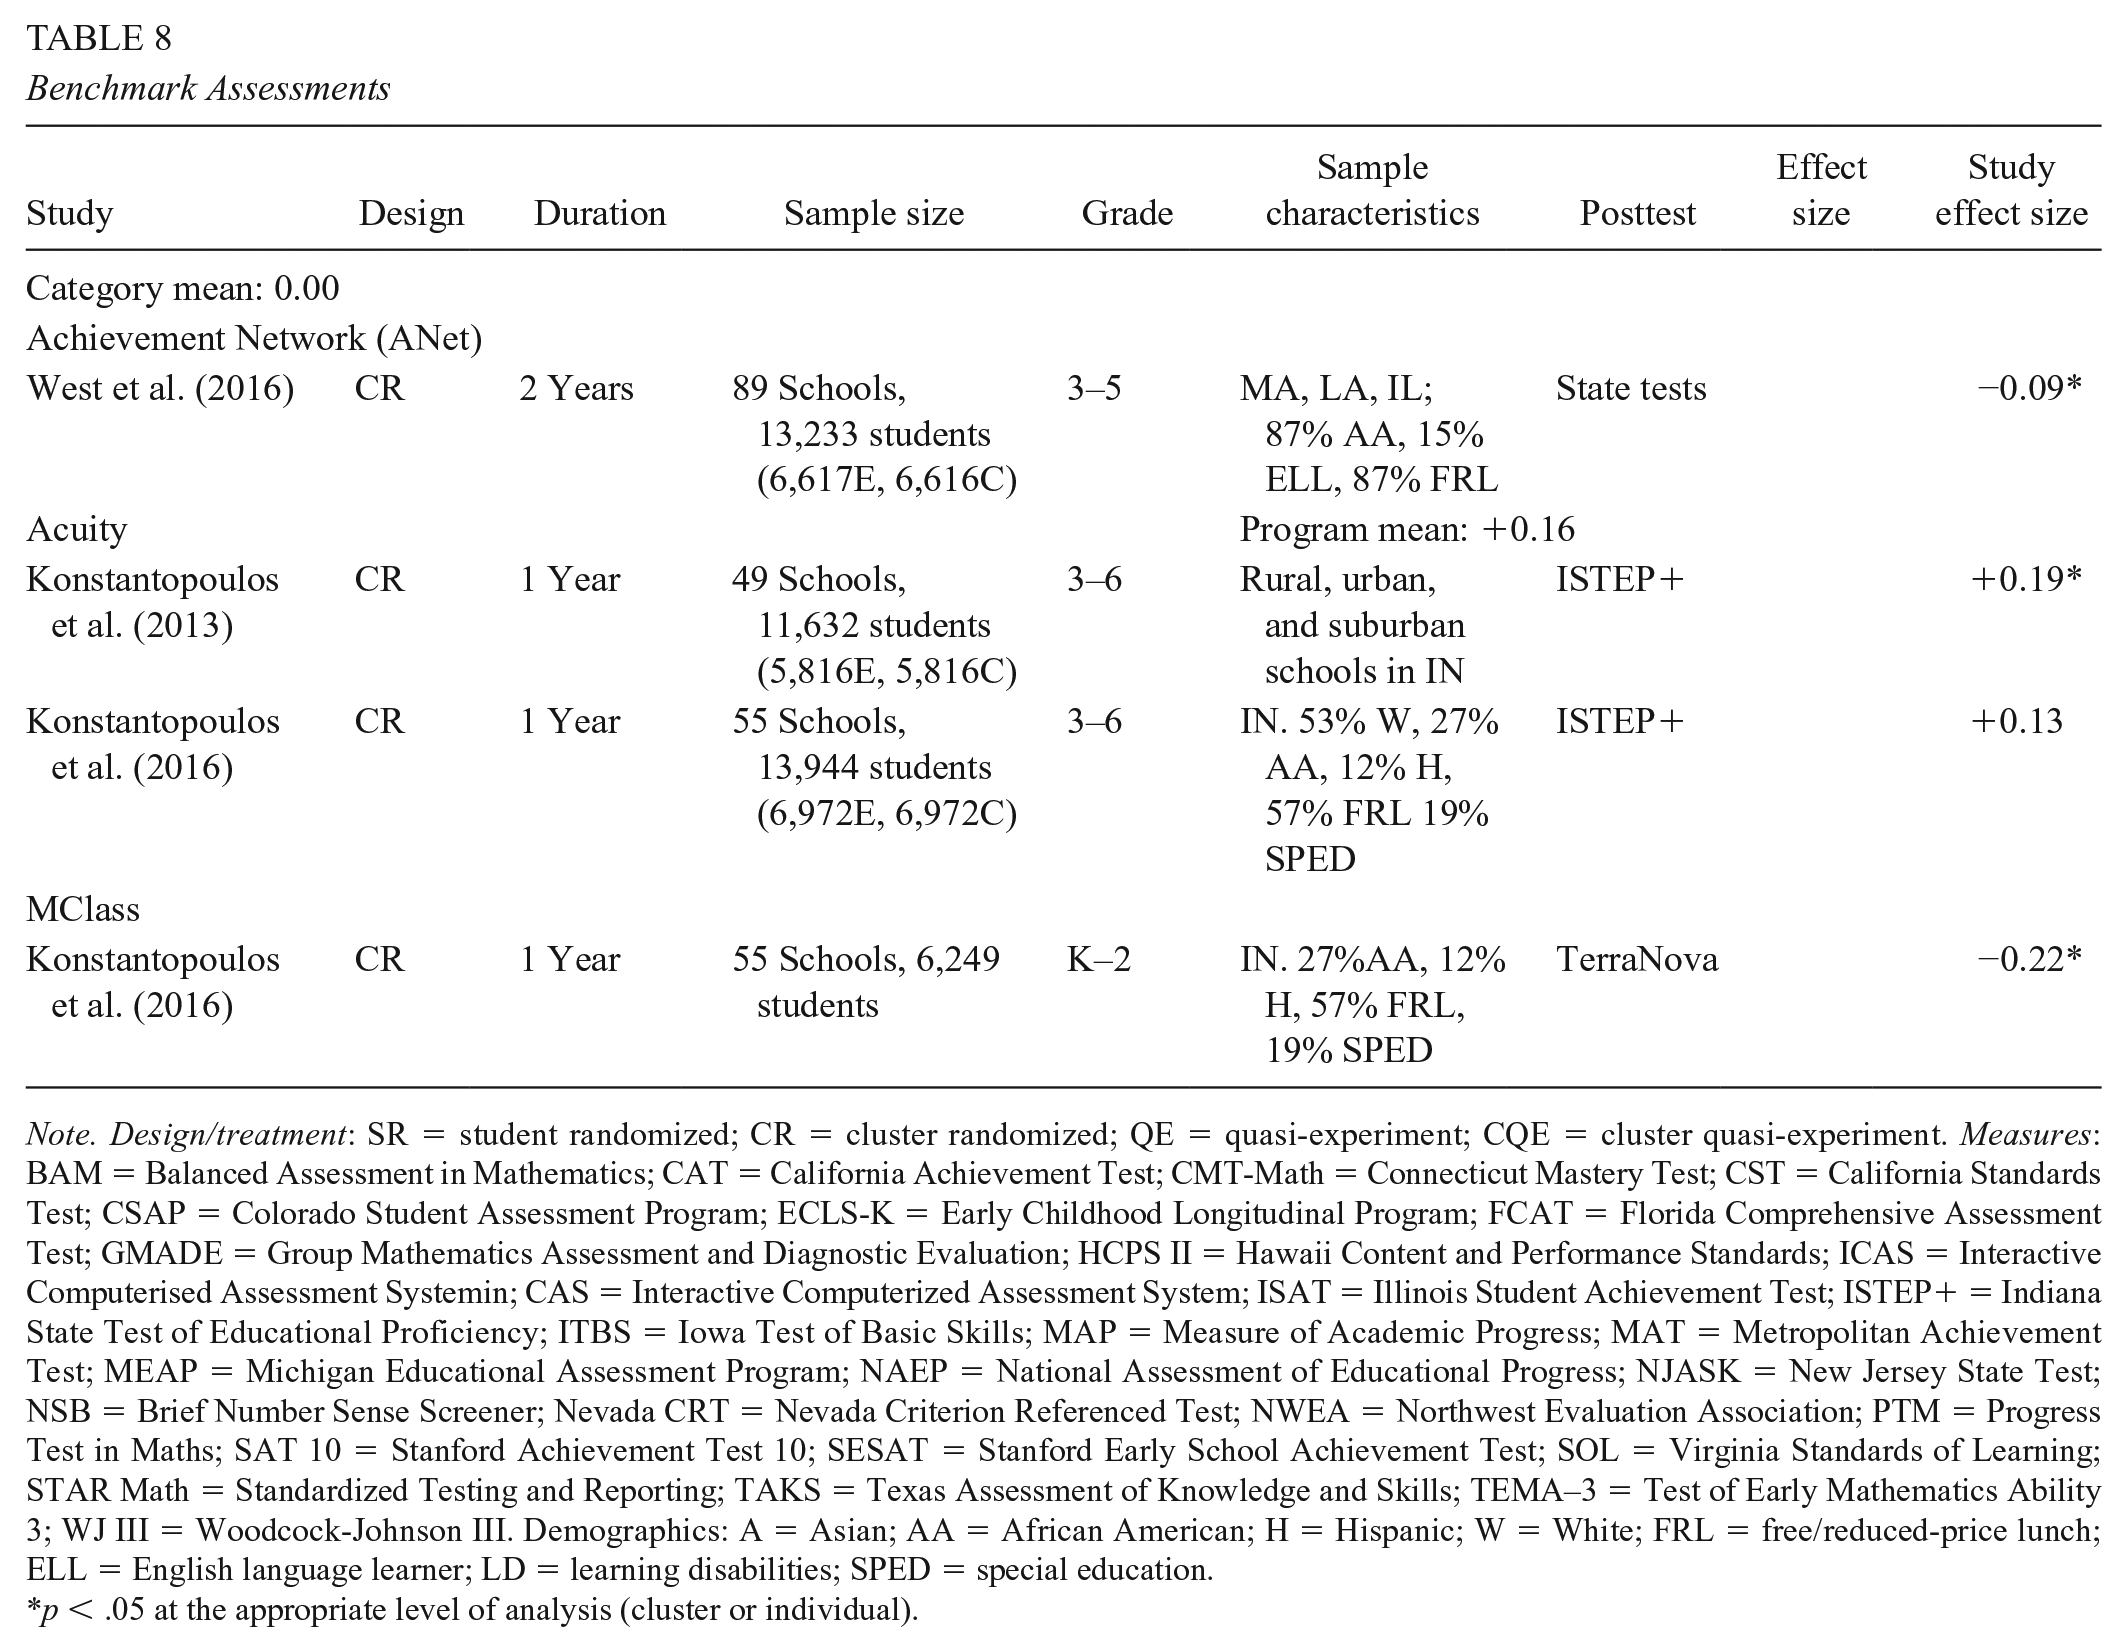
Four studies evaluated three programs that use benchmark assessments, summarized in Table 8. The studies found a mean ES of 0.00, ns (k = 4).
Moderator Analyses
Random-effects models were used to carry out moderator analyses, which identify substantive and methodological factors that contribute to positive outcomes (see Table 9). Moderator analyses including all studies were conducted. An exploratory model was used to examine the effect of tutoring provider, by adding it to all other identified moderators.
Research Design
As reported in previous studies, ESs may vary according to research design. Cheung and Slavin (2016) and de Boer et al. (2014) found that quasi-experiments across all subjects and grade levels, pre-K–12, produce a significantly higher ES than randomized studies, on average, although others, such as Lipsey and Wilson (2001), have not found this difference. In the present meta-analysis, differences in ESs between studies that used randomized designs (ES = +0.08, p < .01, k = 74) and studies that used quasi-experimental designs incorporating matching (ES = +0.20, p < .01, k = 13) were tested. This difference (β = 0.12) was significant (p < .05).
Grade Levels
To determine if different grade levels may be a source of variation, we divided the study outcomes into those relating to Grades K to 2 and those relating to grades 3 to 6. Many studies crossed this divide, so one study could contribute both a K–2 and a 3–5 ES. The mean ES for K–2 outcomes (ES = +0.08, p < .01, n = 79) was very similar to the mean ES for 3 to 6 outcomes (ES = +0.11, p < .01, n = 78).
Student Achievement Level
Outcomes including all students had a mean ES of +0.08, p < .01 (n = 121). This was not significantly different from either outcomes for low achievers (ES = +0.13, p < .01, n = 48) or outcomes for moderate and high achievers (ES = +0.06, p <.05, n = 15).
Socioeconomic Status (SES)
Study samples were defined as low-SES if the proportion of students receiving free or reduced-priced meals was at or above the 75th percentile of school rates of free- or reduced- price meals participation at the national level (76% for the United States, 21% for England). Mean ESs for outcomes of mixed SES populations were +0.10, p < .01 (n = 55). The mean ES for low SES students was +0.08, p < .05 (n = 56), and for moderate/high SES students, it was +.10, p < .01 (n = 73). The differences between mixed and low-SES students (β = −0.01, n.s.) and mixed and moderate/high SES students (β = 0.01, ns) were not statistically significant.
The United States Versus Other Countries
Of the 87 qualifying studies, 65 took place in the United States, 19 in England, 1 in the the Netherlands, one in Germany, and one in Canada. Mean ESs were nearly identical for U.S. and non-U.S. studies: +0.10, p < .01 for U.S. (k = 65), +0.08, p < .01 for non U.S. (k = 22). This difference (β = −0.02, ns) was not statistically significant.
Tutoring-Specific Moderators
Tutoring Group Size
The impacts of tutoring provided in a one-to-one format (ES = +0.19, p < .01, k = 8) were compared with those for tutoring provided in small-group settings (ES = +0.30, p < .01, k = 13). Outcomes were not significantly different (β = 0.11, ns).
Tutoring Provider
Because there were small numbers of studies of tutoring with different providers, this moderator was explored in a separate exploratory model still containing all other moderators and covariates. The mean ESs for five different combinations of providers and group size (one or small group) are shown in Table 9 as an exploratory analysis, and statistical tests such as p values are not reported.
Among the tutoring studies, the outcomes of tutoring provided by teachers (ES = +0.24, k = 3) was similar to those of tutoring provided by teaching assistants (ES = +0.18, k = 18).
Discussion
This review of evaluations of elementary mathematics programs found 87 studies of very high methodological quality. The studies were mostly randomized and large scale, increasing the likelihood that their findings will replicate in large-scale applications in practice. Strict inclusion criteria, plus controls for key moderators, made ES estimates much lower than those in previous meta-analyses, but because of these procedures, the ESs are more realistic than were those in studies with less strict inclusion standards (e.g., Jacobse & Harskamp, 2011; Kulik & Fletcher, 2016; Slavin & Lake, 2008). Collectively, the studies found that it matters a great deal which programs and which types of programs elementary schools use to teach mathematics, especially for low-achieving students.
The findings of the current study provide some support for the conclusions of Lynch et al. (2019). Of course, the present study focused only on elementary mathematics, and Lynch et al. addressed science as well as mathematics in grades pre-K–12, so this is not a head-to-head comparison. But the relative outcomes are nevertheless interesting.
Both Lynch et al. (2019) and the present study found small, nonsignificant impacts for professional development services without a strong link to new curriculum, and both found small, nonsignificant impacts of implementation of traditional or digital curricula with a limited focus on professional development (less than 2 days or 15 hours). Lynch et al. found positive effects for strategies that focused professional development on the implementation of new curricula. The present study also found small but significant positive effects of strategies that devote extensive professional development to adoption of traditional (nondigital) curricula (ES = +0.12, p < .01), but found an ES near zero for programs that provide extensive professional development to support use of digital curricula. The present meta-analysis also found significant positive effects of professional development to help teachers improve classroom organization and management (ES = +0.19, p < .01, k = 7). Forms of cooperative learning were most common among such studies. The Lynch et al. (2019) meta-analysis did not identify a comparable category of professional development because its focus was on the interaction of professional development and curriculum.
The other category of approaches that had the largest and most robust impacts was tutoring. One-to-one tutoring by face-to-face adult tutors and one-to-small group tutoring were particularly effective. It was interesting to find that the ES for one-to-small group tutoring (ES = +0.30, p < .01, k = 14) was larger than that for one-to-one (ES = +0.19, p < .01, k = 8), though this difference was not statistically significant. Similar findings were reported by Clarke et al. (2017). Teachers (ES = +0.24, k = 3) and teaching assistants (ES = +0.18, k = 18) appear equally effective as tutors, on average, but this result should be interpreted cautiously due to the small sample of teacher–tutor studies. In contrast, online tutors and cross-age peer tutors did not show promising impacts. The findings suggesting that the least expensive tutoring format, one-to-small group tutoring by teaching assistants, was quite effective (ES = +0.30, p < .01, k = 13) suggests that this tutoring arrangement could be a very cost-effective service for students struggling in mathematics, and could therefore be practicably offered to larger numbers of students than has previously been thought possible.
Theorists have long assumed that tutoring works well because the tutor can substantially adapt to the learning needs of students (e.g., Elbaum, 2000). Yet digital curricula also emphasizes individualization, and ESs for all studies using digital curricula had ESs near zero (see Tables 6 and 7). However, the kind of individualization possible in one-to-one or one-to-small group tutoring is beyond what technology can provide. As in CAI, successful tutoring programs in mathematics generally provide structured, sequential content at students’ individual levels, and allow students to proceed at their own pace. However, face-to-face tutors can also individualize by providing feedback, explanations, and demonstrations to help students understand key concepts and get past blockages and misconceptions. Also, it may be that tutoring, by providing struggling students with individual attention from caring tutors, may provide a motivational or social–emotional benefit that computers cannot, and students may be eager to please a valued adult. Research is needed to understand the effectiveness of tutoring, including qualitative and correlational as well as experimental methods.
The positive effects of professional development focused on classroom organization and management (ES = +0.19, k = 7) replicate findings from previous reviews, such as Slavin and Lake (2008) and Jacobse and Harskamp (2011), as well as a great deal of research on cooperative learning (e.g., Rohrbeck et al., 2003; Slavin, 2017; Webb, 2008).
Programs in the classroom organization and management category generally assign students to teams and encourage them to help one another learn and behave appropriately. Teams receive recognition or small privileges (such as lining up first for recess) if their members, on average, behaved appropriately and performed well on assessments. Professional development is focused on facilitating teamwork, mutual assistance, encouragement, and commitment to prosocial goals. All programs also focus on student success in mathematics. The success of this category of programs suggests that mathematics achievement may best be facilitated by enhancing motivation and making students active learners.
The discrepancy in outcomes was striking between studies of professional development focused on building teachers’ knowledge of mathematics content and pedagogy and those of professional development focused on helping teachers implement innovations in classroom organization and management. One extraordinary example is a study of Intel Math (Garet et al., 2016), which provided 93 hours of in-service to teachers of Grades K–8 to improve their understanding of mathematics content and pedagogy. A 1–year cluster randomized evaluation with 165 teachers found small but significantly negative impacts on state tests (ES = −0.06, p < .05), and nearly identical but nonsignificant negative effects on Northwest Evaluation Association Mathematics. Several studies found significant positive impacts on teachers’ knowledge of mathematics, but this did not transfer to improvement in student achievement. Not one of the 10 studies of professional development methods focused on mathematics content and pedagogy achieved statistical significance in improving mathematics outcomes, and the mean was only +0.03. It is of course important for teachers to know and apply appropriate mathematics content and content-specific pedagogy, but perhaps this is not enough if the student experience is not fundamentally changed. Another possibility is that teachers in the experimental and control groups already knew a great deal about mathematics content and pedagogy, so further professional development in these areas may not make much difference. Clearly, a deeper look into programs of this kind is warranted.
Studies of traditional and digital mathematics curricula with limited professional development found very small impacts (mean ES = +0.05, ns, k = 30). Most of the mathematics curriculum studies just compared a new textbook or digital curriculum (and associated add-ons) to existing textbooks or software, so it is not surprising to see few differences in outcomes. Similarly, studies of benchmark assessments found a mean ES of 0.00 (k = 4, ns).
One interesting finding from the present review relates to technology in mathematics education, which has been reviewed previously by Cheung and Slavin (2016); Higgins et al. (2019); Li and Ma (2010); and Savelsbergh et al. (2016). It is striking how weak the evidence base for technology is. The present research adds to the evidence on technology applications in several ways. First, the category of Professional Development Focused on the Implementation of Traditional and Digital Curricula had two subcategories, identifying programs with or without an emphasis on technology (see Table 6). Programs that provided extensive professional development to support traditional (nondigital) curricula, essentially textbooks, had a modest positive impact on mathematics achievement, averaging ES = +0.12 (k = 7; p < .05). However, professional development supporting programs with a strong focus on technology had an average ES of 0.00. Among programs with limited professional development, both traditional curricula (ES = +0.04) and digital curricula (ES = +0.08) had minimal ESs (see Table 7). Especially in mathematics, which seems to lend itself to technology more than any other subject, to find so little evidence supporting the value-added of technology is disturbing.
One might ask whether the impacts of digital curricula are increasing over time. To test this, we computed mean unweighted ESs for studies reported in three 5–year periods. The results were as follows:
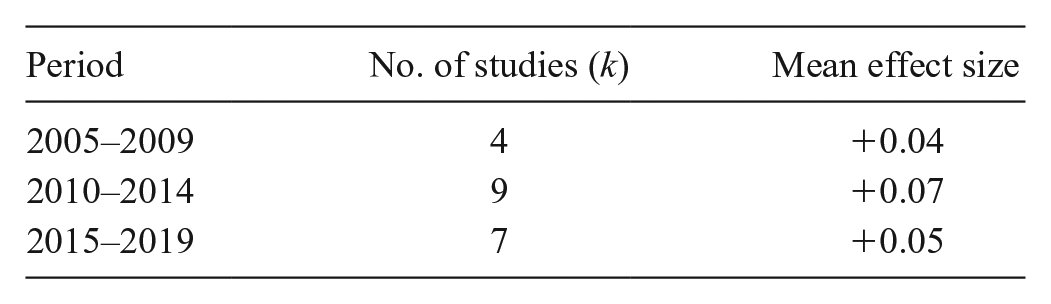
Clearly, efforts of digital curricula are not improving. Across the 20 studies of digital curricula, there were two with impressive, though not statistically significant impacts: One was a study of Time to Know by Rosen and Beck-Hill (2012), with an ES of +0.31 (n.s.). The other was a study of Symphony Math, by Schwartz (2020), with an ES of +0.30 (ns). These may indicate promise for the next generation of digital curriculum, but they are single studies with too few schools to achieve adequate power for statistical significance (meaning that these large impacts could be due to characteristics of a few schools rather than true effects of the programs).
Technology in education has long been expected to have revolutionary impacts on learning. Computer-assisted instruction was expected to be effective because it places students at their precise level of proficiency, so that they need not repeat content they already know, and it advances students at their own pace, so that they can never fall behind. The computer, it is said, is patient, giving students as much time as they need to master the content, but moving forward rapidly if they are succeeding. The computer immediately provides answers, so students need not practice errors, but can correct themselves and move on. Every one of these points was made in a 1954 film that still exists on YouTube (“Teaching Machine and Programmed Learning”). Yet 67 years later, it is clear that technology programs based on these arguments, no matter how sensible they sound, have not transformed the outcomes of learning, not even in elementary mathematics (also not in elementary reading; see Neitzel et al., in press).
Across all approaches, effects were non-significantly larger for low achievers (ES = +0.13) than for others (moderate/high achievers: ES = +0.06, mixed achievers: ES = +0.08), suggesting that there may be many pragmatic methods of increasing means while narrowing gaps.
Conclusion
This meta-analysis provides encouraging findings, suggesting that low achievers can make substantial gains in mathematics if they receive relatively cost-effective small group tutoring. Promising outcomes were also achieved by programs that emphasize cooperative learning and classroom management. These findings support a belief that long-standing inequalities in mathematics achievement can be overcome using proven, replicable strategies and by professional development focused on implementation of traditional curricula.
Footnotes
Declaration of Conflicting Interests
Robert Slavin is a cofounder of TAI, a program named in this article.
Notes
Authors
MARTA PELLEGRINI is a fixed-term researcher at the University of Florence, Italy. Her research interests include evidence-based education and systematic reviews.
CYNTHIA LAKE is a senior research associate at the Center for Research and Reform in Education at Johns Hopkins University, Baltimore, Maryland. Her research interests include comprehensive school reform, school improvement, and educational research methods and statistics.
AMANDA NEITZEL is an assistant research scientist at the Center for Research and Reform in Education at Johns Hopkins University, Baltimore, Maryland. Her research interests include school-based health models, program evaluation, and systematic reviews.
ROBERT E. SLAVIN is the director of the Center for Research and Reform in Education at Johns Hopkins University, Baltimore, Maryland. He has authored or co-authored more than 300 articles and book chapters on such topics as cooperative learning, comprehensive school reform, research reviews, evidence-based reform, and vision and learning.