
Abstract
Research focused on emotionally supportive teaching has typically run in parallel to the study of rigorous, standards-aligned mathematics teaching. However, recent work theorizes that positive and warm classroom environments may be necessary to help students meet the ambitious goals outlined in newer mathematics standards. We analyze the relationship between facets of classroom environments and the prevalence of standards-aligned mathematics instruction across more than 400 mathematics lessons in Washington, D.C., classrooms. We find no evidence of consistent standards-aligned mathematical engagement absent an engaging, emotionally supportive learning environment. These findings suggest that efforts to help teachers make the instructional shifts outlined in college and career ready standards might also need to support the provision of productive, warm, and nurturing learning environments.
A third-grade teacher launches a mathematics task asking students to compare fractional quantities. After a class discussion of the task’s key contextual features and mathematical ideas, the teacher provides time for individual reasoning. Some students use concrete materials to model the different quantities, others draw diagrams, while still others represent their thinking through a series of inequalities, equations, and sentences. The teacher then suggests students share, compare, and revise their findings with their table group, identifying mathematical relationships between different models.
Literature suggests lessons like the one described here provide students opportunities to develop mathematical competencies necessary for college and career readiness (Cobb & Jackson, 2011; Common Core State Standard Initiative [CCSSI], 2010; Kamin, 2016; Koestler et al., 2013; Mishkind, 2014; Schoenfeld, 2015)—often codified as College and Career Ready (CCR) mathematical practice standards. In the vignette above, students are provided an opportunity to develop Mathematical Practice Standard 1 (MP.1)—make sense of a task and persevere in solving it (Tennessee Department of Education, 2016)—and model with mathematics (MP.4; CCSSI, 2010). Likewise, students have an opportunity to reason abstractly and quantitatively (MP.2, Georgia Department of Education, 2016) and construct viable arguments and critique the reasoning of others (MP.3, Indiana Department of Education, 2012). The adoption of practice standards marked a shift from previous standards, which focused only on mathematics content. By adopting practice standards, states for the first time planted a stake in the ground about the processes through which students should engage with required content to be considered mathematically proficient.
Recent work theorizes there are implicit social and emotional expectations for students embedded in these CCR mathematical practice standards (Charles A. Dana Center & Collaborative for Academic, Social, and Emotional Learning [CASEL], 2016; Dymnicki et al., 2013; Rimm-Kauffman & Youngs, 2020). For example, making sense of a problem and persevering in solving it (MP.1) requires cognitive and emotional regulation (Denham & Brown, 2010; Hannula, 2006). Providing and/or receiving a constructive mathematical critique (MP.3) requires nuanced social awareness, relational skills, and self-management (Gest et al., 2005; Ginsburg-Block et al., 2006). Thus, a critical facet of supporting students in meeting the ambitious goals outlined in CCR mathematics standards may be supporting students’ social and emotional development by providing an emotionally safe and positive classroom environment, though no work to our knowledge has explored this proposition empirically. The goal of this article is to empirically analyze the relationship between facets of a classroom environment and the prevalence of standards-aligned mathematics instruction across more than 400 mathematics lessons in Washington, D.C., public school (DCPS) classrooms.
Psychologists have documented how the qualities of a classroom environment can nurture or thwart students’ ability to develop and exhibit social and emotional competencies (Frenzel et al., 2007; Patrick & Ryan, 2005; Reeve, 2006; R. M. Ryan & Deci, 2009; Sakiz et al., 2012). Classroom environments that promote social and emotional competencies are characterized by authentic opportunities for student autonomy (Reeve, 2006; Rimm-Kaufman & Hulleman, 2015; Urdan & Schoenfelder, 2006); a caring, supportive emotional climate (Hamre & Pianta, 2005; Reyes et al., 2012; Zins et al., 2007); and productive student–student and teacher–student interactions (Patrick et al., 2002; Pianta, Hamre, & Allen, 2012; A. M. Ryan & Patrick, 2001). Given the implicit social and emotional demands of mathematics practice standards, it is possible that the features of a classroom environment are even more relevant to CCR mathematics teaching and learning than they were in the era of earlier standards.
Despite theories that the classroom environment may be associated with CCR mathematics teaching and learning, this relationship has not been examined empirically. Extant research on CCR-aligned mathematics teaching and learning focuses instead on standards (Cobb & Jackson, 2011; Dingman et al., 2013; Porter et al., 2011), curriculum and assessment (Polikoff, 2015; Schoenfeld, 2015), improving teacher content knowledge (Bausmith & Barry, 2011), and implementation and accountability efforts (Coburn et al., 2016; Roth McDuffie et al., 2017). While these each represent important elements of the shift to CCR standards, they do little to illuminate the characteristics of classroom environments where students do and do not engage in standards-aligned mathematics practices. Focused squarely on this issue, this article explores the following research questions:
In raising these questions, we surface the potential convergence of college and career readiness with emotionally supportive classrooms, highlighting the ways in which the teaching practices that support each goal may be deeply intertwined.
Literature Review
College and Career Ready Mathematics
For many states, the adoption of CCR mathematics standards represented a substantive shift in expectations for students (Dingman et al., 2013; Porter et al., 2011). The standards outline expectations for mathematics content—the specific concepts, procedures, and problem types students were expected to master at each grade level—and practices—the mathematical habits, processes, and dispositions students are expected to develop.
CCR mathematics practice standards, derived, in part, from the National Council of Teachers of Mathematics (2000) five Process Standards, focus on problem solving, reasoning, making mathematical connections, and representing and communicating mathematical ideas across content and grade levels (Alberti, 2012; Cobb & Jackson, 2011; Dingman et al., 2013; Student Achievement Partners, 2013). Across these standards, cognitive ownership is placed with students, with teachers providing scaffolds and fostering the development of the habits, skills, and dispositions embedded in the standards. For example, a common discourse structure in mathematics classrooms has been (1) the teacher poses a question, (2) a student responds, and (3) the teacher evaluates the student’s answer (Nathan et al., 2007; Schleppenbach et al., 2007; Tainio & Laine, 2015). This “Initiate, Respond, Evaluate” structure positions the teacher as expert and students as novices seeking to gain the teacher’s approval. In contrast, MP.3 reads, “Students at all grades can listen or read the arguments of others, decide whether they make sense, and ask useful questions to clarify or improve the arguments” (Louisiana Department of Education, 2015, pp. 6–7). This requires students, not teachers, to evaluate and build on one another’s responses in service of collective mathematical meaning making.
Mathematical practices are outlined at both the individual and collective levels (Koestler et al., 2013). For example, practice MP.6, “Attend to Precision,” states that at the individual level, students specify units of measure, “calculate accurately and efficiently,” and “express numerical answers with a degree of precision appropriate for the problem context” (CCSSI, 2010, p. 7). When students are engaged in collective mathematical work, this standard also states that students should strive to “communicate precisely to others” using “clear definitions in discussion” stating “the meaning of the symbols they choose” and giving “carefully formulated explanations to each other” (CCSSI, 2010, p. 7). Thus, practice standards not only articulate how students should monitor and drive their individual mathematical understanding but also outline ways in which groups productively and collaboratively do disciplinary work.
The Classroom Learning Environment
Research on motivation makes clear that a physically and emotionally safe, predictable classroom learning environment facilitates the development of social, emotional, and academic competencies, such as those intimated by the CCR standards (Hamre & Pianta, 2005; Zins & Elias, 2007). For example, self-determination theory posits that students demonstrate autonomous motivation when they internalize habits and regulatory processes rather than rely on external regulation and verification of self-worth (Anderman et al., 2012). Research has consistently shown autonomy-supportive teaching practices are associated with student behavior that aligns with the CCR conception of “productive struggle”—increased student effort, persistence, initiative, engagement, enjoyment, deep processing, and success during academic tasks (Anderman et al., 2012; Deci & Ryan, 1980; Jang et al., 2009; Senko et al., 2011; Vansteenkiste et al., 2004). Autonomy-supportive teaching practices include allotting individual work time, welcoming and responding to student voice, emphasizing effort and growth over competence or skill, and supporting students (Reeve & Jang, 2006). These practices occur more often in lessons where teachers also provide a high degree of structure—explicit supports for focusing and sustaining student attention and effort—than in lessons characterized by chaos (Jang et al., 2010).
Motivation research on expectancy–value theory intimates that motivation is also based on a student’s perception of the value of working and exerting effort—sharing ideas in a mathematical discussion and persevering when solving a challenging problem—compared with not exerting the same effort (Wigfield et al., 2009). Students will be more likely to assign value to participating in the discussion or solving the hard problem, as well as risk failure in so doing, if they have a teacher who they like and trust assigning value to such efforts. They will be less likely to do so if they perceive there are negative consequences (e.g., a high emotional cost) of doing so (Anderman et al., 2012).
These theoretical ideas about how motivation influences student engagement and learning have concrete applications for studying the synergistic relationship between classroom environments and student engagement in the mathematical practices highlighted in CCR standards. In environments where students feel supported by teachers and peers, they are more engaged, develop closer relationships, are less fearful of making mistakes, and put forth greater effort (Hawkins, 1997; Lazarides et al., 2019; A. M. Ryan & Patrick, 2001; Sakiz et al., 2012; Zins et al., 2007). Likewise, in classrooms where teachers effectively organize students’ time and attention around challenging tasks and provide opportunities for autonomous decision making, students are more likely to engage in extended periods of concentration, become intrinsically motivated, and develop self-management strategies (Rathunde & Csikszentmihalyi, 2005; Shernoff et al., 2003; Turner & Meyer, 2004; Zins et al., 2007).
To foster such an environment, teachers must build positive relationships with and among students (Cornelius-White, 2007; Kiuru et al., 2015; McGrath & Van Bergen, 2015; Muller, 2001). They must maintain classroom norms and procedures that support students in becoming responsible for their own behavior (Charney, 1993; Egeberg et al., 2016; Marzano et al., 2003; Pianta & Hamre, 2009) and ensure constructive use of time and high student engagement (Hamre & Pianta, 2010).
Safe, productive, and emotionally nurturing classroom environments have been widely associated with student achievement in large-scale studies (J. Allen et al., 2013; Good & Grouws, 1977; Lockwood et al., 2015). Alternatively, in environments characterized by a lack of support, chaos, or negative emotional climate, students are less engaged, do not develop productive beliefs, and have lower academic achievement (Kunter et al., 2007; Patrick et al., 2007; Pianta et al., 2007).
There is also research that suggests specific connections between the emotional tenor of a classroom and mathematics learning. Studies have found that interventions improving the extent to which the classroom learning environment supports the development of social and emotional competencies are associated with a variety of positive outcomes in mathematics classrooms (Ben-Avie et al., 2003). These include improved mathematics achievement for marginalized students (Cheema & Kitsantas, 2013), improved social and academic outcomes (Brock et al., 2008; Flay et al., 2001; Rimm-Kaufman et al., 2007), and closer teacher–student relationships (Baroody et al., 2014). This is not to suggest that such environments are easy to foster or that if such environments are in place, then CCR engagement will ensue. In fact, it is notoriously difficult to cultivate productive, warm, and supportive classroom environments (J. P. Allen et al., 2011; Hamre & Pianta, 2010). Moreover, we do not intimate that student engagement in rigorous mathematical tasks will naturally flow from such environments. Teachers likely also need rich curricula (Stein et al., 2007) and deep mathematical knowledge for teaching (Hill et al., 2005) to promote such mathematical engagement. However, what we are arguing is that theory and empirical evidence make a compelling case for also focusing on the importance of safe, supportive classroom learning environments in service of mathematics achievement.
It is possible that in a turbulent classroom environment, students may not have the opportunity to demonstrate interwoven social, emotional, and mathematical competencies. When students begin a complex mathematics task as outlined in practice standard MP.1, “by explaining to themselves the meaning of a problem and looking for entry points to its solution” and later “monitor and evaluate their progress” and “check their answers using a different method, ask[ing] themselves, ‘Does this make sense?’” (CCSSI, 2010, p. 6), they draw on both cognitive and emotional resources that may be depleted in an unpredictable learning environment (CASEL, 2005; Durlak et al., 2011; Zins et al., 2007). During a lesson characterized by a more orderly, but less supportive, learning environment, a student may still be able to engage in problem solving uninterrupted but may be unwilling to look for their own entry points into mathematical tasks or share their developing thinking with others, because they fear the social and emotional consequences of mathematical errors (Anderman et al., 2012; Turner & Meyer, 2004).
When learning environments are consistently safe, productive, and supportive, students begin to demonstrate social, emotional, and academic competencies they see modeled by their teachers and their peers (Becker & Domitrovich, 2011; Blazar & Kraft, 2017; Curby et al., 2010; Martin & Rimm-Kaufman, 2015). Given the potential association between classroom climate and students’ engagement with mathematics in the ways outlined in CCR standards, there is a need for studies that empirically explore this relationship over time.
In this article, we examine the relationship between learning environments and CCR-aligned mathematics instruction across hundreds of lessons captured in DCPS. By identifying characteristics of classrooms where students do and do not engage in CCR-aligned mathematical work, we provide empirical evidence supporting the theorized overlap between emotionally supportive learning environments and standards-aligned mathematics instruction. We also investigate the extent to which learning environments and students’ mathematical engagement are stable across lessons taught by the same teacher, as well as the extent to which there are meaningful differences between teachers. These results have the potential to illuminate one of the ways that students in different DCPS classrooms may have divergent opportunities to engage in standards-aligned mathematics instruction. The findings, which identify commonalities and differences across teachers’ mathematics instruction, also raise questions about the need for differentiated professional development that emphasizes the relationship between warm, organized, and supportive classroom environments and mathematics teaching and learning.
Data and Method
Sample
These data are drawn from a larger study of content-focused professional development in DCPS (Cohen et al., 2020). The study included a volunteer sample of 49 third-, fourth-, and fifth-grade mathematics teachers from 23 schools (see Table 1 for information on sample). Data collection took place during the 2016–2017 and 2017–2018 school years, and each teacher recorded multiple 30-minute mathematics lessons (N = 419 lessons; average of 8.6 lessons/teacher).
Teacher Demographics

During the 2016–2017 school year, 27 teachers participated in the study, 13 of whom continued for the second year. The average teaching experience was 4.45 years during Year 1 and 6.27 years in Year 2. Like most teachers in the United States, teachers in this sample largely identified as female (70% Year 1, 60% Year 2) and White (56% Year 1, 60% Year 2; Cherng & Halpin, 2016; Hodgkinson, 2001; Lindsay & Hart, 2017). The majority of teachers taught in schools labeled with high poverty status (63% Year 1, 53% Year 2). There were no significant differences (p > .05) on these demographic variables between teachers who participated in both years of the study and teachers who participated in only one year of the study. All data collected were in the context of a long-standing data-sharing agreement between our university and DCPS, which is why we did not need parental consent for video collection. Data are stored on secure servers and are not publicly available. All teachers and school principals consented to participation in the research, and we shared all findings with participants and DCPS personnel.
Measures
These analyses focus on scores assigned by certified raters on two observational rubrics. The first, the Classroom Assessment Scoring System (CLASS), is a widely used content-generic tool that captures different dimensions of classroom interactions (Hamre & Pianta, 2005). The second, the Instructional Practice Research Tool for Mathematics (IPRT-M), is a Common Core aligned mathematics-specific observation tool developed for the project (Cohen et al., 2020).
CLASS
To understand the learning environment in each lesson, raters used the CLASS Upper Elementary (CLASS UE; Pianta, Hamre, & Mintz, 2012). The CLASS is rooted in an ecological perspective of child development, or the idea that a child’s social, emotional, and academic developments are shaped by various facets of their environment (Bronfenbrenner & Morris, 1998). Thus, in addition to capturing how students’ time and attention are organized, it also captures the emotional tenor of teacher–student and student–student interactions, a facet of the learning environment not often included in classroom observation tools (Berlin & Cohen, 2018). The interactions captured by the CLASS have consistently predicted academic and social outcomes in P–12 classrooms across diverse settings (e.g., J. Allen et al., 2013; Hamre et al., 2014; Kane & Staiger, 2012; Mashburn et al., 2008; Pakarinen et al., 2010; Pianta & Hamre, 2009).
The tool includes 12 dimensions of classroom interactions, each coded on a scale ranging from 1 (low) to 7 (high). The dimensions are organized into four broader domains: Emotional Support, Classroom Organization, Instructional Support, and Student Engagement. Given our focus on supportive learning environments during mathematics instruction, we include scores from the Emotional Support, Classroom Organization, and Student Engagement domains.
Emotional Support includes measures of Positive Climate (emotional connection between teachers and students), Teacher Sensitivity (responsiveness to students’ academic, social, and emotional needs), and Regard for Student Perspectives (how teachers support student leadership and autonomy). Classroom Organization assesses Behavior Management (consistent and proactive to positive behavior with low reactivity to negative behavior), Productivity (routines, clarity of instructions, and maximization of time on task), and Negative Climate (punitive control, humiliation, sarcasm, and exclusionary behavior). Student Engagement assesses the degree to which all students are actively participating in the activity the teacher is facilitating. Lesson means and standard deviations for these dimensions are presented in Table 2 along with intraclass correlations indicating interrater reliability for the 19% of mathematics lesson segments that were double scored. Average scores were highest on Productivity and Behavior Management and lowest on Regard for Student Perspectives, which is consistent with results from the Measures of Effective Teaching study (Kane & Staiger, 2012). This suggests that on average learning environments were characterized by efficiency as well as teacher, not student, voice and choice.
Means (M), Standard Deviations (SD), and Intraclass Correlations (ICC) a for the Seven CLASS Dimensions, Which Pertain to the Classroom Learning Environment
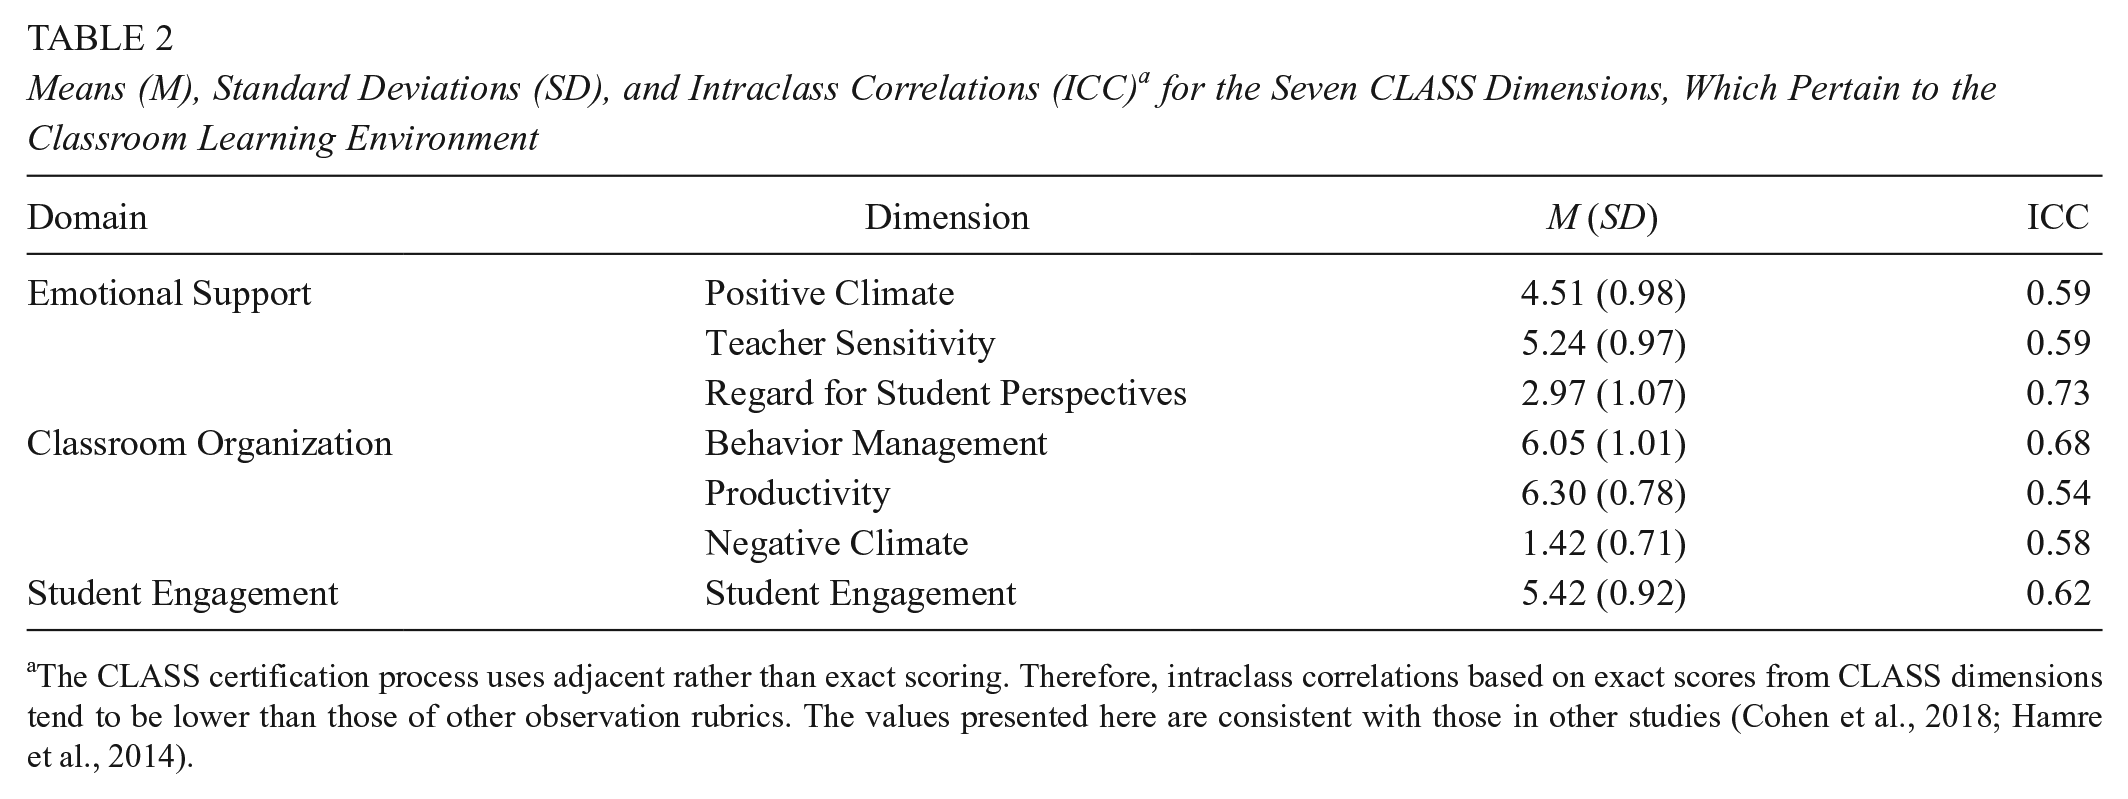
The CLASS certification process uses adjacent rather than exact scoring. Therefore, intraclass correlations based on exact scores from CLASS dimensions tend to be lower than those of other observation rubrics. The values presented here are consistent with those in other studies (Cohen et al., 2018; Hamre et al., 2014).
Instructional Practice Research Tool for Mathematics
This measure, developed specifically for this project, was adapted from Student Achievement Partners’ Instructional Practice Guide. 1 Our partners in DCPS used the Instructional Practice Guide to develop CCR-aligned professional development across the district and requested we design a measure aligned to their goals. 2 IPRT-M was explicitly drawn from the Common Core Standards for Mathematical Practice (CCSSI, 2010) and the Progressions for the Common Core Standards in Mathematics (Institute for Mathematics and Education, 2007). The eight rubrics are as follows: Coherence, Depth, Student Representations and Solution Strategies, Prompting Student Thinking, Responding to Misunderstanding, Opportunities to Engage With Mathematics, Opportunities to Justify and Critique, and Student Justifications and Critiques.
Scales
The Coherence and Depth scales are derived from the Progressions for the Common Core Standards in Mathematics and Standards for Mathematical Practice (Institute for Mathematics and Education, 2007; CCSSI, 2010). The Coherence rubric highlights the extent to which a teacher intentionally relates the current lesson to students’ prior mathematical skills and knowledge. The Depth rubric focuses on whether the mathematics presented is clear and correct and whether the teacher uses explicitly connected explanations, representations, tasks, and/or examples.
The remaining rubrics were derived from the Common Core Standards for Mathematical Practice (CCSSI, 2010). The Student Representations and Solution Strategies rubric captures the degree to which students strategically share their representations and solution methods. At the high end, the teacher must support students in explicitly drawing mathematical connections between various representations and/or solution strategies. Prompting Student Thinking assesses the frequency with which the teacher poses questions and tasks that elicit mathematical reasoning and provide opportunities for productive struggle (Granberg, 2016; Kapur, 2014; Warshauer, 2015). Responding to Misunderstanding captures whether the teacher responds constructively to student misunderstandings with scaffolds that offer specific, clear, mathematical support for the student to use reengage with the problem and revise their thinking (Granberg, 2016). Opportunities to Engage With Mathematics focuses on the proportion of the lesson that provided opportunities for all students to work with and practice mathematical reasoning. Opportunities to Justify and Critique assesses whether teachers prompt students to justify their thinking and/or critique the reasoning of others. Student Justifications and Critiques measures the mathematical depth, precision, and logic of student justifications and critiques. Before using the scales in our study, we engaged in substantial content validation work, sharing our rubrics with many experts in mathematics education, including the mathematics specialists in the DCPS central office, other prominent mathematics educators, and the mathematics team at Student Achievement Partners, including Jason Zimba, one of the lead authors of the CCSS-Mathematics.
Scoring
Each rubric is scored on a 4-point ordinal scale. A rating of 1 indicates no opportunity to engage with ambitious CCR-aligned mathematics content. A score of 2 indicates shallow or cursory opportunities. 3 A score of 3 indicates occasional opportunities, and a score of 4 indicates consistent engagement. Therefore, a score of 4 is the only rating that indicates students are regularly engaging with mathematics in the ways outlined in CCR mathematics standards.
We trained all raters to watch and take notes on 30-minute segments of mathematics instruction before assigning scores. Raters were certified when they scored an exact match to the master score for each rubric on three out of four videos. Table 3 provides interrater reliability for the 15% of lessons that were double scored, 4 as well as descriptive statistics for each rubric. While raters using the IRPT-M score 30-minute increments of instruction, CLASS raters score 15-minute increments. Therefore, CLASS segment scores were averaged to create lesson-level scores.
Means (M), Standard Deviations (SD), and Intraclass Correlations (ICC) for the 8 IPRT-M Rubrics

Note. IPRT-M = Instructional Practice Research Tool for Mathematics.
Analysis
Recent research suggests that empirical profiles of instruction can help explore variability in teaching practices both within a teacher’s lessons, as well as between different teachers (Halpin & Kieffer, 2015; Keller et al., 2018). To that end, we use latent profile analysis to uncover groups of similar lessons, or lesson profiles, present in these 422 videos. These profiles provide a parsimonious way to explore characteristics of classroom learning environments in lessons where raters do and do not observe CCR-aligned mathematical engagement (Magidson & Vermunt, 2004). Though traditionally person rather than lesson centered, this analytic technique can also be used to examine the co-occurrence of particular lesson characteristics and determine whether there are patterns of co-occurrence pervasive enough that they can be used to sort lessons into different groups (Keller et al., 2018). In this case, we use indicators of (1) the classroom learning environment drawn from the CLASS and (2) teachers’ and students’ engagement with CCR mathematics content using IPRT-M ratings to create commonly occurring profiles of mathematics instruction, which allow us to determine what types of classroom learning environments co-occur with CCR-aligned mathematical engagement.
The 422 lessons in our sample are nested within 49 teachers. To account for this, we performed a multilevel latent profile analysis using “Type Is Twolevel Mixture” in Mplus 8 (Asparouhov & Muthén, 2008) treating the data as continuous (Bandeen-Roche et al., 1997; Henry & Muthén, 2010). In accordance with current recommendations for multilevel latent profile analysis, all data were standardized prior to analysis (Keller et al., 2018; Mäkikangas et al., 2018).
To determine the consistency of particular mathematics lesson profiles within individual teachers, we ran models to identify whether it was possible to form Level 2 teacher classes based on the relative frequency of Level 1 lesson profile membership (Mäkikangas et al., 2018). These models examine whether it was possible to identify groups of teachers who tended to teach mathematics in consistent ways and provide valuable information about common strengths and areas for growth in mathematics instruction for teachers in this sample. This teacher-level analysis also illuminates variability in the classroom learning environment and students’ CCR-aligned engagement within teachers. Together, these analyses provide important information about the extent to which students in different classrooms may have had divergent access to a supportive classroom learning environment and/or opportunities for CCR-aligned mathematical engagement, over time.
Model Specification
The process of identifying multilevel mixture models with profiles at Level 1 and classes at Level 2 consists of two phases (Henry & Muthén, 2010; Mäkikangas et al., 2018). During the first phase, the researcher identifies the correct number of Level 1 (lesson) profiles starting from a one-profile solution and working up. The correct number of profiles is identified using several fit indices—the sample-adjusted Bayesian information criteria (SABIC, lower values indicate better model fit), the bootstrap likelihood ratio test (p value indicates the k profile solution is a better fit to the data than the k − 1 profile solution), entropy value (values close to 1 suggest greater distinction between profiles), the classification probabilities for most likely class membership, and the number and percentage of lessons in each profile (Mäkikangas et al., 2018; McLachlan & Peel, 2000; Nylund et al., 2007). The focus during extraction of the single-level model should be on identifying a model that is both substantively meaningful and parsimonious so that after adding the additional parameters necessary for the multilevel model, the model can still converge (Henry & Muthén, 2010).
During the second phase, the researcher determines the correct number of Level 2 (teacher) classes based on the frequency of Level 1 profile membership. Several studies indicate that the lowest BIC should be used to determine the correct number of Level 2 classes as other fit indices are not reliable for multilevel mixture models (Finch & French, 2014; Henry & Muthén, 2010; Yu & Park, 2014). Finally, graphical presentations of the final solution should be examined using standardized and raw data (J. P. Meyer & Morin, 2016).
Limitations
While this study included more than 400 mathematics lessons, these were nested within a volunteer sample of only 49 teachers in a single district. Therefore, these results should not be used to generalize about patterns of teaching within DCPS or across other districts. Results might have differed if the sample was larger, randomly selected, or conducted in a different district.
There are also limitations to the measures used in this study. We relied on classroom observations to understand the degree of CCR-aligned mathematical engagement. Student and teacher survey data could provide invaluable supplemental data about engagement (Ferguson, 2012). Moreover, we acknowledge that the IPRT was a new tool, piloted for the first time in this study. Though we have noted the validity evidence we have, we recognize that building a more robust validity argument about the tool will be an important next step in our research. Given the limited evidence about the psychometric properties of the IPRT, we treat these findings as exploratory, a first step in empirically analyzing the synergies between emotionally supportive classrooms and rigorous, standards-aligned mathematics instruction.
Results
Based on observation ratings of their classroom learning environments and CCR-aligned mathematical engagement, the mathematics lessons in this sample can be separated into four distinct profiles and teachers into three distinct groups, described in greater detail below.
Model Identification
Lesson-Level Profiles
Table 4 shows the fit indices for the one- through seven-profile solutions. These solutions describe the number of groups into which the 422 lessons can be categorized. As is common in latent profile analysis, the fit indices do not point to a single solution, or a “correct” number of categories into which the mathematics lessons should be sorted (Nylund et al., 2007). The bootstrap likelihood ratio test and SABIC suggest the seven-profile solution best fits the data. That is, the lessons could be divided into seven different groups based on observation ratings. However, the entropy values and classification probabilities point to a smaller number of lesson profiles. For example, in the seven-class solution, there are some lessons with up to a 10% chance of misclassification, whereas with four or less solutions, there is only a 4% chance of misclassification.
Fit Indices for the Single-Level Profile Solutions

Note. SABIC = sample-adjusted Bayesian information criteria; BLRT = bootstrap likelihood ratio test.
Prioritizing parsimony in service of successfully running a multilevel model, we selected the four-profile solution. The SABIC declines sharply, and then begins to level out after the four-profile solution. In addition, the entropy values and likelihood of classifying lessons into the correct profile drop with more than four profiles. This indicates that as the number of groups increases, the groups become less distinct from one another. This model suggests lessons in this sample can be sorted into four distinct groups based on the IPRT-M and CLASS observation ratings.
Teacher Groups
Next, to account for the nested data structure and to determine whether it is possible to identify groups of teachers who taught mathematics in similar ways, we ran a series of multilevel models building on the four-profile solution (see Table 5). The BIC value points to the three-class, four-profile solution. The mathematics teachers in this sample teach in consistent ways; the model suggests there are four profiles of mathematics lessons, and three groups of teachers in our sample.
Fit Indices for Multilevel Mixture Models

Note. BIC = Bayesian information criterion.
Lesson Profile Descriptions
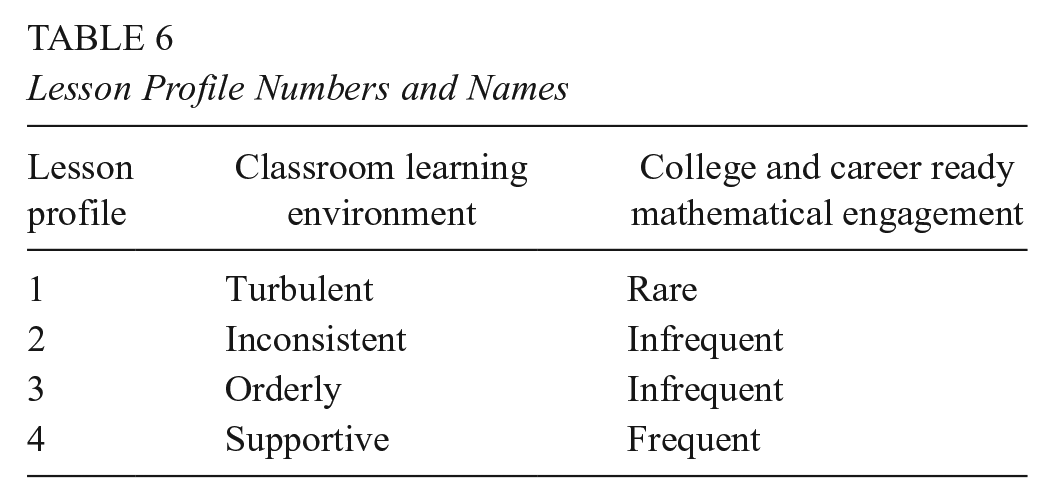
Four lesson profiles emerge from these data (see Table 6): (1) Turbulent Learning Environment, Rare Mathematical Engagement; (2) Inconsistent Learning Environment, Infrequent Mathematical Engagement; (3) Orderly Learning Environment, Infrequent Mathematical Engagement; (4) Supportive Learning Environment, Consistent Mathematical Engagement. Figure 1 shows the standardized means on each dimension for each profile. Table 7 shows the raw means on each dimension for each profile, described in greater depth below.
Lesson Profile Numbers and Names
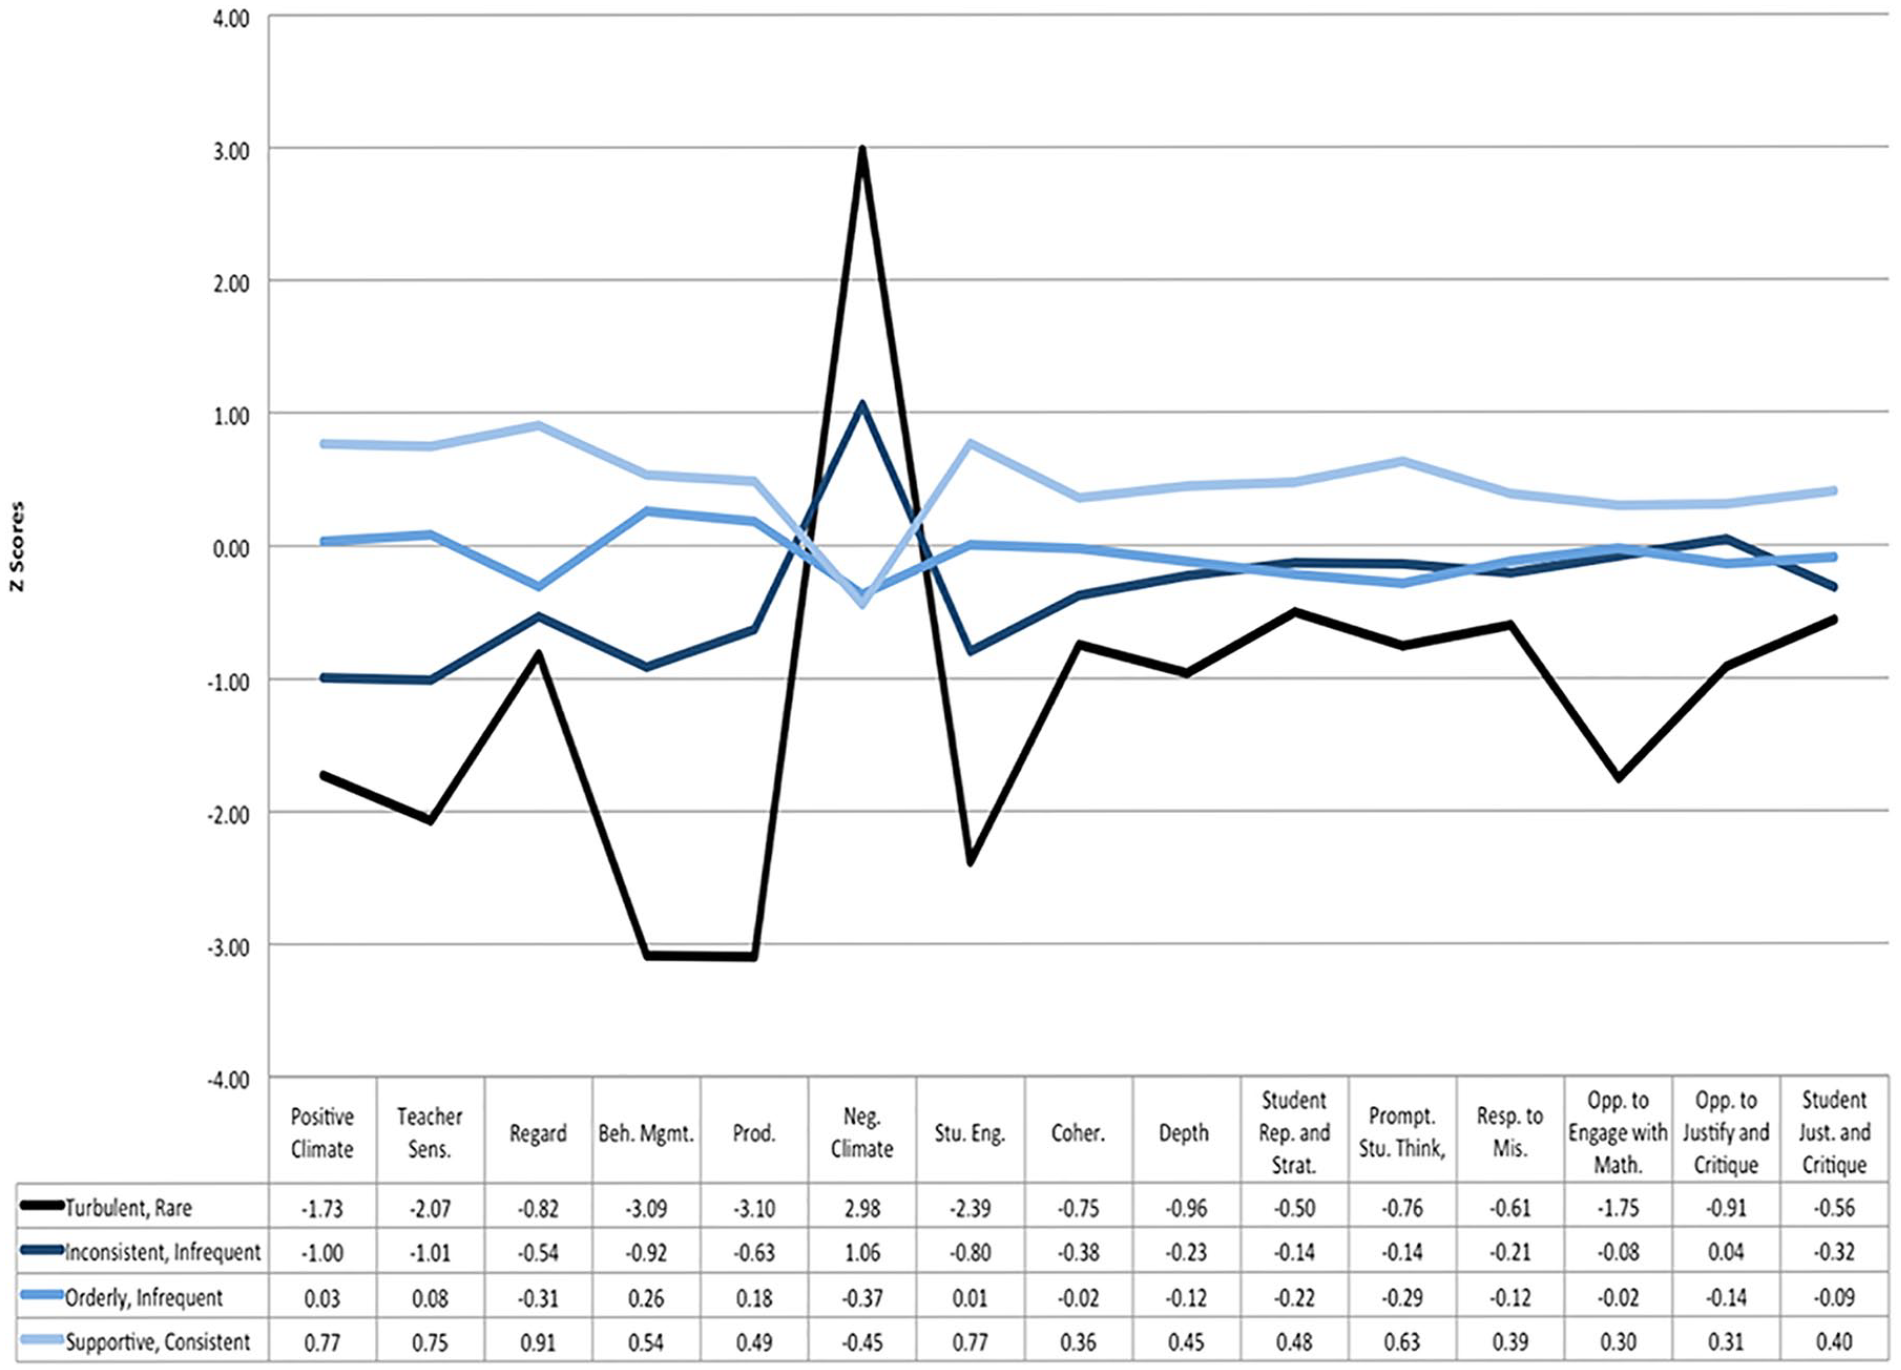
Mathematics lesson profiles and standardized profile means.
Dimension Raw Means and Standard Deviations (in Italics) by Lesson Profile

Raters did not observe consistent CCR-aligned mathematical engagement in lessons that were categorized into the first three profiles: (1) Turbulent Learning Environment, Rare Mathematical Engagement; (2) Inconsistent Learning Environment, Infrequent Mathematical Engagement; (3) Orderly Learning Environment, Infrequent Mathematical Engagement.
Turbulent Learning Environment, Rare Mathematical Engagement
Only 4% of the lessons fell in the Turbulent Learning Environment, Rare Mathematical Engagement profile. This profile contains lessons characterized by low and lower midrange emotional support (Positive Climate, m = 2.81; Teacher Sensitivity, m = 3.22; and Regard for Student Perspectives, m = 2.10) and chaotic (Behavior Management, m = 2.94; Productivity, m = 3.91), negative classroom learning environments (Negative Climate, m = 3.54). During these lessons, students were either offered no opportunities for CCR-aligned mathematical engagement or infrequent and/or shallow opportunities (all IPRT-M ratings < 3).
Inconsistent Learning Environment, Infrequent Mathematical Engagement
Eighteen percent of the lessons fell in the Inconsistent Learning Environment, Infrequent Mathematical Engagement profile, which contains lessons where both the learning environment and CCR-aligned mathematical engagement varied over the 30-minute segment (all average CLASS ratings, with the exception of Productivity ranged from 2 to 6; six out of eight average IPRT-M scores were lower than 3). On both the CLASS and the IPRT-M, midrange scores (3–5 and 2–3, respectively) indicate sporadic but inconsistent evidence of high-quality practice. 5 Standardized scores on the Opportunities to Engage With Mathematics rubric show that students have substantially more opportunities to do mathematical work in lessons characterized as having an Inconsistent Learning Environment than in those categorized as having a Turbulent Learning Environment (1.67 standard deviation difference in average scores between the two).
Orderly Learning Environment, Infrequent Mathematical Engagement
Almost half of the DCPS lessons in our study (48%) were represented in the third profile: Orderly Learning Environment, Infrequent Mathematical Engagement. In these lessons, there is a mix of CLASS scores. Average behavior management and productivity scores are in the high range—hence the label “orderly”—but the average Emotional Support and Student Engagement scores are in the low- to midrange. The orderly environment does not seem to translate into higher levels of mathematical engagement. Average IPRT-M scores are indistinguishable in orderly environments (Profile 3) from inconsistent environments (Profile 2). Between-group comparisons indicate there are no significant differences between the average IPRT-M scores for these two profiles (p > .05), with the exception of the Coherence indicator (p < .05).
Across lessons with Inconsistent and Orderly Learning Environments, an interesting pattern emerges. Teachers consistently offer students opportunities for CCR- aligned mathematical engagement, but students do not take them. Both profiles had higher average scores on the Opportunities to Justify and Critique, a teacher-focused scale, than on the Student Justifications and Critiques scale, which assesses the degree to which students took up these opportunities. In addition, the low scores on the Student Representations and Solution Strategies rubrics (1.37 and 1.30, respectively) indicate there was virtually no evidence of students sharing solution strategies or mathematical representations with peers in lessons categorized as Inconsistent Learning Environment, Infrequent Mathematical Engagement (Profile 2) or Orderly Learning Environment, Infrequent Mathematical Engagement (Profile 3). These mathematical practices are central in Common Core and other “college and career ready” standards. Though we have no empirical evidence for why we see this pattern, expectancy value and self-determination theories and prior empirical work provide some hypotheses. Given the low observed levels of emotional support, we theorize that students may not have felt comfortable engaging in the kind of risk-taking and sharing with peers required by the mathematical practice standards (Rimm-Kaufman & Youngs, 2020; Senko et al., 2011; Turner & Meyer, 2004). Exploring this conjecture empirically is an important next step for research.
Supportive Learning Environment, Consistent Mathematical Engagement
The fourth profile, Supportive Learning Environment, Consistent Mathematical Engagement, contained 30% of the lessons. The learning environments in these lessons are orderly like those in Profile 3 but are also more emotionally supportive and engaging than lessons in all the other profiles, as indicated by significantly higher scores on all indicators in the Emotional Support and Student Engagement domains (p < .05). The greatest differences between the learning environments in Profiles 3 (Orderly) and 4 (Supportive) were on Positive Climate, Regard for Student Perspectives, and Student Engagement (differences ranged from 0.74 to 1.22 standard deviations). These ratings indicate that compared with lessons in Orderly environments, lessons in Supportive environments contained greater evidence of warm interactions, opportunities for student autonomy, active listening, participation, and on-task behavior. Mathematical engagement was also significantly higher during lessons in Profile 4 than in all other profiles (p < .05 for all IPRT-M indicators). The largest differences in CCR-aligned mathematical engagement between Profile 4 and the three other profiles are on indicators that most explicitly call on students’ engagement in collective mathematical work—Student Representations and Solution Strategies and Student Justification and Critique—and for engaging in individual productive struggle—Depth, Responding to Student Misunderstanding and Prompting Student Thinking.
Lesson Profile Summary
There were marked differences between the characteristics of classroom learning environments where raters did and did not observe CCR-aligned mathematical engagement. Raters did not observe mathematics engagement in learning environments characterized by chaos and low emotional support. There was also limited evidence of CCR-aligned instruction in learning environments that were orderly and productive but offered only inconsistent emotional support and student engagement. Raters only observed consistent opportunities for CCR-aligned mathematical engagement in environments that were safe and productive, as well as positive, supportive, and engaging.
Teacher Groups
Variation in Learning Environments and Mathematical Engagement Across Teachers
There were three groups of teachers based on lesson profile membership (see Figure 2). The first and the smallest group of teachers (n = 10, 20% of teachers) did not contain any lessons where raters observed consistent CCR-aligned mathematical engagement. They taught all the lessons from the Turbulent Learning Environment, Rare Mathematical Engagement profile (Profile 1), as well as the majority of lessons from the Inconsistent Learning Environment, Infrequent Mathematical Engagement profile (Profile 2). This group is termed Inconsistent to highlight that in these classrooms students did not have consistent access to an orderly learning environment or standards aligned mathematical engagement.

Teacher groups created from lesson profile membership.
The second group, which comprised 35% of the teachers (n = 17), taught lessons characterized by infrequent engagement with ambitious mathematics content. The majority of these lessons (81%) were from the Orderly Learning Environment, Infrequent Mathematical Engagement profile. Thus, this group was termed Orderly to suggest that while students in these classrooms were safe and smoothly managed, they rarely had access to more emotionally supportive learning environments or opportunities for consistent mathematical engagement.
The third and the largest group of teachers (n = 22, 45%) was termed Supportive. The teachers in this group provided a safe and productive learning environment in almost all of their lessons; only eight lessons taught by this group were from the Inconsistent Learning Environment, Infrequent Mathematical Engagement profile. In 64% of these lessons, students also had a supportive, mathematically engaging learning environment and consistent opportunities for CCR-aligned mathematical engagement (lessons from the Supportive Learning Environment, Consistent Mathematical Engagement profile).
Between-group comparisons of IPRT-M scores highlight similarities and differences between the three groups of teachers. Teachers in the Inconsistent and Orderly groups afforded students similar opportunities for CCR-aligned mathematical engagement. With one exception, there are no statistically distinguishable differences between the average IPRT-M scores for teachers in the Orderly group and teachers in the Inconsistent group (p > .10). 6 In contrast, the average score on each rubric of the IPRT-M for teachers in the Supportive group is significantly higher than the average scores of teachers in the Inconsistent and Orderly groups (p < .05). Together, the observed differences in classroom learning environments and CCR-aligned mathematical engagement suggest that over time students in different classrooms with different teachers may have had meaningfully distinct experiences engaging in standards-aligned mathematics.
Variation in Learning Environments and Mathematical Engagement Within Teachers
Figure 3 shows how consistent were teachers in their instructional profiles. Lessons categorized as Inconsistent Learning Environment, Infrequent Mathematical Engagement and Turbulent Learning Environment, Rare Mathematical Engagement tended to cluster within particular teachers in the Inconsistent group. Only eight teachers had any lesson categorized as Turbulent Learning Environment, Rare Mathematical Engagement, which we might consider the weakest instructional profile. Of this group, six had multiple lessons categorized this way, suggesting more consistently weak instruction.

Distribution of lesson profiles within teachers and teacher groups.
Despite this limited within-teacher clustering of weaker lessons, the majority of teachers enacted at least two different mathematics lesson profiles. This within-teacher variability was largely between “adjacent” profiles (e.g., Profiles 2 and 3). Fourteen teachers exhibited three teaching profiles (e.g., Teacher 8 on Figure 3). Only three out of 49 teachers exhibited a single, consistent lesson-level profile. Broadly speaking, individual teachers taught mathematics in consistent enough ways that teachers could be separated into three distinct groups. However, there was also meaningful within-teacher variability from lesson to lesson in the characteristics of the learning environments and opportunities for CCR-aligned mathematical engagement.
Discussion
Classroom Learning Environments and Standards-Aligned Mathematics
The first aim of this study was to identify characteristics of learning environments where students do and do not engage with CCR-aligned mathematics. These data suggest that orderly classrooms alone may not support high-quality mathematics engagement (Doyle, 1977; Hamre & Pianta, 2010; Korpershoek et al., 2016; Marzano et al., 2003). Raters only observed consistent CCR-aligned mathematical engagement in classrooms that were also safe, productive, emotionally supportive, and engaging. Raters did not observe consistent CCR-aligned mathematical engagement in classrooms that were orderly, but not emotionally supportive and engaging, or in turbulent or inconsistent learning environments. The co-occurrence of particular characteristics of the classroom learning environment and CCR-aligned mathematical engagement provides early empirical evidence that, as others have theorized (Rimm-Kaufman & Youngs, 2020), there may be some interplay between emotionally supportive learning environments and the ambitious goals for students’ mathematical work outlined in CCR standards.
One illustration of this potential interplay is that ratings from the IPRT-M show that, in this sample, in Turbulent, Inconsistent, and Orderly Learning Environments, students rarely shared their mathematical thinking with others. There could be a variety of reasons students chose not to share their mathematical thinking with their peers during these lessons. For example, teachers may not have provided students adequate scaffolds for discourse that would support collective mathematical reasoning (Kazemi & Stipek, 2001). However, there may also be aspects of the emotional climate in the classroom that either inhibit or promote the rich mathematical discourse called for in newer standards. Though we have no empirical evidence of this, attribution theory would suggest students will not be motivated to share their developing mathematical thinking if they perceive a high cost to doing so (Anderman et al., 2012). Affective elements of a classroom may contribute to students feeling unsupported by their teacher or peers and, thus, limit their willingness to take academic risks, including sharing their ideas with others (Hawkins, 1997; D. K. Meyer & Turner, 2007; Turner & Meyer, 2004; Zins et al., 2007). Indeed, we see in these data that the lessons where students did not share mathematical thinking are also characterized by lower scores on the Positive Climate dimension of CLASS, indicating only muted, perfunctory evidence of relationships, positive affect, and mutual respect.
Emotional Support and Mathematical Practices
On the other hand, higher scores across the Emotional Support domain of CLASS distinguished the only lesson profile with evidence of students engaging in mathematical discourse. These data cannot provide insight as to whether the classroom learning environments in this sample causally affected students’ willingness to share their developing mathematical thinking. These findings do, however, suggest that unpacking the co-occurrence of emotionally muted learning environments and an absence of collective mathematical reasoning is an important area for future research.
Findings from the Turbulent Learning Environment, Rare Mathematical Engagement profile also raise questions about the extent to which the learning environment might be related to CCR-aligned mathematics teaching and learning in other ways. The co-occurrence of low Opportunities to Engage With Mathematics and Opportunities to Justify and Critique scores with low Behavior Management and Productivity scores indicates that when students and teachers interact in ways that are chaotic or unpredictable, students have limited opportunities for mathematical engagement. Notably, there was little evidence of productive struggle in mathematics, a key feature of CCR-aligned instruction (i.e., low scores on Depth, Prompting Student Thinking, and Responding to Student Misunderstanding).
These data provide no evidence that specific classroom learning environments inhibit or enable students’ demonstration of social and emotional competencies in service of mathematical learning. Rather, they provide early empirical evidence of the convergence of CCR-aligned mathematical engagement and safe, productive, emotionally supportive classroom environments—a relationship that many researchers have hypothesized but have not shown empirically (Charles A. Dana Center & CASEL, 2016; Rimm-Kaufman & Youngs, 2020; Zins et al., 2007). Motivation research provides lenses through which we might interpret these results. Self-determination theorists suggest that structure—explicit supports for focusing student attention and effort—is highly correlated with autonomy-supportive teaching practices that foster the persistence and self-regulation theorized to be necessary for productive struggle (Anderman et al., 2012; Jang et al., 2010; Rimm-Kaufman & Youngs, 2020). Expectancy value theorists note that chaotic mathematics classrooms might contribute to students assigning a lower value to mathematical tasks or feeling the self-regulation required for sustained mathematical engagement has too high a cost.
Teacher-Level Findings
The three distinct teacher groups in these data suggest that students in different classrooms in DCPS had divergent access to mathematically engaging learning environments. It is heartening that the largest group of teachers in this sample was classified as Supportive; these teachers’ lessons were consistently characterized as safe, productive, and often emotionally supportive and engaging. It is notable, however, that for 55% of these teachers (the Inconsistent and Orderly groups), observers never or only rarely saw evidence of high levels of Emotional Support or Student Engagement. In only two of the 125 lessons taught by teachers in the Inconsistent and Orderly groups did raters observe consistent CCR-aligned engagement.
These three distinct teacher groups make a case for differentiated supports for teachers. The fact that teachers in the Supportive group taught lessons that were categorized as a mixture of Orderly Learning Environment, Infrequent Mathematical Engagement and Supportive Learning Environment, Frequent Mathematical Engagement suggests they may need help improving the consistency of emotional and CCR-aligned mathematical support across lessons. We cannot speak to why teachers showed variability across lessons, but this is consistent with other research on classroom observations (Cohen & Goldhaber, 2016; Kane & Staiger, 2012).
Conclusion and Implications for Research and Practice
Importantly, we could not have uncovered either these instructional or teacher profiles without the use of multilevel latent profile analysis. At the lesson level, only a lesson-centered approach would have surfaced the important distinctions between the Orderly and Inconsistent learning environments. For example, given that CCR-aligned mathematical engagement was almost identical during lessons with these two very different learning environments, a more traditional variable-centered approach that focused on correlations between observation ratings would have likely shown only weak associations between the classroom learning environment and CCR-aligned mathematical engagement and would not have uncovered that there were two substantively different profiles of learning environments that occurred during lessons with Infrequent CCR-aligned mathematical engagement.
Methods such as multilevel latent profile analysis that identify common instructional patterns in lessons and their occurrence within and across teachers may prove especially beneficial to policymakers and district personnel seeking to better understand a particular instructional landscape or to move beyond a one-size-fits-all model of teacher support. Given that there was almost no evidence of high levels of emotional support or CCR-aligned mathematical engagement in lessons taught by teachers in the Inconsistent and Orderly groups, these teachers may need more intensive supports to improve the quality of both general and mathematical interactions in their classrooms. The LEAP (Leadership Excellence through Awareness and Practice) professional development program we studied in DCPS was focused more squarely on standards-aligned mathematics. These findings suggest that many teachers may have also benefited from support in cultivating emotionally supportive and engaging classrooms. We realize that providing either all-encompassing or individualized professional development is resource-intensive and logistically challenging. However, our findings provide early evidence that for teachers with observed needs, focusing on classroom environment may pay dividends in terms of students’ mathematical engagement.
We do want to caution against using such methods for teacher evaluation, which is a prominent way in which observations are used in districts. These profiles do not include the detailed guidelines and definitions of supportive, orderly, and so on, which would be needed to apply these profiles in fair and consistent ways for consequential personnel decisions. Moreover, teachers notoriously struggle to make sense of statistically complex metrics such as “teacher value-added measures,” preferring the easily interpretable raw scores gleaned from observations (Cohen & Goldhaber, 2016). These multilevel latent profile methods have numerous affordances for research but may not have the same utility for evaluation purposes.
Beyond the analytic methods, we would not have been able to detect the relationship between the learning environment and standards-aligned mathematics instruction without the simultaneous use of content-generic and mathematics-specific observation instruments. Indeed, had we only used the mathematics-specific instrument, the IPRT-M, the Inconsistent Learning Environment, Infrequent Mathematical Engagement and Orderly Learning Environment, Infrequent Mathematical Engagement profiles would have been indistinguishable. Similarly, if only a mathematics-specific tool or only a content-generic tool had been used to create instructional profiles, we would not have noticed the exclusive co-occurrence of engaging, emotionally supportive learning environments and frequent CCR-aligned mathematical engagement. Given that researchers increasingly hypothesize that content-generic aspects of teaching—such as emotionally supportive classroom interactions—and content-specific aspects—such as those laid out in the CCR standards—are interrelated, researchers and practitioners alike may need systems of measurement and support that equally privilege both dimensions of practice (Berlin & Cohen, 2018; Charles A. Dana Center & CASEL, 2016).
In the more than 400 lessons in our sample, there was never evidence of consistent CCR-aligned mathematical engagement absent an engaging, emotionally supportive learning environment. While it is impossible in these data to parse the specific relationship between classroom learning environments and CCR-aligned mathematics teaching and learning, these findings suggest that advocates of CCR mathematics teaching and learning may want to consider the potentially crucial role of less squarely “content-focused” skills. In efforts to support teachers in making the instructional shifts required for students to meet the ambitious goals outlined in CCR standards, we may well need to also support teachers in providing productive, warm, and nurturing learning environments.
Preservice teacher education programs, professional development providers, and researchers alike tend to foreground either social and emotional contexts for learning or the teaching of specific academic content, but not the two in tandem (Kochenderfer-Ladd & Ladd, 2016; Rimm-Kaufman et al., 2014). These findings suggest that rather than continuing to have separate silos of work on these two fronts, we may be well served to recognize and capitalize on the synergies between them. We need to conceptualize research programs and opportunities for teacher learning that promote emotionally supportive teaching in conjunction with rigorous, standards-aligned mathematics teaching.
Footnotes
Acknowledgements
We want to thank everyone at Student Achievement Partners for their partnership in this work. In particular, Barbara Beske spent countless hours helping us develop the mathematics measures described here. Chong-Hao Fu and his colleagues at Leading Educators also provided insight and feedback about CCR-aligned teaching in mathematics. Our many partners in DCPS were instrumental in facilitating this work, including Jason Kamras, Scott Thompson, Liz McCarthy, and Alison Williams. Bridget Hamre provided invaluable feedback on earlier versions of the manuscript. The Charles and Lynn Schusterman Family Foundation and the Overdeck Family Foundation provided generous support for this research. All opinions are solely those of the authors.
2.
This tool is used to coach thousands of teachers across the United States. Given its widespread adoption in K–12 environments, it is important to understand characteristics of classroom environments that are and are not associated with this conception of standards-aligned mathematical engagement.
3.
The IPRT scoring guide defines cursory opportunities as those that do not elicit mathematical thinking (e.g., instead of an authentic opportunity to justify or critique a peer’s reasoning, a teacher might provide a cursory opportunity saying, “Thumbs up if you agree, thumbs down if you don’t!”).
4.
The group of raters that scored using the IPRT-M was different from those that scored using the CLASS. Thus, while 19% of lessons were double scored using the CLASS, only 15% were double scored using the IPRT-M.
5.
For example, a midrange Behavior Management score on the CLASS indicates that a teacher employs a mixture of effective and ineffective behavior management strategies. In these lessons, there may be periods of chaos, though these do not last for the full lesson. Similarly, a midrange Prompting Student Thinking Score is assigned to lessons where the teacher occasionally poses questions to elicit students’ mathematical thinking. However, for the majority of the lesson, they pose questions with simple right or wrong answers.
6.
The exception was Opportunities to Engage With Mathematics. This indicator captures student opportunities to do work related to mathematics, regardless of whether it is CCR-aligned. Teachers in the Inconsistent group likely have lower scores on this indicator because instructional time was spent attending to behavior rather than on mathematics content.
Authors
REBEKAH BERLIN is a program director at Deans for Impact. Her research focuses on measurement and improvement efforts in teacher preparation.
JULIE COHEN is an associate professor of curriculum and instruction in the Curry School of Education and Human Development at the University of Virginia. She studies teachers and teaching, with a focus on policies that support the development of effective instructional practices.