
Abstract
Using unique data from California on teacher job vacancies, we investigate staffing challenges across the urbanicity spectrum, focusing on the extent to which the characteristics of rural school systems explain the differences in staffing challenges as measured by vacancy rates and emergency credentialed teachers, relative to other urbanicities. We find that rural districts have significantly and substantially higher staffing challenges than districts from different urbanicity classifications (urban, suburban, and towns). Some of these differences are explained by district-level attributes, such as the proportion of students in poverty in the district. The geography of rural districts itself also explains the high levels of staffing challenge as rural districts are more likely to be located on a state border and far from teacher education programs, both of which are strongly associated with staffing challenge measures. Even after controlling for a rich set of observable covariates, there is evidence that rural districts are still somewhat more likely to face staffing challenges, suggesting that there are unobserved aspects of being rural associated with the desirability of employment that are not readily captured by quantitative data.
Keywords
Introduction
Numerous headlines over the past few years have highlighted the difficulties that states are facing in hiring enough teachers. While these headlines sometimes paint a picture of an across-the-board “teacher shortage crisis,” in reality, teacher staffing challenges tend to be far more acute in certain subjects and for particular types of schools. 1 There is evidence that the severity of teacher staffing challenges varies across the urbanicity spectrum, with highly urban and rural school systems typically reporting greater difficulty attracting and retaining teachers compared with their typically more affluent suburban counterparts. However, much of the work investigating the relationship between geography and teacher staffing challenges 2 tends to be “metro-centric,” focusing primarily on the differences between urban and suburban schools. This research commonly ignores, or mentions only in passing, the unique labor market challenges inherent in rural school systems. 3
Rural teacher labor markets have long been identified as an important area for research (Arnold et al., 2005; Harmon et al. 2003; Programs for the Improvement of Practice, Office of Educational Research and Improvement, 1991; Stephens, 1985); there is some research evidence that rural schools have for decades faced particular challenges in adequately staffing classrooms (Azano et al., 2019; Biddle & Azano, 2016). Yet our understanding of rural school teacher labor markets is limited, which has led some to suggest that “to understand how appropriate and effective these or other [recruitment and retention] policies may prove to be, we must first develop a fuller understanding of the workings of rural teacher labor markets” (Miller, 2012a, p. 1).
One reason why rural teacher labor markets remain poorly understood is the limited availability of adequate data—an issue that plagues the development of a more nuanced understanding of teacher staffing challenges (Partelow, 2019; McVey & Trinidad, 2019). While rural districts are prominent features of many states, the number of teachers employed in those districts is often small relative to employment in urban districts. 4 Thus, many of the existing studies investigating rural teacher labor markets rely on localized case studies or nationally representative survey data, such as SASS (the Schools and Staffing Survey), 5 to gain insights into whether there are unique features of the rural teacher labor market.
To better understand the potentially distinct staffing challenges occurring in rural districts, we use district-level aggregate student, teacher, and district administrative data provided to the public by the California Department of Education (CDE) and detailed information on teacher job postings to evaluate if and how rural schools may differ across several teacher staffing challenge measures (described below). We focus on California for two reasons. First, while California is a highly urbanized state, it also has a sizeable rural student population. 6 In particular, while fewer than 35% of all districts in California are categorized as rural, it has the fifth largest rural elementary and secondary student population (345,728 students) in the country and almost the combined rural student populations of the top three rural states (by the percentage of school districts classified as rural), Vermont, Maine, and Mississippi. Second, and as we will describe further below, California districts collect robust staffing measures that enable the examination of staffing difficulties.
To address the extent to which there are differential teacher staffing challenges across different types of districts, we examine three measures constructed based on job postings: (1) various vacancy rates, that is, the total number of teacher job postings listed by a district per 100 teachers (based on full-time equivalent [FTE]) in different subject areas; (2) the proportion of late postings (the number of postings per 100 teachers [FTE] on or after August 15); and (3) the number of teachers per 100 teachers (FTE) in a district holding a limited or emergency credential (used in cases where a fully credentialed teacher cannot be hired). We use these novel measures, which are modeled as a function of district urbanicity and other characteristics thought to influence the desirability of district employment, as well as measures that help define teacher labor markets, such as the distance between districts and teacher education programs (TEPs) and whether districts are on state borders. 7
We find that there are consistent and sizeable differences in the degree to which rural districts face teacher staffing challenges. They have, for instance, significantly higher vacancy rates than districts classified as a different urbanicity (urban, suburban, and towns), and the differences are substantial; on average they have an additional 10.4 vacancies per 100 full-time teachers and 3.8 more emergency credentialed teachers per 100 full-time teachers relative to suburban districts. Some of these differences are explained by district-level attributes that are commonly associated with staffing challenges, such as the proportion of students in poverty in the district. We also find that these districts’ geography itself is associated with staffing challenges as they are more likely to be located on a state border and far from TEPs. However, even after controlling for a rich set of district-level covariates, rural districts are still more likely to face staffing challenges, suggesting that there are aspects of being rural associated with the ease of attracting and recruiting teachers for which observable characteristics cannot fully account.
Background Literature
With the widespread attention focused on securing teacher talent in school systems throughout the United States, policymakers and researchers alike have looked to the large and growing body of research on teacher recruitment and retention for insights toward addressing school staffing challenges, as well as for identifying areas for further study. 8 Generally, the extant literature has found that the most disadvantaged schools have particularly acute problems with both attracting and retaining qualified teaching candidates. For instance, a number of studies have found that schools with higher proportions of low-income, minority, and low-achieving students struggle the most with teacher staffing—a trend further exacerbated in high-need subject areas (i.e., “shortage areas”) (Clark et al., 2013; Sutcher et al., 2016).
In their review of the evidence concerning teacher recruitment and retention, Loeb and Myung (2020) discuss the range of factors that affect teacher supply and demand—factors that ultimately contribute to the composition of the teacher workforce and help explain why certain schools experience varying degrees of staffing challenges. More specifically, they highlight the evidence supporting the importance of teachers’ relative wages (Bacolod, 2007; Marvel et al., 2007; Murnane & Olsen, 1990), working conditions (Boyd et al., 2005b; Hanushek et al., 2004; Marvel et al., 2007), and early career experiences (Farkas et al., 2000; Johnson & Birkeland, 2003); district human resource and administrative policies (Hanushek, 1998; Levin et al., 2005); as well as other factors that influence the migration of teachers toward or away from particular school settings (or attrition from the profession entirely).
It is also evident from the literature that geography plays a significant role in the distribution of teachers: Urban and rural districts tend to have more pronounced staffing difficulties (Cowan et al., 2016; Foreman, 2018; McVey & Trinidad, 2019). This may be a natural consequence of the highly localized nature of the teacher labor market (Boyd et al, 2005a; Dee & Goldhaber, 2017; Loeb & Myung, 2020; Reininger, 2012). For instance, Boyd et al. (2005a) show that approximately 85% of teachers in New York took their first job in a district within 40 miles of their hometown. If rural districts produce fewer eventual teachers, then there will be fewer local teachers to return and teach in their schools. And Goldhaber et al. (2019) found that there are important geographic connections between districts and TEPs related to the hosting of student teachers (i.e., teacher candidates in training). In particular, TEPs tend to work with geographically proximate districts in student teacher placements, and many districts end up hiring teacher candidates who did their student teaching in the same district. This too might drive hiring difficulties for rural districts.
A number of researchers have pointed out that many of the studies connecting school location and teacher staffing issues focus primarily on the differences between urban and suburban schools and tend to overlook the unique labor market challenges inherent in rural school systems (Hammer et al., 2005; Miller, 2012a, 2012b; Monk, 2007). Indeed, there are relatively few studies examining whether there are distinct characteristics of rural teacher labor markets; more specifically, there is a lack of studies investigating how recruitment and retention may vary in more rural settings. Moreover, the studies that do focus on rural teacher recruitment and retention tend to use less rigorous methods, perhaps in part due to the small sample sizes inherent in this work (Miller, 2012b). It is also notable that a number of the studies that conduct reviews of the literature on rural-specific teacher recruitment and retention have a tendency to draw from findings derived from non-rural-specific studies.
Both Monk (2007) and Miller (2012b) note that one of the first issues inhibiting analysis of rural labor markets is the lack of a consistent definition for what constitutes a rural area. The most common practice for government agencies and researchers from various sectors has been to define “rural” simply as “nonurban” or “other than urban.” 9 As definitions of “rural” vary both across time and across government agencies, which are often the primary source of urbanicity data used in research, it becomes far more complicated to compare findings across studies and to track trends over time (Miller, 2012a). 10
Findings from the rural-specific literature suggest that several factors thought to affect staffing difficulties in more urban settings seem to similarly affect rural districts. Rural-specific studies typically found that lower relative pay, difficult working conditions, accountability reforms, and added licensure requirements contribute to increased difficulty staffing classrooms.
For instance, a 2004 report by the U.S. Government Accountability Office highlighted the results of a survey of rural superintendents, who indicated that their (in)ability to offer competitive salaries was a significant inhibitory factor in terms of securing qualified teachers. Examining staffing trends in Texas, Jimerson (2004) found that rural teachers were much more likely to be observed teaching “out-of-field.” Lazarus (2003) reports a similar finding from Minnesota, where rural teachers were found to be teaching out-of-field or under an emergency waiver at nearly double the rate of nonrural teachers (9% vs. 5.2%). Hammer et al. (2005) discuss the burden that teaching multiple subjects and/or teaching out-of-field places on teachers; teachers with these types of assignments typically must develop cross-subject lesson plans and will likely need to take and pass multiple licensure exams and fulfill additional requirements.
Unique to the rural-specific literature are findings related to the effects of isolation and lack of access to community amenities as factors that discourage teachers from seeking employment in rural areas. Gritz and Theobald (1996) found that teachers placed in schools more than 30 miles from an urban area were more likely to leave their schools than teachers more closely situated. Cowen et al. (2012) observed that teachers teaching in the highly rural Appalachian region of Kentucky were more likely to exit the teaching profession but less likely to transfer between districts than teachers located elsewhere in the state. All of these studies suggest that teacher staffing is more challenging in rural districts. However, to our knowledge, there are no studies that rely on rich staffing challenge measures, such as those we described above, to examine this issue directly.
Data and Analytic Approach
Data
The data used in this study come primarily from two sources, the CDE and Edjoin, an organization that assists the vast majority of California school districts with listing of education job position openings. The CDE provides publicly available district-level longitudinal administrative data, which we use to provide information on student and teacher characteristics as well as other district-level characteristics. 11 We then link the CDE administrative data (which span the academic years 2013–2014 to 2018–2019) to a unique job posting data set provided by Edjoin (posting data span July 2014 through December 2018). 12
The Edjoin data include detailed district-level information on job postings, including the position posting date, the title of the position, whether the position is full-time or part-time, as well as a number of other descriptive elements related to the various openings. 13 Edjoin is used by about 85% of school districts in California. 14 Figure 1 displays a map of the districts represented by these data, separated into their respective urbanicity categories. 15 Districts without Edjoin vacancy data are indicated by a crosshatch symbol.

Analytic sample of California school districts (by urbanicity).
Using the above sources of data, we construct three measures designed to assess the landscape of staffing challenges in California. First, for each district, we create a measure of the vacancy rate, which is the number of teaching position vacancies listed by a district in a year divided by the number of full-time equivalent teachers in that year. The Edjoin data also contain a measure for the number of openings associated with a position. However, this measure is not consistently utilized by districts. Therefore, each posting is treated as a single opening. This assumption appears valid following a review of the posting data, which suggests that the number of postings observed in a given year largely comports with the number of vacancies one would expect across the state in that year. For instance, national trends in teacher attrition and mobility as reported by NCES (Kena et al., 2016) suggest that roughly 8% of teachers exit the profession and another 3.2% switch districts each year, which equates to an annual district vacancy rate (assuming no change in enrollment) of approximately 11.2%. There were about 296,000 teachers in California during the 2016–2017 school year, of which roughly 280,000 teachers were in the districts covered by Edjoin. One would expect then roughly 31,360 vacancies (11.2% of 280,000), and the Edjoin data show 32,567 postings associated with that year. 16
In some specifications, described below, we also use vacancy rates for teachers in areas designated by the state as high need (i.e., the high-need vacancy rate in areas like special education and science).17,18 We also generate a measure to capture districts’ posting vacancies late in the year. While it is not clear whether late postings would occur as a result of staffing challenges, poor forecasting of staffing needs, or other factors, late postings are generally seen as less than ideal for administrators, prospective teachers, and students. There is some evidence that teachers hired late in the year are more likely to have higher rates of attrition (from both their schools and the profession) and lower performance. Given the potential importance of late hiring for school operations and teacher retention and performance (Engel, 2012; Jones et al., 2011; Keo et al., 2020; Levin & Quinn, 2003; Liu & Johnson, 2006; Papay & Kraft, 2016), we include a measure of “late postings,” defined as those that occur from August 15 through the end of December, as many schools in California start in mid-August and (as we describe below) hiring occurring after December is likely to be for the following school year (Liu & Johnson, 2006). We use late postings to calculate a late vacancy rate, which is the number of district vacancies that occur in the late hiring window. 19
Our final measure of staffing challenge is based on teachers being hired with intern, permit, or waiver teaching credentials. To hire teachers with these categories of credentials—henceforth “emergency” credentials—districts must perform a search for a qualified candidate, and if they are unable to secure such a candidate, they must document that there was a teaching position that they were unable to fill, and then they can request state permission to proceed to hire applicants who meet the criteria for intern, permit, or waiver credentials (in that order). 20 For each district, we calculate the emergency credential rate as the number of district teachers hired with an emergency credential divided by the total number of teachers in the district. 21
We use each of the above measures of staffing challenge that districts face to assess the degree to which there are differences across urbanicity, but we also want to account for the aspects of districts that may be associated with urbanicity (e.g., the achievement level of students) but are not directly related to the urbanicity of those districts. Thus, we supplement the data from the above sources with data from several additional sources to generate controls that we believe may help explain the potential hiring difficulties faced by districts. Geospatial data from the Integrated Postsecondary Education Data System and U.S. Census Bureau geographic information system data allow us to examine the effects of (a) being located on the state’s borders with Arizona, Nevada, or Oregon and (b) the proximity (in miles) of the district to a TEP. 22 County-level data from the U.S. Department of Housing and Urban Development and the U.S. Congress Joint Economic Committee have been added to examine the role other factors may play in teacher recruitment and retention— like the proportion of single-parent families, per capita violent crime, unemployment rates, and average housing price. 23
Finally, we restrict our sample to listings associated with teacher vacancies that can be linked to California public school districts. 24 This results in a sample of 3,534 district-year observations (894 unique school districts) between the years 2014–2015 and 2017–2018. Table 1 provides district-level mean characteristics for the analytic sample for the 2014–2015 school year, across urbanicity categories. As shown in Table 1, rural schools differ from other school settings along several different dimensions. For instance, reflective of findings from other research (Gagnon & Mattingly, 2012; Miller, 2012a; Monk, 2007), compared with schools in urban and suburban districts, rural schools tend to be less racially diverse (both students and teachers), have a slightly less experienced teacher workforce, and have fewer teachers with advanced degrees. Perhaps surprisingly, we find that a greater proportion of rural districts, and especially districts classified as “towns,” have higher proportions of students in poverty relative to urban districts. This is consistent with Malhoit (2005), who found that of the 250 poorest counties in the United States, 244 are classified as rural. In addition, it is clear from examining the more detailed geographic codes (available on request) that the disproportionate student and community poverty found in “towns” is driven by the more “remote towns” (those considered fringe and remote) or, in other words, by towns that are more similar to rural districts. 25 We also see evidence that they are more likely to face teacher staffing challenges. Table 1 suggests that rural districts have higher overall vacancy rates, though somewhat lower high-need and late vacancy rates, and more than double the emergency credential rates compared with urban and suburban districts.
Summary Statistics (2014–2015 School Year)

Note. FRPL = free/reduced-price lunch; ELL = English Language Learner (includes current or formerly); TEP = teacher education program; FTE = full-time equivalent; ELEM = elementary; STEM = science, technology, engineering, and mathematics; SPED = special education; IEP = Individualized Education Program.
Vacancy rate, high-need vacancy rate, non-high-need vacancy rate, late vacancy rate, and emergency credential rate are each calculated based on the frequency of the said vacancy type/emergency credential divided by the total teacher FTE within a district divided by 100—that is, Rate = Total vacancies/(Total teacher FTE/100).
Analytic Approach
We begin by providing a descriptive portrait of how school districts compare in terms of the magnitudes of the staffing challenges they face over the course of each school year. But to get a more detailed sense of the relationships between district characteristics and the magnitude of staffing challenges, we estimate a series of district-level regression models that allow us to better disentangle how certain observable district characteristics may be associated with staffing challenges and how they might help explain any differences across urbanicity. 26
In particular, we estimate linear models of the following form:

The dependent variable, VACANCY
d
, is one of four variables: (1) vacancy rate, defined as the number of vacancies per 100 teachers (FTE); (2) high-need vacancy rate, which is the number of vacancies in high-need subject areas per 100 teachers (FTE);
27
(3) late vacancy rate, or the number of vacancies per 100 teachers (FTE) posted on or after August 15 through the end of December; or (4) emergency credential rate, defined as the number of alternatively credentialed teachers per 100 teachers (FTE). Our variables of interest are the urbanicity of districts, defined as rural, town, or urban (with suburban as the reference category). In progressive models, we control for vectors of student
We also estimate Equation 1 separately by whether or not a teaching position has been reported by California as being a hard-to-staff/shortage position in one or more years of our data. This will allow us to test the degree to which the magnitude of staffing challenge in different teaching specialty areas, such as special education, might differ across urbanicity. Our expectation given the extant literature is that there will be differences across urbanicity in staffing challenges in general, but as we described above, staffing challenges vary across teaching subject areas, and this is also related to the geography of teacher preparation as TEPs sometimes specialize in particular subjects.
Last, given concerns regarding endogeneity between posting patterns and the size of existing teacher workforces, we also explored the same set of models described above but instead used student enrollment as the denominator (vacancies per 1,000 students). The results of these models (available on request) are qualitatively similar to results we now describe below.
Results
A Descriptive Portrait of Staffing Challenges by District Type
We begin with a descriptive look at how staffing challenges differ across district types. Figure 2 provides a visualization of hiring patterns throughout the year for the four urbanicity categories (rural, town, suburban, and urban) for the years for which we have complete vacancy data (i.e., 2014–2015, 2015–2016, 2016–2017, and 2017–2018). For each month throughout the year, rural schools tend to have more vacancies than the other urbanicity categories, and the vacancy rates are at least twice as high as urban district vacancy rates during the spring and summer months of March through August.

Vacancy rate by month and urbanicity.
While rural districts have higher vacancy rates overall and at nearly all points of the calendar year, vacancy postings are lowest after the start of the school year (September through January), suggesting that rural districts are not particularly more likely than other categories of districts to post vacancies late. Thus, it does not appear that rural districts are disproportionately likely to be affected by late hiring. This is perhaps heartening given the evidence (mentioned above) that late hires may be of lower quality and less likely to remain in their schools and districts.
In Figure 3, we examine how relative staffing needs vary across urbanicity by subject area. We take the total number of vacancies observed within a subject area and divide this by the total FTE of teachers in the subject area. We draw a horizontal line at 1, at which point the ratio of total subject-specific postings to total subject-specific FTE shows the expected distribution of need should no subject-specific shortages exist. If the ratio is higher than 1, a district would have a larger than “expected” need for teachers in that area. The bars in the graph show the 95% confidence intervals around our estimates. Across all urbanicity categories, the two highest relative-need subject areas are special education and ELL, but rural districts appear to have a relatively higher need in special education. 32 That school systems appear to have a greater need for teachers in certain subject areas, particularly in known shortage areas, is not surprising given that this finding largely corroborates existing evidence from other analyses in California (Carver-Thomas & Darling-Hammond 2017; Ondrasek et al., 2020; Sutcher et al., 2019).

Relative need ratio by subject area and urbanicity.
In Figure 4 we show the differences across districts in the number of emergency credentialed teachers per 100 FTE teachers. We see that rural districts have almost three times the emergency credential rate relative to suburban districts and roughly two times the rate for urban districts (8.3, 2.9, and 4.2, respectively). This suggests that even when rural districts are able to fill vacancies, they are doing so with emergency credentialed teachers at much higher rates than other school types
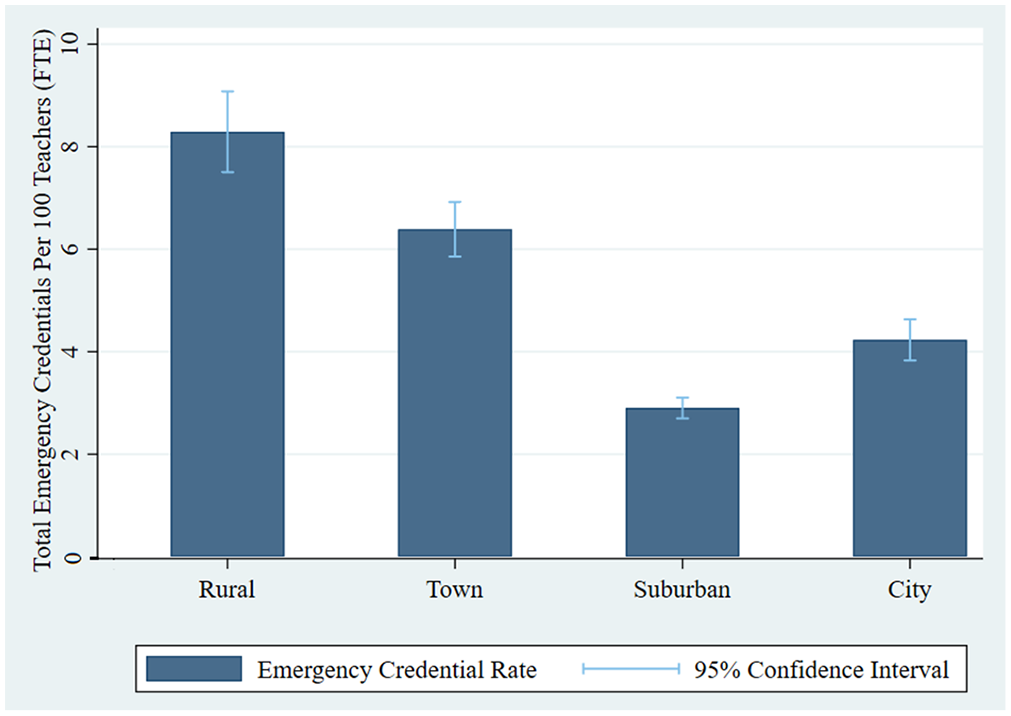
Emergency credential rate by urbanicity.
Explaining Staffing Challenges Across District Types
The above evidence clearly indicates that rural school districts tend to face greater staffing challenges than other types of districts, but it does not explain why. In Table 2, we present regression coefficients from ordinary least squares models predicting the number of vacancies as a function of district characteristics. 33 These regressions allow us to assess the degree to which district factors, such as the type of students served in the district, are correlated with staffing challenges. We begin (in column 1) by only including urbanicity (with year fixed effects and a control for no postings), so as to see the baseline measures that reflect the figures described above and so we can compare how these change when we progressively add student (column 2), teacher (column 3), district (column 4), and county (column 5) controls.
Vacancy per 100 Teachers (FTE) Versus District Characteristics

Note. All the models include year fixed effects and a control for no postings for the year(s) the district does not appear to have vacancies. Columns 2 to 5 add lagged student controls for the percentage of students eligible for free or reduced-price lunch, the percentage of students with Individualized Education Programs, the percentage of students who are English Language Learners, and mean math achievement. Columns 3 to 5 add lagged teacher controls for mean years of experience for teachers in the district, the percentage of teachers with a master’s degree or higher, and the percentage of non-White teachers. Columns 4 to 5 add district controls that include border district status, log of the distance to the nearest TEP in miles, and total district enrollment. Column 5 adds country controls for average monthly housing price, the percentage of children with a single parent, violent crimes (per 100,000), and unemployment rate. TEP = teacher education program; FTE = full-time equivalent.
p < .05. **p < .01. ***p < .001.
Across each of the models, relative to suburban districts, rural districts exhibit significantly more vacancies. As we add covariates into the model, the difference between rural and suburban district vacancy rates decreases in magnitude but remains statistically significant. In particular, the point estimates suggest that rural districts have an additional 10.4 vacancies per 100 teachers in the models with no controls (column 1) and 8.7 vacancies per 100 teachers in the models with student controls (column 2). Last, when we include vectors of teacher, district, and county characteristics, the higher vacancy rate of rural districts relative to suburban shrinks to 7.5 vacancies per 100 teachers. As shown in column 4, there is a consistently strong positive relationship between border district and vacancies, which is consistent with the notion that state-level licensure, tenure, and pension systems inhibit the cross-state mobility of teachers (Goldhaber et al., 2015). The results also suggest that as distance to TEPs increases, so does the vacancy rate. Again, this is not surprising given that student teachers are likely to be placed near TEPs (Krieg et al., 2016), and districts’ hosting student teachers is associated with reductions in the need to rely on emergency credentialed teachers (Goldhaber et al., 2019). That said, none of these models explains much of the variation in vacancy rate (with R2 statistics at most .039). Interestingly, while urban schools are often thought of as settings where hiring challenges exist, this particular measure suggests that urban districts have relatively less difficulty hiring.
In additional specifications (not reported but available on request), we include controls for beginning and average teacher salary and the basic-aid 34 status of districts. In these specifications, the coefficient on rural districts is greatly diminished, which is what one would expect if districts are responding to staffing challenges by, for instance, raising beginning salaries. 35 This highlights why these variables are likely to be endogenous, given that, for instance, a response to challenges in teacher hiring might be to raise salaries.
Tables 3 to 5 maintain the same structure and content of covariates as in Table 2 but replace vacancy rate with the high-needs area vacancy rate (Table 3), late-postings rate (Table 4), and emergency credential rate (Table 5). Focusing first on the relationship between urbanicity and high-need vacancy rate, 36 we see that the general patterns remain consistent with those discussed above for vacancies in general but the magnitude of the relationships has shrunk. Indeed, in these models, we find that there are no significant differences in the vacancy rates of high-need teachers between suburban districts and other types of districts, though it is important to note that they are less precisely estimated than those in Table 2.
High-Need Vacancy Rate per 100 Teachers (FTE) Versus District Characteristics
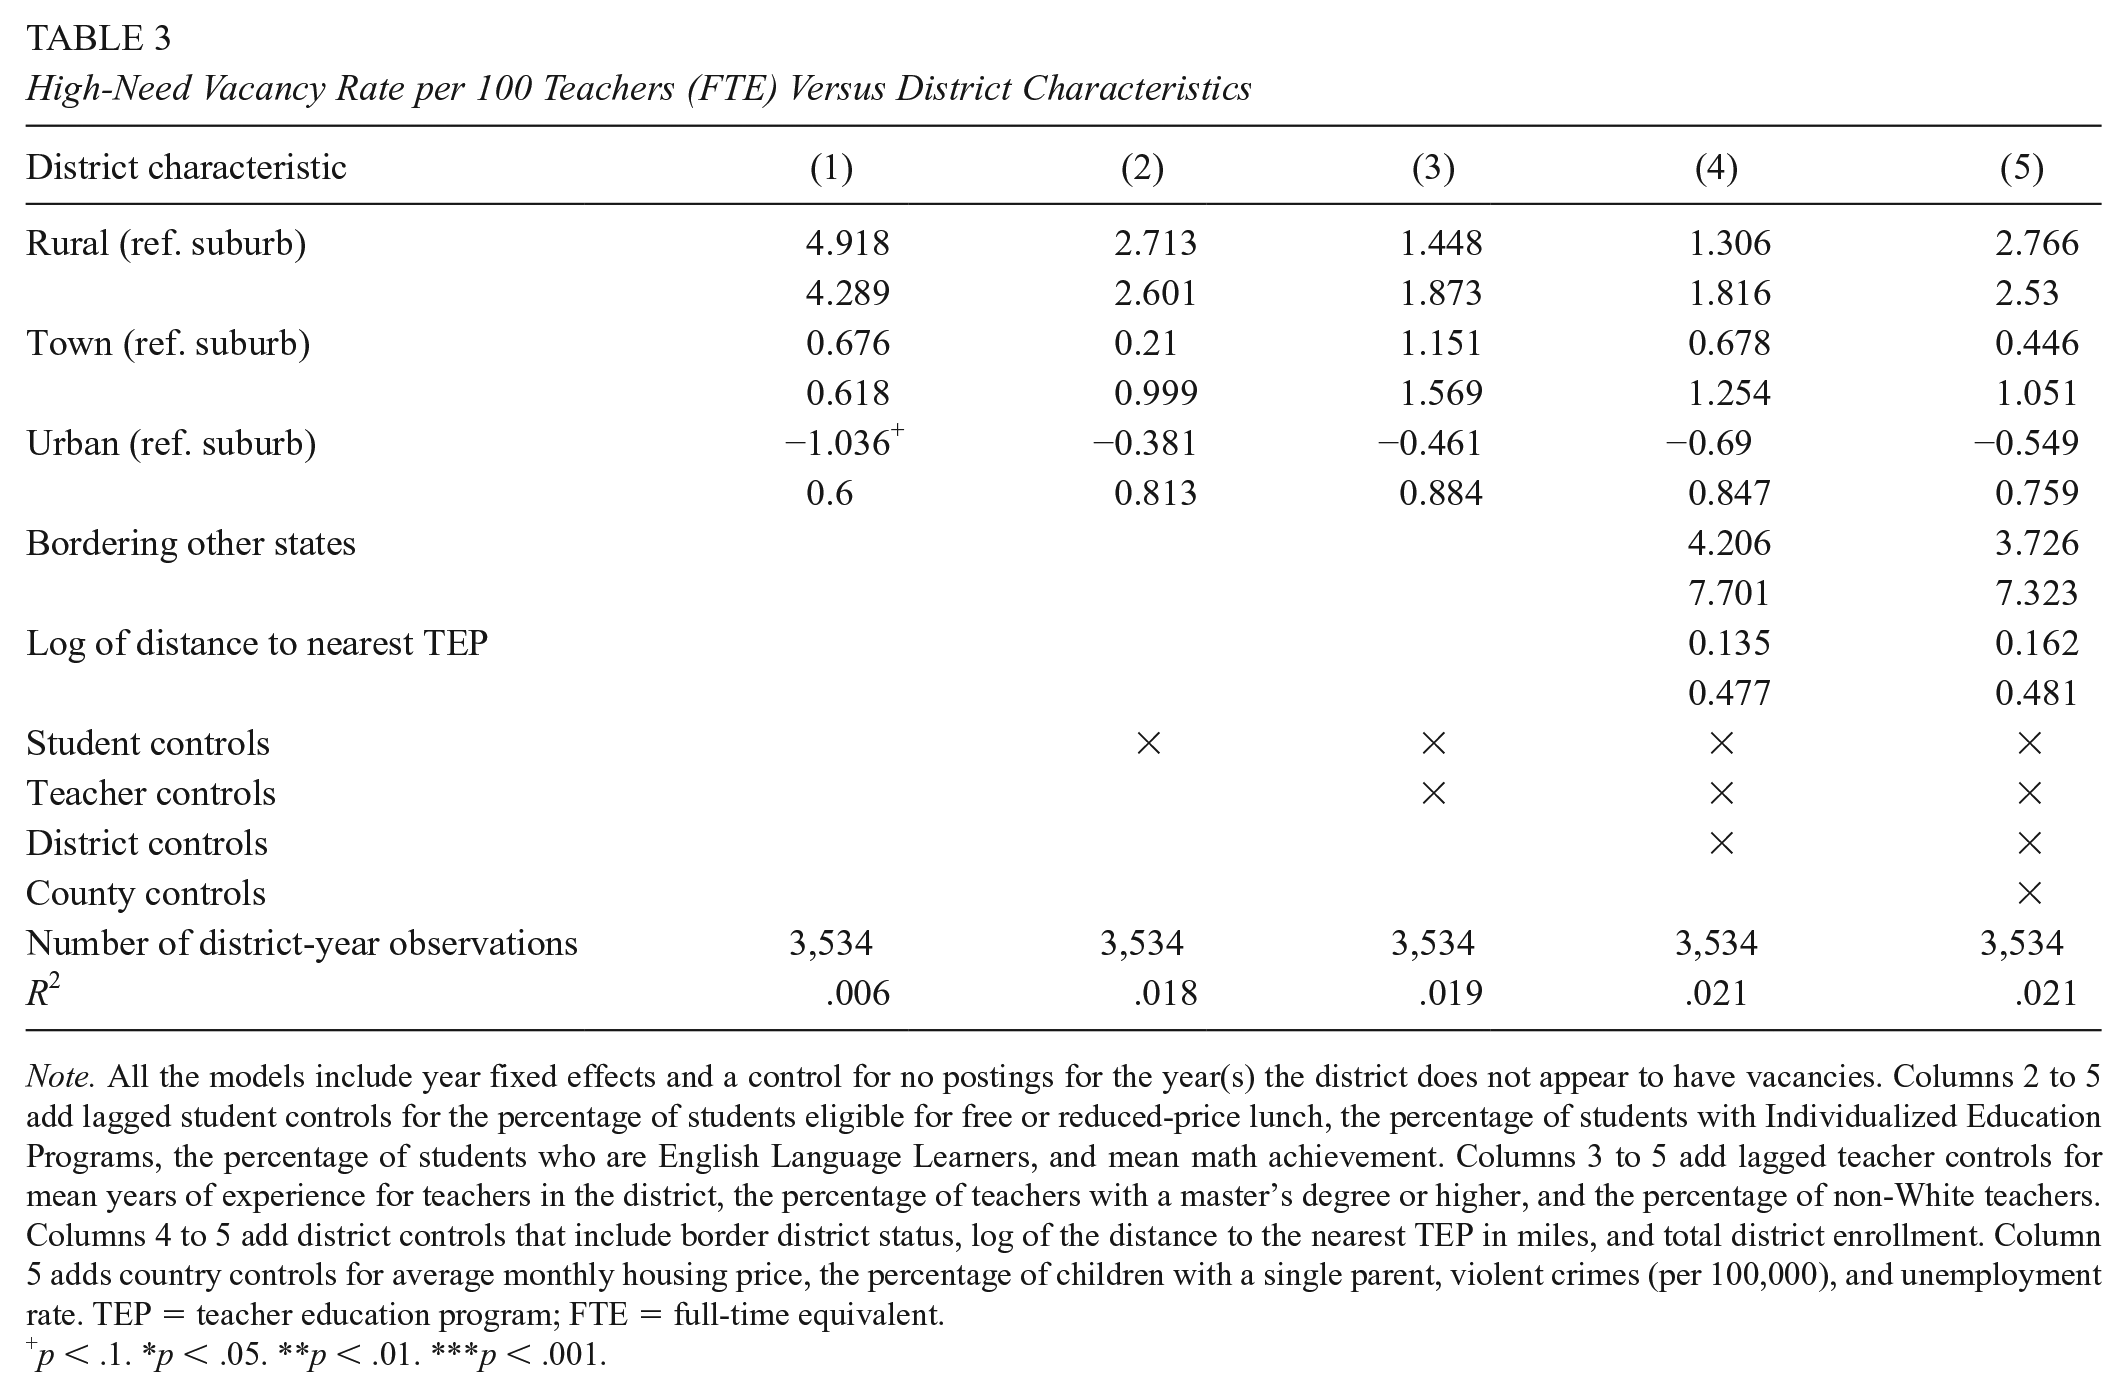
Note. All the models include year fixed effects and a control for no postings for the year(s) the district does not appear to have vacancies. Columns 2 to 5 add lagged student controls for the percentage of students eligible for free or reduced-price lunch, the percentage of students with Individualized Education Programs, the percentage of students who are English Language Learners, and mean math achievement. Columns 3 to 5 add lagged teacher controls for mean years of experience for teachers in the district, the percentage of teachers with a master’s degree or higher, and the percentage of non-White teachers. Columns 4 to 5 add district controls that include border district status, log of the distance to the nearest TEP in miles, and total district enrollment. Column 5 adds country controls for average monthly housing price, the percentage of children with a single parent, violent crimes (per 100,000), and unemployment rate. TEP = teacher education program; FTE = full-time equivalent.
p < .1. *p < .05. **p < .01. ***p < .001.
Late Vacancy Rate per 100 Teachers (FTE) Versus District Characteristics

Note. All the models include year fixed effects and a control for no postings for the year(s) the district does not appear to have vacancies. Columns 2 to 5 add lagged student controls for the percentage of students eligible for free or reduced-price lunch, the percentage of students with Individualized Education Programs, the percentage of students who are English Language Learners, and mean math achievement. Columns 3 to 5 add lagged teacher controls for mean years of experience for teachers in the district, the percentage of teachers with a master’s degree or higher, and the percentage of non-White teachers. Columns 4 to 5 add district controls that include border district status, log of the distance to the nearest TEP in miles, and total district enrollment. Column 5 adds country controls for average monthly housing price, the percentage of children with a single parent, violent crimes (per 100,000), and unemployment rate. TEP = teacher education program; FTE = full-time equivalent
p < .1. *p < .05. **p < .01. ***p < .001.
Emergency Credentials per 100 Teachers (FTE) Versus District Characteristics

Note. All the models include year fixed effects and a control for no postings for the year(s) the district does not appear to have vacancies. Column 2 to 5 add lagged student controls for the percentage of students eligible for free or reduced-price lunch, the percentage of students with Individualized Education Programs, the percentage of students who are English Language Learners, and mean math achievement. Columns 3 to 5 add lagged teacher controls for mean years of experience for teachers in the district, the percentage of teachers with a master’s degree or higher, and the percentage of non-White teachers. Columns 4 to 5 add district controls that include border district status, log of the distance to the nearest TEP in miles, and total district enrollment. Column 5 adds country controls for average monthly housing price, the percentage of children with a single parent, violent crimes (per 100,000), and unemployment rate. TEP = teacher education program; FTE = full-time equivalent.
p < .1. *p < .05. **p < .01. ***p < .001.
Consistent with the descriptive portrait of late hiring in Figure 2, in Table 4 we find no evidence that rural districts are significantly more or less likely than other districts to post vacancies late in the hiring cycle (between August 15 and the end of the calendar year). At first blush, this is inconsistent with the above evidence that rural districts have more severe staffing challenges, but it may be that late hiring is more a phenomenon associated with the provisions in collective-bargaining agreements. For instance, urban districts are more likely to have collective-bargaining agreement provisions requiring that candidates for a position who are internal to a district get the first shot at a new job opening; that is, districts cannot post a job for external applicants before a set date by which internal (transfer) candidates have availed of the first chance at the job (Marianno et al., 2018; Strunk, 2012).
Last, Table 5 presents the results for the same set of models as above, this time examining the emergency credential rate, or the number of teachers teaching with alternative credentials per 100 teacher FTE. As we showed earlier in Figure 4, here we find that rural districts have more emergency-credentialed teachers than suburban districts as well as urban districts. Whereas in our fully specified model, rural districts have approximately 1.5 additional emergency-credentialed teachers per 100 FTEs relative to suburban districts and only about 0.5 additional credentialed teachers per 100 FTEs relative to urban districts. There is also evidence that districts that are farther from a TEP have higher emergency credential rates.
Policy Implications and Conclusions
Numerous headlines over the past few years have highlighted the difficulties that states are facing in hiring enough teachers. But while there is a plethora of evidence about the factors that influence teacher retention and staffing challenges in population-dense school systems, there is relatively little quantitative evidence about rural teacher labor markets. The evidence we present shows that rural districts do indeed have greater teacher staffing challenges than districts in other urbanicities; on average, rural districts have meaningfully and statistically higher overall vacancy rates than districts in any of the other geographic types, and they hire more emergency-credentialed teachers. This does not translate across all measures of staffing challenge; we see no statistically significant differences in vacancy rates for high-need teachers or late hires.
In our regression models exploring the reasons why rural districts face greater staffing challenges, we find that the differential in staffing challenge between rural districts and other urbanicities is reduced with the addition of controls for the type of students served by districts; the demographics, education, and experience levels of employed teachers; and other school district and community factors that might influence the desirability of teaching in a particular district.
However, these observable characteristics measured in the data do not account for all or even most of the difficulties rural school districts face in attracting teachers. Simply being located in rural settings, and thus far from urban centers, likely contributes to staffing challenges in schools in rural districts. 37 For instance, rural communities tend to have fewer resources, such as shopping and dining options, and more limited access to medical services (Block, 2006; Miller 2012b; Monk, 2007). 38 To that end, Miller (2012b) shows that working conditions specific to rural areas, such as a lack of community amenities that stems from being far from urban centers, cause teachers to be less likely to choose to work in rural settings.
Moreover, a general lack of early-childhood initiatives (Provasnik et al., 2007; Showalter et al., 2017) and disproportionately older, aging populations (Monk, 2007) may not be appealing to new entrants to the teaching profession interested in advancing their careers and starting families. 39 These differences are potentially meaningful for teachers, who prefer working close to where they grew up (Reininger, 2012) but may find better opportunities in urban and suburban areas, where there is greater demand for teachers and better resources (Monk, 2007; Reininger, 2012; Showalter et al., 2017). Together, these are socially appealing amenities that younger, newer entrants to the labor market may care about and thus may contribute to whether a teacher decides to seek employment in a rural school system. Factors such as these may explain why there is still some evidence that rural districts have greater staffing challenges, even after controlling for a rich set of covariates.
While it is outside the scope of our article to explore whether the relatively larger staffing challenges in rural districts are related to difficulties with retention or recruitment (or both), other evidence suggests that rural retention rates are not very different (1% to 3% higher) from those in other urbanicities (e.g., NCES, 2013). This implies that recruitment may be the primary staffing challenge. As such, our results suggest some broad implications for local and state policymakers who are trying to staff their schools with high-quality teachers. For instance, the research discussed above has shown that the teacher labor force is extremely local (e.g., Boyd et al., 2005a; Reininger, 2012) and, moreover, where student teaching occurs is predictive of district and school employment (Krieg et al., 2016) and of the employment of teachers with emergency credentials (Goldhaber et al., 2019).
Distance to TEPs, or more generally where teacher candidates receive their primary preservice teacher education, and where student teaching occurs are malleable factors. Given this evidence, it is worth considering how to increase the preparation of teachers near rural areas. In the case of student teaching placements, it may be possible to alleviate the challenge large distances could create for university supervisors charged with overseeing student teaching through the use of new technologies. 40
School districts also have greater freedom under the Every Student Succeeds Act (ESSA) (Pub.L. 114–95, 2015) to make use of teacher academies and “grow your own” teacher development programs to create new pipelines for teacher candidates to enter the teacher workforce. California recently formulated plans to expand both grow-your-own and targeted recruitment and retention initiatives aimed at addressing staffing challenges in rural schools (Lambert, 2020).
But rural districts in California also often face the problem that they border other states and mobility across state lines is hampered by state-specific licensure, tenure, and pension rules (Goldhaber et al., 2015); indeed, 17 of the state’s 26 districts on the California border are rural (the other nine are towns). Encouraging greater interstate mobility through, for instance, enhanced licensure reciprocity could thus also benefit rural districts disproportionately.
Policymakers may also want to consider incentives to help recruit teachers and retain them in remote locations. An obvious mechanism is salary incentives. Extant research suggests that both higher pay levels and return to early experience can help attract and retain teachers (e.g., Cowan & Goldhaber, 2018; Grissom & Strunk, 2012). Beyond salaries, Miller (2012b) outlines other forms of compensation that may help attract teachers to rural areas. For instance, he found that beginning teachers are more likely to work in rural districts if they have more shopping venues. By working to improve the community amenities available in rural areas, policymakers can make them more attractive to potential teachers (and other employees).
We are not naive about the challenges inherent in any of these proposed solutions, though some may be more difficult than others. However, nearly 20% of our nation’s students are educated in rural districts (NCES, 2014). It is critical for policymakers to focus on how to better attract teachers and retain them in rural areas, thus ensuring that rural students have access to, at a minimum, a base quantity of qualified teachers and, ideally, to enough high-quality teachers to provide them the education they deserve.
Footnotes
Acknowledgements
This research utilizes data collected and maintained by the CDE, Edjoin, the U.S. Congress Joint Economic Committee, and the U.S. Department of Education. We wish to thank Jonathan Isler, Ryan Welch, and Thomas Bjorkman at the CDE for providing data and fielding questions. Similarly, we wish to thank Joshua Michaels and Gary Flores at the San Jaquin County Office of Education for their assistance with questions related to the Edjoin data. We also thank Andrew Katz, Paul Bruno, and Andrea Chamber for excellent research assistance. This research was supported by the National Center for Analysis of Longitudinal Data in Education Research (CALDER), which is funded by a consortium of foundations. For more information about CALDER funders, see ![]() . We also gratefully acknowledge the funders of the Getting Down to Facts II research: Bill and Melinda Gates Foundation, Dirk and Charlene Kabcenell Foundation, Haas, Jr. Fund, HeisingSimons Foundation, S.D. Bechtel, Jr. Foundation, Silver Giving Foundation, and Stuart Foundation. Any opinions, findings, and conclusions expressed in this article are those of the authors and do not necessarily reflect the views of the data providers. Any errors are attributable to the authors.
. We also gratefully acknowledge the funders of the Getting Down to Facts II research: Bill and Melinda Gates Foundation, Dirk and Charlene Kabcenell Foundation, Haas, Jr. Fund, HeisingSimons Foundation, S.D. Bechtel, Jr. Foundation, Silver Giving Foundation, and Stuart Foundation. Any opinions, findings, and conclusions expressed in this article are those of the authors and do not necessarily reflect the views of the data providers. Any errors are attributable to the authors.
Notes
Authors
DAN GOLDHABER is a vice president at the American Institutes for Research and an affiliate professor/director at the Center for Education Data & Research at the University of Washington. Dr. Goldhaber’s work focuses on issues of educational productivity and reform at the K–12 level, including the broad array of human capital policies that influence the composition, distribution, and quality of teachers in the workforce, and the connections between students’ K–12 experiences and postsecondary outcomes.
KATHARINE O. STRUNK is a professor and codirector at the Education Policy Innovation Collaborative at Michigan State University. Dr. Strunk’s research is focused on three areas under the broad umbrella of K–12 education governance: teachers’ unions and the collective bargaining agreements they negotiate with school districts, teacher evaluation and compensation, and accountability policies.
NATE BROWN is a research manager at the Center for Education Data & Research at the University of Washington. Nate’s work examines teacher labor markets, teacher licensure, and international comparative education.
NATSUMI NAITO is a data analyst at the Center for Education Data & Research at the University of Washington. Her research interests include teacher education and preparation, geography of education, and teacher labor markets.
MALCOLM WOLFF is a PhD student in statistics at the University of Washington. His current work assesses the predictive validity of teacher candidate letters of recommendation free-form application text on future classroom performance outcomes using natural language processing and statistical learning.