
Abstract
The U.S. Department of Education’s School Climate Survey (EDSCLS) is a free, open-source school climate survey available for any local or state education agency to use to measure three domains of school climate: engagement, safety, and environment. The present study leverages EDSCLS data from 3,416 students from 26 middle and high schools in Washington, DC to confirm the factor structure of the survey using both single-level and multilevel confirmatory factor analyses. At the individual level, our findings paralleled those from the original validation study conducted by the U.S. Department of Education. At the school level, our findings suggested a simpler factor structure for the engagement and environment domains, and could not identify a reasonable well-fitting model for the safety domain. Particularly, as more states are considering school climate measurement for accountability systems, these findings suggest that simply using the individual-level structure may not yield valid measurement.
Schools, districts, and states are increasingly recognizing the need to improve school climates to promote the academic, social, and emotional well-being of students (Jordan & Hamilton, 2020; Temkin & Harper, 2018; Thapa et al., 2013; Wang & Degol, 2016). Many states, for instance, included references to school climate within their implementation plans for the Every Student Succeeds Act, and at least six states include school climate measurement as an accountability metric (Jordan & Hamilton, 2020; Temkin & Harper, 2018). Improving school climate, let alone using school climate for accountability purposes, requires the ability to validly and reliably measure school climate. Although there are a multitude of available surveys, most are proprietary and require schools to incur costs to use them (National Center on Safe Supportive Learning Environments [NCSSLE], n.d.). In 2016, the U.S. Department of Education (ED) responded to the need for a freely available school climate survey by developing the “Education Department School Climate Survey” (EDSCLS), a freely available tool any state or local education agency (LEA) can adopt to measure school climate. The tool was initially pilot tested with a diverse set of schools across the United States to refine and validate the measure (National Center for Education Statistics [NCES], 2015) using a single-level confirmatory factor analysis (CFA) prior to launch. However, to date, no external validation studies have been conducted and no analyses have used a multilevel confirmatory factor analysis procedure that may be more appropriate for measures intended to capture attributes at a school level (Cornell & Huang, 2019; Schweig, 2014). This article leverages baseline data from an ongoing evaluation of a school climate improvement framework in Washington, DC to confirm and extend the findings of these initial pilot tests and demonstrate the validity of the EDSCLS.
Defining School Climate
School climate broadly refers to the quality of multiple facets of a school’s environment to support student learning (Thapa et al., 2013). Definitions of school climate vary considerably among researchers and among measurement tools (Wang & Degol, 2016). ED considers school climate across three domains: engagement, or the quality of opportunities for students to connect with the school community through relationships and activities; safety, or the ability of schools to keep students emotionally and physically safe; and environment, or the quality of the structures and supports that surround the physical plant of a school, academic rigor, and discipline (Bradshaw et al., 2014). Other definitions augment these domains; for instance, separating academic climate into its own domain separate from institutional environment (Wang & Degol, 2016; Zullig et al., 2010) or further splitting engagement into a relationships domain and a school connectedness domain (Zullig et al., 2010). Regardless, most available definitions agree that school climate is multidimensional and reliant on the perceptions of those within the community. That is, school climate is largely the subjective reality of those within a school rather than something that can be objectively identified and perceptions of a school’s climate can also vary considerably by different members of that community (Bradshaw et al., 2014; Thapa et al., 2013; Wang & Degol, 2016; Zullig et al., 2010).
Still, the aggregated perceptions of school climate within a school building are significantly associated with academic achievement, engagement in problematic and deviant behaviors, and emotional well-being, although certain aspects of school climate (e.g., engagement) have a broader base of research evidence than other domains (e.g., environment; Haynes et al., 1997; Steffgen et al., 2013; Thapa et al., 2013; Wang & Degol, 2016). It is no surprise then, that education stakeholders are increasingly advocating for a focus on school climate improvement in school reform efforts (see, for instance, Berger et al., 2019; Temkin et al., 2019). Such a focus, however, requires schools to be able to precisely measure and monitor school climate over time.
School Climate Measurement
As attention to the importance of school climate has grown, so too has the proliferation of school climate measurement tools. ED maintains a compendium of the small fraction of school climate measures that have at least some established psychometrics (NCSSLE, n.d.). As of the development of this article, 23 tools that include a student survey component are included on this list. Although each of the measurement tools listed in the compendium have been psychometrically tested, in nearly all cases, such testing was conducted by the survey developer. Among those listed, 16 tools are either copyright protected or not easily publicly accessible and eight are available as fee-for-use. Only six surveys are freely available for public use: The Authoritative School Climate Survey (Cornell, 2014); The Consortium on Chicago School Research Survey of Chicago Public Schools (Consortium on Chicago School Research, n.d.), Delaware Bullying Victimization Student Scale (Bear et al., 2014), Delaware School Climate Survey (Bear et al., 2014), Flourishing Children Survey Social Competence Adolescent Scale (Lippman et al., 2012), and the EDSCLS (NCES, 2016). Although each of these surveys covers an array of topics, only EDSCLS covers the full range of school climate topics stressed in the literature (Thapa et al., 2013; Wang & Degol, 2016; Zullig et al., 2010) and it is the only tool that provides a readily downloadable computer-based platform that allows for administration and analysis without extensive preparation work. ED also provides benchmarks against which schools can compare their aggregate school climate scores and be categorized into “least favorable,” “favorable,” or “most favorable” performance levels (Ye & Wang, 2018).
Education Department School Climate Survey
EDSLCS was designed to allow any state or LEA to quickly and easily assess climate in its schools. EDSCLS is available for download as a virtual machine that can be embedded on a school system’s server for administration and data storage. This allows school systems to use the survey fully free of charge and control access to students’ data (i.e., without needing to subscribe to third-party survey providers). The survey tool itself is also available and can be administered through other tools (e.g., online survey tools such as SurveyMonkey or SurveyGizmo) or via paper-and-pencil. EDSCLS consists of three surveys: a student survey, a family survey, and a staff survey. The virtual machine automatically scores the survey data and creates scale scores that can be directly compared with national benchmarks. The student survey, on which this article focuses, measures 12 topics (cultural and linguistic competence, relationships, school participation, emotional safety, physical safety, bullying/cyberbullying, substance abuse, emergency readiness/management, physical environment, instructional environment, mental health, discipline) categorized into the three domains (engagement, safety, environment) of the ED’s school climate model. The ED’s school climate model, although criticized by some for lacking sufficient theoretical basis for its structure (Wang & Degol, 2016), has shown to be valid for other school climate surveys (Bradshaw et al., 2014).
ED does not maintain a comprehensive list of states and LEAs using EDSCLS. However, in recent years, it has made use of EDSCLS a requirement for certain grant programs (see, e.g., the 2019 School Climate Transformation grant program). As such, the number of schools collecting EDSCLS data is expected to increase as more LEAs and states compete for and receive these federal grants.
The American Institutes for Research, on behalf of NCES, conducted an initial pilot and validation study to refine the EDSCLS survey, which included a convenience sample of 50 schools from across the United States (NCES, 2015). The study used a balanced incomplete block design to minimize burden on students. This meant that no participating student answered all tested items from the EDSCLS. Instead, items were split into three blocks, with each student responding to two of the three blocks of items. Because the EDSCLS was specifically designed to measure ED’s school climate framework, as described previously, the initial validation study used a hierarchical CFA for each of the three primary domains (engagement, safety, and environment) with subtopics under each domain fit as first-order factors. CFAs test whether a given measure aligns with a theoretical model. If the model fits well, this analysis gives validation that the tool is measuring what it is supposed to (Harrington, 2009). After removing items with low loadings, the original study demonstrated good fit for the safety (comparative fit index [CFI] = .91, Tucker–Lewis index [TLI] = .92, root mean square error of approximation [RMSEA] = .09, α = .91) and environment (CFI = .92, TLI = .92, RMSEA = .08, α = .90) domains and marginal fit for the engagement domain (CFI = .87, TLI = .89, RMSEA = .10, α = .90), based on the generous thresholds used in the original study of CFI and TLI greater than .90 and RMSEA less than .10 (Bentler, 1990; Browne & Cudeck, 1993). The study purposefully used relaxed thresholds due to concerns about Type I error (Marsh et al., 2004).
Although this original validation study was foundational in establishing the psychometric properties of the EDSCLS, the present study seeks to address critical limitations of this initial work. Specifically, the original study was focused on narrowing a larger set of items into the final EDSCLS. As such, although the original study demonstrated that the set of selected items fit well together after eliminating nonloading items, the original study could not test whether this remained true in a setting where only those items were presented to students and all students were presented with all items. At present, no study has validated the final EDSCLS student survey tool. Additionally, the initial validation did not take into account the clustered nature of the data. Because EDSCLS is designed to measure school climate at a school level, rather than for each individual student, using a multilevel CFA is necessary to fully validate the measure (Cornell & Huang, 2019; Schweig, 2014). This article leverages baseline data from an ongoing school climate study in the District of Columbia (DC) to test whether the same factor structures identified in the initial validation study of EDSCLS remain when the survey tool is used under typical administration conditions and when accounting for the clustered nature of the data.
Method
Participants
The District of Columbia Public School system (DCPS) served more than 45,000 predominately Black (60%) and economically disadvantaged (77%) students during the 2016–2017 school year (District of Columbia Public Schools, n.d.). Public charter schools in DC served an additional approximately 40,000 students with similar demographic composition (Government of the District of Columbia Office of the State Superintendent of Education, 2017). As part of the baseline data collection for an evaluation of a school climate technical assistance framework, 3,908 students at 26 public and public charter schools in DC completed the EDSCLS during the fall/winter of the 2016–2017 school year. Data were collected in partnership with the DC Office of the State Superintendent of Education (OSSE), which managed the recruitment and consent procedures. For purposes of the evaluation, data were collected from two focal grades at each school, depending on the grade levels served. In 20 schools, data were collected from seventh- and eighth-grade students (N = 2,999) and in six schools, data were collected from ninth- and 10th-grade students (N = 603). Schools additionally had the option to survey students from nonfocal grades (which included Grades 6–12) to provide additional context for data-based decision-making. Schools were asked to survey all students in the given focal grades; however, some schools opted to survey only a sample of students based on time and resource constraints (e.g., availability of computers and tablets for data collection). Because OSSE and the participating schools led the data collection and consenting process, a precise response rate cannot be calculated.
The final analytical sample included 3,416 students in Grades 7 to 10. Data from 492 participants were not used because they either did not respond to any of the EDSCLS items (N = 97), provided the same response for at least 90% of the items (N = 10; consistent with the treatment of data in the initial validation study, NCES, 2015), indicated they were in a grade that the school did not offer or did not survey (N = 18), indicated they were not in the focal-grades of the study (N = 318), or did not respond to the race/ethnicity items used to construct survey weights (N = 49). Student demographic information is presented in Table 1. Notably, half of students in the weighted sample were female, the majority of students (67%) were in Grades 7 or 8, two thirds of students were non-Hispanic Black (66%), and almost one fifth were Hispanic (17%).
Demographic Characteristics (N = 3,416)

Note. Percentages may not add up to 100 due to rounding. Ten students in the analytic sample were missing data on gender and 646 students were missing data on sexual orientation.
Instrumentation
School Climate
Students completed the 68-item EDSCLS (66 items for those in middle school), which measures students’ perceptions of school climate in the domains of engagement, safety, and environment, with several topic areas within each domain (e.g., the engagement domain includes a relationships topic area; the safety domain includes a bullying/cyberbullying topic area; see Table 2 for items in each topic area). Students responded to each item on a scale from 1 to 4, with 1 indicating “strongly disagree” and 4 indicating “strongly agree.” Two items were asked of high school students only (SENGREL153 and SSAFBUL77B in Table 2), as is standard within the EDSCLS platform. One large middle school also agreed to ask students these more sensitive items. The present study focused on 64 items from the EDSCLS, following the developers’ decision to exclude the two items in the topic area emergency readiness/management and two items in the safety domain that loaded poorly but were nonetheless kept on the final tool (NCES, 2015).
Descriptive Statistics for the EDSCLS Student Survey Items

Note. All items were rated on a scale from 1 to 4. EDSCLS = U.S. Department of Education’s School Climate Survey.
Student Demographic Information
EDSCLS includes a number of demographic items (grade level, race, ethnicity, and gender) on the core survey. In addition, the research team added measures of sexual orientation and gender identity based on the request of the participating district (see Temkin et al., 2017 for further information).
Procedure
Consent from students’ parents/guardians was obtained passively: OSSE coordinated with each participating school to send parents information about the survey and provided instructions for parents to opt students out of completing the survey a week prior to data collection. Assent was collected from each participating student as part of introductory text at the front of the survey; students were provided with information about the survey and prompted as to whether they would like to continue.
All students completed the survey through a web-browser link to the EDSCLS virtual machine. Depending on the resources at each school, participating students were either brought to a computer lab or tablets or laptops were brought to students’ classrooms. Students were provided with a unique username to log in to the survey and complete the assent procedure. A research team member served as a proctor during survey administration to assist with any issues with the login procedures and help maintain student privacy.
Data Analysis
Single-Level Confirmatory Factor Analysis
Consistent with the initial validation study, we conducted a series of CFAs to determine whether the theoretical three-domain model proposed by ED (Figure 1; NCES, 2015) fit the EDSCLS data collected in the present study. Our specific aim was to determine whether the current data produced similar findings as the original validation. As such, we aimed to follow the original procedures to the greatest extent possible. Because EDSCLS was specifically designed to measure this framework, we focused on whether the measure was consistent with this theorized model. Specifically, a hierarchical one-factor model was fit for each of the three domains of the EDSCLS. Items loaded on their respective topic area; in turn, topic areas loaded on their respective domain. Items were analyzed as ordinal categorical measures (as opposed to continuous). These models are depicted in Figures 1 to 3. All analyses were conducted in Mplus Version 8.4 with the weighted least squares mean and variance-adjusted estimator (WLSMV; Muthén & Muthén, 1998–2019). WLSMV accounted for the ordinal nature of the Likert-type response options (Flora & Curran, 2004).

Hierarchical factor structure for the U.S. Department of Education’s School Climate Survey (EDSCLS) Engagement domain.

Hierarchical factor structure for the U.S. Department of Education’s School Climate Survey (EDSCLS) Safety domain.
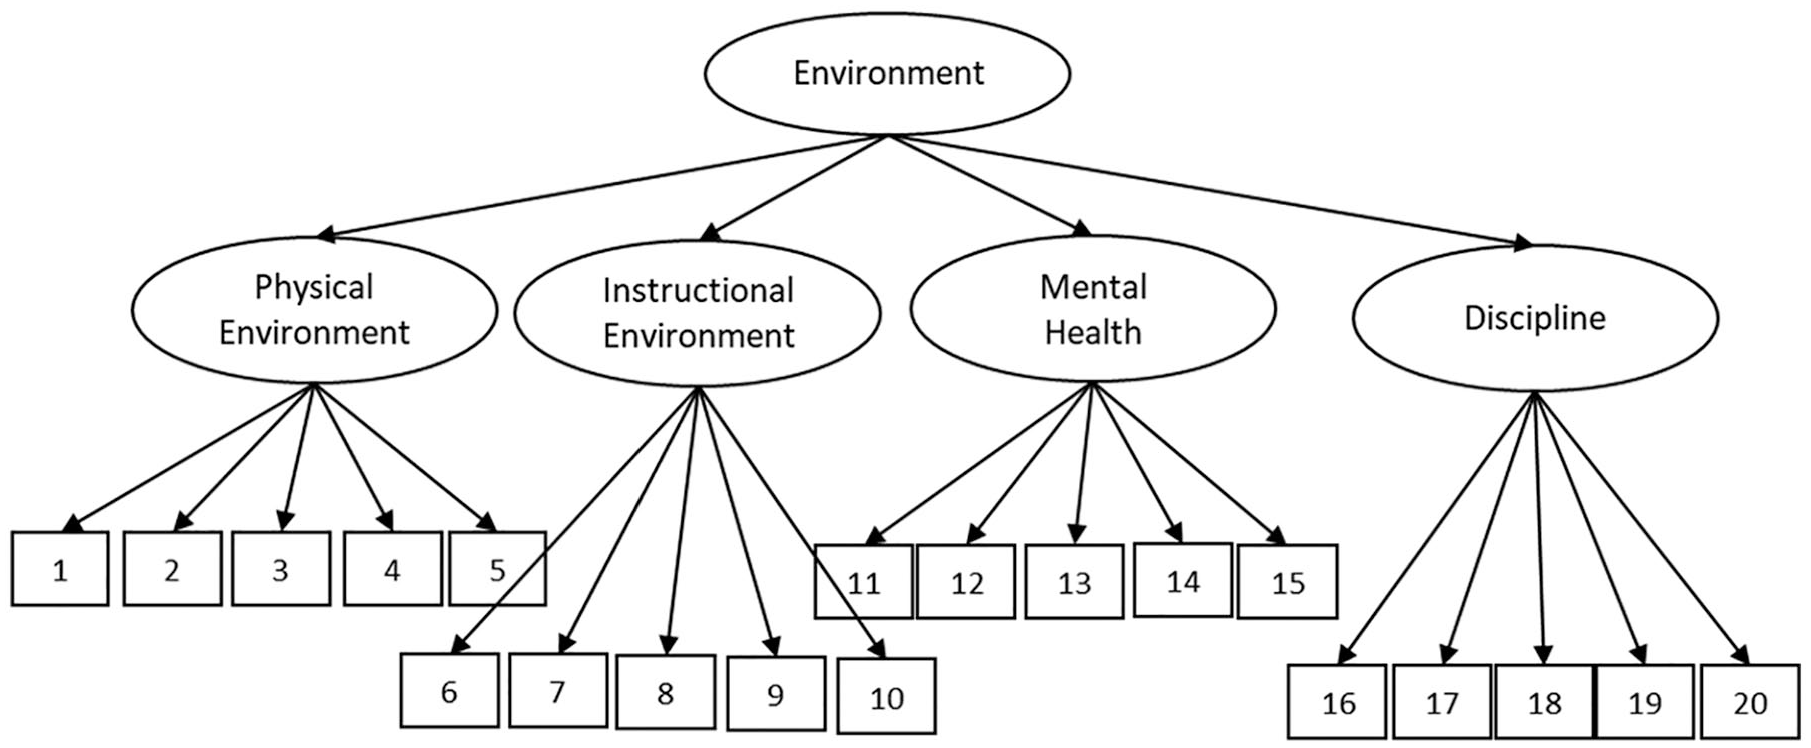
Hierarchical factor structure for the U.S. Department of Education’s School Climate Survey (EDSCLS) Environment domain.
Consistent with the original validation study, we used pairwise deletion to address missing data for the replication analyses. This was important to replicate the original validation study and because two items with more mature content were typically asked only of ninth- and 10th-grade students (the exception being one school where seventh- and eighth-grade students responded to these items). Students were dropped from the CFA if they did not respond to any of the domain’s items. Nonresponse was primarily due to students not finishing the survey, leading to the engagement domain having more students with data, compared with the safety and environment domains (which had items at the end of the survey).
Alternative Single-Level Confirmatory Factor Analysis
To improve the model fit and reduce the burden on students, items with standardized factor loadings with an absolute value less than .50 were excluded from the model; a new CFA was run without these items.
Alternative Single-Level Confirmatory Factor Analysis With Multiple Imputation
Moving beyond replication, we tested additional models treating missing data with multiple imputation.
As noted above, nonresponse was primarily due to students not finishing the survey. Item-level missingness ranged from 0.91% at the beginning of the survey to 20.32% at the end of the survey (see Table 2 for the number of respondents for each item). There were also times of technical difficulties where students had trouble obtaining charged laptops, connecting to the server, and other school events which reduced the time the students had to complete the survey.
Imputation was performed in Mplus, running the procedure separately for each of the three domains, as we did not hypothesize a relationship between the three domains of school climate in our models. We imputed five data sets (Rubin, 1987) with a two-level structure (students nested within schools) using all survey items in that domain, student grade level, and race and gender (Pedersen et al., 2017). All indicators were imputed as categorical. The two items that were only asked to high school students were excluded from the analysis since data for these two items were not missing at random, violating the assumptions of multiple imputation (Jakobsen et al., 2017).
Multilevel Confirmatory Factor Analysis
To further improve the model fit and take into account the clustered nature of the data, a series of multilevel confirmatory factor analyses (MCFAs) were run, based on the alternative single-level CFA that excluded the items with standardized factor loadings less than .50 in the original CFA. All MCFA analyses used multiple imputation to address missing data.
Weights
All analyses were weighted to adjust for potential bias in the sample due to differential student nonresponse. We constructed poststratification weights based on the inverse probability that a student responded to the survey based on their race/ethnicity and the size of their grade-level according to publicly available aggregate data for each school. With the weights, results are generalizable to the schools and grades surveyed. The weights were scaled in Mplus using the wtscale command in the multilevel confirmatory factor analyses (Asparouhov, 2008; Carle, 2009).
Results
Single-Level Confirmatory Factor Analysis
Standardized parameter estimates from each CFA are shown in Tables 3 to 7. Table 8 shows the fit indices from the original study in comparison to the current study. We use two sets of thresholds for fit indices to determine if models were an acceptable description of the underlying data—those used in the original validation study (NCES, 2015): >.90 for the CFI and the TLI (Bentler, 1990) and <.10 for the RMSEA (Browne & Cudeck, 1993); and stricter, more conventional thresholds: >.95 for the CFI and TLI and <.06 for the RMSEA (Hu & Bentler, 1998).
Engagement Domain: Standardized Item Loadings From a One-Factor Hierarchical CFA

Note. CFA results are from a one-factor hierarchical confirmatory factor analysis estimated using weighted least squares means and variance. N = 3,416 for all models. β = standardized factor loading; SE = standard error; CFA = confirmatory factor analysis.
Safety Domain: Standardized Item Loadings From a One-Factor Hierarchical CFA
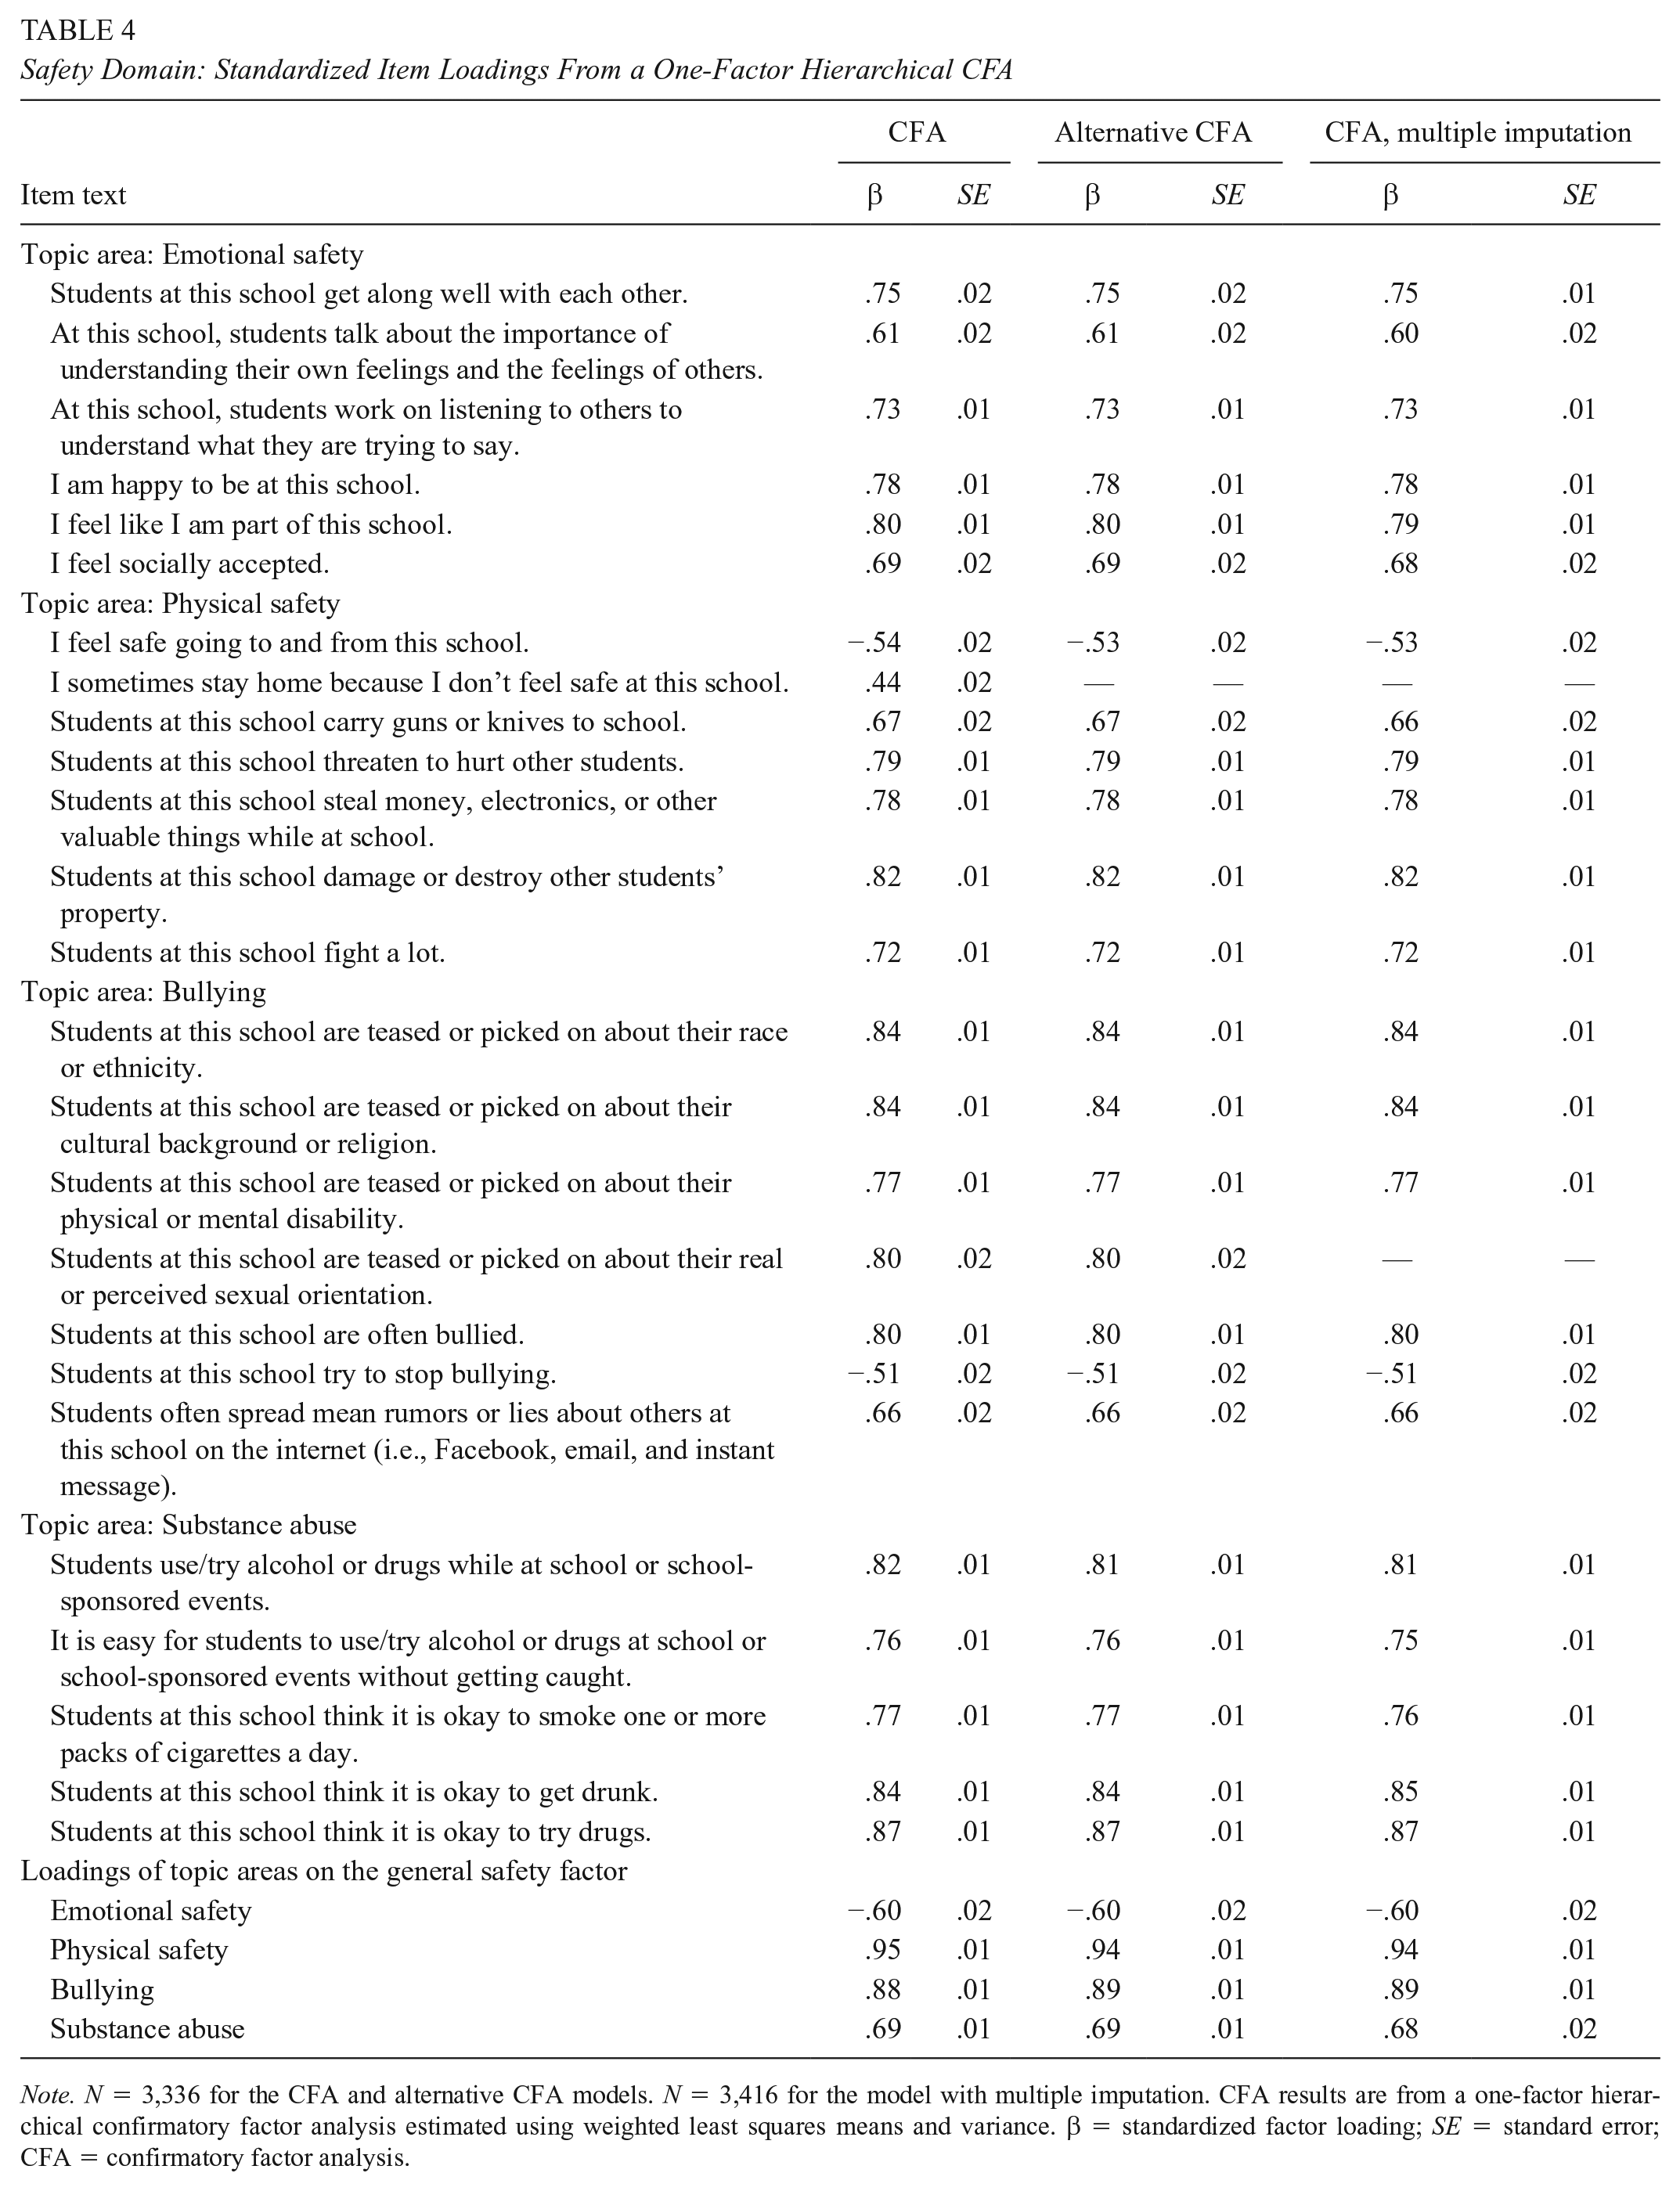
Note. N = 3,336 for the CFA and alternative CFA models. N = 3,416 for the model with multiple imputation. CFA results are from a one-factor hierarchical confirmatory factor analysis estimated using weighted least squares means and variance. β = standardized factor loading; SE = standard error; CFA = confirmatory factor analysis.
Environment Domain: Standardized Item Loadings From a One-Factor Hierarchical CFA

Note. N = 3,120 for the CFA. N = 3,416 for the model with multiple imputation. CFA results are from a one-factor hierarchical confirmatory factor analysis estimated using weighted least squares means and variance. β = standardized factor loading. SE = standard error; CFA = confirmatory factor analysis.
Engagement Domain: Standardized Item Loadings From an MCFA With Hierarchical Structure at the Within Level and a Single Factor at the Between Level (N = 3,416 Students)

Note. MCFA results are from a one-factor hierarchical confirmatory factor analysis estimated using weighted least squares means and variance. β = standardized factor loading; SE = standard error; MCFA = multilevel confirmatory factor analysis.
Environment Domain: Standardized Item Loadings From an MCFA With Hierarchical Structure at the Within Level and a Single Factor at the Between Level (N = 3,416 Students)
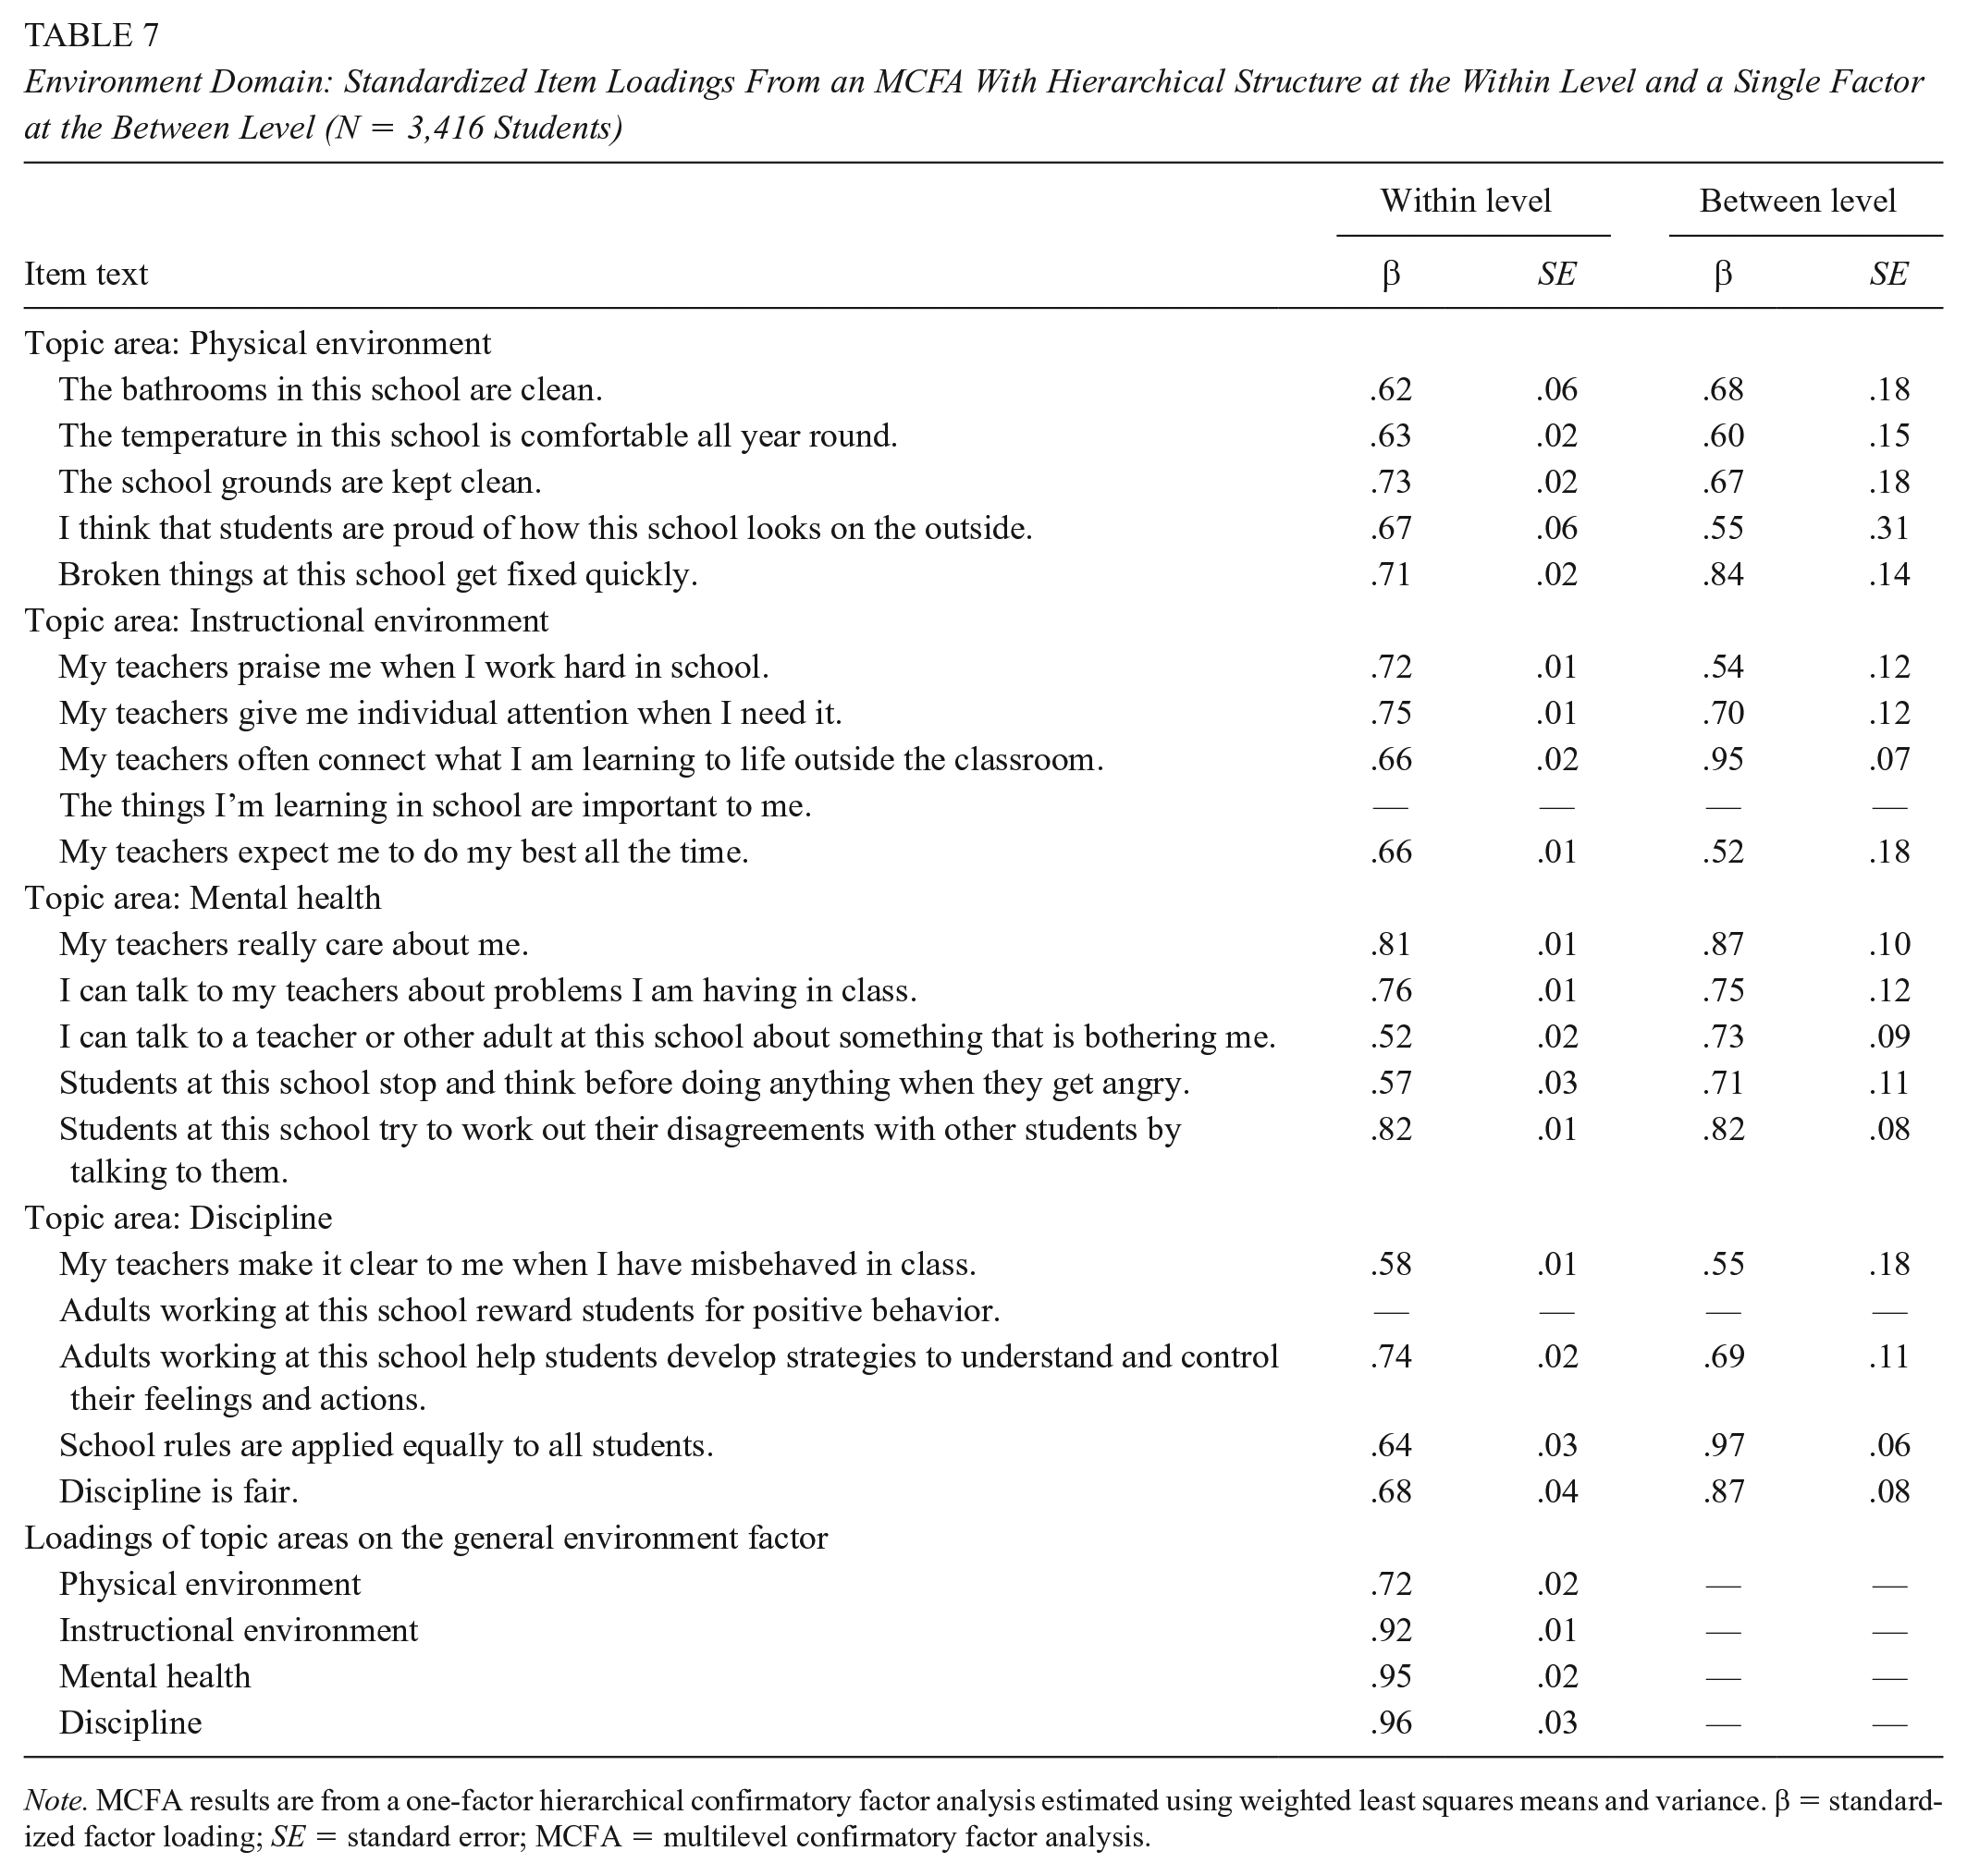
Note. MCFA results are from a one-factor hierarchical confirmatory factor analysis estimated using weighted least squares means and variance. β = standardized factor loading; SE = standard error; MCFA = multilevel confirmatory factor analysis.
Model Fit Statistics and Reliability: EDSCLS Pilot Study, Compared With DC Sample

Note. Cronbach’s alpha values are presented as a measure of reliability. Values for the pilot study are from National Center for Education Statistics (2015). Values for the DC sample models were calculated in Mplus, treating the items as continuous and using all five data sets for the multiple imputation, where appropriate. Multilevel Cronbach’s alphas were calculated using the between- and within-variance covariance matrices separately, using code adapted from online Appendix C of Geldhof et al. (2014). CFI = comparative fit index; RMSEA = root mean square error of approximation; TLI = Tucker–Lewis index; MCFA = multilevel confirmatory factor analysis.
In the alternate models, the Engagement domain dropped the following two items from the Participation topic area: “I regularly attend school-sponsored events, such as school dances, sporting events, student performances, or other school activities” and “I regularly participate in extra-curricular activities offered through this school, such as, school clubs or organizations, musical groups, sports teams, student government, or any other extra-curricular activities.” The Safety domain dropped the following item from the Physical Safety topic area: “I sometimes stay home because I don’t feel safe at this school.” bIn CFA models on imputed data sets the Engagement domain dropped the following item from the Relationship topic area: “At this school, there is a teacher or some other adult who students can go to if they need help because of sexual assault or dating violence.” The Safety domain dropped the following item from the Bullying topic area: “Students at this school are teased or picked on about their real or perceived sexual orientation.” cAdditional items were dropped from MCFA models due to low factor loadings: in the Engagement domain, Cultural and Linguistic Competence topic area: “People of different cultural backgrounds, races, or ethnicities get along well at this school;” In the Environment domain, Instructional Environment topic area: “The things I’m learning in school are important to me”; and in the Environment domain, Discipline topic area: “Adults working at this school reward students for positive behavior.”
Overall, results suggest that the three measurement models had a similar fit in the DC data as in the pilot data.
Engagement Domain
The engagement domain met the original study’s criteria for the CFI and RMSEA but, as in the original validation study, the TLI (.89) was slightly outside the recommended threshold. The CFI (.91) and TLI (.89) both fall short of the stricter, more conventional thresholds, and the RMSEA (.06) is right at the threshold. Standardized factor loadings were at least .50 with the exception of two items with factor loadings between .40 and .50. These two items were the only items that asked about students’ actual behavior, rather than students’ perceptions about the school climate: I regularly attend school-sponsored events, such as school dances, sporting events, student performances, or other school activities. (Topic area: Participation) I regularly participate in extra-curricular activities offered through this school, such as, school clubs or organizations, musical groups, sports teams, student government, or any other extra-curricular activities. (Topic area: Participation)
These items had similarly low, but marginally acceptable standardized factor loadings (both .53) in the original validation study. For both the current and the original studies, these items were the lowest loading across all items in the engagement domain.
Safety Domain
The safety domain met criteria for each of the model fit indices according to the original study’s criteria, but the CFI (.93) and TLI (.92) fall below conventional thresholds, and the RMSEA (.06) is right at the threshold. Standardized factor loadings were at least .50 with the exception of one item with a factor loading of .44. Similar to the engagement domain, the item with a poor loading was the only item that asked about students’ actual behavior: I sometimes stay home because I don’t feel safe at this school.
This item had a similarly low standardized factor loading (.49) during the original validation study, which was the lowest loading across all items in the safety domain and fell below the .50 threshold.
Environment Domain
The environment domain met all criteria for fit indices according to the thresholds used in the original validation study and are close to meeting conventional thresholds. All standardized factor loadings were at least .50.
Alternative Confirmatory Factor Analysis
Alternative models excluded the aforementioned items that had standardized factor loadings less than .50. Fit indices for the alternative models are presented in Table 8.
For the engagement domain, the alternative model fit the data slightly better than the original model, and all three fit statistics met the fit criteria of the original validation study, but the CFI and TLI continue to be less than conventional thresholds, and RMSEAs are right at conventional thresholds.
When rerun with multiple imputation, the alternative models had very similar fit statistics across domains.
Multilevel Confirmatory Factor Analysis
MCFA models were consistent with the alternative model in that they dropped the items with standardized factor loadings less than .50 (i.e., items that asked about students’ behaviors) in the single-level CFA model. Across the three domains, MCFA models following the factor structure of the single-level CFA models, with hierarchical factor models at both the within and between levels, did not fit the data at the between level. To improve model fit, we tested a progressive series of models to explore whether simplifying or otherwise altering the between-level structure (including correlated factor models) would yield a better-fitting model (Chen et al., 2001; see Appendix Table A1 for detailed descriptions of each model and their fit statistics). In selecting the recommended models, we relied on fit statistics, factor loadings, and other model parameters, and selected the best-fitting models that were most well-aligned with the original factor structure hypothesized in the original validation study.
Engagement Domain
The recommended multilevel measurement model for engagement uses the hierarchical factor structure for the within level and a single factor at the between level. One item, “People of different cultural backgrounds, races, or ethnicities get along well at this school” is dropped, due to a low factor loading of .37 at the between level. Model fit for the engagement domain improved over the alternative CFA model (CFI and TLI increased from .92 and .90 to .96 and .95, respectively, and RMSEA decreased from .07 to .03). The standardized factor loadings were at least .50 at the within and between levels, with the exception of one item at the between level with a factor loading of .47 (see Table 6).
Safety Domain
Although some multilevel measurement models appear to fit the data well according to the fit statistics (generally meeting both the thresholds used in the original validation study and the more stringent conventional thresholds), some models did not converge, and, among those that did, there were improper solutions at the between level across all tested models. These included negative residual variances, very high correlations across items in different practice areas, and very low factor loadings between the substance use practice area and the safety domain. We tried numerous ways to address these issues, including fixing negative variances to zero, dropping highly correlated items, fitting simpler models at the between level, fitting correlated models, and dropping substance use items but were not able to find an appropriate multilevel measurement model for the safety domain.
Environment Domain
The recommended multilevel measurement model for environment uses the hierarchical factor structure for the within level and a single factor at the between level, and drops two items due to low factor loadings at the between level: “The things I’m learning in school are important to me” (with a factor loading of .39) and “Adults working at this school reward students for positive behavior” (with a factor loading of .45). Model fit for the environment domain improved over the alternative CFA model (CFI and TLI improved from .94 and .93 to .98 and .97, respectively, and RMSEA decreased from .06 to .02).
Discussion
As an increasing number of schools, districts, and states move toward measuring school climate as part of accountability and school improvement initiatives, it is critical to ensure the tools used are valid across populations and when used in normal administration conditions. The current study is the first to independently validate the structure of the EDSCLS outside of ED’s original validation study and the first to use a multilevel CFA to explore not only the EDSCLS’s structure at the individual level but also at the school level. The initial study leveraged pilot data from a diverse array of schools across the country and used a balanced incomplete block design whereby no student took the full survey tool (NCES, 2015). The present study used data from 3,416 students from 26 middle and high schools in DC which were collected under typical conditions—all students were presented with the full survey tool. We ran a series of hierarchical one-factor CFAs on each of EDSCLS’ three domains (engagement, safety, and environment) to test whether items loaded on both their topic area scales as well as the overall domain. We then improved on this model with multilevel CFA that accounts for the clustered nature of data collected from students within schools.
Our findings largely paralleled those of the original validation study for the single-level CFA. For each of the three domains, the RMSEA and CFI indicated that the measurement model fit the data according to the less rigorous standards used in the original study (>.90 for the CFI and the TLI [Bentler, 1990] and <.10 for the RMSEA [Browne & Cudeck, 1993]). However, for the engagement domain, the TLI was outside the recommended threshold, suggesting that the proposed measurement model is not an ideal fit to the data. Using stricter and more conventional thresholds(>.95 for the CFI and TLI and <.06 for the RMSEA [Hu & Bentler, 1998]), CFI and TLI for the engagement and safety domains indicated a less well-fitting model, with RMSEA right at threshold, and for the environment domain, all parameters were close to meeting these thresholds.
Three items, all focused on personal behaviors (e.g., “I sometimes stay at home . . .”), had particularly low standardized loadings. By dropping these items, all of the fit statistics pass thresholds for acceptable fit using the original parameters but continued to fall short of the stricter thresholds. Given the EDSCLS’s general focus on broad perceptions of school climate, the fact that the three personal behavior items had low loadings is not surprising. On their face, these items are measuring a different, although highly correlated, concept. Although a student’s decision to participate in school activities is necessarily associated with the opportunities provided by a school, there are many other external and intrapersonal factors that contribute to a student’s decision to engage (Feldman & Matjasko, 2005).
Although our findings closely replicated those of the original validation study, we note that the model falls short when using rigorous cutoffs. Marsh et al. (2004) argue that there is no “golden rule” for cutoff scores and using too stringent of cutoffs can incorrectly reject well-fitting models (i.e., Type I error). Given how closely our fit indices align with those of the original validation, and given that the RMSEA met the more rigorous threshold for each of the EDSCLS domains even as the others fell short, we argue that there remains continued support for the validity of the underlying factor structure at the individual level.
Prior to this study, EDSCLS was only examined at the individual level; its use as a school-level measure had not previously been tested. Models replicating the individual within-school model—where each domain consists of three or four subdomains—at the between-school level did not fit the data well. Instead, for engagement and environment, a more simplified model consisting of a single higher order factor at the between level fit the data well, with fit statistics reaching more rigorous standards. This is consistent with several prior studies suggesting that Level 1 and Level 2 structures are not often consistent, and typically demonstrate simpler structures at higher levels (Huang & Cornell, 2016).
For safety, however, we did not identify a model that had acceptable fit and was free of statistical violations (e.g., negative residual variances). Although we urge caution in this finding given our relatively low power at the between level (N = 26 schools), its inconsistency with the other domains raises critical questions about the use of student perceptions of safety to generate an overarching school safety score. Only a few previous studies have used multilevel CFA to validate student school climate surveys (e.g., Huang & Cornell, 2016; Konold & Cornell, 2015) and these only include some aspects of school safety as defined by the EDSCLS (e.g., bullying and teasing). Given the EDSCLS’s inclusion and focus on physical safety and substance use alongside bullying, and the relatively low prevalence of physical violence and substance use but high levels of bullying, particularly, at the middle school level (Musu et al., 2019), it may be that although a domain-level factor fits at the individual level, there is insufficient consistency between subdomains at the school level to create a higher order factor. Further research with a larger sample of schools is needed.
Our between-school findings do raise questions, however, about the push to include school climate survey data as part of states’ accountability plans (Jordan & Hamilton, 2020; Temkin & Harper, 2018). Although our models for environment and engagement ultimately fit well, they differ substantively from the individual-level structures identified through single-level CFA. This means that states risk calculating scores that may not accurately reflect schools’ climates. Given that many school climate measures have not yet been validated using a multilevel CFA, they may simply not be ready to use as an accountability tool.
Still, our study provides broad support for using the EDSCLS to examine within-school, individual-level differences in perceptions of school climate across all domains and for comparing schools on engagement and environment. Understanding how perceptions of school climate vary between individuals is important for schools to ensure that their interventions are reaching all students. Users should take note of the item modifications (e.g., removal of the three student behavior items) identified in the course of our analyses. This may mean that standard scale scores populated by the EDSCLS platform may need adjustment, although further replication using broader samples is necessary.
Limitations and Future Directions
There are a few key limitations to this study. First, the sample predominately consisted of seventh and eighth graders, limiting its ability to generalize to high schools. EDSCLS contains two items that are designated as “high school only.” Because our sample predominately consisted of seventh- and eighth-grade students, and because only one school administered these items to seventh- and eighth-grade students, there was substantial missing data on these items. However, our factor loadings for these items in the single-level CFA were similar to those for the original validation study and as such, the missing data do not seem to have affected our findings.
Additionally, although the research team provided proctoring in order to help protect student confidentiality, because students completed these surveys on tablets or computers, their answers may have been more visible to classmates than through paper-and-pencil surveys. This may have affected how truthful students were in their responses, and the instrument did not include any validation items to allow us to account for social desirability bias or identify mischievous responders. Schools should use technology such as screen shields to help protect student privacy when administering online surveys such as the EDSCLS.
This study primarily focused on confirming the findings from the original EDSCLS validation study using CFA. Future studies, however, should explore whether there are alternative models that may better fit the EDSCLS data and provide a more nuanced understanding of school climate, particularly at the school level and for the safety domain.
Conclusion
Our findings’ close replication of the original validation study suggests that the EDSCLS functions as expected during real-world administration for assessing individuals’ perceptions of school climate. We find more limited support for using EDSCLS to compare school climate between schools. Schools can confidently continue to use, or begin using, this freely available tool to assess school climate at the individual level and at the between-school level for the engagement and environment domains. However, given low-factor loadings for behavioral items in the CFA, and at the between-school level in the multilevel CFA, there should be continued refinement of the model, including separating student perceptions from student behavior, and investigations into differences in the model at the school and student levels.
Footnotes
Appendix
Multilevel Confirmatory Factor Analysis Models, by Domain

| Engagement |
|||||
|---|---|---|---|---|---|
| N | RMSEA | CFI | TLI | Notes | |
| Model 1: Higher order factor model with factor loadings free to vary between levels | 3,416 | .03 | .96 | .95 | Between level: People of different cultural backgrounds, races, or ethnicities get along well at this school (SENGCLC7) loads at .37. I have lots of chances to be part of class discussions or activities (SENGPAR48) loads on Participation at greater than 1.00 and has a negative residual variance. Cultural and Linguistic Competence and Relationships load on domain at greater than 1.00 and have negative residual variances. |
| Model 1a: Higher order factor model, dropping one-half of each pair of highly correlated items (>.90; SENGCLC3 and SENGREL12) | 3,416 | .03 | .965 | .95 | Between level: People of different cultural backgrounds, races, or ethnicities get along well at this school (SENGCLC7) loads at .44. I have lots of chances to be part of class discussions or activities (SENGPAR48) loads on Participation at greater than 1.00 and has a negative residual variance. Relationships loads on the domain at greater than 1.00 and has a negative residual variance. Two pairs of items have cross-subdomain correlations of greater than .90. |
| Model 1c: Higher order factor model at the within level, single factor at the between level | 3,416 | .03 | .96 | .95 | Between level: People of different cultural backgrounds, races, or ethnicities get along well at this school (SENGCLC7) loads at .37. |
| Model 1d: Higher order factor model at the within level, single factor at the between level, dropping SENGCLC7 at both levels | 3,416 | .03 | .96 | .95 | Between level: Students like one another (SENGREL21) loads at .47. Note that this model is identical to Model 3a, as it is just identified with three factors. |
|
|
|||||
| Model 2: Correlated factor model with subdomains at both levels | 3,416 | .03 | .96 | .95 | Within level: Subconstructs are correlated from .73 to .87. |
| Between level: Subconstructs are correlated from .94 to 1.05. People of different cultural backgrounds, races, or ethnicities get along well at this school (SENGCLC7) loads at .37 and I have lots of chances to be part of class discussions or activities (SENGPAR48) loads at greater than 1.00 and have negative residual variances. Correlations between subconstructs range from .94 to .98, but Cultural and Linguistic Competence and Relationships are correlated at greater than 1.00. | |||||
| Model 2a: Correlated factor model with subdomains at both levels, dropping one-half of each pair of highly correlated items (>.90; SENGCLC3 and SENGREL12) | 3,416 | .03 | .956 | .95 | Within level: Correlations between subconstructs range from .67 to .85. |
| Between level: Correlations between subconstructs range from .78 to 1.05. People of different cultural backgrounds, races, or ethnicities get along well at this school (SENGCLC7) loads at .37 and I have lots of chances to be part of class discussions or activities (SENGPAR48) loads at greater than 1.00 and have negative residual variances. Correlations between subconstructs range from .78to 1.05, with correlations between Relationships and Cultural and Linguistic Competence and REL and Participation being greater than 1.00. | |||||
| Model 3: Correlated factor model with subdomains at individual levels and a single factor at the between level | 3,416 | .03 | .96 | .95 | Within level: Correlations between subconstructs range from .73 to .87. |
| Between level: People of different cultural backgrounds, races, or ethnicities get along well at this school (SENGCLC7) loads at .37. | |||||
| Model 3a: Correlated factor model with subdomains at the individual level and a single factor at the between level. Removing SENGCLC7 at both levels | 3,416 | .03 | .96 | .95 | Within level: Correlations between subconstructs range from .70 to .83. |
| Between level: Students like one another (SENGREL21) loads at .47. | |||||
| Safety |
|||||
| N | RMSEA | CFI | TLI | Notes | |
| Model 1: Higher order factor model with factor loadings free to vary between levels | 3,416 | .03 | .95 | .95 | Between level: I feel safe going to and from this school (SSAFPSAF60) loads at .45 and Students at this school carry guns or knives to school (SSAFPSAF65) loads at .46. Conversely, Students at this school try to stop bullying (SSAFBUL80) and Students at this school think it is okay to smoke one or more packs of cigarettes a day (SSAFSUB92) load at greater than 1.00 and have negative residual variances. Physical Safety loads on the domain at greater than 1.00 and has negative residual variance. Substance Abuse loads on the domain at .17. |
| Model 1a: Higher order factor model, dropping one-half of each pair of highly correlated items (>.95; SSAFBUL80) | 3,416 | .02 | .97 | .96 | Between level: I feel safe going to and from this school (SSAFPSAF60) loads at .45 and Students at this school carry guns or knives to school (SSAFPSAF65) loads at .46. Conversely, Students at this school try to stop bullying (SSAFBUL80) and Students at this school think it is okay to smoke one or more packs of cigarettes a day (SSAFSUB92) load at greater than 1.00 and have negative residual variances. Physical Safety loads on the domain at greater than 1.00 and has negative residual variance. Substance Abuse loads on the domain at .15. |
| Model 1b: Higher order factor model, dropping one-half of each pair of highly correlated items (>.90; SSAFBUL80, SSAFEMO0, SSAFBUL1, SSAFPSAF69) | 3,416 | .02 | .97 | .96 | Between level: Students at this school try to stop bullying (SSAFBUL80) loads at greater than 1.00 and have negative residual variance. Physical Safety loads on the domain at greater than 1.00 and has negative residual variance. Substance Abuse loads on the domain at .17. |
| Model 1c: Higher order factor model at the within level, single factor at the between level, with substance abuse items removed | No convergence. | ||||
| Model 1d: Higher order factor model at the within level, single factor at the between level, with substance abuse items removed at between level only | No convergence. | ||||
| Model 2: Correlated factor model with subdomains at both levels | 3,416 | .02 | .96 | .95 | Within level: Correlations between subconstructs range from |
| Between level: Correlations between subconstructs range from |
|||||
| Model 2a: Correlated factor model with subdomains at both levels, dropping one-half of each pair of highly correlated items (>.90; SSAFBUL8, SSAFEMO0, SSAFBUL1, SSAFPSAF69) | 3,416 | .02 | .97 | .96 | Within level: Correlations between subconstructs range from |
| Between level: Correlations between subconstructs range from |
|||||
| Model 2b: Correlated factor model with subdomains at both levels, excluding substance abuse | 3,416 | .03 | .94 | .93 | Within level: Correlations between subconstructs range from |
| Between level: Correlations between subconstructs range from |
|||||
| Model 3: Correlated factor model with subdomains at individual levels and a single factor at the between level | 3,416 | .02 | .96 | .95 | Within level: Correlations between subconstructs range from |
| Between level: I feel safe going to and from this school (SSAFPSA0) loads at .45 and Students at this school carry guns or knives to school (SSAFPSA2) loads at .46. Conversely, Students at this school try to stop bullying (SSAFBUL8) loads at greater than 1.00 and has a negative residual variance. | |||||
| Model 3a: Correlated factor model with subdomains at the individual level and a single factor at the between level. Removing substance abuse items. | 3,416 | .03 | .94 | .94 | Within level: Correlations between subconstructs range from |
| Between level: I feel safe going to and from this school (SSAFPSA0) loads at .43 and Students at this school carry guns or knives to school (SSAFPSA2) loads at .42. | |||||
| Environment |
|||||
| N | RMSEA | CFI | TLI | Notes | |
| Model 1: Higher order factor model with factor loadings free to vary between levels | 3,416 | .02 | .98 | .98 | Between level: Broken things at this school get fixed quickly (SENVPENV107) and My teachers often connect what I am learning to life outside the classroom (SENVINS114) load greater than 1 and have negative residual variances with SENVPENV107’s negative residual variance being fairly large (−.30). The things I’m learning in school are important to me (SENVINS115) loads at .43 and Adults working at this school reward students for positive behavior (SENVDIS143) loads at .48. Instructional Environment and Discipline load on the domain at greater than 1.00 and have negative residual variances. |
| Model 1a: Higher order factor model with factor loadings free to vary between levels, dropping one-half of each pair of highly correlated items (>.90; SENVDIS143, SENVINS114, SENVMEN130, SENVDIS147) | 3,416 | .02 | .98 | .97 | Within level: Discipline load on the domain at greater than 1.00. |
| Between level: Broken things at this school get fixed quickly (SENVPENV107), Discipline is fair (SENVDIS147C), Instructional Environment and Discipline have factor loadings greater than 1 and negative residual variances (3 of them greater than .10 in magnitude). My teachers praise me when I work hard in school (SENVINS111) loads at .46. The things I’m learning in school are important to me (SENVINS115) loads at .24 and My teachers expect me to do my best all the time (SENVINS121) loads at.46. | |||||
| Model 1b: Higher order factor model at the within level, single factor at the between level | 3,416 | .02 | .98 | .98 | Between level: The things I’m learning in school are important to me (SENVINS115) loads at .39 and Adults working at this school reward students for positive behavior (SENVDIS143) loads at .45. |
| Model 1c: Higher order factor model at the within level, single factor at the between level, dropping SENVINS115 and SENVDIS143. | 3,416 | .02 | .98 | .97 |
|
| Model 2: Correlated factor model with subdomains at each level | 3,416 | .02 | .98 | .98 | Within level: Correlations between subconstructs range from .64 to .90. |
| Between level: Correlations between subconstructs range from .51 to 1.11. Broken things at this school get fixed quickly (SENVPENV107) loads at greater than 1.00 and has a negative residual variance. The things I’m learning in school are important to me (SENVINS115) loads at .45 and Adults working at this school reward students for positive behavior (SENVDIS143) loads at .49. Correlations between subconstructs range from .51–.91, but Instructional Environment and Discipline are correlated at 1.11. | |||||
| Model 2a: Correlated factor model with subdomains at each level, dropping one-half of each pair of highly correlated items (>.90; SENVDIS143, SENVINS114, SENVMEN130, SENVDIS147) | 3,416 | .02 | .98 | .97 | Within level: Correlations between subconstructs range from .63 to .96. |
| Between level: Correlations between subconstructs range from .58 to 1.44. Broken things at this school get fixed quickly (SENVPENV107) and has a negative residual variance. Instructional Environment has a factor loading greater than 1.00. The things I’m learning in school are important to me (SENVINS115) loads at .30, My teachers expect me to do my best all the time (SENVINS121) loads at .491. Correlations between subconstructs range from .78–.94, but Instructional Environment and Discipline are correlated at greater than 1.00. | |||||
| Model 3: Correlated factor model with subdomains at individual levels and a single factor model at the between level | 3,416 | .02 | .98 | .98 | Within level: Correlations between subconstructs range from .64 to .90. |
| Between level: The things I’m learning in school are important to me (SENVINS115) loads at .39 and Adults working at this school reward students for positive behavior (SENVDIS143) loads at .44. | |||||
| Model 3a: Correlated factor model with subdomains at the individual level and a single factor model at the between level, dropping SENVINS115 and SENVDIS143. | 3,416 | .02 | .98 | .97 | Within level: Correlations between subconstructs range from .62 to .89. |
Note. This table presents the main series of models that were tested in each domain. Additional models were tested that, for example, dropped items or fixed negative residual variances to zero. They are not presented here for the sake of parsimony. All models are based on multiply imputed data and exclude high school–only items as well as the behavioral items that were ill-fitting in the CFA. CFA = confirmatory factor analysis; CFI = comparative fit index; RMSEA = root mean square error of approximation; TLI = Tucker–Lewis index.
Acknowledgements
This article uses data collected as part of a project supported by Award No. 2015-CK-BX-0016, awarded by the National Institute of Justice, Office of Justice Programs, U.S. Department of Justice. The opinions, findings, and conclusions or recommendations expressed in this publication are those of the authors and do not necessarily reflect those of the U.S. Department of Justice.