
Abstract
With the increasing demand for evidence-based research on teacher effectiveness and improving student achievement, more impact studies are being conducted to examine the effectiveness of professional development (PD) interventions. Cluster randomized trials (CRTs) are often carried out to assess PD interventions that aim to improve both teacher and student outcomes. Due to the different design parameters (i.e., intraclass correlation and
Introduction
There has been a strong push for research on interventions aimed at improving student science outcomes in the United States in the past decade. However, the number of studies conducted to examine the efficacy of math and literacy interventions on student outcomes still greatly exceeds those that evaluated science interventions. For instance, What Works Clearinghouse (WWC) reviewed 1,437 studies under the mathematics topic and 4,587 studies under the literacy topic since 2002. In contrast, WWC reviewed only 73 studies under the science topic in the same time frame. This strongly indicates that more studies of science interventions are needed.
Not only are more studies evaluating science interventions needed but they should be of high quality. In a meta-analysis of science intervention effect sizes, Taylor et al. (2018) found fewer than 2% of the reviewed studies, which included randomized controlled trials (RCTs) and quasi-experimental designs (QEDs), had adequate sample sizes and used well-designed and well-implemented rigorous research methods to detect causal effects. This indicates that research grounded in strong methodology is also much needed in science education.
Impact Studies to Improve Student Outcomes
In the past decade, important federal policies were established to support the growing demand to improve science education in K–12 settings and the increasing need for rigorous research on science education. The National Research Council, the National Science Teacher Association, and the American Association for the Advancement of Science introduced the Next Generation Science Standards (NGSS) in 2011, which is a multistate effort to standardize science curriculum and science teaching in the United States (National Research Council, 2012). NGSS has gained a great amount of traction since its debut. As of 2019, 20 states adopted NGSS into their Common Core State Standards, further providing clear guidelines for the knowledge students need to be prepared for success in college. More states are expected to implement NGSS in the upcoming years.
Around the same time as NGSS launch, the Institute of Educational Sciences (IES), the research branch of the U.S. Department of Education, and the National Science Foundation, joined forces to create the Common Guidelines for Educational Research and Development. This initiative aimed to launch “cross-agency guidelines for improving the quality, coherence, and pace of knowledge development in science, technology, engineering, and mathematics (STEM) education” (IES & National Science Foundation, 2013). The guidelines outline six main types of research for knowledge generation: (1) Foundation Research, (2) Early-State or Exploratory Research, (3) Design and Development Research, (4) Efficacy Study, (5) Effectiveness Study, and (6) Scale-up study. The purpose of the first two types of research is to generate core knowledge in education, with the aim of examining, testing, and building theories and relational constructs in education. The third type of research is often used to pilot, test, and refine interventions. The other three types of research aim to measure the impact of interventions but vary in terms of the scale of generalization and context of implementation. For the three types of impact research, the guidelines emphasize that studies should heed WWC standards, such that they employ designs that reduce bias due to nonrandomization, establish adequate power to detect meaningful effects, clearly define outcome measures, and collect data on the fidelity of implementation. With the increased focus on improving K–12 science curriculum and emphasis on conducting studies to assess the effectiveness of science interventions, it is expected that more such impact studies will emerge.
Impact Studies to Improve Teacher Outcomes
There is growing evidence on the critical link between teacher quality and student achievement (Desimone, 2009; Scher & O’Reilly, 2009). In addition, several recent education reforms recognized the importance of teacher effectiveness in improving student performance in schools. The No Child Left Behind Act in 2002 and its successor the Every Student Succeeds Act in 2015 notably became driving forces for evidence-based reform of teacher effectiveness (Slavin, 2017). Under the guidelines of Every Student Succeeds Act, states have more flexibility in monitoring teacher effectiveness and establishing state-specific teacher evaluation systems. As a result, states are becoming less reliant on student achievement as the main measure of teacher accountability and focusing on using balanced systems of multiple measures to evaluate teachers (Close et al., 2018). The evolving teacher evaluation systems subsequently incited discussions on strategies for providing ongoing support, such as expanding professional development (PD) opportunities for teachers at the district and state levels.
The growing recognition of the importance of providing effective PD interventions to teachers led to the emergence of grant programs to support the development and evaluation of PD interventions. For example, IES created the “Effective Teachers and Effective Teaching” program, which supports research on interventions that target improving classroom teaching and subsequently student learning. Between 2003 and 2018, this program funded 39 Development and Innovation Goal-2 projects and 28 Efficacy and Replication Goal-3 projects. However, research on PD interventions still has much room for growth, especially for research on interventions for science teachers. Yoon et al. (2007) found only nine of more than 1,300 reviewed studies on teacher PD met the WWC standards with or without reservations. Of those that met the standards, only one study focused on science outcomes.
Impact Studies to Improve Student and Teacher Outcomes
Per the common guidelines, a key feature of impact research, which includes Efficacy, Effectiveness, and Scale-up studies, is the study design that supports causal inference. Specifically, the study design should contain elements that would produce strong causal conclusions, such that it would meet the WWC standards with or without reservations. This implies the use of RCTs or rigorous QEDs. In this article, we focus on the design of RCTs, though the results are also applicable to QEDs.
One critical aspect of designing impact studies of PD interventions is that often the intervention is expected to improve teacher outcomes and student outcomes. For instance, a study may seek to determine the effect of a PD program for science teachers on teacher content knowledge (CK) and teacher practice, as well as on student achievement. In this example, the program’s effects on teacher and student outcomes are both essential indicators of the program impact. Indeed, Desimone (2009) states that teacher knowledge, teacher quality, and student learning are three key outcomes of programs with a PD component. Teacher outcomes can mediate the intervention effect on student outcomes. The change in teacher outcomes can also be considered as a measure of the proximal program effect. Therefore, it is important for the study to be designed to detect both proximal teacher effects and distal student effects.
This article illustrates strategies for approaching power analyses when key outcomes are at both the student and the teacher level in a single study. We focus specifically on student and teacher outcomes for studies of interventions that aim to improve outcomes of science teachers and the achievement of their students in science. This is motivated by the aforementioned substantial need for conducting such rigorous impact studies in the area of science. Our analyses are facilitated by recent empirical work that has generated a compendium of design parameters (i.e., intraclass correlations [ICCs], outcome–covariate correlations, and benchmark effect sizes) for CK and teaching practices of science teachers (Kowalski et al., 2020; Westine et al., 2020). While the existing research on design parameters for similar outcomes of mathematics and reading teachers are limited, our analytic framework and some of our results can also provide useful lessons for the designs of studies of mathematics and reading interventions, which is discussed later.
This article is organized as follows. We begin by reviewing key components of power analyses for studies that examine student and teacher outcomes and the importance of conducting separate power analyses for each outcome. Next, we outline our approach to conducting the power calculations. We then present results from power analyses corresponding to an array of sample size and design parameter estimates. We conclude with a discussion of the implications of these results for designs of future studies.
A Priori Power Analysis for Studies Examining Student and Teacher Outcomes
A key step in designing a rigorous RCT is conducting an a priori power analysis to determine the sample size that will be adequate to determine a reasonable effect size. We are specifically interested in power analyses for cluster randomized trials (CRTs), which are commonly conducted to assess the efficacy of educational interventions (Spybrook et al., 2016). In a CRT, entire clusters, such as schools, are randomly assigned to study conditions. Consider different design options for evaluating a new PD intervention. One option entails randomly assigning schools to either implement the new intervention or carry on business as usual PD, where all participating teachers within a school receive the treatment or serve as a control. There are several benefits to assigning schools to study conditions, as opposed to assigning individual teachers. Having all teachers receive the treatment as an intact group minimizes potential contamination as interactions between treatment and control teachers are less likely. The theory also suggests that PD programs are more effective when implemented to teachers within intact groups, such as schools, to promote collaborative learning communities (Desimone 2009).
An a priori power analysis for a CRT is more complex than a power analysis for a nonclustered (i.e., single-level) RCT in which individuals are assigned to study conditions. This complexity comes from the additional design parameters that are needed for the power analysis. Consider a teacher-level outcome such as teacher CK. One design parameter is the extent to which outcome varies between clusters relative to the total outcome variance, or the ICC. In a two-level CRT with schools as the unit of randomization and teachers nested within schools, the ICC captures the variance of teacher CK between schools as a proportion of the total outcome variance. For example, an ICC of .20 indicates that 20% variation of the teacher CK outcome occurs between schools. The lower the ICC (i.e., the more homogenous the schools), the higher the statistical power, all other parameters held constant.
Another design parameter pertinent to CRTs is the percentage of variance explained by covariates (outcome-covariate correlation or the R2 coefficient). Outcome measures collected at baseline (aka pretest) are commonly used as covariates because pretests are often highly correlated with the outcomes of interest. In this case of teacher CK as the outcome, an R2 coefficient of .8 suggests that a measure of teacher CK collected as baseline would explain 80% of the variance in the teacher CK measure collected at the posttest. In CRTs, both individual-level and cluster-level covariates can be included to increase statistical power. For instance, a teacher pretest covariate can be used to explain the within-school variation and between-school variation in the teacher CK outcome.
The Need to Consider Two Power Analyses Together
In the remainder of this article, we consider statistical power for planning a study that seeks to detect the effect of a PD intervention on both teacher and student outcomes. We assume treatment, the new PD program, is randomly assigned at the school level and students are nested within teachers and teachers are nested within schools. For illustrative purposes, we consider teacher CK in science and student achievement in science as the teacher and student-level outcome of interest, respectively.
The design of the study to detect teacher effects is quite straightforward, it is a two-level CRT with teachers nested within schools. The ideal design of the study to detect student effects is also quite straightforward, it is a three-level CRT with students nested within teachers nested within schools. However, in practice, a two-level CRT, with students nested within schools, is often used for planning purposes. There are several reasons for this. First, a three-level CRT requires two ICC estimates, one that captures the percentage of the variance in student outcomes at the school level and one that captures the percentage of variance in student outcomes at the teacher level. Furthermore, it includes potentially three R2 estimates, one at the student, teacher, and school level, respectively. To date, there is very little empirical information regarding these two ICCs and three R2s for planning three-level CRT with students nested within teachers nested within schools. As such, this makes it difficult to use accurate estimates of these parameters in the power analysis at the design stage of a study and inaccurate estimates of design parameters can yield misleading results. Second, recent work shows that ignoring the teacher-level in a three-level CRT, and instead of conducting a power analysis using a two-level CRT with students nested within schools, does not markedly change the results of the power calculations (Zhu et al., 2012). This is because the variance at the teacher level shifts to the school and student levels but is still captured in the power analysis. For instance, Zu (2012) demonstrated that approximately 30% and 70% of the variances at the teacher level in a three-level CRT shift to the school and student level in the corresponding two-level CRT with the teacher level not explicitly accounted for. Furthermore, empirical estimates of design parameters (one ICC and two R2s) relevant for planning two-level CRTs with students nested within schools are more readily available. This allows a more accurate estimation of these important design parameters that leads to better a priori power analyses. For these reasons, we use a two-level CRT to conduct power calculations for student outcomes. This means that our power analysis for studies examining both the student and the teacher effects will be based on two two-level designs. For clarity, hereafter we refer to the two-level CRT with teachers nested within schools as the two-level CRT(T) and the two-level CRT with students nested within schools as the two-level CRT(S).
Although for both teacher and student outcomes we consider two-level models, it is important to recognize that the nesting structures are different. From the design perspective, this difference must be accounted for when planning the study. Consider the following example. Suppose a researcher is designing a study to test the effects of a teacher PD intervention on teacher CK and student achievement. The study plans to sample five teachers per school and 20 students per teacher or 100 students per school. The researcher seeks to determine the number of schools necessary for the study to detect the targeted student and teacher effects and assumes a two-level CRT for both. Naïvely, the researcher assumes a target effect size of 0.20 standard deviation units, an ICC of .25, an R2 value of .40 at the student level, and an R2 value of .80 at the cluster level for the power analysis for both student and teacher outcomes. The power analyses for student effects, assuming 100 students per school, reveals the study needs 45 schools to achieve the power of .80. The power analysis for teacher effects, assuming five teachers per school reveals the study needs 112 schools. Clearly, these analyses yield quite different results that may leave researchers questioning how many schools to recruit for a study.
The naïve approach illustrated above is misleading because design parameters and target effect sizes are different for different outcomes, and particularly for outcomes measured at different levels. For example, Westine et al. (2020) found a wider range of ICCs (.05–.29) for science teacher outcomes than the ICCs (.17–.31) for student science achievement outcomes (Spybrook et al., 2016). Similarly, the existing research on teacher PD interventions suggests that effect size magnitudes for teacher outcomes tend to be in the 0.41 to 0.63 range (Kowalski et al., 2020; Scher & O’Reilly, 2009), much larger than the range for student outcomes 0.20 to 0.30 (Hill et al., 2008). These highlight the importance of incorporating specific design parameters and effect sizes for different outcomes of interest in the power analyses. Then the corresponding results can be compared and reconciled to determine the number of schools to recruit for a study.
It is important to note that the correction for multiple hypothesis testing may be necessary when conducting power analyses for a study that examines the treatment effects across different outcomes. However, the correction for multiple comparisons is not necessary for a study that examines the treatment effects with the student and teacher outcomes because the two types of outcomes measure different constructs. In this article, we consider the tests of treatment effects with the student and teacher outcomes to answer two separate confirmatory questions; thus, the adjustment for multiple comparisons is not necessary (Schochet, 2009).
Analysis
As mentioned above, we examine statistical power for CRTs for interventions that seek to improve student science achievement as well CK and instructional practices of science teachers. These teacher outcomes are commonly used to assess the effectiveness of teacher interventions (Gallagher et al., 2011; O’Donnel, 2008) and recent research provided values of design parameters for these outcomes. To enable better comparisons between power calculations for student and teacher outcomes, we report minimum detectable effect size (MDES). The MDES is the smallest effect a study is designed to detect for a given level of power and alpha (Bloom, 2005). Equation 1 below shows the formula for calculating MDES for a two-level hierarchical linear model (HLM) (which applies to our two-level HLM(T) and a two-level HLM(S)).
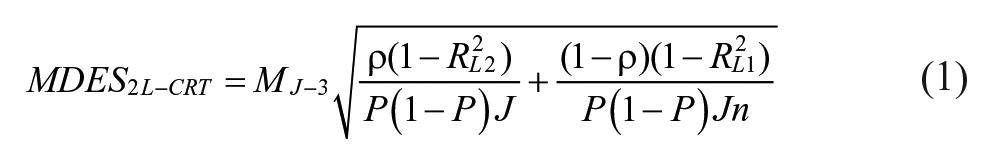
where n is the number of individuals (teachers or students) per cluster (school); J is the number of clusters; M is the group effect multiplier for a two-tailed test with J − 3 degrees of freedom with one level-two covariate; ρ is the ICC;
Equation 1 shows that the ICC,
Sample Sizes
We selected the numbers of schools, teacher, and students based on the sample sizes of federally funded efficacy studies, as well as common knowledge regarding school staffing and student-to-teacher ratios in K–12 settings. We assumed school as the unit of random assignment and allowed the total number of schools to vary from 25 to 65 schools. This range is consistent with the median range for the number of clusters randomized for IES Goal-3 Efficacy and Replication studies: 20–52 clusters (Spybrook et al., 2016). We limited the number of schools to 65 as CRTs with fewer than 100 schools are common in education (Hedges et al., 2012).
For the MDES calculations of teacher outcomes, we considered two scenarios. The first set the average number of teachers per school to five, which is common in elementary schools. The second assumed three teachers per school, which is more common in middle and high schools. These assumptions are consistent with the sample sizes used by RCTs that evaluated science interventions in the elementary and secondary school settings (Lee et al., 2016; Newman et al. 2012; Taylor et al., 2017).
For MDES calculations for student outcomes, we assumed 25 students nested within each teacher based on the average student-to-teacher ratio in elementary and secondary public schools (Synder et al., 2018), which is a good proxy for the average class size. Therefore, we set the number of students per school to 75 or 125 depending on the number of teachers per school, three or five. This is a conservative estimate because science teachers are likely to teach multiple classrooms, thus they may teach more than 25 students at a given point in time.
Design Parameters
For student outcomes, the values we chose for the ICC and R2 parameters came from Spybrook et al. (2016), who reported them for Grades 4 to 11 science achievement outcomes in Michigan, Wisconsin, and Texas (see Table 1). For teacher outcomes, the design parameters were based on plausible values from the empirical analyses for science teacher instructional practice and CK outcomes (Westine et al. 2020). See online Supplemental Appendix A for additional discussions regarding our choices of design parameters.
Empirical Estimate of Design Parameters for Science Based on the Literature for Two-Level CRTs a
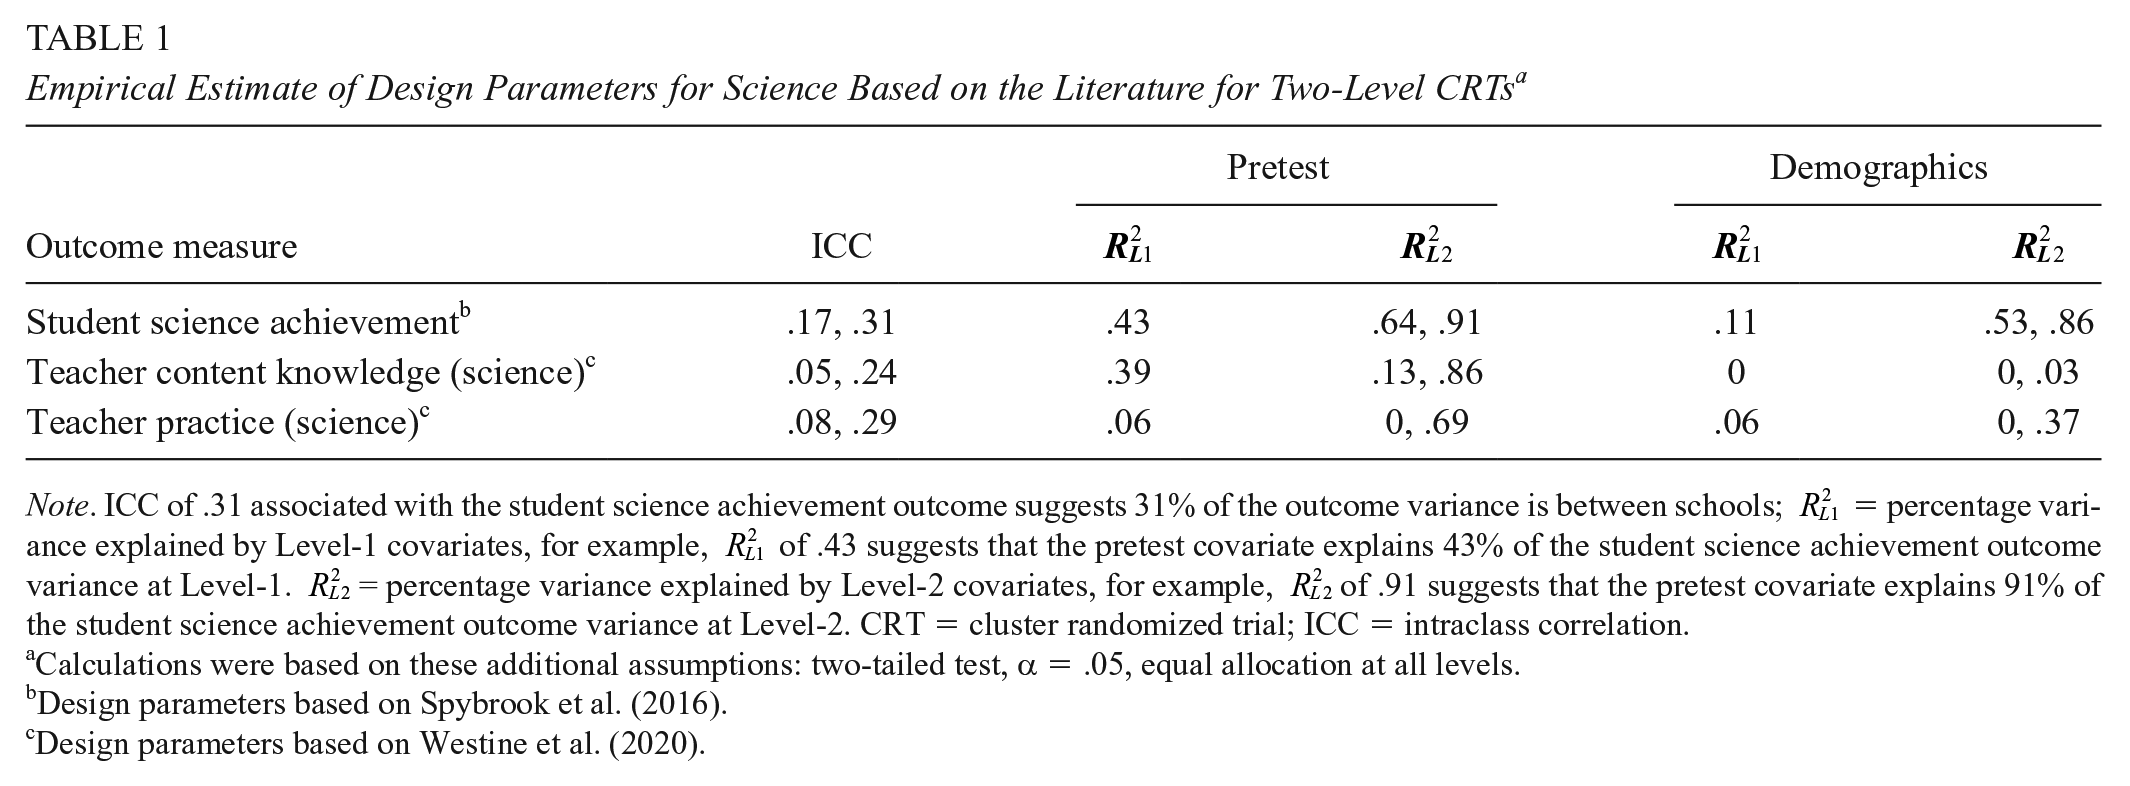
Note. ICC of .31 associated with the student science achievement outcome suggests 31% of the outcome variance is between schools;
Calculations were based on these additional assumptions: two-tailed test, α = .05, equal allocation at all levels.bDesign parameters based on Spybrook et al. (2016).cDesign parameters based on Westine et al. (2020).
Results
This section presents results. First, we show MDES calculations for two-level HLM(S) and two-level HLM(T) without any covariates under the two sample size assumptions. Then, we present MDES results for the two sample size scenarios with the inclusion of a pretest or demographic covariates.
MDES Without Covariates
Figure 1 presents MDES estimates in the absence of the pretest and demographic covariates. The range of the MDES estimates for student science achievement outcomes (black line, black circle) overlaps with that for teacher outcomes (blue and red lines, blue square, red triangle) despite the higher ICC range for student outcomes than teacher outcomes. This result is primarily driven by that the assumed number of students per school (125 students) is much larger than the assumed number of teachers per school (five teachers). This result suggests that a study may be able to detect similar effect sizes for students and teachers if the impacts are estimated with no covariates.

Calculated minimum detectable effect size (MDES) without covariates, based on student science achievement outcome (black line, black circle), teacher content knowledge outcome (blue line, blue square), teacher practice outcome (red line, red triangle), with varying number of schools, five teachers and 125 students per school.
Figure 2 shows the results for the second sample size scenario with lower number of teachers and students per school: 75 students and three teachers per school. The MDES range for student achievement (black line, black circle) with 75 students per school is similar to the range with 125 students per school, which indicates that reducing the student sample size from 125 to 75 students per school does not have much effect on the student MDES. In this case, however, the MDES range for teacher outcomes no longer overlaps with that for student achievement. In fact, the MDES range for teacher CK (blue line, blue square) and teacher instructional practices (red line, red triangle) widened as the number of teachers per school decreased from five to three. This indicates the trade-off between the number of schools and number of teachers per school (i.e., the smaller the number of teachers per school, the larger the number of schools) needed to detect a given effect size for teachers when impact estimation is carried out with no covariates.

Calculated minimum detectable effect size (MDES) without covariates, based on student science achievement outcome (black line, black circle), teacher content knowledge outcome (blue line, blue square), teacher practice outcome (red line, red triangle), with varying number of schools, three teachers and 75 students per school.
Figures 1 and 2 show that the MDES estimates for student and teacher outcomes are generally large without covariates. For student achievement, we rely on the range of effect size benchmarks determined by Hill et al. (2008): between 0.2 and 0.3. When a study has 65 schools, regardless of whether it includes 125 students or 75 students per school, the MDES range for student outcomes is similar to the effect size ranges determined by Hill et al. (2008).
A smaller number of schools (J = 55, nteacher = 5) are necessary to detect the teacher effect consistent with the overall mean effect size of 0.51 observed for science teacher interventions in a meta-analysis on the effect of educational interventions on science teacher outcomes (Kowalski et al. 2020). We rely the effect size of 0.51 determined by Kowalski et al. (2020) as the benchmark to interpret our results associated with the teacher outcomes. More schools (J = 65) are necessary for a study to detect a treatment effect for teachers in the case of three teachers per school. However, it is important to note that these results are based on MDESs estimated without covariates. It is common practice to include covariates in the design of a study. We present the MDES results without covariates here to contrast the results with covariates considered. Next, we demonstrate the effects of pretest and demographic covariates on MDES under the two sample size assumptions.
MDES With Covariates: Five Teachers and 125 Students per School
Figure 3 shows the MDES estimates for student achievement (solid black line, black circle), teacher CK (solid blue line, blue square), and teacher practice (solid red line, red triangle) with five teachers and 125 students per school. The solid lines represent the MDES estimates with the pretest covariate and the dashed lines show calculations conducted with the demographic covariates. For each type of covariate, we discuss MDES estimates for the student outcome first followed by MDES estimates for teacher outcomes.

Calculated minimum detectable effect size (MDES)–based student achievement outcome (black line, black circle), teacher content knowledge outcome (blue line, blue square), teacher practice outcome (red line, red triangle), with varying number of schools, five teachers and 125 students per school. The solid line and the dashed line represent estimates with pretest and demographic covariates considered, respectively.
Pretest Covariate
We highlight two key findings related to MDES estimates for student achievement. First, as expected, the MDES estimates with the pretest covariate (Figure 3) are much smaller than those with no covariates (Figure 1). Second, with 40 schools the MDES range with pretest (0.16–0.40) overlaps with the benchmark effect size range of 0.2 to 0.3 (Hill et al., 2008). This suggests that studies with less than 40 schools may not have sufficient power to detect a plausible effect size for student achievement even with the pretest covariate.
Switching to teacher outcomes, the MDES estimates are smaller for teacher CK with a pretest covariate than with no covariates. With 40 schools, the upper MDES bound coincides with the benchmark effect size of 0.51 for science teachers (Kowalski et al., 2020). This result suggests that a study with 40 schools can detect plausible effects on both student achievement and teacher CK.
Considering teacher practice, the MDES with the pretest covariate are again smaller than with no covariates (Figure 3). It is interesting to note that the MDES estimates for teacher practice (solid red line) are larger than that for teacher CK, which is a result of slightly larger ICC range and smaller R2 values. Figure 3 shows that we would need at least 50 schools to detect the 0.51 benchmark for teacher practice.
Demographic Covariates
Figure 3 shows the MDES ranges for student academic achievement (dashed black line, black circle), teacher CK (dashed blue line, blue square), and teacher practice outcome (dashed red line, red triangle) with demographic covariates when the number of teachers and students per school were set to five teachers and 125 students.
Two key findings are worth highlighting for student science achievement. First, while the MDES range with demographic covariates is smaller than that with no covariates, it is slightly larger than that with a pretest covariate. The latter result is driven by smaller Level-1 and Level-2 R2 values for student demographic covariates than the pretest covariate. Second, a study would need at least 55 schools to meet the upper bound benchmark effect size (0.3) found by Hill et al. (2008). This suggests that the number of schools should be increased from 40 to 55 if a pretest covariate was replaced with demographic covariates when the average number of students per schools is 125.
Switching to key findings for teacher outcomes, we note the MDES range for teacher CK with teacher demographic covariates is not very different than the range with no covariates, which is not surprising given the small R2 values corresponding the demographic covariates in Table 1. Figure 3 shows that a study would need at least 50 schools (each with five teachers on average) to be able to detect the benchmark effect size of 0.51. This suggests that 10 additional schools would be needed if a study swapped the pretest covariate with demographic covariates.
We see similar results for teacher practice: Inclusion of demographic covariates hardly changes the MDES estimates. The sample size requirement for the benchmark effect size of 0.51 is 55 schools compared to the 50 schools needed for the benchmark with the pretest covariate.
MDES With Covariates: Three Teachers and 75 Students per School
Figure 4 shows results from parallel analyses conducted for the scenario with three teachers and 75 students per school. Below, we summarize key findings for student science achievement (solid black line, black circle), followed by teacher CK (solid blue line, blue square) and teacher practice (solid red line, red triangle) when pretest and demographic measures are used as covariates.

Calculated minimum detectable effect size (MDES)–based student achievement outcome (black line, black circle), teacher content knowledge outcome (blue line, blue square), teacher practice outcome (red line, red triangle), with varying number of schools, three teachers and 75 students per school. The solid line and the dashed line represent estimates with pretest and demographic covariates considered, respectively.
Pretest Covariate
A comparison of Figures 3 and 4 indicates minimal changes to the MDES for student achievement as the number of students per school decreases from 125 to 75. Indeed, the range of MDES coincides with the benchmark effect size of 0.2 to 0.3 (Hill et al., 2008) as the number schools approaches 40, which is the same number of schools needed for this benchmark when the number of students is 125.
For a given number of schools, the MDES range with three teachers per schools is higher than that with five teachers per school. For instance, the MDES range for teacher CK with pretest is 0.47 to 0.64 with 30 schools and three teachers per school compared to the range of 0.37 to 0.58 with 30 schools and five teachers per school. Figure 4 suggests that for teacher CK, 45 schools are needed to detect the benchmark teacher effect size of 0.52. This result indicates that reducing the number of teachers per school from five to three raises the number of schools needed to detect the benchmark from 40 to 45.
We see similar results for teacher practice. We would need at least 55 schools to detect the effect size benchmark with three teachers per school and a pretest covariate.
Demographic Covariates
Similar to the pretest covariate, reducing the number of students per school from 125 to 75 does not change the MDES range for student achievement with demographic covariates. The upper bound of the MDES range for student achievement includes the upper bound of the benchmark effect size (0.3) at 55 schools, suggesting that the same numbers of schools (J = 55) would be necessary when using only demographic covariates.
With teacher demographic covariates, we find that 55 schools would be needed to detect the benchmark effect size for teacher CK when there are three teachers per school. This result suggests that a study would need five more schools if the number of teachers per school decreased from five to three. For teacher practice, with three teachers per school, the required number of schools to detect the benchmark is 60 schools, which is five schools higher than the requirement with five teachers per school.
Discussion
This article discusses design considerations for researchers when planning a study that estimates causal effects of an intervention on both teachers and students. The foremost important design element, in regard to statistical power, is having sufficient sample sizes to optimally align the power to detect meaningful and plausible effects for both teacher and student outcomes. We show that studies that include at least 40 schools, five teachers per school, and 25 students per teacher may be able to detect empirical effect size benchmarks suggested by the literature when the outcomes of interest are student science achievement and science teacher CK and that pretest covariates are used to explain the variation in these outcomes. A study that uses instructional practice as the teacher outcome would need at least 55 schools, five teachers per school, and 25 students per teacher.
Using Covariates to Increase Statistical Power
One of the important contributions of this article is highlighting the important role the pretest covariate plays in making sure that the number of schools necessary to power a study is similar for detecting the student and the teacher effects. Without any covariates, the MDES estimates were similar for student achievement, teacher CK, and teacher practice. We showed that a study would need at least 55 schools to detect the effect size benchmarks for student and teacher outcomes with five teachers and 125 students per school and no covariates. However, the MDES estimates for student achievement were smaller than those for teacher outcomes when the pretest covariate was considered, because the pretest covariate explained more of the variation in student achievement than either the teacher CK or practice outcomes. With five teachers and 125 students per school, we also showed that 40 schools would be sufficient to meet the benchmarks for student achievement and teacher CK when pretest covariates are used, 15 schools fewer than the case with no covariate. Furthermore, our result showed that 50 schools were needed for a study to detect the benchmark for teacher practice with five teachers per school, which is five schools fewer if the study does not include any covariate. These results clearly indicate that pretest covariates are important in reducing sample sizes requirements of CRTs.
We acknowledge that pretest covariates are not always available. For example, teacher pretest is often not accessible during the design phase of an impact study. The cost associated with collecting teacher pretreatment data, including the cost of developing parallel forms of pre- and postassessments, also limits the availability of teacher pretests (Kelcey & Phelps, 2013). Thus, we also considered the use of teacher demographic covariates, which tend to be more accessible from administrative databases. When we only considered demographic covariates, the number of schools needed to detect the benchmarks for teacher CK and practice is higher than the sample size requirements with pretest covariates. This difference is driven by the smaller Level-1 and Level-2 R2 values for teacher demographic covariates than pretest. Our results showed that student and teacher demographic covariates suggested that at 55 schools, five teachers and 125 students per school are necessary to sufficiently detect effects associated with teacher CK, teacher practice, and student achievement. Studies with less than 55 schools may be powered to detect student effects, but they may not be equipped to detect the teacher effects. This would also be true if we conducted the power analysis with a pretest covariate for student achievement and teacher demographic covariates for teacher outcomes, which is a highly plausible scenario that one can encounter in real life.
Adjusting Power by Changing Number of Teachers and Students per School
Another important result of this article pertains to the impact that the number of teachers and students has on power. As the number of teachers per school shifted from five to three, the MDES estimates for both the teacher CK and practice outcomes increased, which in turn increased the number of schools needed to detect the benchmark effect sizes. We found at least five more schools would be needed to detect a meaningful teacher effect with either the teacher pretest covariate or the demographic covariates as the number of teachers changed from five to three. However, the shift from 125 students to 75 students per school resulted in a relatively small change in the power estimates or sample size requirements for student achievement. These results demonstrate that a change in the number of individual-level units does (not) affect the power much when there is a small (large) number of individuals per cluster to begin with.
The MDES estimates corresponding to the scenario with three teachers and 75 students per school highlight the importance of considering the idea of over- and underpower when planning a study. Suppose a group of researchers is designing a PD intervention that provides instructional practice support for elementary science teachers. They plan to assign schools to either implement the intervention or continue with the business as usual program. The researchers are interested in determining the impact of the intervention on both students and teachers via outcome measures including student science achievement and teacher classroom practice. Due to time and budget constraints, the researchers are limited to include only three science teachers per school and 25 students per teacher. The researchers are only able to collect pretest data for these teachers and students. Based on our results, at least 55 schools are necessary to power the study to detect benchmarks for teacher outcomes but a smaller number of schools (40) would be sufficient to detect the benchmarks for student achievement. With 55 schools, this study may be overpowered or may have more schools than necessary to detect the causal effect for students. However, if the study only considers student achievement and sets the target sample size to 40 schools, then the study may be underpowered, or may not have enough schools to detect the effect for teachers’ practice. In the case of an underpowered study, it may be safe to oversample schools or individuals to ensure that plausible effects for both teachers and students are detectable with the caveat that oversampling would increase the cost of collecting data on the additional sample units.
Aligning Power Analysis to Study Context
Studies may minimize overpowering and underpowering by determining the most appropriate ICCs and R2 values given the study context. In this article, we consider a wide range of ICCs for teacher outcomes from .05 to .29. This wide range of teacher ICCs suggests that a teacher outcome may vary slightly between schools within a certain study context but it may have much larger between-school variation in another context. Thus, selecting an ICC that best describes the expected outcome variation in a study is imperative to increase the precision of the power calculations and avoid over- or undersampling.
The results of our study provide some potential guidance for researchers to determine the sample sizes necessary to power a study that seeks to determine both teacher and student effects. However, when designing a study, it is critical to find design parameters that are most relevant for a particular context. For example, a researcher who is interested in designing an impact study for a PD intervention focused on elementary English learners may refer to the study conducted by Lee and colleagues for the P-SELL (Promoting Science Among English Language Learners) intervention that examines the effect of the intervention on elementary science teachers’ instructional practices (Lee et al., 2016). A researcher may refer to ICCs (.09–.13) and effect sizes (0.41–0.52) associated with the instructional practice outcome found in the P-SELL study when carrying out the power analysis.
Application for Planning Other Types of CRTs
As noted above, we worked with outcomes of science teachers and student achievement in science, which is facilitated by the availability of design parameter values needed for our analyses for these outcomes. It is important to note that although we focus on science outcomes, lessons from this study can provide useful guidance for the planning of CRTs that aim to improve student and teacher outcomes in mathematics and reading. This is possible because the design parameters for student and teacher outcomes in science are similar to those for math and reading. For instance, Hedges and Hedberg (2007) found similar ranges of ICCs and R2 values for student math and reading achievement using national longitudinal data (see Table 2). The benchmark effect sizes of 0.20 to 0.30 also apply to math and reading interventions (Hill et al., 2008). This suggests the number of schools needed to sufficiently power CRTs that aims to detect meaningful effects for student science achievement also applies to the planning of CRTs with math and reading achievement outcomes. Table 2 outlines the range of ICCs and R2 values determined Hedges and Hedberg (2007).
Empirical Estimate of Design Parameters for Mathematics and Reading Based on the Literature for Two-Level CRTs
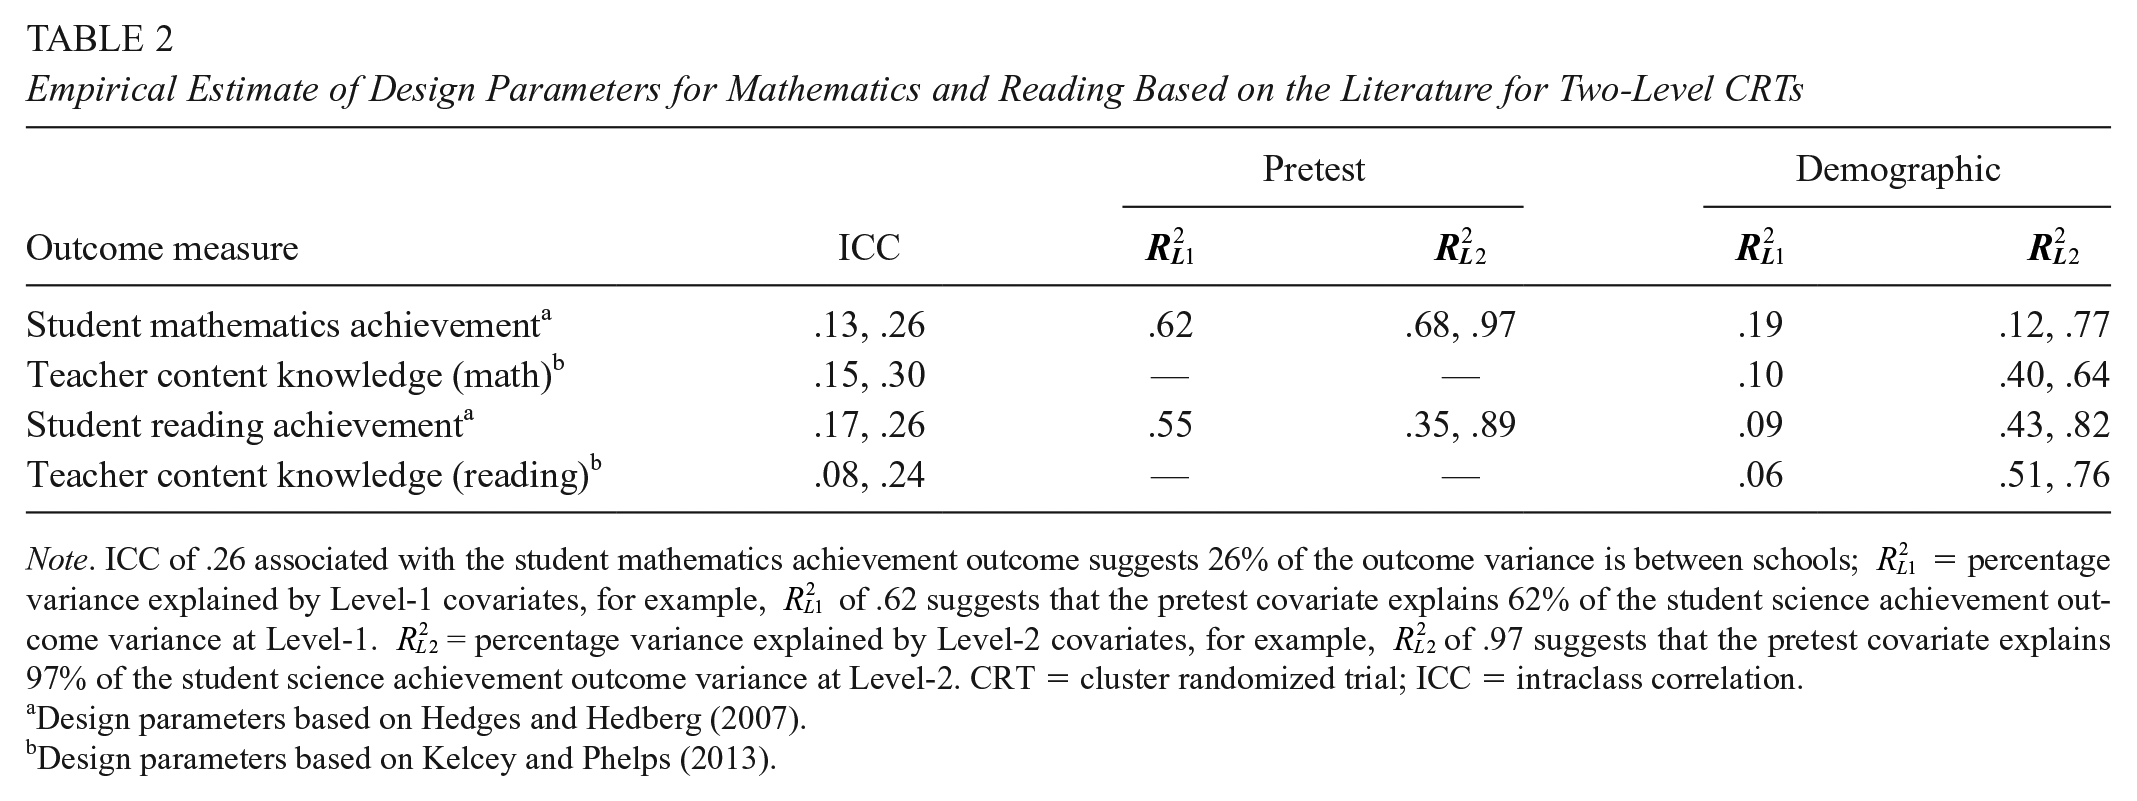
Note. ICC of .26 associated with the student mathematics achievement outcome suggests 26% of the outcome variance is between schools;
Design parameters based on Hedges and Hedberg (2007).bDesign parameters based on Kelcey and Phelps (2013).
Table 2 also outlines the ranges of ICC and R2 values for teacher demographic covariates for teacher CK outcome in math and reading, retrieved from Kelcey and Phelps (2013). The ICCs for math and reading teacher CK outcomes are similar to those for science teacher CK, suggesting that the number of schools required to sufficiently power CRTs to detect meaningful effects of math or reading teacher CK is the same as those for science teacher CK, without the consideration of covariates. However, the
It is important to note that the application of our results for planning CRTs with student and teacher outcomes in math and reading is limited by the empirical work available on teacher outcomes. Currently, we are not aware of any studies that present design parameters for teacher instructional practice outcomes in math and reading. R2 values for the pretest covariate for teacher CK outcomes in math and reading are also unavailable. Furthermore, systematic synthesis of effect sizes for interventions that aim to improve teacher outcomes in math and reading, which is important for contextualizing power estimates, are rare in the literature. This speaks to the need for more empirical analysis of design parameters not only to improve the precision of design for CRTs with teacher outcomes but also to better inform the planning of CRTs with both student and teacher outcomes.
Supplemental Material
Appendix_A – Supplemental material for Examining Design and Statistical Power for Planning Cluster Randomized Trials Aimed at Improving Student Science Achievement and Science Teacher Outcomes
Supplemental material, Appendix_A for Examining Design and Statistical Power for Planning Cluster Randomized Trials Aimed at Improving Student Science Achievement and Science Teacher Outcomes by Qi Zhang, Jessaca Spybrook and Fatih Unlu in AERA Open
Supplemental Material
Appendix_B – Supplemental material for Examining Design and Statistical Power for Planning Cluster Randomized Trials Aimed at Improving Student Science Achievement and Science Teacher Outcomes
Supplemental material, Appendix_B for Examining Design and Statistical Power for Planning Cluster Randomized Trials Aimed at Improving Student Science Achievement and Science Teacher Outcomes by Qi Zhang, Jessaca Spybrook and Fatih Unlu in AERA Open
Footnotes
Authors
References
Supplementary Material
Please find the following supplemental material available below.
For Open Access articles published under a Creative Commons License, all supplemental material carries the same license as the article it is associated with.
For non-Open Access articles published, all supplemental material carries a non-exclusive license, and permission requests for re-use of supplemental material or any part of supplemental material shall be sent directly to the copyright owner as specified in the copyright notice associated with the article.