
Abstract
Several state policies link high-stakes consequences to teacher evaluations, which tend to be heavily weighted by observation scores. However, research has only recently investigated the validity of these scores in field settings. This study examines the sensitivity of teacher observation scores to the number of observations assigned by state policy and the assignment of prior-year composite measures produced by the evaluation system. Regression discontinuity and local regression designs exploit discontinuities in both assignment processes. The evidence suggests that assignment to a lower prior-year composite score does not bias observation scores, but the assignment to more policy-assigned observations introduces substantial negative bias. The degree of negative bias is most pronounced among early-career teachers, as suggested by theory. Implications are discussed.
Keywords
Throughout the first two decades of the 21st century, many local and state education agencies in the United States substantially reformed teacher evaluation (Putman et al., 2018; Steinberg & Donaldson, 2016; Walsh et al., 2017). One of the most widely adopted reforms substantially changed teacher observation systems (Cohen & Goldhaber, 2016). Many education agencies altered teacher observation systems by increasing the frequency of teacher observations and adopting standards-based protocols (e.g., the widely adopted Framework for Teaching; American Institutes for Research, 2016; National Council on Teacher Quality, 2019a, 2019b). Additionally, some state education agencies began assigning observations based on combinations of teacher prior-year performance (i.e., how teachers taught) or productivity (i.e., changes in schooling outcomes such as growth in student achievement scores; American Institutes for Research, 2016; National Council on Teacher Quality, 2019a; Putman et al., 2018; Walsh et al., 2017). Historically, states differentiating the assignment of observations did so based on teaching experience or tenure, not prior-year performance or productivity (Steinberg & Donaldson, 2016). Some scholars refer to systems incorporating these reforms as “next-generation” evaluation systems (Campbell & Ronfeldt, 2018; Steinberg & Donaldson, 2016).
Research finds that observation scores (i.e., a performance measure) tend to receive the most weight among the performance and productivity measures informing high-stakes outcomes (Cohen & Goldhaber, 2016; Steinberg & Donaldson, 2016). By the mid–2010s, nearly half of all states attached punitive consequences (e.g., loss of tenure) to low teacher performance or productivity (American Institutes for Research, 2016). The weight states typically gave to observation scores means these scores play a significant role in the allocation of high-stakes consequences. Despite the importance of these observation scores, only a few studies examine the validity of teacher observation scores in next-generation systems, and many of these studies use data from the well-known Measures of Effective Teaching study (e.g., Campbell & Ronfeldt, 2018; Steinberg & Garrett, 2016). Stated differently, we are learning a great deal about the validity of researcher-generated observation scores produced in one small-scale experimental setting, but there is still a great deal to learn about the properties of observation scores generated by practitioners (i.e., typically school administrators) in field settings.
Understanding the properties of observation scores in field settings is critical because bias in observation scores (i.e., deviations from “true” scores based solely on teacher performance) may undermine the primary goals of teacher evaluation. Although teacher evaluation systems inform personnel decision making, state education agency leaders tend to emphasize teacher evaluation as developmental (Almy, 2011; Donaldson & Papay, 2014; Georgia Department of Education, 2012; Tennessee Department of Education, 2016). However, scholars argue that the effectiveness of evaluation as a developmental tool depends on employee trust in the evaluation system (Lane, 2019; K. R. Murphy & Cleveland, 1995). Indeed, Donaldson (2012) finds that teacher trust in evaluation systems diminishes when teachers believe their observation scores are influenced by external factors.
Previous research concerning bias in next-generation observation scores primarily focuses on the characteristics of teachers and students (e.g., Campbell & Ronfeldt, 2018; Jacob & Walsh, 2011; Steinberg & Garrett, 2016). This work typically finds that observation scores are influenced or predicted by several student and teacher variables, such as student race (Campbell & Ronfeldt, 2018), teaching experience (Jacob & Walsh, 2011), and the prior-year achievement of incoming students (Campbell & Ronfeldt, 2018; Steinberg & Garrett, 2016). However, as the authors of these previous studies discuss, these effects or relationships may not represent bias. 1
This study extends the literature concerning theories of bias and research on the validity of next-generation observation scores by exploring two previously unexamined sources of bias: prior-year teacher effectiveness scores (i.e., a composite measure of teacher performance and productivity) and the number of observations assigned to teachers by state policy. After the start of each school year, teachers in the study setting receive their effectiveness score that determines how many observations they should receive per state policy. Theories of bias in observation scores imply that observers might (un)consciously base subsequent observation scores on prior-year effectiveness scores and the number of observations assigned to a teacher independent of the teacher’s observed performance. Psychologists label this “assimilation bias,” because observers generate scores assimilating toward their expectations of employee performance (Sumer & Knight, 1996).
Conceptual Framework
Scholars define observer bias as the extent to which scores systematically 2 deviate from an employee’s “true performance” (Bernardin et al., 2016; Park et al., 2015; Wherry & Bartlett, 1982). Few studies examine observer bias in next-generation teacher observation systems, and even fewer use data from field settings (see below). Studies examining bias in next-generation systems tend to focus on the influence of “classroom characteristics” and teacher and observer demographics (e.g., Campbell & Ronfeldt, 2018; Steinberg & Garrett, 2016). However, earlier psychological works recognizes other sources of bias. Indeed, some work implies that bias may arise from features of the evaluation system.
In broad terms, previous work explores context-independent or context-dependent bias. 3 Context-independent bias originates from the observer herself (Park et al., 2015). For example, observers who systematically issue lower ratings relative to other observers exhibit “severity” bias (Engelhard, 1994). Relative to the body of work examining context-independent observer bias, context-dependent bias has received less attention (Park et al., 2015). However, there is growing interest in context-dependent sources of bias in teacher observation scores. Research suggests that teacher observation scores are influenced by several conditions including grade taught and student characteristics (Campbell & Ronfeldt, 2018; Graham et al., 2012; Mihaly & McCaffrey, 2014; Steinberg & Garrett, 2016).
More recent work examines the influence of classroom characteristics. Steinberg and Garrett (2016) and Campbell and Ronfeldt (2018) use Measures of Effective Teaching (MET) experimental data to identify the extent to which researcher-generated observation scores are influenced by incoming student: achievement scores, race/ ethnicity, and gender. Steinberg and Garrett (2016) find that incoming achievement scores positively influence observational ratings and conclude that the relationship may capture observer bias or genuine teacher responses to student instructional needs. Campbell and Ronfeldt (2018) find that teacher observation scores are lower when a higher proportion of the students taught are Black, Hispanic, male, and have lower prior-year achievement scores; these authors imply that classroom characteristics are a source of observer bias.
Previous work also suggests that employee (i.e., teacher) gender, race, and observer-employee race congruence influenced performance ratings. Using MET data, researchers find that male teachers receive systematically lower observation scores than females (Campbell & Ronfeldt, 2018). Research within and beyond educational settings finds that Black employees (i.e., teachers) tend to receive lower ratings than Whites (Arvey & Murphy, 1998; Campbell & Ronfeldt, 2018), and employees sharing the same race as their observer (i.e., race-congruent) tend to receive higher observation scores (Arvey & Murphy, 1998).
Assimilation Bias
Psychologists also argue that information about prior performance or productivity can introduce context-dependent bias by influencing observer expectations of employee performance independent of subsequently observed performance (Hogan, 1987; Kingstrom & Mainstone, 1985; Lawler, 1967; Wherry & Bartlett, 1982). Psychologists label bias toward information about the employee’s prior performance or productivity assimilation bias (Sumer & Knight, 1996; Wang et al., 2010). The theory of assimilation bias does not suggest that information about prior performance or productivity should be unrelated to subsequent performance scores. Indeed, researchers consider measures of teacher performance and productivity unreliable if past and contemporary scores are not strongly related (e.g., Amrein-Beardsley, 2008; Brennan, 2001; Grossman et al., 2013; Hill et al., 2012; Ho & Kane, 2013). Instead, assimilation bias arises when information “shocks” observer expectations of employee performance, independent of observed performance. Importantly, assimilation bias does not depend on an individual’s prior performance relative to her peers’ prior performances, but on the individual’s prior performance relative to a performance scale. For example, negative assimilation bias will theoretically still affect teachers in a school filled with only teachers who received the highest prior-year performance rating on a performance scale.
It is difficult to disentangle assimilation bias from genuine differences in employee performance, especially in field settings; however, laboratory research finds evidence of assimilation bias (Sumer & Knight, 1996; Wang et al., 2010). Laboratory studies have assigned participants vignettes about a hypothetical employee’s performance and asked participants to rate the performance. Before reading the vignettes, participants were randomly assigned an additional vignette about the hypothetical employee’s prior performance. Some of the second vignettes described high prior performance, others described low prior performance. Each study found some evidence that participant-generated ratings positively correlated with the prior performance described in the randomly assigned vignette (Sumer & Knight, 1996; Wang et al., 2010).
Moderator: Job Experience
Shocks to observer expectations about employee performance theoretically depend on the amount of information an observer has about employee prior performance (Hogan, 1987; Lawler, 1967; Wherry & Bartlett, 1982). Indeed, psychologists argue that assimilation bias may be more pronounced among newer employees (Hogan, 1987; Lawler, 1967; K. R. Murphy & Deshon, 2000; Wherry & Bartlett, 1982). As employees accrue performance histories relevant performance behaviors become accessible to the observer and will theoretically counter biasing shocks to observer expectations (Conway, 1996; Kingstrom & Mainstone, 1985).
Hypotheses
This study hypothesizes that prior-year effectiveness scores and the assignment of some number of observations by state policy are sources of assimilation bias. As discussed above, previous laboratory studies suggest that observer knowledge about employee prior performance may be a source of assimilation bias. Although few, if any, studies examine the assignment of observations as a source of bias, it may shock observer expectations about employee performance. Observers may (un)consciously believe that employees assigned more observations are less effective, independent of subsequently observed performance. Otherwise, why would the teacher evaluation system assign more observations? Indeed, in the study context, some teachers are assigned more observations due to lower prior-year effectiveness scores. However, the relationship between prior-year effectiveness and observation assignment is not perfectly collinear for all teachers in the study context, allowing for separate examinations of these potential sources of assimilation bias. Additionally, based on previous research concerning the theoretical moderation of assimilation bias, this study also hypothesizes that the degree of bias will be the strongest for early-career teachers.
Study Context: Teacher Evaluation and Observation in Tennessee
In the early 2010s, the Tennessee Department of Education (TDOE) adopted the Tennessee Educator Acceleration Model (TEAM) teacher evaluation system. The TEAM system includes several reforms, but two of the most prominent are the introduction of a composite measure of teacher effectiveness and changes to teacher observation policy. TDOE labels the composite measure the “Level of Effectiveness” (LOE). LOE and certification status, which is effectively determined by years of experience, became the determinants of policy-assigned observations.
Level of Effectiveness Scores
TDOE generates two expressions of teacher LOE scores. LOE-cont, the first expression, is a continuous, composite measure determined by observation scores and student outcomes. Student outcomes include two categories: “achievement” and “growth” scores. Achievement scores are district- or school-wide student outcomes, including graduation rates and test scores. The source of teacher growth scores depends on whether the teacher taught a tested subject. Teachers of tested subjects receive a value-added score produced by the Tennessee Value-Added Assessment System (i.e., the well-known TVAAS score). Teachers of untested subjects do not receive individual TVAAS scores. Growth scores for more than 80% of these latter teachers are based on a school-wide value-added score produced by TVAAS (for details see SAS, 2015). Growth scores for the remaining “untested” teachers are based on other value-added (e.g., subject-specific), portfolio (e.g., Fine Arts portfolios), or assessment scores (e.g., standardized K–2 student assessments), chosen by the teacher and her evaluator at the beginning of the school year prior to the teacher’s first observation. At least 50% of LOE-Cont for teachers of tested subjects is based on student outcomes with the remainder determined by observation scores. For teachers of untested subjects, at least 40% of LOE-Cont is determined by student outcomes with the rest based on observation scores. TDOE converts LOE-Cont to the second expression of effectiveness scores, discrete LOE. LOE-Cont scores within [100, 200), [200, 275), [275,350), [350, 425), or [425, 500] are respectively assigned discrete LOE of LOE1, LOE2, LOE3, LOE4, or LOE5.
After the start of each school year during the study period (2012–2013 through 2014–2015), each teacher received her own discrete LOE score while school administrators, and the observers who were not school administrators, received the discrete LOE of teachers they were to evaluate. It was important for observers to know a teacher’s discrete LOE because it determined the number of observations assigned by state policy. During the study period, the state information management system did not tell observers how many times they should observe a teacher; instead, observers were expected to determine the number of observations needed based on discrete LOE and certification status. Supplementary Appendix A presents strong evidence that observers issued observations based on these two policy-defined determinants. Additionally, no observers or teachers ever received LOE-Cont; thus, observers nor teachers knew if a teacher assigned to a discrete LOE had a “high” or “low” LOE-cont within the discrete LOE. Prior-year discrete LOE is used to test the hypotheses that prior-year effectiveness scores introduce assimilation bias.
Tenure
Teachers with at least 5 years’ experience who have not received an LOE-Cont 4 below 350 in the past 3 years are eligible for “tenure” (Tennessee General Assembly, 2016); however, tenure protections in Tennessee are weak. A tenured Tennessee teacher can lose tenure due to 2 years of low effectiveness scores (Tennessee General Assembly, 2016).
TEAM Observation Policy
The Tennessee State Board of Education (2013) adopted several observation policies in the early 2010s. First, only annually certified observers could conduct formal observations (henceforth “observations”). Observer certification focuses on generating accurate and reliable observation scores and facilitating pre- and postobservation conferences to improve teacher performance (Alexander, 2016). The majority of observers 5 are principals or assistant principals, a small percentage of observers are full-time teacher evaluators, and the remainder are central office personnel (Alexander, 2016).
Second, TEAM observers must use the TEAM standards-based protocol, or “TEAM rubric” (see Supplementary Appendix B). The TEAM rubric is used to measure teacher performance concerning Planning, Instruction, and the Classroom Environment. Third, after the start of each school year, TEAM teachers receive their discrete LOE and certification status, which determines the number of observations assigned to teachers by state policy. Certification status indicates whether a teacher has taught fewer than 4 years (“Apprentice”), or not (“Professional”).
Policy assigns teachers with a prior-year LOE5 (LOE-cont ≥ 425) one observation, and teachers with a prior-year LOE1 (LOE-cont < 200) four. The number of observations assigned to teachers with a prior-year LOE2 through LOE4 (200 ≤ LOE-cont < 425) is two or four, depending on certification status. Thus, there are two discontinuities in the number of policy-assigned observations at the LOE-cont 425 threshold, and one at the 200 threshold. The only discrete LOE within which there are discontinuities in observations are LOE2 through LOE4. See Figure 1 for a graphical representation of the observation assignment policy. According to state policy, districts or schools could exercise discretion and conduct more than the policy-assigned number of observations, though no teacher should receive less (Tennessee State Board of Education, 2013). Survey data collected by the Tennessee Department of Education suggests that each observation lasts about 30 minutes 6 (Periscopic, 2019).

Tennessee Board of Education observation assignment policy.
Classroom Observations and the Improvement of Teacher Performance
The TEAM theory of action asserts that observations will improve teacher performance as measured by the TEAM rubric (Alexander, 2016; TDOE, 2016), which describes a range of standards-based teacher behaviors, from unsatisfactory (1) to exemplary behavior (5) (Daley & Kim, 2010). After an observation, the observer is expected to hold a postobservation conference and supply feedback aligned to the TEAM rubric. TDOE expects observers to work with teachers to develop improvement plans (e.g., coaching, self-study) as needed.
Data
This study uses teacher panel data linked to more than 80% of Tennessee school districts from 2012–2013 through 2014–2015. The data includes teacher gender, level of education, race, years of experience, observation scores, and prior-year measures of discrete LOE and LOE-Cont. Observation records are at the observation-occurrence level and include observation dates and scores.
Some robustness analyses use data from the Tennessee Educator Survey (TES). Each spring, all Tennessee teachers receive the TES. Response rates exceeded 50% during the study period.
Method
This study explores if assignment to a lower discrete LOE and the assignment of more observations introduces assimilation bias in teacher observation scores. There are several opportunities for exploring these two potential sources of bias.
Three opportunities assign teachers more observations and to a lower discrete LOE (see Figure 1). The first compares Professional teachers just below the prior-year LOE-cont 200 threshold to Professionals just above, which also compares teachers assigned four observations to teachers assigned two (see Figure 1). The second and third opportunities compare teachers just above and below the 425 threshold and contrasts Apprentices assigned four observations to those assigned one (second opportunity) and Professionals assigned two observations instead of one (third opportunity). These three cases alone cannot definitively disentangle the influence of assigning teachers observations from assigning teachers to a lower LOE. However, there is a discontinuity in assigned observations that is not entangled with a change in discrete LOE.
Professional teachers with a prior-year discrete LOE2, LOE3, or LOE4 are assigned two observations, while Apprentices sharing the same prior-year discrete LOE are assigned four (see Figure 1). Comparing all Professional teachers to all Apprentice teachers in this range of prior-year LOE effectively contrasts mid- and late-career teachers to early-career teachers. Previous research finds that more experienced teachers tend to perform higher than less experienced teachers, plausibly confounding returns to teacher experience with the assignment of fewer observations (Harris & Sass, 2011; Ladd & Sorensen, 2017; Papay & Kraft, 2013). I mitigate some of these potential confounding influences by only comparing Professional teachers with four years of experience to Apprentice teachers with 3 years.
The final three opportunities for comparison contrast teachers just below a prior-year LOE-Cont threshold to those just above, at thresholds where there are no discontinuities in assigned observations. Apprentices falling just to either side of the LOE-Cont 200 are assigned to different discrete LOE, but both groups are assigned four observations (see Figure 1). Similarly, Apprentices falling just to either side of the LOE-Cont 275 or 350 thresholds are assigned the same number of observations; the same is true for Professionals surrounding these two thresholds (see Figure 1).
Outcome Variable
A naïve analytical strategy might treat the average observation score of teacher i in year t (
Regressions
Regression Discontinuity Designs
Crossing from just above to just below the prior-year LOE-Cont thresholds of 200, 275, 350, and 425 always assigns teachers to a lower discrete LOE (recall, educators never received LOE-Cont), and sometimes assigns more observations. This type of assignment process is well-suited for a regression discontinuity research design (RDD), represented by the following model:

where
The relationship of interest (
Local Regressions
I apply Equation 2 to explore the discontinuity in assigned observations across the Apprentice-Professional boundary within discrete LOE2 – LOE4.

where all variables represent the same quantities as in Equation 1,
Validating Regression Discontinuity Designs
Manipulation of the Running Variable
An RDD is invalid if there is evidence of nonrandom assignment to either side of a threshold. Nonrandom assignment occurs when the forcing variable (i.e., prior-year LOE-Cont) is purposefully manipulated. The only individuals who can manipulate LOE-Cont scores are observers. One may be concerned that observers nonrandomly place teachers to either side of an LOE-Cont threshold for reasons related to teacher performance. For example, an observer may try to place a teacher above the 425 threshold because she believes the teacher is on a path toward improvement and does not need more policy-assigned observations.
However, the manipulation of LOE-Cont is practically infeasible. Observers do not receive the student outcomes that determine LOE-Cont until after the completion of all observations. Thus, observers would need to accurately predict the determinants of LOE-Cont to manipulate LOE-Cont via observation scores. Observers could turn to historic student outcomes to predict contemporaneous scores. However, the correlations between prior-year and contemporaneous student-based outcomes 10 are below 0.50. Despite the implausibility of manipulation, I devise and apply a statistical test for manipulation under the assumption of observer prescience (Supplementary Appendix C discusses further the motivation for this test). If there is no evidence of manipulation under this assumption, there is little reason to believe observers manipulated LOE-Cont under realistic conditions.
The manipulation test assumes observers are prescient, removes achievement and growth scores from LOE-Cont creating what I characterize as prescient LOE-Cont, then tests for manipulation using prescient LOE-Cont (see Supplementary Appendix C for details). A prescient LOE-Cont score of zero means that the observer generates the exact observation score placing the teacher at a threshold. I characterize this version of LOE-Cont as prescient because for an observer to do this they must have known the teacher’s achievement and growth scores, which is implausible.
The robust-bias correction approach tests for manipulation at prescient LOE-cont values of zero (Cattaneo et al., 2016). The robust-bias corrected approach does not reject the null hypothesis of no manipulation at the 5% level at the 200, 275, 350, or 425 thresholds. Findings are insensitive to the use of triangular or Epanechnikov kernel functions. Figure 2 presents two graphs, one for the probability density function of prescient LOE-Cont centered at 200 and another for the function centered at 425. The left graph shows that the probability density functions (i.e., solid black lines) that approached the 200 threshold from the left and right are statistically indistinguishable (i.e., gray 95% confidence intervals overlap). Similar results are found at the 425 threshold. Graphs of prescient LOE-Cont centered at 275 and 350 are in Supplementary Appendix C. Because there is no evidence of manipulation under conditions of observer prescience, I conclude that manipulation under realistic conditions is implausible.

Tests for manipulation of prescient LOE-Cont.
Balance Tests of Covariates Measured at Baseline
Another test validating the assumption of local randomization examines if preexisting characteristics balance at each threshold. If the process of local randomization holds, there should not be any significant differences between the groups of teachers just to either side of any threshold. Balance tests of all baseline covariates in the vector
There is no evidence of systematic discontinuities in baseline covariates at any of the LOE-Cont thresholds. The left and right panels of Table 1 display results from covariate balance tests at the 200 and 425 thresholds, respectively. Results from tests at the 275 and 350 thresholds are in supplementary Appendix C. At the 200 threshold, in a bandwidth of 30, the probability that an Apprentice teacher below the threshold is non-White is significantly higher (p < .05) than the probability an Apprentice teacher above the threshold is non-White. There is no evidence of any imbalance among Professional teachers surrounding the 200 threshold or among Apprentice or Professional teachers surrounding the 425 threshold. Nor is there evidence of any imbalance among Apprentice teachers surrounding the 275 or 350 thresholds (see Supplementary Appendix C). Balance tests found that 275-Professional teachers in a bandwidth of 40 below the threshold are significantly more likely (p < .05) to hold more than a bachelor’s degree and significantly less likely (p < .05) to be female (see Supplementary Appendix C). A total of three imbalances are detected across 96 tests (i.e., four thresholds times three bandwidths times four covariates times two levels of certification), less than expected by chance at a Type I error rate of 5%.
Tests for Evidence of Local Randomization: Balance of Covariates Measured at Baseline

Note. Estimates represent the total predicted change in the outcome. Standard errors in parentheses, clustered at the teacher level. Ordinary least squares estimator employed to estimate all coefficients. BA+ is a binary variable indicating if a teacher reported earning a degree higher than a BA/BS. Nonwhite is an indicator signaling whether the teacher reported her ethnicity/ race as non-White or White.
p < .05.
Results
Results from the prior-year LOE-Cont 200 and 425 thresholds are discussed first. Results from the 425 threshold and 200-Professional results capture effects from assigning more observations and a lower prior-year discrete LOE (Table 2). Apprentice teachers just to either side of the 200 threshold are not assigned different numbers of observations, but results for this group of teachers are discussed in the first section because 200-Apprentice and 200-Professional results are estimated by the same equation. Supplementary Appendix C contains descriptions of each sample at each threshold in a bandwidth of 40.
Effects of Assigning Teachers More Observations and to a Lower Prior-Year Discrete LOE on First Observation Scores

Note. Italicized estimates are not associated with a change in the number of observations assigned by state policy. Apprentice teachers just below and just above the 200 threshold are both assigned four observations. Standard errors clustered at teacher level. Each model controls for teacher demographics, prior-year LOE-Cont, month of first observation, domains scored on first observation, and year fixed effects. LOE = level of effectiveness; TEAM = Tennessee Educator Acceleration Model.
p < .05. **p < .01. ***p < .001.
Assignment to a Lower Level of Effectiveness or More Observations
Figure 3 graphs first scores against a polynomial of prior-year LOE-Cont centered at 200 by certification status. The graphed lines represent regressions of first scores on prior-year LOE-Cont. The right panel of Figure 3 shows that Professional teachers just below the 200 threshold receive a lower first score than Professionals just above. However, Apprentice teachers just below the 200 threshold receive a higher first score than Apprentices above the threshold. Figure 4 is another binned scatterplot and regression of first scores against the forcing variable, with prior-year LOE-Cont centered at 425. Teachers below the 425 threshold receive lower first scores than teachers above the threshold.

Binned scatterplot and regression: first observation score vs. prior-year LOE-Cont at 200 threshold.

Binned scatterplots and regressions: first observation score vs. prior-year LOE-Cont at 425 threshold by certification status.
Table 3 presents results generated by Equation 1 using data from the 200 or 425 thresholds. RDD estimates from the 200 threshold (left panel, Panel A) show that crossing from above to below the threshold raises Apprentice first scores by about 0.10 units (0.20 SD), but lowers the first scores of Professionals by about 0.11 units (0.22 SD). However, none of the estimates at the 200 threshold are significant at conventional levels. The left panel of Panel A in Table 3 shows that crossing from above to below the 425 threshold reduces the first scores of both Apprentice and Professionals. The effects on Professional teachers range from −0.01 to −0.04 (−0.02 to −0.08 SD) but are significant in one bandwidth only; effects on Apprentices range from −.08 to −.10 (−0.16 to −0.20 SD) and are significant in each bandwidth. Given the imprecision of estimates at the 200 threshold, remaining discussions in this section focus on estimates from the 425 threshold.
Moderation Analysis: RDD Effects of Assigning Apprentice Teachers More Observations and to a Lower Prior-Year Discrete LOE on First Observation Scores

Note. Standard errors clustered at teacher level. The reference category is Apprentice teachers with one year of experience. Each model controls for teacher demographics, LOE-Cont, discrete LOE, month of first observation, domains scored on first observation, and year fixed effects. RDD = regression discontinuity research design; LOE = level of effectiveness.
p < .05. **p < .01. ***p < .001.
Sensitivity Tests
Sensitivity tests control for (a) specification of the running variable, (b) unobserved between-school differences, and (c) clustering of standard errors at the school level. Additional sensitivity tests examine the extent to which (d) teacher job satisfaction and (e) improvement efforts account for the results, and (f) explore if crossing the threshold induces teacher re-assignment to a different subject, which might explain the negative effects at the 425 threshold (see Supplementary Appendix D). No evidence suggests that any of these alternative explanations account for the original findings.
Moderation by Years of Experience
If the original effects at the 425 threshold are caused by assimilation bias, previously discussed research suggests that those effects may be moderated by teacher years of experience. Indeed, Apprentice teacher point estimates are always larger than Professional teacher coefficients (see Table 3). However, previously discussed research also implies that the negative effects among early-career Apprentice teachers will be most negative for teachers with the fewest years of experience. I test this implication by applying years of experience as a moderator. Specifically, a categorical experience variable is created and interacted with the variable indicating whether an Apprentice is just above or below the 425 threshold. Interaction terms represent the difference between the effects for second-year teachers and teachers with (a) 3 years or (b) 4 years of experience. Each moderated estimate compares Apprentice teachers with the same years of experience, but who were just to either side of the 425 threshold.
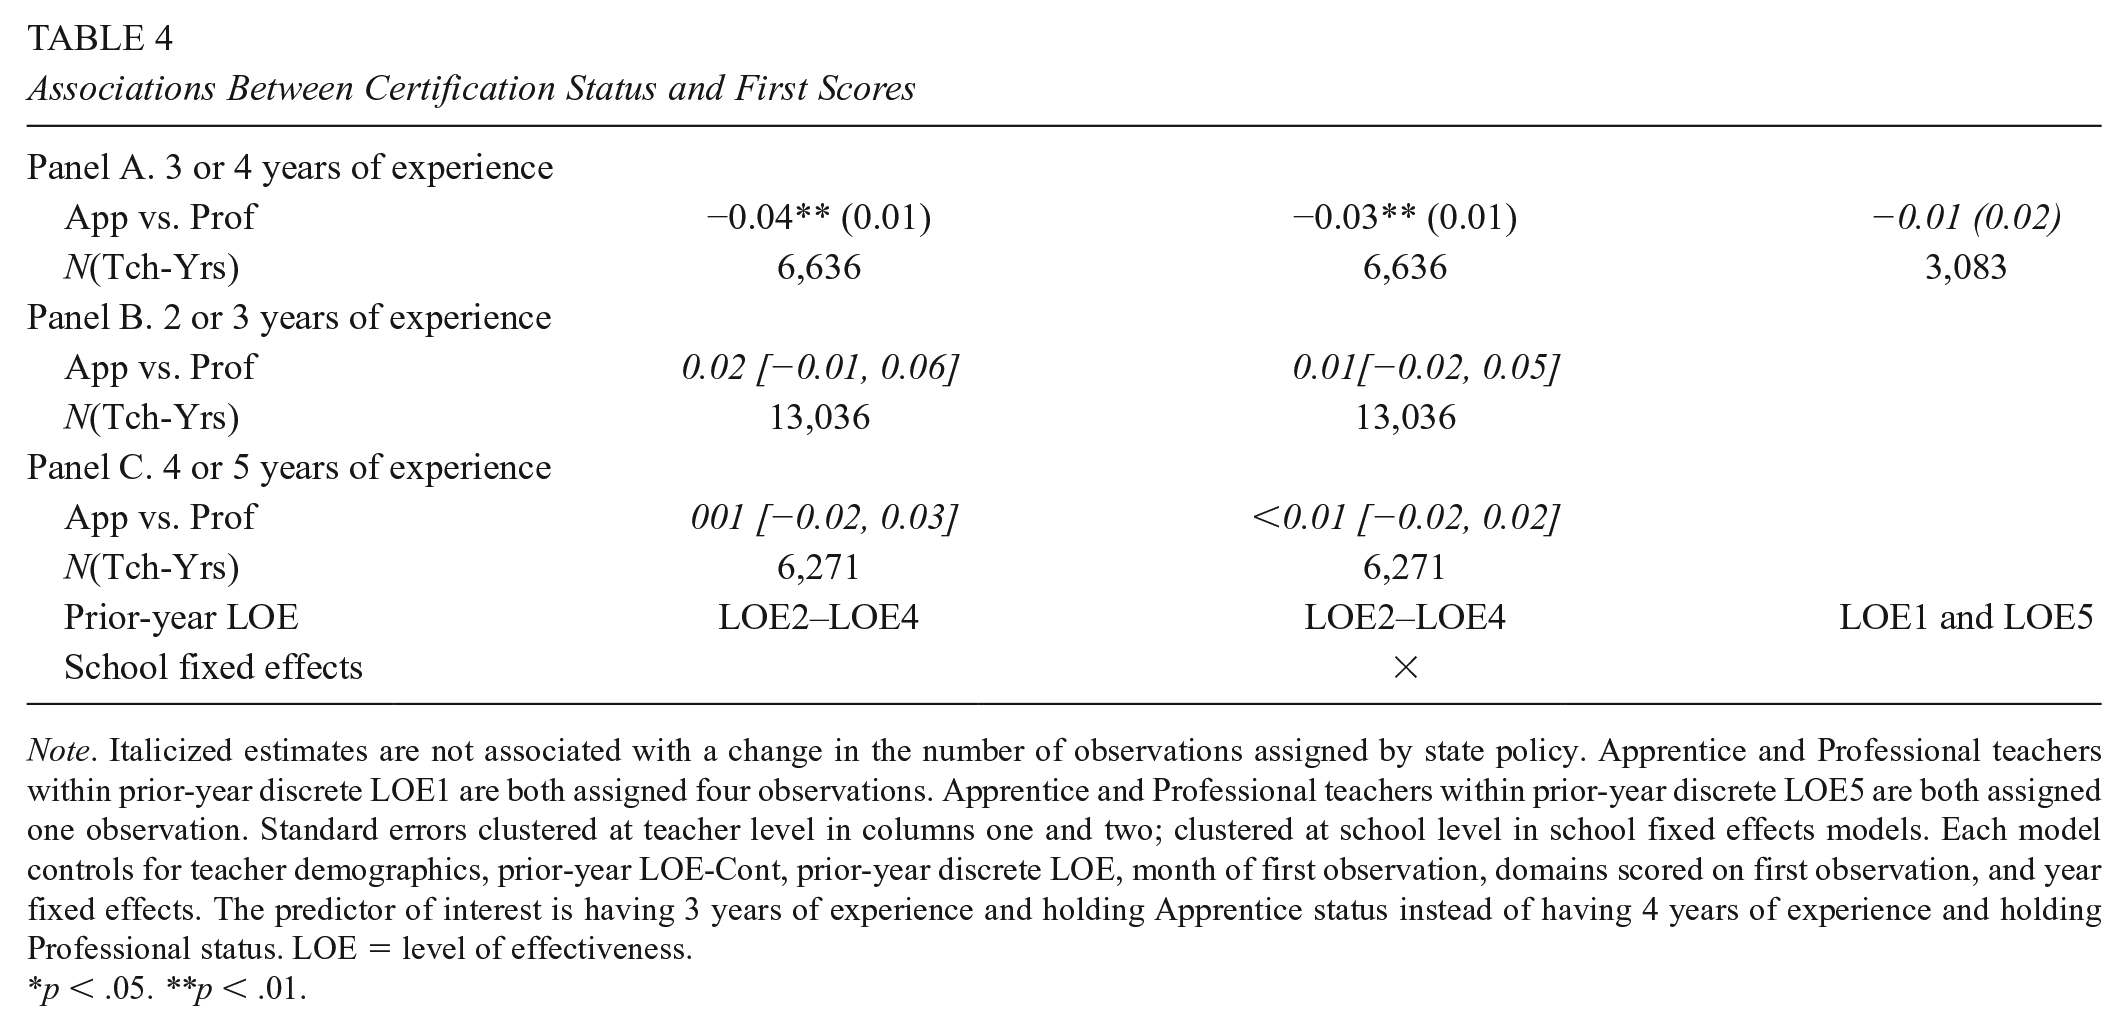
Results corroborate the argument that assimilation bias drove the negative effects on first scores at the 425 threshold. Second-year Apprentices just below the threshold have first scores that are about 0.14 units (0.28 SD) lower than second-year Apprentices just above the threshold (see Table 4). The interactions in Table 4 show that the negative effects on Apprentice first scores attenuate as early-career teachers gain experience.
Associations Between Certification Status and First Scores
Note. Italicized estimates are not associated with a change in the number of observations assigned by state policy. Apprentice and Professional teachers within prior-year discrete LOE1 are both assigned four observations. Apprentice and Professional teachers within prior-year discrete LOE5 are both assigned one observation. Standard errors clustered at teacher level in columns one and two; clustered at school level in school fixed effects models. Each model controls for teacher demographics, prior-year LOE-Cont, prior-year discrete LOE, month of first observation, domains scored on first observation, and year fixed effects. The predictor of interest is having 3 years of experience and holding Apprentice status instead of having 4 years of experience and holding Professional status. LOE = level of effectiveness.
p < .05. **p < .01.
Assigned More Observations, not to a Lower Level of Effectiveness
Apprentice teachers within LOE2, LOE3, and LOE4 are assigned four observations while Professional teachers are assigned two (see Figure 1). Equation 2 compares Apprentice teachers with three full years of experience to Professional teachers with 4 full years, only comparing teacher groups holding the same prior-year discrete LOE. The first score of teachers assigned four observations is 0.04 (0.08 SD) lower than teachers assigned two (Panel A, Table 4). The association remains relatively unchanged after controlling for school fixed effects (see Table 4).
Falsification Tests
Within LOE1 and LOE5, Apprentice and Professional teachers are assigned the same number of observations. Similarly, within LOE2–LOE4, there is no discontinuity in assigned observations between teachers with 2 or 3 years of experience, or between teachers with 4 or 5 years. If the difference in first scores between Apprentice and Professional teachers within LOE2 to LOE4 is driven by years of experience and not the difference in assigned observations, then (a) Apprentice LOE1 and LOE5s will have lower first scores than Professionals within these two discrete LOE, (b) LOE2 to LOE4 teachers with 2 instead of 3 years’ experience will have lower first scores, and (c) LOE2 to LOE4 teachers with 4 instead of 5 years of experience will have lower first scores. Panels A, B, and C in Table 4 show that the associations of (a), (b), and (c) are near-zero nulls. However, no result from any falsification test in Table 4 is statistically different from the original associations of −.04 or −.03 in Panel A.
Assignment to a Lower Level of Effectiveness, Not to More Observations
Teachers just to either side of the 275 and 350 thresholds are assigned to different discrete LOE, but not to different numbers of observations (see Figure 1), providing an opportunity to estimate the effects of assigning a lower discrete LOE but not more observations.
There is no evidence of assimilation bias at the 275 or 350 thresholds (Table 5). Crossing from above to below the 275 threshold raises Apprentice (left panel Table 5) first scores by about 0.04 units (0.08 SD), but leaves the first scores of Professional teachers relatively unchanged. However, no estimates at the 275 threshold are significant at conventional levels. The right panel of Table 5 shows that crossing from above to below the 375 threshold has near-zero effects on both Apprentice and Professional teachers. These models are reestimated using school fixed effects and produce qualitatively similar results (see Supplementary Appendix D).
RDD Effects of Crossing Prior-Year LOE-Cont Thresholds on First Observation Scores by Certification Status
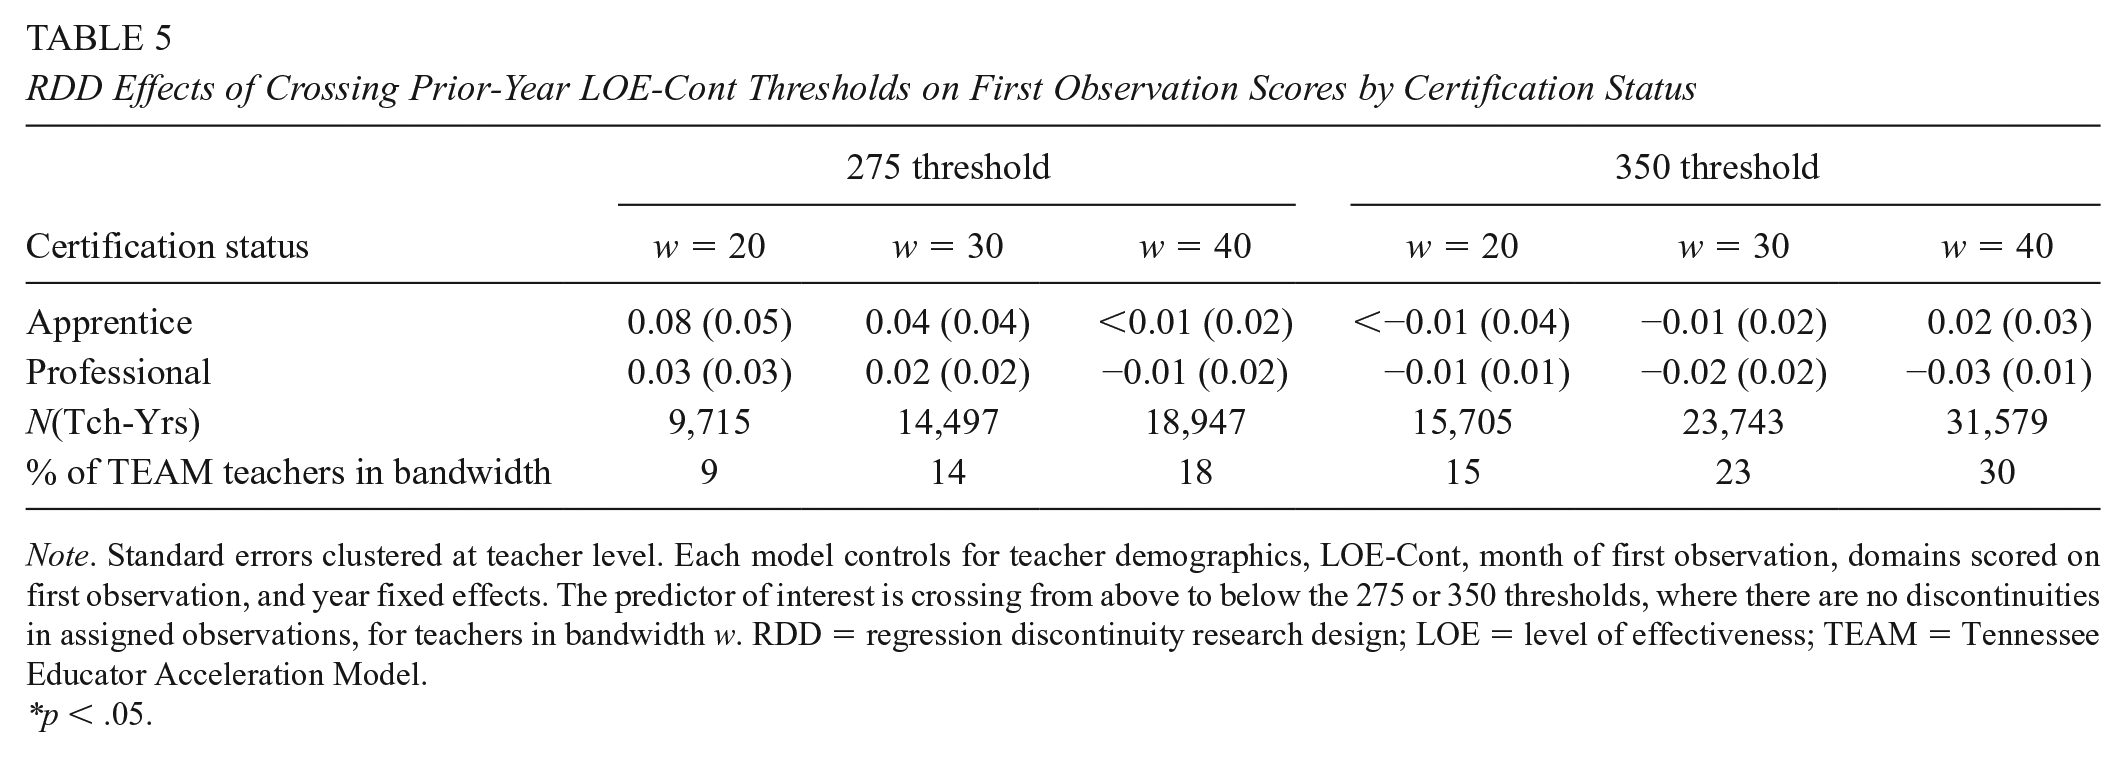
Note. Standard errors clustered at teacher level. Each model controls for teacher demographics, LOE-Cont, month of first observation, domains scored on first observation, and year fixed effects. The predictor of interest is crossing from above to below the 275 or 350 thresholds, where there are no discontinuities in assigned observations, for teachers in bandwidth w. RDD = regression discontinuity research design; LOE = level of effectiveness; TEAM = Tennessee Educator Acceleration Model.
*p < .05.
Conclusions
This study draws on the theory of assimilation bias and hypothesizes that assigning teachers to a lower effectiveness score or assigning teachers to receive more observations negatively affects observation scores via assimilation bias. Either is a potential source of assimilation bias because either could hypothetically affect observer expectations of teacher performance, independent of subsequent observations. These hypotheses were examined by exploiting discontinuities in Tennessee policy assigning teachers to different levels of effectiveness scores and assigning teachers to receive different numbers of observations. There are cases when state policy assigns teachers to a lower effectiveness score and to more observations; cases where teachers are assigned more observations but not to a lower effectiveness score; and cases assigning teaches to a lower effectiveness score but not to more observations.
There is evidence of assimilation bias, but only in cases where teachers are assigned more observations. RDDs find that teachers assigned more observations are predicted to receive lower first observation scores, though some predictions are estimated imprecisely. As suggested by previous research, the strongest negative effects (−0.30 SD) apply to beginning teachers (i.e., early-career 425-Apprentices). To place the degree of bias in context, observation scores are predicted to decline by approximately 0.10 SD if the proportion of teachers’ students who are black increases by 25% (Campbell & Ronfeldt, 2018). In terms of the characteristics of Tennessee teachers, 0.30 SD is more than half the difference in raw average observation scores between first- and second-year teachers. The magnitude of assimilation bias suggests that the study findings are not just of theoretical importance. The degree of assimilation bias is substantially larger than other sources of bias found in previous studies. Ancillary analyses explore alternative explanations for the strong negative effects at the 425 threshold, but no evidence supports any alternative explanation.
Although evidence from cases assigning teachers to more observations and lower effective scores suggested negative assimilation bias, findings from these cases cannot disentangle the source of bias. However, results from other cases suggest that the source may be teacher assignment to more observations. Local ordinary least squares and school fixed effects regressions compared Apprentices who are assigned four observations to Professionals assigned two, but who share the same prior-year effectiveness scores. These associations suggest that assigning teachers more observations introduces assimilation bias. Tests attempting to falsify this conclusion are unable to do so, again implying that the assignment of observations drives assimilation bias. Evidence generated by comparisons of teachers assigned to different effective scores but not to different number of observations further corroborate this conclusion.
Limitations
There are three potential limitations to this study. First, the findings may not generalize to other observation systems. Previous work suggests that observations can be classified according to several qualities, including scoring procedures and observer training (Bell et al., 2019). The effects of assimilation bias may vary by any of these qualities. In the study context, observers received a total of two to four days of summer training (Alexander, 2016). Observers in other systems may receive ongoing support from support providers, which previous research suggests may reduce some forms of bias (Congdon & McQueen, 2000). Future work should examine the extent to which assimilation bias might vary by the characteristics of observer training and supports.
Relatedly, more research should examine bias in field settings. We know a great deal about the sources of bias in experimental observation scores generated by trained researcher-observers from the MET project (e.g., Campbell & Ronfeldt, 2018; Steinberg & Garrett, 2016). However, it is unclear if practitioner-generated scores are susceptible to similar sources of bias. Presumably, MET researchers and subjects did not have a history of potentially bias-attenuating interactions.
This study is also limited in that it cannot identify why assimilation bias seems to be driven by the assignment of observations and not teacher effectiveness scores. At face value, one may think that observers would be more sensitive to the latter. However, the Tennessee teacher effectiveness scores are partially based on value-added scores, a measure that principals tend to view with great skepticism (Collins, 2014; Goldring et al., 2015; Hallinger et al., 2014; J. Murphy et al., 2013). Because many Tennessee teacher effectiveness scores, including the effectiveness scores of most “untested” teachers, are a function of value-added scores, observers may be skeptical of the information captured by these measures, which may explain why effectiveness scores do not affect assimilation bias. Future research might explore how observers make sense of information produced by next-generation teacher evaluation systems and how that information might introduce bias into observation scores. Interviews, surveys, and other qualitative methods may be well-suited for such investigations. Qualitative research may also be able to explore the extent to which observers consciously or unconsciously engage in assimilation bias.
Third, schools with multiple observers may endogenously sort observers to teachers. Although several sensitivity tests suggest that such within-school sorting does not explain the main results, the evidence from these tests is relatively weak. Future work should explore patterns of observer sorting; observer fixed effects are well-suited for such explorations.
Implications
Many teachers work in states that attach high-stakes consequences to teacher evaluation, and scores produced by these systems tend to be most influenced by observation scores (American Institutes for Research, 2016; Cohen & Goldhaber, 2016; National Council on Teacher Quality, 2019b). Additionally, several states assign observations based on prior-year teacher performance or productivity (American Institutes for Research, 2016; National Council on Teacher Quality, 2019a). In conjunction with the magnitude of assimilation bias, these conditions suggest policymakers or practitioners might consider how to reduce the effects and causes of assimilation bias.
Education agencies may be able to mitigate the effects of bias in observation scores via regression adjustment. Indeed, the authors of some studies examining observer bias call for such adjustments (e.g., Campbell & Ronfeldt, 2018). Regression adjustment controls for sources of bias, comparing teachers encountering similar context-independent and context-dependent sources of bias. For example, observation scores could be adjusted by controlling for the number of observations assigned by state policy and prior-year effectiveness scores. If policy makers move toward this approach, it underscores the need for additional research examining other sources of bias in observation scores generated in field settings, and research examining quantitative methods capable of removing bias in observation scores.
If post-observation feedback is influenced by assimilation bias, the effectiveness of observations as a tool for teacher development may be inhibited. Suppose an observer directs a teacher assigned more observations by state policy to engage in more professional development, not because the teacher’s observed teaching was of low quality, but because of assimilation bias. Such misdirection would misallocate professional development resources and teacher time, implying that policy makers and education agencies might consider addressing the root causes of assimilation bias.
One way to reduce assimilation bias arising from the assignment of observations by state policy is to assign teachers the same number of observations. In this study, the strongest evidence of assimilation bias existed among early-career teachers assigned four observations instead of one. Tennessee policymakers could assign all early-career teachers four observations, removing the seeming driver of assimilation bias. However, assigning all early-career teachers four observations instead of one would increase the administrative burdens of teacher evaluation, which school administrators report is already time intensive (Kraft & Gilmour, 2016; Rigby, 2015). Ideally, the decision to increase observations should at least weigh the costs of assimilation bias against the costs, broadly defined, of increasing evaluation-related administrative burdens. However, little, if any, research quantifies the administrative burdens of teacher evaluation in terms of administrator or teacher outcomes. In the absence of such research, it is unclear whether increasing the number of observations assigned to early-career teachers represents a net benefit or cost.
Additional observer professional development may represent a second way to mitigate the cause of assimilation bias. However, if the effectiveness of annual observer training resembles the effectiveness of typical annual teacher trainings, educators should not expect assimilation bias to mitigate substantially; research finds that effective professional development occurs frequently and is tailored to school- or district-specific needs (Desimone et al., 2002; Garet et al., 2001; Penuel et al., 2007). Once-per-year annual observer workshops would almost certainly not be frequent or specific enough to address contextual needs and substantially mitigate assimilation bias. Additionally, increasing observer professional development would increase the cost of teacher observation systems. Policymakers will need to decide if the costs associated with ongoing observer professional development outweigh the costs of assimilation bias identified in this study.
Supplemental Material
Online_Appendices – Supplemental material for The Unintended Effects of Policy-Assigned Teacher Observations: Examining the Validity of Observation Scores
Supplemental material, Online_Appendices for The Unintended Effects of Policy-Assigned Teacher Observations: Examining the Validity of Observation Scores by Seth B. Hunter in AERA Open
Footnotes
Acknowledgements
Seth would like to thank Dale Ballou, the Tennessee Department of Education, and the Tennessee Education Research Alliance for valuable feedback.
Notes
Author
SETH B. HUNTER is an assistant professor of education leadership at George Mason University. His research interests include the effects of teacher leadership and teacher leader labor markets, and the policies and practices of educator evaluation.
References
Supplementary Material
Please find the following supplemental material available below.
For Open Access articles published under a Creative Commons License, all supplemental material carries the same license as the article it is associated with.
For non-Open Access articles published, all supplemental material carries a non-exclusive license, and permission requests for re-use of supplemental material or any part of supplemental material shall be sent directly to the copyright owner as specified in the copyright notice associated with the article.