
Abstract
Recent evaluations of reforms to improve low-performing schools have almost exclusively focused on shorter term effects. In this study, we extend the literature by examining the sustainability and maturation of two turnaround models in Tennessee: the state-led Achievement School District (ASD) and district-led local Innovation Zones (iZones). Using difference-in-differences models, we find overall positive effects on student achievement in iZone schools and null effects in ASD schools. Additional findings suggest a linkage between staff turnover and the effectiveness of reforms. ASD schools experienced high staff turnover in every cohort, and iZone schools faced high turnover in its latest cohort, the only one with negative effects. We discuss how differences in the ASD and iZone interventions may help explain variation in the schools’ ability to recruit and retain effective teachers and principals.
Keywords
Federal policymakers have invested substantial resources into turning around persistently low-performing schools, with the expectation that interventions would swiftly improve student achievement within 3 years (Herman et al., 2008). However, research evaluating school turnaround reports mixed results (Dee, 2012; Dragoset et al., 2017; Zimmer et al., 2017). Since most of the existing research evaluates turnaround in the first few years of reform, results may be mixed because some reforms have immediate effects while others need longer to take hold. Longer term reforms align with the literature on earlier comprehensive school reform models, which find that school improvement efforts need more than 3 years to produce positive results (Aladjem et al., 2010; Berends et al., 2002; Bloom et al., 2001; Borman et al., 2003; Gross et al., 2009; Stuit, 2010). 1 Moreover, even if reforms do produce positive results early on, little is known about the sustainability of turnaround reforms. This article fills these gaps in the literature by examining both schools that have implemented turnaround reforms for multiple years and later cohorts that begin reforms after the turnaround models have matured.
Evidence from more mature turnaround initiatives is especially important under the current Every Student Succeeds Act (ESSA). Under ESSA, more states are designing reforms that will operate for longer. For example, North Carolina’s ESSA plan gives its lowest-performing schools up to 12 years of school improvement supports (North Carolina Department of Public Instruction, 2018). In this article, we inform the sustainability of longer term ESSA reform models using updated data from 6 years of reform in Tennessee. These data allow us to contribute new evidence from one of the few turnaround initiatives across the country that have been in continuous operation for longer than 3 years (exceptions include Chin et al., 2019; Harris & Larsen, 2016, 2019). 2
We build on a 3-year evaluation by Zimmer et al. (2017) of Tennessee’s Achievement School District (ASD) and local Innovation Zones (iZones), both of which have operated multiple cohorts of schools. We further describe both models below, but note that the ASD relies on dramatic changes in school governance where chronically low-performing schools are removed from local districts and restarted, mainly by charter management organizations. In contrast, local iZones place low-performing schools into intradistrict networks that are managed by dedicated district staff. Although the ASD and iZones have different governance structures, both models replaced teachers and principals in the first year of turnaround, and after 3 years, Zimmer et al. (2017) found that iZone schools produced significant positive student achievement effects while ASD schools produced null effects.
With novel data from a longer panel, we examine whether iZone schools have sustained positive effects and whether the ASD has produced positive results given more time. We estimate the ASD and iZone effects using difference-in-differences (DID) models that compare ASD and iZone schools with similarly low-performing schools receiving no turnaround interventions. We refer to these low-performing, nonturnaround schools as comparison schools and describe them further below. Averaging across all years and cohorts, we find that iZone reforms raised test score gains by approximately 0.10 standard deviations (SD), which is similar in magnitude to the positive effects reported by Zimmer et al. (2017) and from reforms in Massachusetts (Papay & Hannon, 2018) and San Francisco (Sun et al., 2017). In contrast, ASD schools did not produce significant effects in any cohort, year, or subject.
In addition to student achievement, our study expands on Zimmer et al. (2017) by examining how ASD and iZone reforms affect student attendance and mobility, along with the turnover rate, effectiveness, and average experience of teachers and principals. Neither ASD nor iZone reforms significantly affected student attendance or mobility; however, both models increased teacher and principal turnover in Year 1, when staff replacement was intentional. After Year 1, ASD schools continued experiencing high teacher and principal turnover, with lower performing and less-experienced replacements. Because of high-staff turnover, ASD schools may have had trouble maintaining a consistent improvement strategy, which helps explain the null ASD results. In contrast, after Year 1, staff turnover in iZone schools returned to levels similar to those in comparison schools. Moreover, the earlier and most successful iZone cohorts recruited effective teachers and principals, while the most recent and least successful cohort was the only one to recruit less-effective teachers and less-experienced principals. Overall, we find a consistent relationship between the successful recruitment and retention of effective educators and positive effects on student achievement. In addition to reporting results, we discuss below potential reasons why ASD and iZone schools experienced differences in staff turnover.
Like Zimmer et al. (2017), most existing studies of turnaround concentrate on the earlier years reform when interventions focus on addressing barriers to improvement. In this study, we instead examine later stages when reforms are focused on increasing capacity and sustaining improvements. In doing so, we address three questions:
To what extent have iZone schools been able to sustain positive effects?
Over a longer, 6-year period, do ASD schools produce positive effects on student achievement?
To what extent does either intervention affect student attendance and mobility along with the turnover rate, effectiveness, and experience of teachers and principals in turnaround schools?
School Turnaround in Tennessee
Tennessee’s current turnaround approach originated from the state’s 2010 First to the Top (FttT) legislation. The legislation required Tennessee’s Department of Education (TDOE) to intervene in the state’s lowest-performing 5% of schools, called priority schools. Using FttT, Tennessee applied for and won approximately US$500 million of Race to the Top (RttT) funding to implement its proposed initiatives. Beginning in 2012–2013, priority schools were either placed into the ASD, joined an iZone, closed, or received no interventions.
Tennessee’s boldest turnaround model is the ASD, a statewide school district staffed by full-time TDOE personnel and led by a superintendent who reports directly to Tennessee’s Commissioner of Education. When chosen for the ASD, schools are removed from their local education agency (LEA) to be governed by TDOE, restarted under new management, and required to replace the principal and at least 50% of teachers. ASD schools were restarted under a charter management organization (CMO), except five that were directly managed by the ASD. 3 The ASD relied on CMOs, because TDOE leaders believed freedom from bureaucratic oversight would give schools flexibility to focus on reforms, and previous research finds that some Tennessee charter schools out-performed the state average (Center for Research on Education Outcomes, 2019). Notably, ASD schools are not schools of choice but continue to enroll students from their local catchment area.
As ASD operations were beginning in 2012, TDOE also approved the creation of local iZones in Shelby County Schools (Memphis) and Metro-Nashville Public Schools. Local iZones differ from the ASD primarily in that iZone schools remain part of their LEA and are placed into an intradistrict network with other low-performing schools in the district. Local iZones are supported by full-time district employees and led by a director who reports to the superintendent. 4 Like the ASD, iZone schools must also replace the principal. Unlike the ASD, iZone schools are not required to replace teachers, though almost all iZone schools did replace at least 50% of teachers on joining an iZone. Then, after initial staff replacements, the iZones had broad autonomy to manage their daily operations. Since 2012, two additional districts have opened iZones: Hamilton County Schools and Knox County Schools. In this article, we pool all four iZones together, but our conclusions do not change when we examine only the Memphis iZone, where the vast majority of priority schools are located. 5
During its first 3 years, the ASD was funded by part of Tennessee’s RttT grant and with philanthropic support. When RttT funds were depleted, TDOE continued funding the ASD from its budget. When iZones were created, districts received School Improvement Grant (SIG) funding from TDOE to support all iZone schools. When SIG funding ended, districts used a combination of philanthropic support, state funds, and portions of their own budget to continue funding current schools and any new schools joining their iZones. Notably, iZone schools used their funding for performance pay incentives to recruit and retain effective teachers. Both the ASD and iZones have continued receiving funding and support, differentiating this article from studies that examine turnaround effects after the active reforms have ended. Furthermore, ongoing funding as part of the TDOE and district budgets show that these models have moved toward building capacity and sustaining the reforms.
Some priority schools not placed into either the ASD or an iZone were closed, and our communications with district leaders indicate that priority schools were only closed if they had very low enrollment. Closed schools remain part of our sample in the years they are open. 6 Besides the priority designation itself, priority schools not taken over by the ASD, placed into an iZone, or closed did not receive any other funding or interventions from the state or their LEAs.
ASD schools were chosen from the priority list based on school feeder patterns and whether a CMO could be matched with the school (Tennessee Department of Education, 2012). The matching process allowed CMOs to present their proposed reform plan to a committee of ASD leaders and local stakeholders (i.e., parents and community leaders). Under its feeder pattern approach, the ASD began taking over elementary schools in its first cohort and would later target middle and high schools receiving students from these ASD elementary schools. The Memphis iZone similarly used feeder patterns to choose schools, whereas all priority schools not placed into the ASD or closed in Nashville, Hamilton County, and Knox County were assigned to their respective iZones. Although these practices loosely guided which schools would join the ASD and iZones, our communications with state and district leaders suggest that the process was not systematic and often rushed because of political pressure to quickly intervene in priority schools. These pressures suggest that schools were not systematically chosen for turnaround because of their performance levels or potential for future growth. To mitigate concerns that schools were systematically chosen, we examine baseline characteristics and test score trends of ASD and iZone schools relative to comparison schools and found them to be highly similar. 7
After Tennessee released an initial list of 83 priority schools in 2012, both the ASD and iZones began operating schools chosen from this list. 8 In Table 1, we show the number of schools in each ASD and iZone cohort. Across the 6 years of turnaround examined in this article (2012–2013 through 2017–2018), five cohorts joined the ASD or an iZone, with no additional schools joining either model in 2017–2018. Beginning in 2012–2013, the first cohort includes six ASD, 13 iZone, and one school that was closed, leaving 65 priority schools that received no interventions. The second cohort was chosen from these remaining 65 priority schools to begin reforms in 2013–2014. The second cohort includes six ASD, 11 iZone, and three schools that were closed, leaving 45 priority schools that had not received any reforms by 2013–2014. New schools continued joining the ASD and iZones in Cohorts 3, 4, and 5, resulting in a total 26 ASD, 42 iZone, and 26 priority schools that have not received any turnaround interventions by 2017–2018. We show below that student characteristics are very similar in each of the five ASD and iZone cohorts, suggesting that different results across cohorts are not driven by changes in the types of schools being taken over.
Number of Schools by Reform Approach and Cohort

Note. ASD = Achievement School District; iZones = Innovation Zones.
Two schools were placed into the Nashville iZone in 2012–2013 even though they were not on the 2012 priority list. These two schools are on the 2014 priority list. bThe number of priority schools increases in 2014–2015, because Tennessee released a new list of priority schools in 2014. cTwo schools in the fourth iZone cohort were closed in the following year. During this time period, the ASD opened new-start schools that did not exist previously and were not named a priority school by Tennessee on its 2012 or 2014 priority list. Also, in these years, the ASD began operating in untested grades in some priority schools. New start schools and schools where the ASD had not yet began operating tested grades were not included in this analysis.
Additional priority schools were identified in 2014 when Tennessee released a second priority list with 33 schools that were not on the 2012 list. 9 Our comparison sample includes all nonturnaround schools on either the 2012 or 2014 priority list, but results are similar when we use only schools on one of the two lists (Appendix Table A3). Priority school designation can itself be considered an intervention because being labeled a low-performing school could motivate schools to demonstrate improvement, but all schools in our sample are priority schools. Thus, our analysis compares priority schools receiving one of two turnaround interventions with priority schools receiving no interventions. Finally, note that during this time period, no schools exited either the ASD or iZones.
Review of the Whole-School Reform Literature
Whole-school reforms have received substantial policy interest and investment, especially through federal initiatives including Project Follow Through (Egbert, 1981), New American Schools (Berends et al., 2002), Comprehensive School Reform (Aladjem et al., 2010), School Improvement Grants (Dragoset et al., 2017), Race to the Top (Heissel & Ladd, 2018; Henry et al., 2015), and NCLB (No Child Left Behind) waivers under the Obama administration (Bonilla & Dee, 2017; Dee & Dizon-Ross, 2017; Dougherty & Weiner, 2019; Hemelt & Jacob, 2017). Though specific interventions varied, these reform initiatives share the idea that incremental interventions are insufficient and that low-performing schools do not have individual capacity to improve. Under ESSA, the approach to whole-school reform is transitioning to flexible, state-formulated plans, and this flexibility suggests that states will need guidance on how to shape their reform plans in light of prior whole-school reform initiatives. However, evaluations accompanying these reform initiatives report mixed results (e.g., Dragoset et al., 2017), so to better understand the literature, we turn to the underlying theory of action for turnaround.
Broadly called “turnaround,” the most recent national efforts to improve low-performing schools have been primarily shaped by four models prescribed under the federal SIG program: transformation, turnaround, restart, and closure (Perlman & Redding, 2011). Local iZones in Tennessee implemented reforms aligned with the transformation model: requiring schools to replace principals but not teachers. The ASD implemented the restart model by closing and reopening schools under new management. These reform initiatives share a theory of action with three stages: (1) disrupt barriers to improvement (Herman et al., 2008); (2) build an improvement infrastructure (Peurach & Neumerski, 2015); and (3) sustain the momentum (Copland, 2003; Kutash et al., 2010). This three-stage theory of action suggests that schools may need time to reestablish stable operations after initial, disruptive reforms and raises questions about sustainability.
Most existing research examines the first 3 years of turnaround (i.e., the disruption stage). These studies describe interventions that focus on building human capacity by recruiting effective teachers and leaders (Carlson & Lavertu, 2018; Kho et al., 2018), and some evaluations find larger positive results in schools that successfully recruit new teachers and principals relative to schools that do not bring in new staff (Anrig, 2015; Carlson & Lavertu, 2018; Dee, 2012; Strunk et al., 2016). These lessons are valuable, but the disruption stage is a tenuous time to evaluate reforms, because interventions can create rapid changes that may detract from potential positive effects.
In the second, infrastructure-building stage, researchers assert that successful reforms should focus on retaining effective staff because turnover could force principals to hire less-experienced or less-effective teachers (Calkins et al., 2007). Similarly, in-service development initiatives can be thwarted by turnover because teachers and leaders take newly gained skills with them when they leave (Henry & Harbatkin, 2018). Besides staff turnover, researchers also emphasize student attendance and mobility, because improving school operations means little when students are not in school (Dougherty & Weiner, 2019). These existing studies suggest that student attendance, student mobility, and staff retention help illuminate the reform process, but there is insufficient research documenting how ongoing reforms affect these student and staff characteristics.
Even fewer studies examine turnaround in the third stage, as reformers work to sustain the model. One model that has persisted is the portfolio district in New Orleans. Research in New Orleans suggests the model faced new challenges over time (Harris & Larsen, 2016, 2019; McEachin et al., 2016; Ruble, 2015), such as a shrinking pool of effective teachers and leaders available to transfer into turnaround schools. In New Orleans, efforts to sustain the model included recruiting charter operators and partnering with alternative certification programs like Teach for America and TeachNOLA (Harris & Larsen, 2016, 2019). However, even in New Orleans, there is little evidence on whether schools continue to successfully recruit and retain effective staff as the model expands over time. We help fill these gaps in the literature by examining the ASD and iZones as they mature into the capacity-building and sustaining stages.
Method
Data
Data are provided by TDOE and managed by the Tennessee Education Research Alliance. The administrative data sets capture characteristics of students, teachers, and principals for all Tennessee public schools. The student data sets contain a rich set of characteristics including gender, race, eligibility for free or reduced-price meals (FRPM), English language learner status (ELL), and special education status (SpED). Teacher and principal characteristics include gender, race, and degree attainment. Our analytic sample consists of students in tested subjects and grades, and we restrict the analysis to only priority schools. This leaves a sample of 315,663 student-year-subject observations with nonmissing covariates, with unique records for 63,419 students, 9,300 teachers, 311 principals, and 116 schools.
Measures
Our primary outcome of interest is student test scores. In Tennessee, students take end-of-grade exams in Grades 3 to 8 and end-of-course exams in high school subjects. Because of testing complications that occurred during the transition to new assessments in 2015–2016, EOG scores in Grades 3 to 8 were not reported for any Tennessee school; therefore, our analysis does not include any scores from 2015 to 2016. 10 To have a common metric across years, we standardize the scale scores by subject, grade, year, and for the EOCs, semester.
Based on our literature review, we also examine effects on student mobility and attendance, along with turnover, effectiveness, and experience of teachers and leaders. By linking students and educators with schools in each year, we create student mobility and staff turnover measures by generating indicators that equal one when the student or educator is observed in a school that is different from her school in the prior year. These new-to-school indicators are beginning-of-year turnover measures. We test whether our results are robust when using an alternative, end-of-year turnover indicator for whether the student or educator is no longer in her current school in the following year. Consistent with existing literature, we reach similar conclusions when using this alternative mobility measure (Ronfeldt et al., 2013).
For students, attendance is the proportion of school days attended, and the mobility indicator captures whether the student is new to her school due to a nonstructural move. 11 For teachers, we examine three outcomes: turnover, years of experience, and prior year value-added scores for incoming teachers. In Tennessee, teachers in tested grades and subjects receive a value-added score on the Tennessee value-added assessment system (TVAAS) ranging from one to five. We use the TVAAS score to measure teacher effectiveness in the year before they enter an ASD or iZone school.
For principals, we use parallel measures that include principal turnover, observation scores, and years of principal experience. The principal observation scores range from one to five and are annual supervisor ratings given to school leaders using a rubric based on the Tennessee Instructional Leadership Standards or TILS (Grissom et al., 2018). Scores on the TILS rubric are given by the district superintendent or her designee (usually the principal’s supervisor). 12 Grissom et al. (2018) find that principals’ observation scores are internally consistent, stable over time, and predictive of other performance measures, such as student achievement growth and teachers’ ratings of their school leadership.
Analytic Strategy
We use DID models that examine student outcomes (test scores, mobility, and attendance) and teacher and principal outcomes (turnover, effectiveness, and experience). We examine each outcome,

Equation 1 models
Equation 1 also includes a school fixed effect (
When modeling test scores, we make several adjustments to Equation 1. First, we not only estimate Equation 1 for each subject (reading, math, and science) separately but also use a pooled sample of all subjects where we add subject indicators to control for any systematic variation between the three subjects. Second, we add a control for students’ prior-year test score. We control for the prior-year achievement lag as our preferred model to facilitate comparisons with existing literature which primarily uses the prior-year lag. However, researchers have questioned the prior-year lag in this type of longitudinal model, arguing it may underestimate treatment effects because it adjusts for a score that may already be affected by turnaround (Sun et al., 2017). Therefore, we test two alternatives. First, we replace the prior-year lag with the average for each school-by-grade combination in all years prior to turnaround (i.e., a school-by-grade baseline lag). This alternative lag accounts for preintervention differences at the school-by-grade level, without controlling for scores that have been influenced by turnaround. We also replace the prior year test score with the average for each student in all years prior to attending a turnaround school (i.e., a student baseline lag). Models that use either the school-by-grade or student baseline lag lead to similar conclusions as our preferred prior-year lag (Appendix Table A5). Finally, for test scores outcomes, we add a grade fixed effect to ensure that results are not driven by unobserved differences across grades but excluding the grade fixed effect yields similar results (Appendix Table A4).
The coefficients of interest in Equation 1 are
To examine the ASD and iZone effects across time, we estimate event-study models that substitute the
Finally, in a third specification, we separate the indicators for ever-
Below we also describe multiple robustness checks to rule out potential validity threats. For example, we test whether comparison schools are a valid counterfactual by examining whether test score trends in ASD, iZone, and comparison schools are parallel in the preturnaround period. We also examine whether effects are driven by changes in student characteristics in these turnaround schools using a student fixed model to control for time-invariant student characteristics. Additionally, we test our models using an alternative comparison group and also examine whether our results are driven by mean reversion from potential dips in student performance prior to turnaround. Our checks provide evidence that our results are robust to alternative explanations.
Results
Descriptive Statistics
In Table 2, we present descriptive characteristics of students, teachers, and principals, showing that priority schools differ from nonpriority schools both before and after turnaround. Relative to nonpriority schools, priority schools tend to serve a larger population of Black students (87%–94%), FRPM eligible students (83%–92%), and students new to their school (28%–33%). Table 2 also shows that student characteristics are similar between ASD, iZone, and comparison schools before reforms began. When comparing baseline school characteristics before turnaround, we find only one significant difference in the proportion of minority students between iZone and comparison schools, but the magnitude of the difference (2 percentage points) is substantively small (Appendix Table A2). Moreover, turnaround reforms do not significantly change school compositional characteristics, suggesting that ASD or iZone effects are not driven by changes to the student population in these schools (Appendix Table A12). 18
Descriptive Characteristics of ASD Schools; iZone Schools; Non-ASD, Non-iZone Priority Schools; and All Other, Nonpriority Schools in Tennessee

Note. Attendance rate is the proportion of school days attended. The proportion of students new to a school do not include students who make structural moves. Principal years of experience only includes the years in which the individual was a principal, not all years of experience as an educator. The teacher TVAAS and principal observation scores range from 1 (significantly below expectations) to 5 (significantly above expectations). ASD = Achievement School District; iZone = Innovation Zone; FRPM = eligibility for free or reduced-priced meals; ELL = English language learner; SpED = special education status; TVAAS = Tennessee Value-Added Assessment System.
Table 2 also shows characteristics of teachers and principals in ASD and iZone schools. In ASD schools, both teacher and principal turnover increase after reforms begin. For example, the average proportion of new-to-school teachers rises from 24% to 51% after schools join the ASD. Part of this increased turnover is expected given staff replacement interventions in Year 1. However, increases in staff turnover are much less dramatic for iZone schools than ASD schools even though both models replaced teachers and principals in Year 1, suggesting that iZone schools were more successful at retaining teachers after the first year of intentional staff replacements.
There are also differences in the types of teachers and principals recruited to ASD and iZone schools. After schools join the ASD, teachers are more likely to be White (increasing from 28% to 40%), have fewer years of experience (decreasing from 12 to 5.2 years), and are less likely to hold a graduate degree (decreasing from 67% to 56%). Average teacher experience also decreases after schools join an iZone (from 11 to 8.7 years). However, the decrease in teacher experience in iZone schools is smaller than in ASD schools, and average teacher TVAAS scores are noticeably higher after schools join an iZone, rising from an average of 2.5 to 3.1 out of 5. These trends in teacher experience and effectiveness are mirrored among principals. Additionally, we examine descriptive characteristics for each ASD and iZone cohort to better understand the types of schools chosen for either model over time. Appendix Table A6 shows that student characteristics are similar in each of the five ASD and iZone cohorts, suggesting that different outcomes across cohorts are not likely driven by changes in the types of schools chosen for turnaround.
Before turning to the DID results, Figure 1 shows descriptive trends in standardized test scores, averaged across all three subjects, for ASD, iZone, and comparison schools. The trends are shown across a year variable centered at zero on the baseline year before turnaround. For comparison schools, Year 0 is the year before their priority designation. The figure shows that, prior to turnaround, student achievement is slightly lower in ASD and iZone schools relative to comparison schools; however, the trends in student achievement are qualitatively similar with no sharp spikes in either ASD or iZone schools that differ from comparison schools. Moreover, no crossovers exist between turnaround and comparison schools prior to reforms. Student test scores in all schools exhibit some declines in the years before turnaround, but these downward trends are similar in ASD, iZone, and comparison schools. This figure provides descriptive evidence that student achievement trends in comparison schools provide a valid counterfactual for what would have occurred in turnaround schools had they not joined either the ASD or an iZone. To provide further evidence supporting the parallel trends assumption, we estimate a model that includes separate indicators for each year in our panel and interact them with the ASD and iZone indicators. This model examines student achievement in each preturnaround year relative to the baseline year before turnaround (Appendix Table A7). Results show no significant difference in student achievement between either turnaround model and comparison schools in any preturnaround year. Moreover, joint F tests of all preturnaround years show no evidence of significant differences prior to turnaround.

Average student test scores in each year before and after turnaround interventions began.
Figure 1 also shows average standardized student achievement results after turnaround reforms are implemented, suggesting that test scores increase in all schools. Increases in all schools indicate that the priority designation alone may have spurred some improvements in these schools, because comparison schools received no other interventions. However, although all comparison schools show improvement, the increase in iZone schools surpasses comparison schools in the first 2 years. Then, the iZone gains diminish after Year 2, but they do not completely vanish, and average iZone scores remain higher than in the ASD. In contrast, test scores in ASD schools increase somewhat in the first 3 years, then decrease again, never catching up to either iZone or comparison schools and, by Year 6, average test scores in ASD schools are slightly lower than in any preturnaround year.
DID Results
Turning to the DID results, Table 3 shows average ASD and iZone effects on standardized test scores averaged across all years and cohorts for all subjects and each subject (reading, math, and science). The table also shows separate models including either the prior-year lag or the school-by-grade baseline lag. Consistent with previous literature, we find that including the baseline lag yields somewhat larger effects than the prior-year lag, because turnaround reforms may have affected the prior-year lag. However, we prefer the prior-year lag, because students’ most recent previous performance best accounts for unobserved factors that affect their current performance. Therefore, our preferred models should be interpreted as somewhat conservative. Hereafter, we focus on models using the prior-year lag; estimates using the baseline lag are available on request.
ASD and iZone Effects on Standardized Test Scores Averaged Across All Years and Cohorts

Note. Standard errors in parentheses. ASD and iZone represent the interaction between indicators for schools that are ever-ASD or ever-iZone and an indicator for years after schools begin turnaround. Comparison group schools are all priority schools not receiving any turnaround interventions on either the 2012 or 2014 priority list. ASD = Achievement School District; iZone = Innovation Zone.
p < .05. **p < .01. ***p < .001.
Table 3 shows that the average iZone effect is positive and statistically significant. Using a prior-year lag, the iZone effect is approximately 0.10 SD, which holds across subjects (though the coefficient is marginally significant for reading,
To examine effects over time, Table 4 shows estimates from our event-study model. In ASD schools, we find no significant effects in any year or subject. In iZone schools, we find positive and significant effects concentrated in the first 2 years. For example, the cumulative effect of iZone reforms after 2 years is 0.15 SD. Positive effects of iZone reforms in the first 2 years are similar across reading, math, and science, except the estimate for reading in Year 2 is marginally significant (
ASD and iZones Effects on Test Scores by Turnaround Year

Note. Standard errors in parentheses. Comparison group schools are all priority schools not receiving any turnaround interventions on either the 2012 or 2014 priority list. ASD = Achievement School District; iZone = Innovation Zone.
p < .05. **p < .01. ***p < .001.
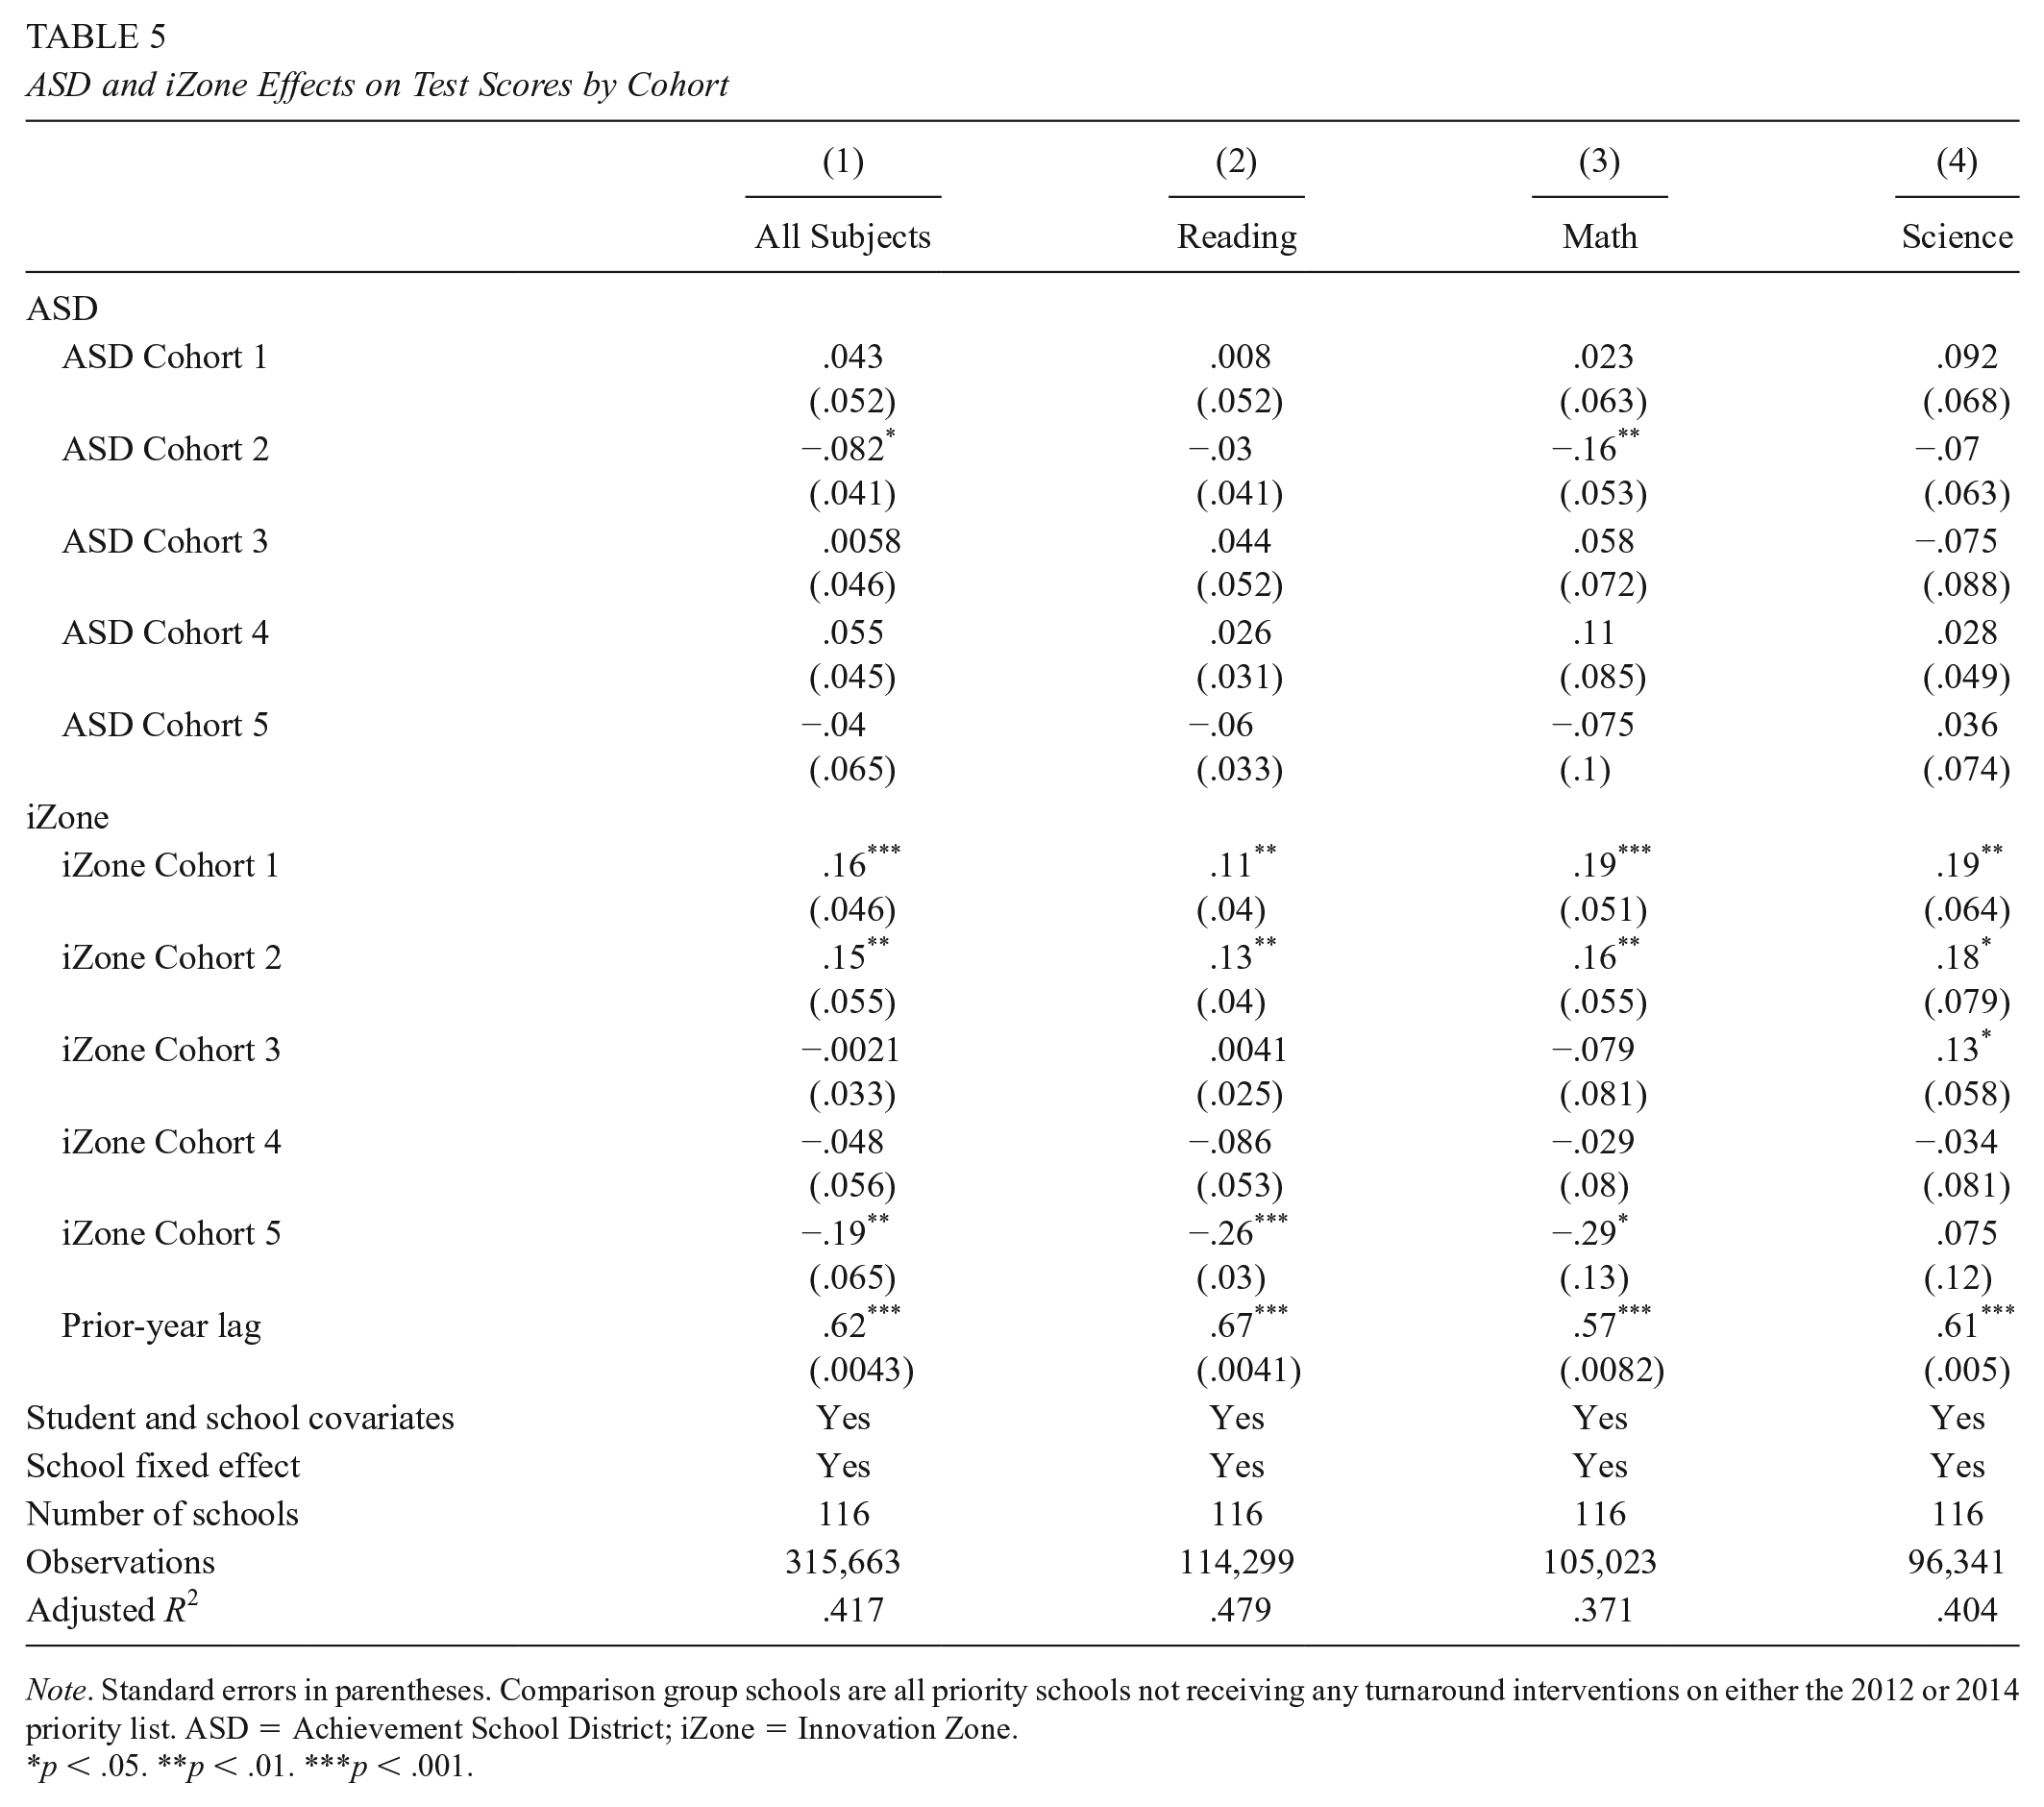
Table 5 examines separate effects for each cohort. For ASD schools, again we find no evidence of positive effects and even observe a 0.08 SD decrease in Cohort 2, driven mostly by math scores. For iZones, the overall positive effect is driven by the first two cohorts. The second and third cohorts produce mostly null effects, except a positive effect of 0.13 SD in science in Cohort 3. Finally, averaging all subjects, we find noticeable negative effects in the fifth iZone cohort of about 0.19 SD. These negative results are driven by scores in reading and math. Below, we discuss potential reasons for negative effects in the fifth iZone cohort.
ASD and iZone Effects on Test Scores by Cohort
Note. Standard errors in parentheses. Comparison group schools are all priority schools not receiving any turnaround interventions on either the 2012 or 2014 priority list. ASD = Achievement School District; iZone = Innovation Zone.
p < .05. **p < .01. ***p < .001.
Adding to our examination of test scores, Table 6 examines additional outcomes for students, teachers, and principals. We find that ASD and iZone reforms do not have a significant effect on student attendance or mobility, but teachers have a 23% increase in the probability of being new to the school after schools join the ASD. Part of the increased teacher turnover is explained by intentional staff replacements in Year 1, but below, we show that teacher turnover in the ASD continued to be high after Year 1. The coefficient for teacher turnover in iZone schools is not statistically significant. When we examine the effectiveness of incoming teachers, the coefficient is not significant for either model. Moreover, ASD teachers have fewer years of experience (4.9 fewer years than comparison school teachers) compared with iZone teachers (1.5 fewer years than comparison school teachers).
ASD and iZone Effects on Test Scores and Alternative Outcomes Across All Years and Cohorts

Note. Standard errors in parentheses. Comparison group schools are all priority schools not receiving any turnaround interventions on either the 2012 or 2014 priority list. LPM denotes linear probability models for a dichotomous outcome. Student new to school does not include structural moves where students transfer to a new school level after completing the final grade offered at her previous school. The TVAAS index is a standardized, continuous value-added measure of effectiveness calculated only for test subject teachers. Principal observation scores range from 1 (significantly below expectations) to 5 (significantly above expectations). ASD = Achievement School District; iZone = Innovation Zones; TVAAS = Tennessee Value-Added Assessment System.
p < .05. **p < .01. ***p < .001.
ASD principals have a 47% greater probability of being new to their school compared with comparison school principals. Similar to teachers, part of the elevated principal turnover in the ASD occurs because of mandated replacement policies in Year 1, but principal turnover remains high after the first year (Appendix Table A8). Average principal observation scores do not change significantly in either ASD or iZone schools, but average principal experience decreases in ASD schools (about 3.4 years).
To conserve space, effect estimates for these student, teacher, and principal outcomes separated by year are in Appendix Table A8, but we note that ASD schools experience elevated teacher and principal turnover across the 6 years, whereas teacher turnover increases only in Year 1 for the iZones. To provide more context for ASD and iZone effects across cohorts, Table 7 shows all outcomes separated by cohort. Again, there is little evidence that either ASD or iZone schools have significant effects on student attendance or mobility, except students in the third ASD cohort have a lower probability of being new to their school, and the fifth ASD cohort has lower attendance rates.
ASD and iZone Effects on Test Scores and Alternative Outcomes By Cohort

Note. Standard errors in parentheses. LPM denotes linear probability models for a dichotomous outcome. Student new to school does not include structural moves. The TVAAS index is a standardized, continuous value-added measure of effectiveness calculated only for test subject teachers. Principal observation scores range from 1 (significantly below expectations) to 5 (significantly above expectations). ASD = Achievement School District; iZone = Innovation Zone; TVAAS = Tennessee Value-Added Assessment System.
p < .05. **p < .01. ***p < .001.
Table 7 shows that the probability of a teacher being new to her school is increased in every ASD cohort (20%–38%), though the effect is marginally significant in cohort four. Likewise, the probability of a principal being new to her school is positive and significant in every ASD cohort (36%–70%). Moreover, average teacher and principal experience is lower than in comparison schools for every ASD cohort.
For iZones, the probability that a teacher is new to her school is also positive (8–15 percentage points) but smaller in magnitude than in ASD schools. The effect of iZone reforms on teacher turnover is highest in Cohort 5 (15%). Besides teacher turnover, the fifth iZone cohort differs in other ways from the first four cohorts. Only in the fifth cohort do we observe a negative effect on prior-year TVAAS scores among incoming teachers, suggesting that the fifth iZone cohort is recruiting less-effective teachers than comparison schools. Moreover, the probability that a principal is new to her school is only significant in Cohort 5, and only in the fifth cohort do we find a negative effect on principal experience in iZone schools. Together, these results show that the fifth iZone cohort experienced higher staff turnover with incoming teachers who are less effective and principals who are less experienced.
Alternative Specifications and Robustness Checks
To test the robustness of our DID estimates, we first use an alternative specification where we model the preturnaround trend using a comparative interrupted time series (CITS) model that includes a linear time trend interacted with ASD and iZone indicators (Appendix Table A9). The CITS results yield conclusions that are similar to our DID estimates. For example, the CITS model finds that, relative to comparison schools, the postturnaround deviation from the baseline trend for iZone schools is 0.11 SD. We do not use the CITS models as our main specification, because it estimates deviations from the baseline (preturnaround) trend, and the baseline trend may not be an accurate representation of how these schools are performing after 6 years of reform when student achievement trends in these schools may have changed dramatically.
Next, we examine potential validity threats. First, we test whether results are driven by a dip in performance among turnaround schools in the year immediately prior to reforms. This preturnaround dip may inflate our results because of mean reversion (Ashenfelter, 1978) and could occur if schools are discouraged by impending reforms in the following year. We examine this possibility using a placebo test that shifts the treatment year to the year prior to reforms and find that the estimates are not significant, providing evidence that no dip in performance exists in the baseline year (Appendix Table A10).
Then, we test whether our results are driven by changes in the student population in ASD or iZone schools by using both a student fixed effect model and testing whether the turnaround reforms significantly affected school compositional characteristics: enrollment and whether students are female, minority race, FRPM-eligible, ELL, and SpED. Effect estimates from the student fixed effects model produce similar conclusions (Appendix Table A11), and we find no evidence of changes in student characteristics after schools join either the ASD or an iZone (Appendix Table A12). Next, we test whether our results are robust to our choice of comparison group by using nonpriority schools that perform among the lowest 6% to 10% of schools in Tennessee. Our conclusions do not change when using this alternative comparison group (Appendix Table A13). Additionally, we restrict our comparison group to only schools designated as priority in 2012, instead of using both the 2012 and 2014 priority lists. Again, our conclusions do not change (Appendix Table A3). We also test whether our results are driven by students differentially leaving the test taking pool, by examining ASD and iZone effects on an indicator for missing test scores. We find that neither turnaround model significantly affected test score missingness, providing confidence that our results are not biased by differential selection of students into the sample (Appendix Table A14).
Finally, student movement between schools may bias our results. The potential bias may be concerning if schools retain higher-scoring students and push out lower-scoring students (Zimmer & Guarino, 2013). This issue is unlikely, because ASD and iZone schools were required to continue enrolling students from their neighborhood catchment areas. Nevertheless, we examine average student test scores among students who transfer into and out of schools in our sample (Appendix Table A15). We find no evidence of significant differences between incoming and outgoing students. 19
Student movement could also bias results if they move between turnaround and nonturnaround schools. For example, if students move from a turnaround school to a comparison school, the turnaround effects may linger after they transfer. To examine this issue, we remove all observations where students move (1) from a turnaround to a comparison school, (2) from a comparison to a turnaround school, or (3) across the two turnaround models. Only about 4% of the students in our sample make these transfers. These sample restrictions yield results that are similar to our main estimates (Appendix Table A16). Together, results from our checks support the robustness of our results.
Conclusions
This article examines the effects of Tennessee’s ASD and iZones after 6 years, contributing to the sparse literature on turnaround reforms that have evolved beyond the initial disruption stage into the later stages of capacity-building and sustaining the momentum. We use newly updated data to expand on a prior evaluation by Zimmer et al. (2017), because the effects reported by Zimmer and colleagues may have not allowed enough time for either model to fully mature, nor did they allow sufficient time to examine the sustainability of iZone effects. We find that ASD interventions did not result in better or worse performance than comparison schools, whereas positive iZone effects are primarily observed in the first two cohorts.
Since ASD schools have not produced significant effects on student achievement in any subject, year, or cohort, we conclude that the ASD model is unlikely to be successful in the future. Researchers have documented structural problems with this original model including alienation of local communities around these schools (Glazer & Egan, 2018), and TDOE leaders have recently announced plans to release ASD schools back to their LEAs by 2022 (Bauman & Aldrich, 2020).
To help explain null ASD effects, we find high rates of teacher and principal turnover in ASD schools after Year 1 when staff replacement was no longer required. Organizational instability from high staff turnover may partly explain why ASD schools could not produce positive effects. This result aligns with prior literature which finds that high staff turnover is negatively associated with student achievement (Henry & Redding, 2020; Ronfeldt et al., 2013) and a prior study finding that staff turnover suppresses potential positive effects of school reform (Henry et al., 2020). Our results also suggest that the characteristics of teachers and principals recruited to ASD schools may help explain insignificant effects. Teachers recruited to ASD schools were less effective and less experienced than teachers in comparison schools. Moreover, ASD principals have about 3.4 fewer years of experience than principals in comparison schools. Moving forward under ESSA, these results highlight the importance of experienced and effective educators on the success of school reform.
The iZone schools may have more easily recruited effective educators partly because they offered pay bonuses. Previous studies have shown that pay incentives can have a positive effect on teacher recruitment (Springer et al., 2016), suggesting that pay incentives can be a useful tool for policymakers to consider in order to bring effective educators into turnaround schools. Moreover, ASD schools may have had difficulty recruiting educators because the state-led model failed to gain trust from local communities. Previous work showed that the ASD faced community backlash when it began operating schools because critics saw the model as an attempt to remove schools from their local community (Glazer & Egan, 2018). Community mistrust may have dissuaded educators from coming to ASD schools, which suggests that policymakers thinking about state-led turnaround models must carefully attend to building local support.
For iZone schools, we find that positive effects are largely driven by the first two cohorts. Indeed, our effect estimates, averaging all cohorts together, are smaller than those reported by Zimmer et al. (2017). We estimate effect sizes (in SD) of 0.06 in reading, 0.10 in math, and 0.15 in science, whereas Zimmer et al. (2017) report effect sizes of 0.10 in reading, 0.20 in math, and 0.18 in science. The diminished effects in later cohorts suggest that the iZones may be having difficulty sustaining initial positive results.
To better understand effects in later iZone cohorts, we compare characteristics of students in each cohort and find them to be similar, suggesting that diminished effects in later cohorts are not driven by different types of schools joining the iZones. However, one potential reason for the diminished effects may be the inclusion of high schools. The iZones began taking over high schools starting with the third cohort, and the fifth iZone cohort consists entirely of high schools. This timing suggests that iZone interventions may be less effective in high schools. We test this potential explanation by interacting a high school indicator with the ASD and iZone indicators and find that this is indeed the case (Appendix Table A17). We urge future research to examine specific iZone interventions to better understand why they have not been as effective in high schools.
The negative effect of iZone schools in the fifth cohort is also noticeable, and our examination of teacher and principal outcomes suggest potential reasons to explain these negative effects. Relative to earlier cohorts, cohort five schools experienced the highest turnover rates, and educators in cohort five schools were less effective and less experienced prior to joining the iZone. These trends differ markedly from the first iZone cohort where teachers and principals were more effective than their counterparts in comparison schools. Comparing educator effectiveness and turnover across cohorts suggests that the local pool of effective educators may have diminished as more schools joined the iZone. This may have left too few effective educators available to staff schools in later cohorts, leading to less positive student achievement results.
Our findings have important implications for longer-term reform models under ESSA. Policymakers considering turnaround initiatives that rely on recruiting effective staff to low-performing schools would do well to focus on ways to continue expanding the local pool of effective teachers and leaders, perhaps by recruiting from broader geographic areas or building more robust in-service professional development programs. Developing more effective teachers is especially important given previous research finding that recruiting effective teachers to iZone schools negatively affected the schools that lost these teachers (Kho et al., 2018). To sustain turnaround supports for low-performing schools without negatively affecting other schools, educational authorities should pay particular attention to developing teachers and principals in low-performing schools.
In both turnaround models, we find no notable effects on student mobility or attendance. Student mobility is a salient issue in both ASD and iZone schools, because the proportion of students making nonstructural moves into these schools (30%) is approximately double the rates in nonpriority schools (15%). Given research that finds that school mobility can negatively affect student achievement (Friedman-Krauss & Raver, 2015), reform initiatives like the ASD and iZones should consider more actively addressing high-student mobility rates. Although average student attendance rates in ASD and iZone schools are only somewhat lower than in nonpriority schools (92% vs. 95%), low-student attendance rates can be a barrier to improvement if students are not in class to receive instruction. Future research should specifically examine how school reform models improve outcomes for chronically absent students, because they will likely need the most attendance support.
Overall, our results show a need for more evidence to elucidate school reforms in the later stages of capacity-building and sustaining the momentum. Even models that produce positive gains in early years may face different obstacles that require an evolving approach to supporting low-performing schools over time. We urge policymakers and educational authorities to carefully consider these lessons from Tennessee as they implement new reform models under ESSA.
Footnotes
Appendix
Interactions With an Indicator for High Schools

| (1) | (2) | (3) | (4) | |
|---|---|---|---|---|
| All subjects | Reading | Math | Science | |
| ASD | .01 (.03) | .00 (.03) | −.02 (.05) | .03 (.04) |
| ASD * High school | −.01 (.03) | .02 (0.06) | .11 * (0.04) | −.11 (.13) |
| iZone | .13 *** (.04) | .09 ** (.03) | .14 *** (.04) | .16 ** (.05) |
| iZone * High school | −.20 *** (.04) | −.16 *** (0.04) | −.26 *** (0.07) | −.06 (.06) |
| Prior year lag | .62 *** (.00) | .67 *** (.00) | .57 *** (.01) | .61 *** (.00) |
| Student and school covariates | Yes | Yes | Yes | Yes |
| School fixed effect | Yes | Yes | Yes | Yes |
| Number of schools | 116 | 116 | 116 | 116 |
| Observations | 3,15,663 | 1,14,299 | 1,05,023 | 96,341 |
| Adjusted R2 | .417 | .478 | .370 | .403 |
Note. Standard errors in parentheses. ASD = Achievement School District; iZone = Innovation Zone.
p < .05. **p < .01. ***p < .001.
Acknowledgements
We wish to thank the Achievement School District and Tennessee Department of Education for their feedback and assistance. Funding for this research was provided by John and Laura Arnold Foundation and the Walton Family Foundation. Any opinions or errors are solely attributable to us, however.
Notes
Authors
LAM D. PHAM is a PhD candidate at Vanderbilt University’s Peabody College in the Department of Leadership, Policy, and Organizations. His research interests include school improvement and reform, with a focus on personnel policies in low-performing schools.
GARY T. HENRY is dean of the University of Delaware’s College of Education and Human Development and professor in the School of Education and the Joseph R. Biden, Jr. School of Public Policy & Administration. A renowned researcher in the field of education, Henry specializes in education policy, educational evaluation, educator labor markets, and quantitative research methods.
ADAM KHO is an assistant professor of education in K–12 Policy and Leadership at the University of Southern California. His research interests include education policy and evaluation of programs serving traditionally disadvantaged students, with a focus on school improvement, school reform, and school turnaround.
RON ZIMMER is a professor and director of the Martin School of Public Policy and Administration at University of Kentucky. His research focuses on school choice and school finance.