
Abstract
In response to interest in the role of noncognitive factors in academic performance, several theoretical models have been developed; however, there have been few empirical attempts to validate those models, particularly with minority populations. This study used measures of academic mindsets, social skills, academic perseverance, learning strategies, and academic performance to test the structural pathways of a well-known hypothesized model of noncognitive factors and academic performance proposed by researchers at the University of Chicago Consortium on School Research. The population of study consisted of high school students from a mainly Hispanic, low-income school district. Results support the hypothesized model; however, academic perseverance was not significantly related to academic performance in the context of other noncognitive factors. Additionally, findings differed across groups, including age (e.g., freshman vs. senior), socioeconomic status (e.g., parent education, free/reduced priced lunch), and race/ethnicity.
Although cognitive skills are undeniably important, noncognitive 1 factors have gained mounting recognition and importance in education due to their potential for positive impact on students’ academic performance and success in adulthood (e.g., García, 2014; Gutman & Schoon, 2013; Weissberg, Durlak, Domitrovich, & Gullotta, 2015). Schools are being asked to measure students on a single noncognitive factor as an accountability metric as part of the Every Student Succeeds Act legislation. However, the implementation of noncognitive factors in education is moving forward before findings have solidified fully and consensus among researchers has been reached as to the specific associations between these competencies and the outcomes of interest in various contexts with various individual differences. Although previous studies have examined many noncognitive factors individually, it is more likely that these competencies interact with one another (Farrington et al., 2012). For the practitioner of education, working with a wide range of noncognitive skills, a more coherent model would be helpful for effective application. Various models of noncognitive factors and their relationships with academic performance have been offered throughout the years (e.g., CASEL, n.d.; Jones & Bouffard, 2012) without sufficient empirical studies testing these models. This study aims to test empirically one such model.
Another gap in the research involves the study of potential influencing factors (e.g., SES and race/ethnicity) on the development of noncognitive factors in relation to academic performance (Durlak, Weissberg, Dymnicki, Taylor, & Schellinger, 2011; Hoffman, 2009; Jones & Bouffard, 2012). Early generalizations of findings are occurring despite relatively few studies that look at noncognitive factors across a wide variety of settings and populations. Moreover, findings from the few studies are mixed (Credé, Tynan, & Harms, 2017; Garner, Mahatmya, Brown, & Vesely, 2014). There is a need to examine these models more closely, especially the individual and group difference factors (Sisk, Burgoyne, Sun, Butler, & Macnamara, 2018) that may moderate the effects of noncognitive factors on academic performance. This study focuses on those effects among a predominantly low-income, first-generation population.
Although the focus of this study is on noncognitive factors, an acknowledgment of the role of cognitive factors in students’ academic performance is warranted. Traditionally, educators have rightly emphasized the importance of developing students’ cognitive skills. Academic skills (e.g., fluid intelligence) and content knowledge (e.g., crystallized intelligence; Cattell, 1963), for example, are key for academic performance (e.g., Finn et al., 2014; Gathercole, Pickering, Knight, & Stegmann, 2004). Similar to noncognitive factors, various models of cognitive skills that affect academic performance have been proposed (Colom, Escorial, Shih, & Privado, 2007), including psychometric intelligence (IQ or g factor; e.g., Hannon, 2016; Neisser et al., 1996; Ridgell & Lounsbury, 2004), working memory and processing speed (e.g., Alloway & Passolunghi, 2011; Cain, Oakhill, & Bryant, 2004; Luo, Thompson, & Detterman, 2003), fluid and crystalized intelligence (e.g., Cattell, 1963; Luo, Thompson, & Detterman, 2006), and executive functioning (e.g., Bierman, Nix, Greenberg, Blair, & Domitrovich, 2008; Nguyen, Duncan, & Bailey, 2019). Currently, however, there is overall recognition in the field that cognitive factors are not isolated and are not the sole contributors to academic performance (Blair & Raver, 2014; Cunha & Heckman, 2008; Kautz, Heckman, Diris, Ter Weel, & Borghans, 2014). Therefore, other factors like noncognitive skills that also contribute to academic performance (García, 2014; Gutman & Schoon, 2013; Weissberg et al., 2015) require attention.
Development of noncognitive skills is complex, and studies examining their development must account for this complexity. Traditionally, this body of research tends to examine developmental phenomena with the traditional psychological research approach: studying single pathways to and from noncognitive factors. However, a new approach is needed to understand the complex interworkings of the individual in his or her context over time (Lerner & Castellino, 2002). A more recent approach to psychological studies, developmental systems theory (DST), considers “[how] mutually influential relations between individuals and contexts regulate the course of developmental change” (Lerner, Leonard, Fay, & Issac, 2011, p. 146). DST is a relational metatheory, which provides an important lens through which to understand the complex nature of human development. It can provide a theoretical framework by which to study the role of noncognitive factors in promoting academic performance, while considering the contexts—such as individual or group differences, in case of the current study—which may affect their development.
The key components of the DST that frame this study are relationism, where each variable and system interacts in bidirectional, reciprocal, and/or fused ways; plasticity, the potential for an individual to change across the life span; and individual differences, as the natural variability occurring from the fused interaction of genes and environment such that no two people are alike (Lerner, 1991). This theory provides a framework for researchers to study: what individual characteristics in combination with contextual characteristics, from what levels of systems, at what points in time, will foster what instances of development, within which portions of the life span (Lerner et al., 2011). A growing body of developmental research has used a developmental systems framework, especially in education (e.g., Aidman & Malerba, 2017; Albin-Clark, Shirley, Webster, & Woolhouse, 2018; Bornstein, Hahn, & Wolke, 2013; Oshri, Duprey, Kogan, Carlson, & Liu, 2018). The current study uses DST as a framework within which to examine the interactions and relationships among noncognitive factors and academic performance, for adolescent students in the public school context, while considering individual difference factors shared across groups (e.g., race/ethnicity and socioeconomic status [SES]), at different times across the early life span (i.e., for a cross-section of freshman and senior high school students). Future studies in the series will investigate longitudinal effects for the freshman cohort as juniors and as seniors.
The model of noncognitive factors and academic performance for adolescents (youth aged 11–18 years) hypothesized by Farrington et al. (2012) at the University of Chicago Consortium on School Research (CCSR) provides a conceptual framework with which to study relational interactions in multiple contexts. This framework was created through an extensive literature review of five main categories of noncognitive factors and their relations to academic performance. The noncognitive factors in the CCSR model include academic mindsets, social skills, academic perseverance, and learning strategies, which manifest through academic behaviors to predict academic performance (see Figure 1). School and classroom context factors, as well as student individual characteristics, are assumed to relate to the noncognitive factors and are included in the model. However, the emphasis of the CCSR framework is placed on the relationships among the noncognitive factors.

Chicago Consortium of School Research (CCSR) hypothesized model of how noncognitive factors promote academic performance.
Importantly, this model lacks empirical testing and behooves inquiry as to whether it generalizes to a variety of populations, which is the purpose of the current study. This model was selected over other models for several reasons. First, it is parsimonious. Second, it is widely cited (over 1000 citations at the time of publication). Third, from a DST perspective, it allows us to examine the relational component of interacting constructs; furthermore, the model is situated within contextual and individual factors. It is important to test this model to (a) identify if the relationships exist empirically, (b) understand for whom the relationships exist, and (c) to isolate if any factors are more important than others for students’ success.
A brief description of the CCSR hypothesized model is provided below, followed by the rationale for the current study. For a more thorough literature review of the noncognitive factors and their relations to academic performance, we recommend reviewing the original source of the CCSR conceptual framework (Farrington et al., 2012).
Academic Behaviors
Academic behaviors are most proximal to academic performance (Farrington et al., 2012). Academic behaviors are the actions, habits, or ways of behaving in the classroom (e.g., attending class, completing homework, engaging in instructional activities). These behaviors are directly observable, making them relatively easy to monitor, and thus have been the focus of many interventions (Freeman et al., 2016; Maynard, Kjellstrand, & Thompson, 2014). They are also the subject of study because they are extremely important for academic performance and success (e.g., Allensworth & Easton, 2007; Conard, 2006). To learn content, skills, and knowledge, one has to be physically present in the classroom (attendance) and complete assignments (homework). Additionally, the importance of academic behaviors is found in the fact that other noncognitive factors almost always affect academic performance by working through academic behaviors (Cooper, Robinson, & Patall, 2006; Cooper, Steenbergen-Hu, & Dent, 2012). For example, academic mindsets (further discussed below) do not directly affect academic performance; instead, mindsets and attitudes toward learning can affect students’ academic behaviors, such as how often a student shows up to class, their level of engagement in the course material, and how much effort they put into their schoolwork. These behaviors in turn can have an impact on academic performance. Therefore, academic behaviors can be construed as a mediator of cognitive and noncognitive factors on academic performance.
Academic Mindsets
Academic mindsets are a conviction or belief about one’s own abilities—including having a growth mindset or sense of belonging in the academic setting (Farrington et al., 2012)—that can affect motivation, behavior, and performance both in positive and negative ways. This relationship has been established both theoretically (Dweck & Leggett, 1988; Osterman, 2000) and empirically (Cury, Elliot, Da Fonseca, & Moller, 2006). For example, a student who does not identify with her fellow math students or the topic itself might struggle to see value in learning the subject and not be motivated to complete the homework (academic behavior), which in turn affects his or her grade (academic performance). As evident in this example, academic mindsets affect academic performance through academic behaviors.
CCSR identifies four important academic mindsets that play a role in academic behaviors and performance: (a) belongingness to the academic community, (b) growth mindset, (c) self-efficacy, and (d) value for academic work (Farrington et al., 2012). Not only is there a pathway from academic mindsets to academic behaviors and performance, but there is also a reversed pathway (Yeager & Walton, 2011). For instance, doing well in a subject can validate and reinforce academic behaviors and mindsets for students.
Academic mindsets are also related to the other noncognitive factors. For example, a growth mindset is likely to boost one’s continuing effort or determination to overcome obstacles in academics (i.e., academic perseverance, see section below for a description; Dweck, 1986). Academic mindsets also drive learning strategy use (defined and described further below), since an intrinsic value toward academics is needed to motivate and initiate learning strategies (i.e., goal setting; Schunk, 1990). For example, a student who feels they can be efficacious in studying for math may be more likely to set goals and manage the amount of time that they allocate toward their math homework compared with a student who has no confidence in their math abilities.
Academic Perseverance
Academic perseverance is the tenacity to achieve long-term goals, resist distractions, control behaviors, as well as withstand challenges and overcome obstacles related to learning course material (Farrington et al., 2012). Persistence, consistency, self-discipline, self-control, and delay of gratification fall under this umbrella of academic perseverance and have been found to be important for truly mastering a topic (Duckworth, Peterson, Matthews, & Kelly, 2007; Duckworth & Seligman, 2005; Mischel, Shoda, & Peake, 1988). A student must not only be able to show up for class but must also exhibit self-control to focus and stay on task as well as continue to attend class for their entire academic career despite any difficulties or obstacles.
Students’ academic perseverance has been found to be context dependent in the classroom and interacts with the other noncognitive factors (Dweck, Walton, & Cohen, 2011). Empirical work has begun to examine some of these relationships cross-sectionally. For example, learning strategies can affect academic perseverance (Bembenutty & Karabenick, 1998; a discussion of learning strategies follows in the section below). Strengthening or increasing students’ repertoire of learning strategies may increase their likelihood to persist through obstacles or complications that may arise. In another example, students’ academic mindsets can affect their academic perseverance or tenacity (Dweck et al., 2011); a student with a positive outlook on their studies and their abilities is more likely to persevere in difficult settings (Lent, Brown, & Larkin, 1984).
Learning Strategies
Farrington et al. (2012) define learning strategies as a set of related skills that support student learning, including metacognition, self-regulated learning, and goal setting. Each of these constructs has convincing bodies of literature supporting its relationship to academic performance (e.g., metacognition, see Hacker, Dunlosky, & Graesser, 2009; self-regulated learning, see Zimmerman & Schunk, 1989; goal setting, see Barron & Harackiewicz, 2001; Linnenbrink-Garcia, Tyson, & Patall, 2008). There is arguably overlap of these skills with cognitive skills; however, we defer to the definitions discussed by the authors of the framework we set out to test, namely, skills that are not directly measured by cognitive tests. Skills related to learning strategies are not discussed in the literature as strictly cognitive skills. For example, metacognition has been discussed as a regulator of first-order cognition (Kuhn, 2000).
Students who employ learning strategies are able to self-regulate, set goals, employ study skills, and use metacognitive strategies that aid in the process of learning (Zimmerman, 2001; Zimmerman & Schunk, 2008). For example, making and sticking to a goal to study for an exam in a quiet place with a more capable peer 2 weeks early can affect a student’s exam grade or academic performance. Learning strategies not only interact with other noncognitive factors but also have reciprocal relationships with them (Farrington et al., 2012). For example, metacognitive awareness and strategy use can increase competence, which may strengthen one’s sense of self-efficacy, which, in turn, may contribute to academic perseverance. On the other hand, students who have a greater sense of self-efficacy and value their academics are more likely to set academic goals and employ self-regulatory strategies and study skills (Pintrich & de Groot, 1990; Schunk, 1990; Zimmerman, Bandura, & Martinez-Pons, 1992). An important limitation of these studies is that they are mainly cross-sectional, making it difficult to determine a causal link. It may be that students who have high academic performance are able to employ learning strategies more effortlessly because they find the task or topic easy.
Social Skills
Finally, social skills have also been linked to positive academic performance (Durlak et al., 2011; Malecki & Elliot, 2002; Wentzel, 1993); social skills are described as positive interpersonal interactions, self-awareness and self-management, decision making, and improved behavior (Farrington et al., 2012). As with the other noncognitive factors, social factors have an indirect relationship to academic performance through students’ behaviors (Greenberg et al., 2003). For example, students with a more highly developed sense of self, responsibility, and interpersonal skills may be more likely to have a positive, distraction-free experience in the classroom, resulting in greater attention given to learning and achievements.
This study used leadership skills and prosociality as indicators of students’ social skills. Both indicators involve students positively interacting with peers; in addition, leadership involves making appropriate social decisions. Particularly in more collaborative classroom styles, social skills like leadership and prosociality can enhance learning (Slavin, 1995; Wentzel, 1993).
It is difficult to isolate the impact of social skills due to the overlap with the other noncognitive skills in the model (e.g., self-control). Moreover, the studies showing a link between social skills and academic performance tend to be correlational, meaning that we cannot be sure of a causal relationship. Additionally, it is possible that we see higher performance for students with developed social skills due to teachers rewarding good behavior. The good news is, social skills have been found to be quite malleable through interventions (Bond & Compas, 1989; Durlak et al., 2011; Ladd & Mize, 1983).
The Whole CCSR Model
To generate accounts for behavior within development and to be able to make suggestions, we need to understand the bidirectional contributions of variables from multiple levels, which requires an integrative and multidisciplinary approach (Damon & Lerner, 2009). Little research has examined noncognitive factors together along with their interrelated effect on academic performance. Therefore, the CCSR developed the present model by examining the research on each of the noncognitive factors separately and the relationships between each noncognitive factor and academic performance.
One other study attempted to test a version of the CCSR model as a whole. Farruggia, Han, Watson, Moss, and Bottoms (2018) tested a version of the hypothesized CCSR model with an ethnically diverse sample of college students. Overall, Farruggia and colleagues found some support for the hypothesized model, but some of their findings did not support the model. For example, they found a weak relationship between academic perseverance and academic performance and no relationship between learning strategies and academic performance. Furthermore, they tested the model within a college population (e.g., emerging adult population) as opposed to an adolescent population, which was the focus of the literature review of Farrington and colleagues.
DST suggests we should also look at contextual factors that may influence differences among people. Three factors we focused on were age, race/ethnicity, and SES. The relationship between noncognitive factors and academic performance may differ based on age, race/ethnicity, SES, and other proximal and distal contextual ecologies, and it is important for research studies to examine these developmental processes among diverse populations (García Coll et al., 1996). These differences may not only be due to the contextual differences between groups but also the phenomenological experience of being a member of those contextual groups (e.g., being a certain race/ethnicity or SES; Spencer, Dupree, & Hartmann, 1997).
For example, Farruggia et al. (2018) tested how the model differed by race/ethnicity and found support for the notion that the relationships among noncognitive factors differ by race/ethnicity. For instance, the relationship between academic perseverance and academic performance was nonsignificant for Latino and African American students but significant for Asian and White students. Thus, it is important to examine how the CCSR model performs across different groups of students, especially given the dearth of studies examining subgroup differences (e.g., age, SES, race/ethnicity) in noncognitive factors (Farrington et al., 2012). The current study aims to expand on the work by Farruggia et al. (2018) by examining the model using different measures of the noncognitive factors (e.g., using goal setting instead of time management) within a different population (i.e., using a group of predominantly Hispanic and low-income high school students instead of college students).
The Current Study
Further empirical testing is needed to determine the validity of the CCSR model developed by Farrington et al. (2012), to consider the interactions across variables and across groups, and to isolate what factors, if any, are more important than others for students’ success. Furthermore, it is important to test this model among specific populations to understand for what groups the relationships may exist and to specify the nature of those relationships. Therefore, this study utilizes a minority population and also examines group differences related to receipt of free/reduced-price lunch (FRPL), English Language Learners, parental education, and race/ethnicity to test the CCSR model of noncognitive factors. Furthermore, to explore potential developmental differences across age, this study utilizes a cross-sectional design to examine two cohorts—freshmen and seniors.
Method
This study utilized data from an evaluation study conducted in a predominantly Hispanic and low-income school district. The evaluation study only surveyed freshmen and seniors as a cost-saving measure; freshmen were to be surveyed again when they became seniors 3 years later. There were two primary data sources in the evaluation study—a survey of freshmen and seniors (testing noncognitive factors) and district data (i.e., students’ previous GPA and GPA at the end of the year)—which were used to test the CCSR model of noncognitive factors.
Participants
Survey participants included two cohorts—all freshmen and all seniors—from five high schools in a primarily Hispanic (85%) and low-income (80%) southern California school district. The five high schools serve 1,567 freshmen and 1,486 seniors. Students were excluded from participation if they did not speak English, if a disability precluded them from taking the surveys, or if they did not consent to taking the surveys. Overall, the survey achieved an optimal response rate, with an average of 85% of freshmen and 71% of seniors across the five schools participating in the survey. Demographics for the entire sample, as well as for freshmen and seniors separately, are provided in Table 1.
Demographics of the Entire Sample, Freshmen, and Seniors

Note. EO = English only; RFEP = redesignated fluent English proficient; LEP = limited English proficient.
Measures
A series of psychological, social, and academic measures were included as part of a larger evaluation within a school district. Due to the number of measures included in the original evaluation study (many not included in this study), longer scales were sometimes reduced to fewer items to avoid survey fatigue. Descriptive statistics for all measures are shown in Table 2; see Appendix A for mean differences in the composite scores by grade level, English language status, parent education, FRPL, and race/ethnicity.
Correlation Table and Descriptive Statistics for All Measures (n = 2,229)
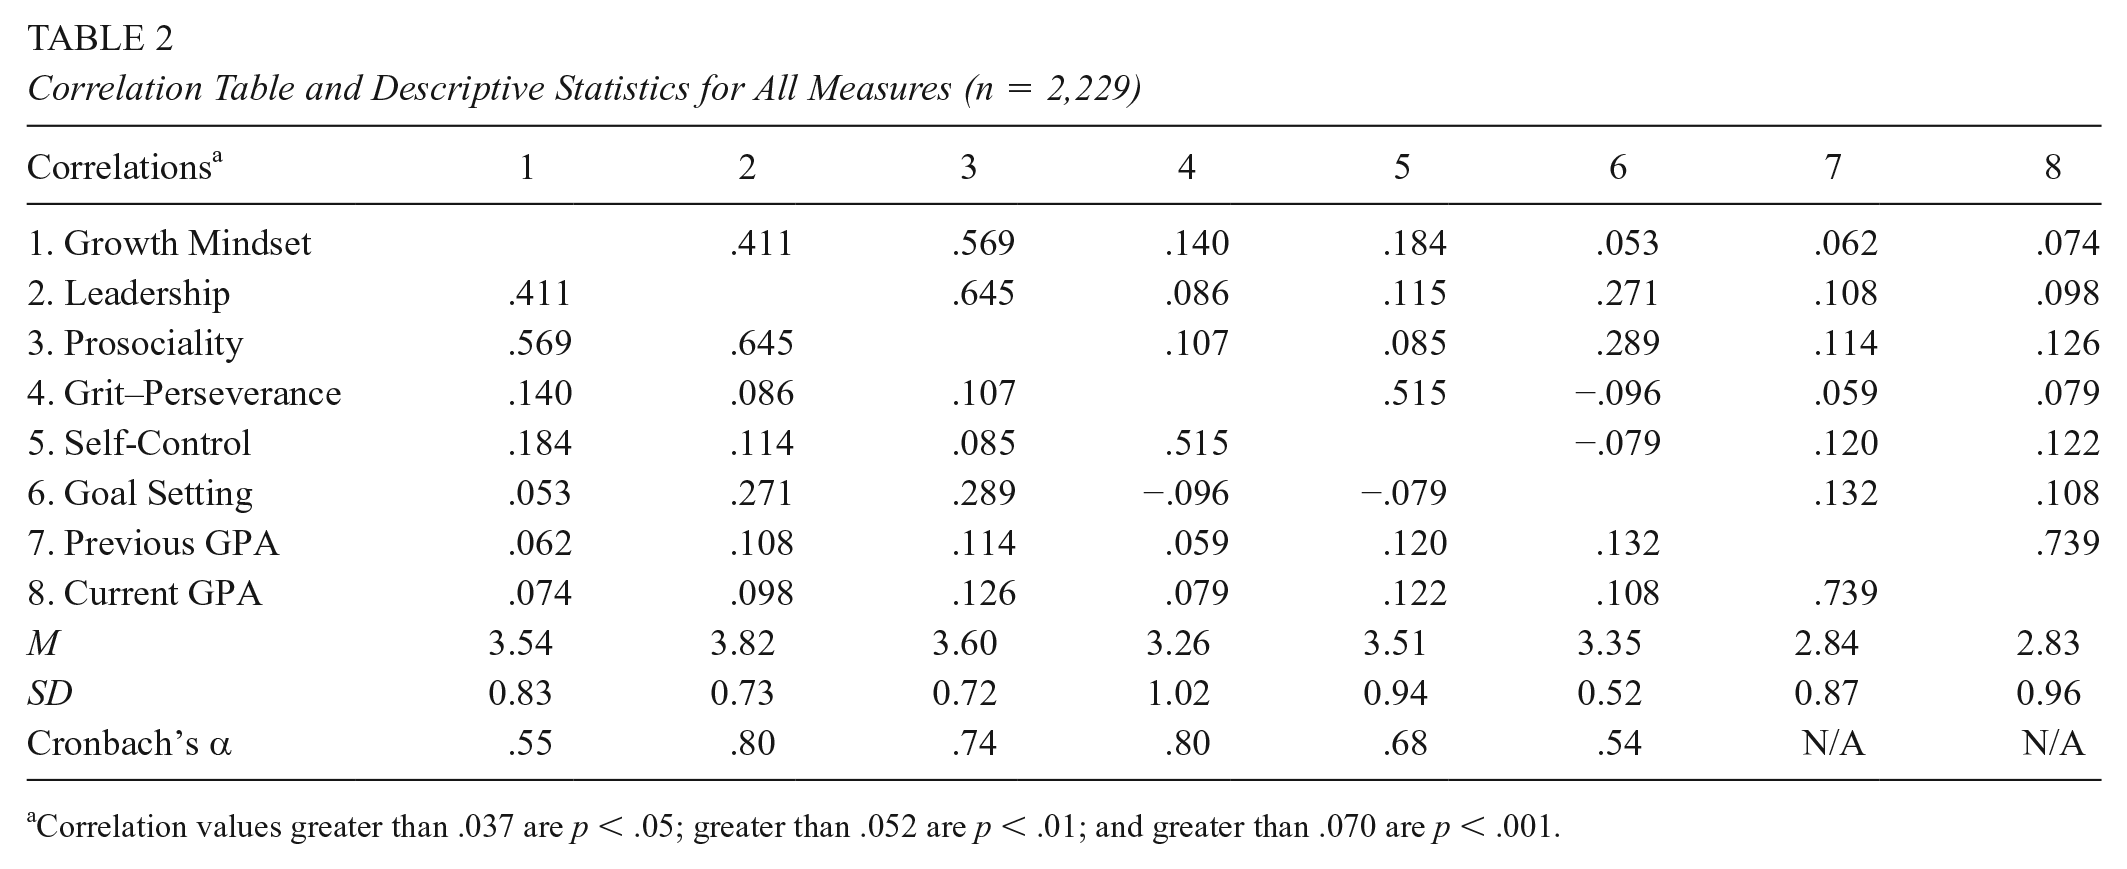
Correlation values greater than .037 are p < .05; greater than .052 are p < .01; and greater than .070 are p < .001.
Academic mindsets were measured using three of the four items of the Entity Self-Beliefs subscale of the Self-Theory version of the Implicit Theories of Intelligence Scale, otherwise known as growth mindset (De Castella & Byrne, 2015). Two scales were used to measure social skills: leadership and prosociality. Leadership was measured with the eight-item leadership competence subscale of the Sociopolitical Control Scale for Youth (Peterson, Peterson, Agre, Christens, & Morton, 2001) which measures youth’s perceptions of their skill at organizing a group of people. Two scales were used to measure academic perseverance: grit-perseverance and self-control. Academic perseverance was measured using the Perseverance of Effort subscale of the Short Grit Scale (Duckworth & Quinn, 2009). Self-control was measured using six items of the short version of the Self-Control Scale (Tangney, Baumeister, & Boone, 2004) which measures youth’s abilities to control thoughts, emotions, impulses, and performance.
Two scales were created by the researchers for use in the evaluation study that led to this research study. A prosociality scale was created by the evaluation team to measure students’ willingness to help and give back to their family and community and consisted of eight items. It should be noted that the use of prosociality as a measure of social skills may not be optimally related to the CCSR definition of social skills; however, given the proximity of the definitions, we proceeded with this measure as our operational definition of social skills for the purpose of this article. Learning strategies was measured with a scale on goal-setting behaviors and consisted of 12 items. Appendix B details how these two scales were created and the items for each scale.
Students’ academic performance data and demographic data were collected from the school district. To test for the cyclical nature of the CCSR model, academic performance data included both previous and current GPA. Previous GPA was defined as overall weighted GPA at the end of eighth grade for freshmen and end of ninth grade for seniors. Current GPA was defined as the overall weighted GPA at the end of ninth grade for freshmen and the overall weighted cumulative high school (i.e., 9th–12th grade) GPA for seniors. For all GPA variables, cumulative GPA was used, which includes all courses taken by students—both academic and nonacademic courses. This was due to the nature of data provided by the school district as this study used archival data which had been provided for an evaluation project of a different purpose. No academic behaviors data were collected for the original evaluation study and therefore could not be examined in this research study. Initially, the research team considered collecting attendance data from the district; however, average attendance at the five high schools was around 90% and therefore would provide little variability as a variable in the model. Demographic data collected from the school district included gender, FRPL, English Language Learners, parents’ highest education level, and race/ethnicity. 2
Procedures
Surveys were administered to all freshmen in Fall 2015 at the beginning of their freshman year of high school and to all seniors in Spring 2016 in the month prior to graduating high school. The evaluation study which provided the data for this study intended to gather survey data from students at the very beginning and end of their high school experience. Therefore, freshmen were measured at the beginning of the school year and seniors were measured at the end of the school year. The original freshman cohort would, in turn, again be surveyed at the end of their senior year. A member of the evaluation team was on-site for all data collection to inform participants about the nature of the study, answer any questions they may have regarding the surveys or the study, and to ensure consistency and rigor in survey administration. The district provided student demographic and academic data for all freshmen and seniors at the five participating high schools in Summer 2016.
Analytic Procedures
All analyses were conducted using the lavaan package in R (Rosseel, 2012). Robust maximum likelihood estimation was used due to violations of multivariate normality. The analytic approach involved three steps. First, the psychometric properties of all five scales were evaluated using confirmatory factor analysis (CFA). Second, once support of the factor structure was established, a structural equation model (SEM) was performed to test the hypothesized model of relationships among the noncognitive factors and with academic performance (Farrington et al., 2012). Third, once the structural model was established, several multigroup SEMs were performed to test any differences between freshmen and seniors, students with low and high SES, and between students of different race/ethnicities in the hypothesized model.
All CFAs and SEM models were evaluated with several model fit indices. First, the measurement component was examined to determine whether they converged onto their respective factors. Items with factor loadings less than .50 were removed from the model to minimize measurement error. A nonsignificant chi-square test, indicating differences between the actual and predicted covariance matrices, suggests a good approximation of the data (Ho, 2006). However, given the sensitivity of the chi-square test in relation to sample size, the chi-square to degrees of freedom ratio was also assessed, interpreting a ratio of less than five as acceptable (Bollen, 1989). Two incremental fit indices, the robust comparative fit index (CFI) and robust Tucker–Lewis index (TLI; also known as the nonnormed fit index), were also used, with acceptable values above .90 and preferred values above .95. Two absolute measures of fit, the robust root mean square error of approximation (RMSEA) and standardized root mean square residual (SRMR), were used, with values less than .08 acceptable and values less than .06 preferred. Last, modification indices were examined to determine whether model fit would improve with additional pathways added as well as to see if items would load strongly onto other factors, which would lead to removing that item.
Last, the final retained model was used to compare various groups across age (i.e., freshmen and seniors), SES (i.e., parental education and FRPL), and race/ethnicity (i.e., Hispanic and non-Hispanic students). Multiple group SEM was performed to test the SEM models across groups. First, configural invariance was tested to compare the measurement models to determine whether items are loading onto factors similarly across groups (Kline, 2015). If model fit was acceptable, weak invariance was tested to see whether factor loadings were similar across groups. The models for configural and weak invariance were tested using a chi-square difference test and comparing model fit indices. If model comparisons were statistically significant and differences in model fit indices greater than .001, then variance at that step was assumed and the configural model was retained. If model comparisons were not statistically significant or differences in the model fit indices were less than or equal to .001, then invariance at that step was assumed and the weak invariance model was retained. If weak invariance was obtained, then structural invariance was tested to see whether the regression pathways were similar across groups. Model comparisons were performed again for the weak invariance compared with the structural invariance models. As discussed in the Results section that follows, no models obtained structural invariance. 3
Results
Confirmatory Factor Analyses
CFA was performed on all items used in this study (see Table 3). The initial CFA resulted in poor model fit. Seven items (one prosocial, two self-control, and four goal-setting items) were removed due to poor factor loadings (<.50) and an eighth item (prosocial) was also removed because it was the only remaining family-related prosociality item, leaving the prosociality construct to measure community-related prosociality only. The next CFA (CFA 2), with the eight items removed, improved in model fit but still had a relatively poor fit. Modification indices were examined at this point, and they suggested (a) that one leadership item should load onto multiple other factors and so this item was removed and (b) that three pairs of prosociality items and one pair of leadership items should be correlated. These items’ error terms were correlated because the item pairs were worded similarly and thus were more highly related to each other than they were to the other items in their respective scales.
CFA and SEM Model Fit Results
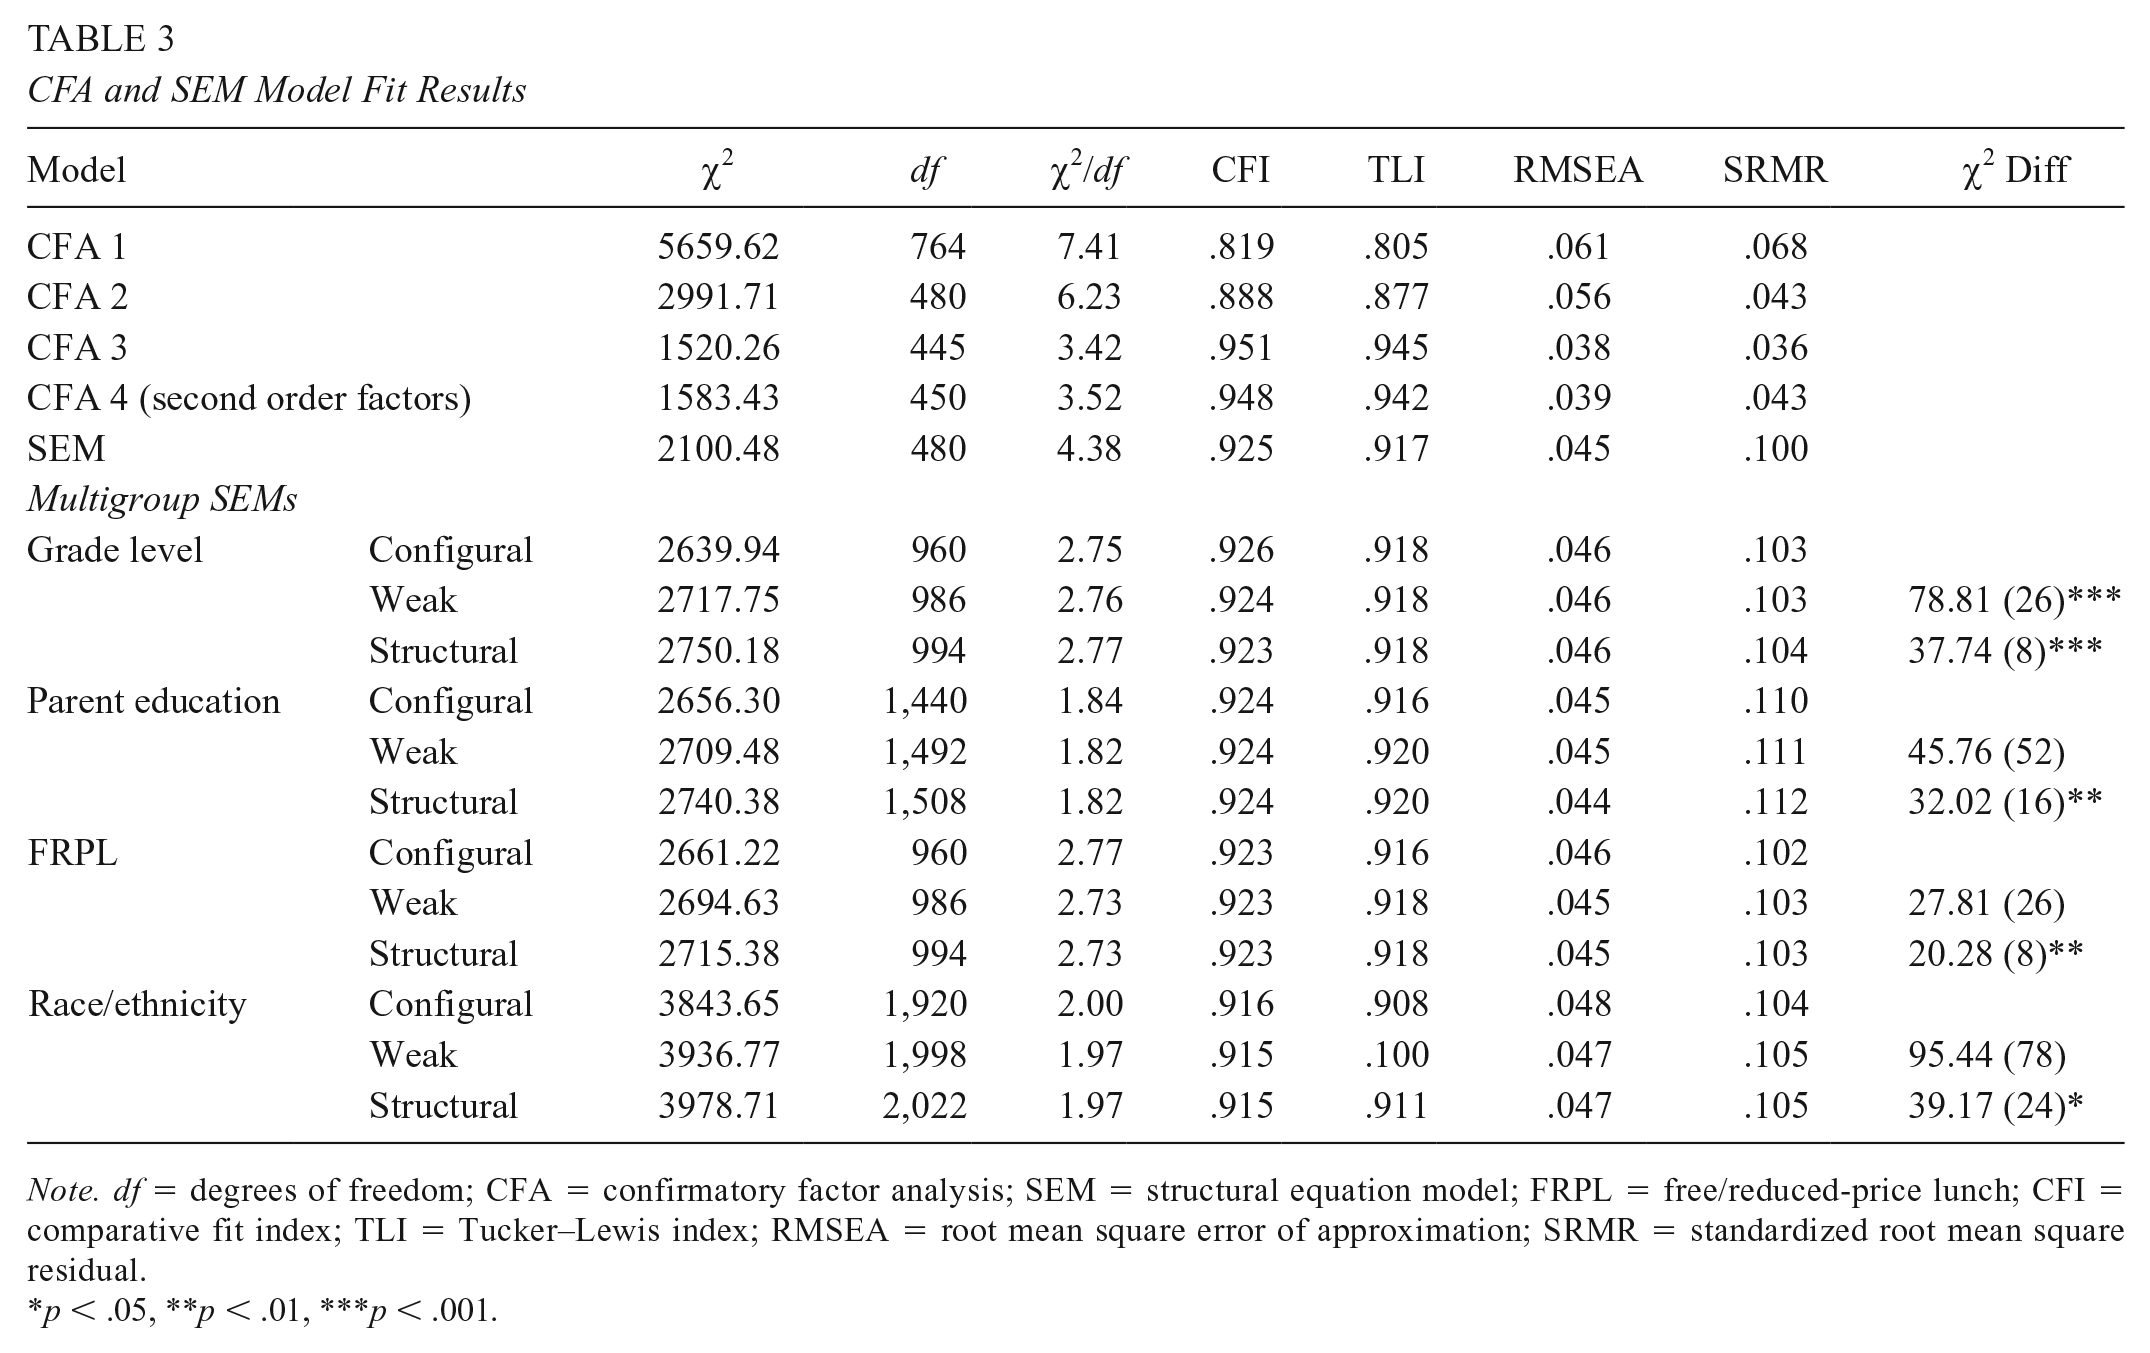
Note. df = degrees of freedom; CFA = confirmatory factor analysis; SEM = structural equation model; FRPL = free/reduced-price lunch; CFI = comparative fit index; TLI = Tucker–Lewis index; RMSEA = root mean square error of approximation; SRMR = standardized root mean square residual.
p < .05, **p < .01, ***p < .001.
The next CFA (CFA 3), with four item error correlations and one additional item removed, resulted in a good model fit. Finally, a fourth CFA was examined in which second-order latent factors of social skills and academic perseverance were added to the model; this model would allow testing the second-order latent factors in the structural model of the SEMs. This model resulted in a good model fit but had a slightly worse fit than the third CFA in which there were no second-order factors; however, the fourth CFA was retained for parsimony and for use with the SEM models. All items from CFA 4 loaded onto their respective factors with a standardized loading greater than .50; furthermore, both first-order latent factors loaded onto the second-order factors at a strength ranging from .699 to .806. See Appendix C for the factor loadings from this fourth CFA.
Structural Equation Models
An SEM model was performed testing the hypothesized model of how noncognitive factors relate to academic performance. The measurement model was based on the fourth CFA in which there were two second-order factors of social skills (leadership and prosociality) and academic perseverance (grit–perseverance and self-control), and the structural model was based on the hypothesized model in Figure 1. This model resulted in a good model fit (see Table 3). Modification indices were examined, and they suggested correlating learning strategies and social skills, which improved model fit significantly, χ2(479) = 1704.68, χ2/df ratio = 3.56, CFI = .943, TLI = .937, RMSEA = .039, SRMR = .043, resulting in a latent correlation between learning strategies and social skills of .625. However, given the purpose of this study to examine the CCSR model of noncognitive factors’ relationships with academic performance, the SEM hypothesized model was retained for further analysis. See Figure 2 for the final SEM model and the first row of Table 4 for the regression pathways.

Final structural equation model (SEM).
Group Differences in the Structural Models for the Multigroup Structural Equation Models

Note. FRPL = free/reduced-price lunch. R2 values are shown in the first column under GPA. Standardized coefficients and (standard errors) are shown for the remaining columns. The outcomes and predictors reference the second-order latent construct rather than the specific scales used to measure each higher order construct (i.e., mindsets consists of growth mindset, social skills consists of leadership and prosociality, perseverance consists of the grit perseverance subscale and self-control, and learning strategies consists of the scale on goal-setting behaviors).
p < .05, **p < .01, ***p < .001.
Overall, growth mindset was the noncognitive factor most strongly related to current GPA (β = .197, p < .001). Social skills (β = .097, p = .001) and learning strategies (β = .072, p = .002) were also related to GPA, albeit at a weaker strength. Academic perseverance (β = .006, p = .860) was not related to current GPA beyond the other noncognitive factors. Furthermore, growth mindset was related to all three other noncognitive factors, including social skills (β = .145, p < .001), academic perseverance (β = .334, p < .001), and learning strategies (β = .108, p < .001). However, learning strategies was not significantly related to academic perseverance above and beyond growth mindset (β = .057, p < .124). This model predicted 6.3% of the variance in current GPA.
A third SEM model was examined in which previous GPA was added to the hypothesized model to determine how noncognitive factors predicted current GPA after controlling for previous GPA. This resulted in a good model fit, χ2(422) = 1877.91, χ2/df ratio = 4.45, CFI = .910, TLI = .901, RMSEA = .047, SRMR = .098. In this model, previous GPA significantly predicted academic mindsets (β = .184, p < .001). Furthermore, previous GPA was the largest predictor of current GPA (β = .722, p < .001) followed by academic mindsets (β = .066, p = .001). None of the other three noncognitive factors were significantly related to current GPA, and learning strategies continued not to be related to academic perseverance. This model predicted 55.3% of the variance in current GPA meaning previous GPA explained an additional 49% of the variance in current GPA over and beyond the noncognitive factors.
Multigroup SEMs
Multigroup SEMs were used to compare models by grade level, parent education, and FRPL (see Table 3). English Language Learner status was not included due to large standard errors for the group of English Learners (limited English proficient or LEP; i.e., standard errors for regression pathways exceeding .30). As seen below, structural invariance was not accepted for all types of groups analyzed. Therefore, the structural pathway differences among the types of groups shown in Table 4 are based on the results of the weak invariance models.
Grade Level
Configural invariance was accepted. There was evidence of weak (or metric) variance, Δχ2(26) = 78.81, p < .001; however, differences between model fit indices were miniscule (e.g., ΔCFI = .001) and comparisons of standardized factor loadings suggested that the only differences were that factor loadings were for the most part stronger for seniors than for freshmen. This finding is intuitive given that youth increase in their ability to respond to surveys as they get older (Hoeschler, Balestra, & Backes-Gellner, 2018). For these reasons, weak invariance was accepted, and structural invariance (i.e., whether the structural model is the same across freshmen and seniors) was tested. Model comparison between the weak and structural invariance models was statistically significant, Δχ2(8) = 37.74, p < .001, though differences between model fit indices were miniscule (e.g., ΔCFI = .001). Therefore, structural invariance was not accepted, and differences between the structural models of freshmen and seniors were compared. The largest difference between freshmen and seniors was that the path from social skills to GPA was significant for seniors but not for freshmen, whereas the pathway from academic mindsets to learning strategies was significant for freshmen but not for seniors. Furthermore, academic perseverance was weakly negatively related to GPA for seniors but not significantly related to GPA for freshmen.
Parent Education
Both configural and weak invariance were accepted. Model comparison between the weak and structural models was statistically significant, Δχ2(16) = 32.02, p = .010; however, differences between model fit indices were small (e.g., ΔRMSEA = .001). Most of the differences between the groups reflected that more pathways were significant for students whose parents attended at least some college than for students whose parents did not graduate high school and students whose parents did graduate high school.
FRPL
Both configural and weak invariance were accepted. Model comparison between the weak and structural was statistically significant, Δχ2(8) = 20.28, p = .012; however, there were no differences between model fit indices (e.g., ΔCFI = .000). The largest differences between groups were that the paths from social skills and learning strategies to GPA as well as from academic mindsets to learning strategies were statistically significant for students receiving FRPL but not statistically significant for students not receiving FRPL.
Race/Ethnicity
Given the small sample sizes of Asian (n = 132), Black (n = 105), and White (n = 90) students with full data, Hispanic and non-Hispanic youth were instead compared. Both configural and weak invariance were accepted. Model comparison between the weak and structural models was statistically significant, Δχ2(24) = 39.17, p = .026; however, there were no differences between model fit indices (e.g., ΔCFI = .000 and ΔRMSEA = .000). Although structural invariance is assumed, comparisons of the structural pathways in the structural models suggest that more pathways were significant for Hispanic compared with non-Hispanic students; however, the relationships from mindsets to GPA and social skills, as well as the pathway from learning strategies to perseverance, were larger for non-Hispanic students.
Discussion
This study aimed to test the model put forth by the researchers at CCSR on how noncognitive factors relate to academic performance among adolescents. Building from the DST framework, multiple analyses were conducted using a minority youth population and a variety of measures to examine the validity of the CCSR hypothesized model and to explore interactions among its variables across multiple groups. It is important to test the model in as many situations as possible to refute the notion that noncognitive factors do not affect academic performance. For this reason, this study included tests of multiple group differences with an understudied population.
The overall variance explained by the model was 6.3%. This small effect size is unsurprising given the literature indicating that large sample sizes are needed to detect small to moderate effects of noncognitive factors (Jones & Bouffard, 2012; Sisk et al., 2018; Yeager et al., 2018). This albeit small effect is meaningful in that small changes in academic performance can have large effects on later life success (e.g., college and career attainment and success, physical and mental health; Cutler & Lleras-Muney, 2006; Day & Newburger, 2002) and small interventions can have meaningful changes for students (e.g., growth mindset and academic performance; Yeager et al., 2018; Yeager & Walton, 2011). Moreover, these small effect sizes can sometimes be the tipping point for students to find pathways to success, particularly among traditionally marginalized students.
Overall, we found partial support for the pathways within the CCSR hypothesized model; academic mindsets, social skills, and learning strategies were significant predictors of academic performance. We failed to find support for academic perseverance predicting academic performance in the context of the other statistically significant noncognitive factors, which is in line with other studies examining the association between academic perseverance and academic outcomes (Credé et al., 2017; Farruggia et al., 2016). The pathways from academic mindsets to each of the noncognitive factors (i.e., social skills, academic perseverance, and learning strategies) were statistically significant. Academic mindsets stands out as a particularly important predictor of academic performance and each of the other noncognitive factors. Furthermore, academic mindsets comprised the only consistently significant factor for students across backgrounds. Together, these results suggest that academic mindsets deserve greater attention from researchers and practitioners.
The CCSR model also describes a feedback loop from academic performance to future academic mindsets, such that noncognitive skills and academic performance both affect and are affected by one another. Additionally, student GPA is often highly contingent upon previous GPA the year or even multiple years prior. To account for this feedback loop, a second model was tested in which previous GPA was included as a predictor of both academic mindsets and current GPA. Previous academic performance explained roughly 50% of the variance in current academic performance. Furthermore, by adding previ-ous GPA to the model, the pathways from social skills, academic perseverance, and learning strategies to final GPA became nonsignificant. These results support the feedback loop represented in the CCSR model, in that they both mutually influence one another. Specifically, some of the variance in GPA may consist of both cognitive and noncognitive factors; therefore, previous GPA may be accounting for some of the variance that might have been explained by the noncognitive factors.
As mentioned earlier, little research to date has closely examined group difference factors of noncognitive skills in relation to academic performance. DST suggests the importance of examining group and individual differences in developmental outcomes and processes, not only due to the effects of contextual factors but also how the individual’s experiences of those contextual factors interact with their contexts (García Coll et al., 1996; Lerner & Castellino, 2002; Lerner et al., 2011; Spencer et al., 1997). One meta-analysis on grit and another on growth mindset have highlighted the point that more research on group differences is needed (Credé et al., 2017; Sisk et al., 2018). Group comparisons have the potential to pinpoint the mechanisms underlying differences found. To understand group differences more fully, our analyses included grade, parental education level, income level, and race/ethnicity. While there is a dearth of research to draw from to develop explanations for those differences, we discuss a few potential implications.
First, when examining group differences by grade, we found that the pathways from the noncognitive factors to final GPA were stronger for seniors than freshmen, and the pathways from growth mindset to the other noncognitive factors were stronger for freshmen than seniors. Given that GPA was a cumulative high school measure and freshmen only had a year in high school at this point, this suggests that cumulative GPA is not simply an indicator of intelligence or academic performance but also comprises noncognitive factors. Furthermore, we found support for a cyclical relationship between noncognitive factors and academic performance, which is reflected in the CCSR model. In fact, when we controlled for previous GPA, many of these relationships between the noncognitive factors and GPA disappeared, further suggesting that GPA is a reflection of noncognitive factors due to shared variance. It could also mean that more noncognitive factors are important at later adolescence when students are beginning to think about their post-high school prospects such as college (Nagaoka, Farrington, Ehrlich, & Heath, 2015). However, these differences may reflect a cohort effect given that GPA was defined slightly differently for the freshman and senior cohorts. Future longitudinal research with the freshman sample will better determine whether these differences are due to cohort differences or adolescent development.
We also examined two proxies of SES: parent education and FRPL. For parent education, more noncognitive factors were related to GPA for students whose parents attended at least some college. The R2 value was also larger for those students whose parents attended at least some college. Only mindsets predict GPA and perseverance for students with parents who have less than a high school degree. Social skills and learning strategies were more important predictors of GPA for students who receive FRPL, but mindsets was a strong predictor of GPA for students who did not receive FRPL. The R2 was much stronger for students who did not receive FRPL. While we see a similar pattern in effect size for the two indicators of SES, there were more significant pathways for the lower SES students when using FRPL status as an indicator. These somewhat discrepant findings may provide some clarification as to why there have been mixed findings in the literature when taking into account SES in the school context; for instance, some studies have shown students with lower SES have fewer internal and external assets to begin with yet show greater growth in developing those assets than their more affluent peers (Thompson, Corsello, McReynolds, & Conklin-Powers, 2013). However, these findings are also limited due to the smaller sample size of students who did not qualify for FRPL. Further research on low-SES youth could illuminate the reason for the differences found.
Last, when examining group differences by race/ethnicity, there were differences in the relationship between noncognitive factors and GPA, for Hispanic students compared with other ethnic and racial identities; the pathways from mindsets to learning strategies and social skills to GPA were particularly important for Hispanic adolescents compared with other racial/ethnic identities. These differences indicate that various noncognitive factors may have differing impacts on students with different backgrounds. Further study is warranted to inform a more nuanced and evidence-based approach for practitioners to facilitate the development of noncognitive factors among diverse student populations. On the other hand, mindsets were consistently predictive of GPA regardless of racial/ethnic identity; therefore, mindsets may be an important construct for practitioners to target more universally. Further research with larger samples of a wide range of subgroups is needed due to the great differences in sample sizes in this study (i.e., large Hispanic population and smaller Asian, Black, and White populations) before strong conclusions can be made.
Surprisingly, there was a significant negative pathway from academic perseverance to GPA for senior students, highly educated parents of students, and non-Hispanic students. This suggests that perseverance plays an important role in predicting GPA after controlling for other noncognitive factors. Specifically, although perseverance is positively correlated with GPA, the part of perseverance that is independent of the other noncognitive factors is negatively correlated with GPA. It could also be interpreted that students with lower scores on noncognitive factors and lower GPA require higher perseverance to improve GPA levels. Another interpretation may suggest that these populations are more susceptible to disengagement or “school burnout” (Salmela-Aro, 2015; Salmela-Aro, Kiuru, Pietikäinen, & Jokela, 2008) as has been found in some studies, and this school burnout may decrease students’ motivation or ability to persevere academically (Bask & Salmela-Aro, 2013). The findings may suggest a dark side to perseverance, in that when students fail to get the results they had hoped for, they become disengaged and feel worse about themselves (Boyce, Wood, & Brown, 2010). Taken together, these findings regarding group differences indicate there are some pathways that are stronger for some groups than others. This study provides the basis to build future research and practice on the pathways among noncognitive factors and GPA, while accounting for group differences. Future directions of research examining group differences may wish to consider the following: (a) Do noncognitive factors affect minority students in similar ways to majority students? and (b) Are the measures of noncognitive factors culturally sensitive to minority populations?
Limitations
Several limitations warrant mention. First, a major limitation of this study was the absence of academic behaviors in the model. The literature and CCSR model suggest that academic behaviors serve as a mediator from those noncognitive factors to academic performance. Therefore, by not including academic behaviors, that indirect relationship could not be detected for each of the noncognitive factors and academic performance, and a direct relationship was tested instead. Future studies should include academic behaviors to identify their role with noncognitive factors and academic performance.
Second, the study made use of existing district survey data. Therefore, constructs included in the study were based on data availability; this is why contextual classroom variables as suggested by DST and academic behaviors as suggested by the Farrington model were not accounted for in our analyses. Many of the measures employed in the study were reduced due to concern over the length of the survey causing survey fatigue with participants. Furthermore, our measure of social skills does not completely align with the definition provided by Farrington et al. (2012). Moreover, there is some overlap of constructs in operational definitions presented in the model. In addition, each of the factors is multidimensional; therefore, future studies should consider measures that account for all the dimensions. Future studies should also examine the effectiveness of the model with other operationalizations and measurements of the different noncognitive factors. This study utilized overall weighted cumulative GPA as the operational definition of academic performance; future studies could look at other types of academic performance, such as standardized state test scores, SAT/ACT scores, and/or grades in specific courses (e.g., academic courses like ELA [English language arts] and math).
Furthermore, the noncognitive variables tested in this study explained a low percentage of variance in academic performance. This may be due to testing noncognitive factors generally rather than in the academic domain specifically. Future research should examine domain-specific measures of noncognitive factors when testing the CCSR model. Finally, the study included no distinct measures of cognitive skills, which are undeniably important for academic performance. Future research should include cognitive and noncognitive skills together, not to pit them against each other but rather to account for the contributions of each and their potential interactions.
Third, this study was cross-sectional at the level of the noncognitive factors; students were only surveyed once regarding noncognitive factors, and thus causality cannot be ascertained within the noncognitive factors. SEM models, with arrows included, may suggest causality; however, despite the inclusion of arrows to test the directionality assumed from the CCSR model, this study cannot ascertain causal relationships, particularly among the noncognitive predictors. However, academic performance data were collected both before and after collection of the noncognitive data. Furthermore, future waves of data collection, planned with the freshman cohort (as juniors and as seniors), will allow for longitudinal studies to examine growth in noncognitive factors and the relationship between growth in noncognitive factors and changes in academic performance.
Last, this study examined a predominantly low-income and Hispanic population. Although this population is understudied in terms of noncognitive factors, this restricts comparisons to higher income and non-Hispanic populations. Examining the CCSR model in a sample more representative of the U.S. adolescent population would allow for stronger group comparisons.
Conclusion
Group differences, like culture and contextualized identity factors, may be important to take into account when considering for whom these relationships among noncognitive factors and academic performance matter. As schools implement noncognitive accountability measures as part of the Every Student Succeeds Act, researchers and practitioners need to be sure they fully understand the implications and impact of noncognitive factors on students’ academic performance and particularly with respect to individual and group differences. For practitioners to be able to apply these findings, it is important to study these factors together, with different measures and populations. It is also important to understand their interactions and to identify which noncognitive factors perform best while considering the other factors. Our findings indicate growth mindset as particularly important with this population because it affects not only academic performance as measured by GPA but also all of the three other noncognitive factors in the model—social skills, academic perseverance, and learning strategies.
Although the findings from this study indicate noncognitive factors contribute to academic performance above and beyond previous GPA, caution is warranted in drawing conclusions. Even when including previous GPA in the model, a lot of the variance in academic performance, approximately 44%, is not accounted for in the model. This could include contextual factors and domain-specific factors as previously discussed. We need to better understand the missing factors that contribute to academic performance to best support student success. This study demonstrates that noncognitive factors have an important role to play in students’ academic success and finds that group difference factors are associated with the nature and strength of those relationships. Therefore, it behooves researchers and practitioners to consider and investigate group differences in engaging noncognitive factors as a strategy to advance academic success for students.
Footnotes
Appendix A
Appendix B
Appendix C
Notes
Authors
DANA WANZER is an assistant professor of psychology in evaluation research at University of Wisconsin–Stout. Her research is on evaluation practice and she conducts evaluations with youth programs, including afterschool programs, STEM education curriculum, and college access programs.
ELYSE POSTLEWAITE is a doctoral student of positive developmental psychology at Claremont Graduate University. Her research focuses on understanding the processes and mechanisms that facilitate optimal development for the whole child from birth to emerging adulthood in the classroom.
NAZANIN ZARGARPOUR is a core faculty member of the Claremont Evaluation Center, in the School of Social Science, Policy and Evaluation, at Claremont Graduate University. Her research spans three interrelated areas: the role of socioemotional learning competencies as mediators of academic attainment for low income; effective strategies for youth psychosocial development; and high-impact strategies for intersegmental, pipeline collaboration for youth success.