
Abstract
Efforts to improve teachers’ knowledge and to change the nature of curriculum materials have dominated mathematics reforms since the late 1990s. In this article, we compared middle school teachers’ mathematical knowledge for teaching (MKT) and curriculum use between 2005 and 2016 to assess progress toward these key goals. We found teachers’ MKT increased an amount equal to the average teacher in the 2005 sample improving five percentile points. However, No Child Left Behind’s attempts to encourage mathematics degrees in this population do not explain this increase, as teachers were less likely in 2016 than in 2005 to possess such a degree. Instead, our data are consistent with schools hiring more knowledgeable individuals during the Great Recession. Between surveys, the strength of the association between teacher MKT and student demographic characteristics decreased, although equity gaps still persist. Finally, our data suggest a modest movement toward standards-based curriculum materials over this period.
The past two decades have seen two major efforts to improve mathematics teacher and teaching quality. In the first, reformers sought to improve teachers’ subject matter knowledge by requiring secondary mathematics teachers to possess a stronger mathematical background, by providing professional development focused on mathematics, and by reducing barriers to teaching in order to attract more qualified candidates. As part of this first effort, reformers also hoped to improve the distribution of teacher knowledge across student populations by ensuring that low-income students and students of color have equal access to qualified teachers. In the second major effort, reformers sought to improve instructional quality through learning standards, beginning with state-based reforms in the 1990s and continuing through the widespread adoption of the Common Core State Standards in the 2010s. As part of this second effort, states and districts sought to align instruction to these standards, often by encouraging teachers to use standards-based curriculum materials.
To date, however, few studies have assessed whether reformers’ goals have been met. To this end, we administered surveys to a nationally representative sample of middle school mathematics teachers, a major target of reformer’s efforts, in the years 2005 and 2016. Both surveys assessed key indicators targeted by policies and programs, including teachers’ mathematical knowledge for teaching (MKT), educational background, and use of curriculum materials. While we cannot attribute observed changes to specific policies, these data allow us to track progress on reformers’ goals after over a decade of effort.
Background
U.S. students generally perform poorly in mathematics, with only 34% of eighth graders scoring at or above proficiency on the most recent National Assessment of Educational Progress (NAEP) administration (NAEP, 2017). Many trace lackluster student performance in part to U.S. policies and practices surrounding teacher and instructional quality. For instance, cross-national studies suggest that U.S. primary and lower secondary teachers are weaker in content knowledge than comparable teachers in European and Pacific Rim countries (Ma, 1999; Schmidt, Houang, & Cogan, 2011). These studies also suggest that compared with our developed-nation peers, U.S. mathematics lessons are characterized by more routine problems, more emphasis on procedures (vs. sensemaking and disciplinary justification), and the use of simpler rather than complex procedures for solving problems (Hiebert et al., 2005). Finally, scholars have noted that other countries more equitably distribute qualified teachers across high– and low–socioeconomic status (SES) student populations (Akiba, LeTendre, & Scribner, 2007). In the United States, low-income, majority-non-White schools are far more likely than their affluent counterparts to be staffed by uncertified, less prepared, and less knowledgeable teachers (Lankford, Loeb, & Wyckoff, 2002; Rahman, Fox, Ikoma, & Gray, 2017).
This evidence, as well as domestic studies that revealed similar problems with mathematics teacher knowledge, instruction, and curriculum (e.g., Borko et al., 1992; Kulm, 1999), led U.S. policy makers toward two significant efforts to improve teacher and teaching quality in mathematics. We review these efforts below.
Teacher Subject Matter Knowledge
Several provisions of the No Child Left Behind act (NCLB) aimed to improve teachers’ subject matter knowledge, particularly at the secondary level. NCLB’s “Highly Qualified Teacher” (HQT) regulations required all secondary teachers of core subjects to either (a) obtain a subject matter major, minor, or its equivalent in college credits or (b) demonstrate competency in the subject by passing a rigorous exam. NCLB legislation also required localities to take steps to ensure that low-income students and students of color were not disproportionately exposed to underqualified teachers. However, NCLB compliance was slow, many states took advantage of regulatory loopholes (Loeb & Miller, 2006), and HQT requirements were ultimately replaced by stricter teacher evaluation systems as states applied for NCLB waivers during the period 2010–2012 (Ayers, 2011). Yet new mathematics teachers entering the profession between the mid-2000s and the early 2010s would likely have faced stiffer requirements regarding their mathematics background and knowledge.
NCLB also funded significant amounts of professional development intended to improve teachers’ subject matter knowledge. In Title II’s Math-Science Partnerships (MSPs), and in similar competitive grant programs funded by the National Science Foundation, mathematicians and teacher educators designed content-specific learning opportunities for teachers, including sessions that involved mathematical problem solving, investigations, and lectures. These efforts were wide in scope; over the program’s 2002–2015 implementation period, federal disbursements to states totaled just under $2 billion, and in 2006, roughly half of a nationally representative sample of middle school mathematics teachers reported attending one of the MSP programs in the prior year (Hill, 2011).
Finally, NCLB contained provisions meant to confer its “highly qualified” status on graduates of alternative teacher certification programs. These programs, designed to allow teacher candidates to circumvent university-based teacher preparation programs and thus expedite entry into the profession, first appeared as a policy reform in the mid-1980s, when a majority of states passed authorizing legislation in response to concerns over teacher quality and ongoing teacher shortages (Cornett, 1990). Over the years, economists and others have argued that alternative certification may enable better-prepared, more productive individuals to enter teaching (e.g., Hanushek, 2003).
Curriculum Quality
A second strand of reform focused on improving classroom instruction via new standards, assessments, and related curriculum materials. Standards specify the topics to be taught at each grade level and, in the case of some states, suggest preferred instructional techniques for doing so. In mathematics, prior to 2010, many state standards followed professional standards published by the National Council of Teachers of Mathematics in 1989 and updated in 2000 (see Schmidt, Wang, & McKnight, 2005; Woodward, 2004). After 2010, a majority of states adopted the Common Core State Standards in Mathematics (CCSS-M) either wholesale or, as political resistance developed, with relatively minor revisions (Achieve, 2017). The CCSS-M feature a narrower set of topics for each grade than many prior state standards and establish modestly higher expectations for student cognitive demand, including proficiency in mathematical practices such as reasoning, argument, and precision (Porter, McMaken, Hwang, & Yang, 2011). Throughout this period, assessments and accountability linked to standards provided incentives for schools and teachers to attend to the new instructional guidance.
Standards can affect instructional quality through both curriculum materials and professional development (Smith & O’Day, 1990), and reformers used both avenues to support their work. In the case of professional development, most states and districts offered programming tied to new standards (Rentner & Kober, 2014); however, such programming trailed off in some locations over time as priorities shifted (M. O’Neil, personal communication, May 3, 2019). Curriculum materials comprise a more durable investment for reformers because such materials can remain stable in the midst of teacher turnover and shifting district and state priorities and because curriculum materials have the potential to reach a wide number of teachers. Curriculum materials also provide teachers with daily, ongoing standards implementation strategies as opposed to the more limited contacts professional development offers.
Thus, policy makers and reformers invested in developing standards-based curriculum materials, beginning with short “replacement units” in California in the early 1990s and extending to National Science Foundation–funded curriculum materials development (e.g., Connected Mathematics), as standards-based reforms became national in scope (Senk & Thompson, 2003). After the release of the CCSS-M, New York state funded the creation of a Common Core–aligned, open access curriculum series called EngageNY, now published as Eureka Math. Online resources for implementing the Common Core also appeared, both in the form of videos intended for use in classrooms and repositories through which teachers share lesson materials. Often, teachers and districts select these and other curriculum materials as part of their plan for moving instruction toward the Common Core or similar standards.
Tracking Trends in Teacher Knowledge and Curriculum Materials
This article first examines whether teacher knowledge changed after the implementation of the NCLB HQT requirements. Two prior studies have tracked incoming, though not practicing, teachers’ knowledge. A study by Goldhaber and Walch (2014) estimated teachers’ relative rank among college graduates entering professions and found that teachers’ average SAT scores rose from the 42nd percentile in 2000 to the 50th percentile in 2008. Lankford, Loeb, McEachin, Miller, and Wyckoff (2014) found a similar trend in New York state, fueled by more top-tercile SAT-takers entering teaching. The latter report also demonstrated a more equitable distribution of teacher SAT scores across New York’s poorest and wealthiest schools; a roughly 0.5 standard deviation (SD) gap observed prior to 2000 narrowed to only about one fifth of a standard deviation after 2010. This improvement appears driven by a noticeable increase in the SAT scores of teachers working in the poorest schools—a significant finding given the quite marked inequities identified in past studies (Loeb & Reininger, 2004; National Science Board, 2014).
Lankford and colleagues (2014) linked the New York improvements in teacher quality to specific policies, including the elimination of emergency certification in New York City and NCLB’s HQT requirements, which took effect in that state in 2005. Goldhaber and Walch (2014), however, traced the improved quality of new teachers to larger changes in the economy, arguing that the 2008 recession may have made teaching a relatively more attractive option to talented individuals. An analysis by Nagler, Piopiunik, and West (2015) tends to support the latter theory; Florida teachers who began their careers during a recession had significantly stronger student achievement gains than teachers who began their careers during periods of economic growth.
Similarly, the timing of a sharp increase in cut scores on ETS’s middle school mathematics PRAXIS assessment, used for teacher certification in many states, also supports the idea that the teaching talent pool changed after the 2008 recession. In 2007, the year NCLB’s HQT provisions were to take full effect, the 33 states using this exam had an average passing score of 148, with a range from 137 (Kansas) to 161 (Connecticut). Beginning in the early 2010s, however, states raised cut scores (Amy, 2018; D. Gitomer, personal communication, October, 2014) such that by 2015, the average passing score was 164, and 23 of the 27 states using the middle school PRAXIS assessment had a cut score of 165. Although PRAXIS cut scores may not signify exactly the same level of knowledge across years, this increase is substantial and would likely swamp any overtime drift in score meaning. The timing of the increase suggests that the recession and related changes in labor markets, rather than NCLB legislation, enabled more uniform, higher standards.
This article also examines whether MKT differs between graduates of alternative- and traditional-route teacher education programs. While prior research demonstrates that alternative-route secondary mathematics teachers generally perform similarly to (for local programs, see Clark et al., 2013; Kane, Rockoff, & Staiger, 2008; Sass, 2011) or slightly better than (for Teach for America, see Clark et al., 2013; Henry et al., 2010; Kane et al., 2008) traditionally prepared teachers in terms of student achievement outcomes, less is known about those groups’ average underlying characteristics, such as their mathematical knowledge.
Finally, this article provides evidence on teachers’ use of standards-based curriculum materials. National surveys prior to the Common Core revealed strong teacher use of textbooks, with conventional texts supplied by four major publishers (Addison Wesley, Houghton Mifflin, Harcourt Brace, and McGraw-Hill) holding more than 60% of the market and standards-based curricula holding less than 20% (Horizon Research, 2002). In the immediate years after the publication of the Common Core, districts delayed purchasing new textbooks while waiting for publishers to revise materials to meet the new standards, and teachers began using online resources to supplement their existing textbooks, often at the behest of district leaders (Davis, Choppin, Roth McDuffie, & Drake 2013). The release of new, Common Core–aligned curriculum materials in the following years may have changed these patterns, however.
In sum, the literature thus far suggests that entering teachers’ knowledge may have improved since the early 2000s, that the gap in teacher knowledge across schools may have narrowed, and that teachers’ use of mathematics textbooks has changed over time. Missing from the literature, however, is a nationally representative survey of in-service teacher mathematical knowledge using a measure, unlike the SAT, that is designed to capture the specific knowledge used in teaching, and which positively predicts children’s classroom experiences and outcomes (Ball, Thames, & Phelps, 2008; Hill, Kapitula, & Umland 2011; Hill, Rowan, & Ball, 2005). Also missing is a comprehensive examination of the extent to which standards-based textbook series have reached teachers, as standards promoters originally thought necessary for their reforms to flourish, particularly after the Common Core adoption. Finally, the wide gaps in teacher knowledge across schools serving different student populations create a need to understand changes in those gaps over time. With these issues in mind, three research questions guided our work:
Research Question 1: To what extent did teachers’ MKT change between the 2005 and 2016 samples? Can any observed changes be linked to the teacher characteristics targeted by NCLB?
Research Question 2: Has the distribution of teacher MKT become more equitable with regard to student SES and race over this time period?
Research Question 3: Do teachers report greater use of standards-based curriculum materials over this time period?
This article does not directly address teaching quality. It does, however, address indicators linked to policy makers’ theory of action throughout the past decade—that is, that instructional improvement will come about via better prepared, more knowledgeable teachers using standards-based curriculum materials.
Method
To conduct the study, we collected data from nationally representative samples of middle school mathematics teachers in 2005 and 2016. Middle school mathematics teachers were among those teachers targeted by NCLB and other improvement efforts, as only 60% of such teachers held a degree with a mathematics major or minor in 2005 (Hill, 2007). We describe the samples, measures, and analytic methods below.
Sample and Administration
In 2005 and 2016, we followed similar procedures to obtain respondents: sampling schools from the National Center for Education Statistics (NCES) Common Core Data (CCD), rostering teachers within schools, then mailing surveys and inviting teacher completion. For details about the 2005 sample and administration, please see Hill et al. (2008); we provide more in-depth details about 2016 here, noting any divergences from the 2005 protocol.
In 2016, we began by selecting a nationally representative sample of schools from the 2012–2013 NCES CCD. The target population was all currently operating public schools that had at least 10 students in either sixth and seventh grades or seventh and eighth grades. The sampling frame of 24,270 schools was then stratified by region, and 1,822 schools were selected at random with probability proportional to their size. We constructed rosters of mathematics teachers in Grades 6 through 8 by gathering names and contact information from school websites and through phone calls; we obtained rosters from 1,583 schools, or 87% of the original sample. Within these schools, we selected a single teacher at random to participate. If the initial selected teacher refused or did not complete the survey, another teacher was selected when available. In only 70 schools did this alternate teacher complete the survey. Overall, we obtained 916 completed surveys—a teacher for 57.8% of all rostered schools or 50.2% of all selected schools—between December 2015 and June 2016. As in 2005, we weighted the achieved sample to account for nonresponse from both schools and teachers. In 2016, respondents were 69% female and 83% White—similar to the 2005 sample, which was 71% female and 86% White.
Similar to other survey researchers (e.g., Czajka & Beyler, 2016; Kohut, Keeter, Doherty, Dimock, & Christian, 2012), we experienced a marked decline in response rate between 2005 and 2016. In 2005, we achieved a 64% response rate (636 teachers) with three questionnaire mailings, a reminder postcard, and a modest incentive; in 2016, we achieved a 41.4% response rate with the same procedures. To secure more responses in 2016, we instituted three updates to our recruitment procedures. First, we sampled within-school replacement teachers, as described above, to maintain geographic and demographic representativeness. Second, we phoned teachers to remind them to participate. Third, we created two online versions of the survey instrument, one identical to the full paper survey and one much shorter. The long and short online versions improved our response rate, with 63 individuals (or 4%) of our original sample of 1,583 responding to the long online version and 197 (or 12.4%) responding to the short online version. Total, 7% of the final 636 respondents completed the long online form, and 22% completed the short online form.
Although our 2016 strategy and response rate differed from that of 2005, recent research suggests that lower response rates do not necessarily result in nonrepresentative samples (for an overview, see Johnson & Wislar, 2012). Furthermore, we examined our sample for possible biases introduced by nonresponse. Out of our 16 sampling strata, only northeast cities and midwestern towns had significantly higher and lower response rates (respectively) than typical. Our nonresponse weights account for this regional variation. Second, we attended to the temporal aspect of nonresponse. If later responders had had lower MKT, we might have worried that the likelihood of a survey response was conditioned on MKT; this appeared not to be the case, as there were no systematic differences in scores by the number of days elapsed prior to the survey response. We did, however, identify a mode effect: Short-form online survey takers scored 0.14 SD lower on the MKT metric than those who completed the paper version. Because individuals who completed the short form were on average less experienced, less likely to be teaching accelerated mathematics courses, and less likely to hold a math major or minor—all predictors of teacher MKT in our 2005 sample—it is possible the mode effect reflects true variability among participants in the study. We assessed the sensitivity of our main findings to the inclusion of the online respondents and found that MKT differences between the two time points either remained the same or become larger and more statistically significant when we exclude short-form takers. Due to the low response rate to the paper-and-pencil survey, we include online survey respondents in our preferred estimates.
Measures
Mathematical Knowledge for Teaching
The MKT instrument captures teachers’ knowledge of mathematics relevant for teaching, rather than their knowledge of high school or college mathematics (e.g., calculus, trigonometry, differential equations) or their pure mathematical aptitude or skill (Ball et al., 2008). Specifically, the MKT instrument measures teachers’ common content knowledge—that is, knowledge of the mathematics in grade-level standards—as well as teachers’ specialized content knowledge, meaning knowledge that is purely content based but unique to teaching (e.g., alternative solution methods, diagrams or manipulatives that represent content, mathematical explanations, the best examples for specific content). Prior publications describe both the composition of this assessment as well as validity work that shows that teachers’ scores generally correlate with classroom practice and student outcomes (Hill, 2007, 2011; Hill et al., 2005; Hill et al., 2008). To measure MKT in 2016, we used a subset of the items fielded in 2005, deleting items that provided little information in that year. Total, there were 36 stems (problem situations) covering number, operations, and algebra on the 2005 questionnaire; the 2016 survey contained 27 stems and 68 items. To construct the short online form, we selected a subset of items (11 stems, 39 items) with the strongest item discrimination parameters and a range of difficulties. While the middle school MKT items were never publicly released, they have been used to evaluate teacher professional learning experiences, meaning some teachers may have seen the items in their preservice coursework or in-service professional development. We discuss this possibility below.
Curriculum Materials
On a 2006 follow-up survey with the 2005 sample (see Hill, 2011, for details), we listed eight common middle school mathematics textbooks and asked teachers to indicate whether they used them; this 2006 item also allowed teachers to write in the name of a textbook not on our list. In 2016, the landscape of curriculum materials had transformed dramatically (Remillard & Reinke, 2017). For this reason, we developed two new curriculum questions. One item asked about the types of lesson materials (e.g., textbooks, websites, district/state/charter materials) used by teachers. The second asked teachers to write in the title and publisher of their three most-used curriculum resources for their most-often-taught class.
Experience and Background
Our survey contained items asking teachers about their pathways into teaching, their math methods and content courses, whether they had a postsecondary math major or minor, the number of years they had taught, and the grade levels at which they had taught.
Data Reduction, Scoring, and Analysis
We began by conducting an exploratory factor analysis on the 2016 MKT data. Past work has found some evidence of multidimensionality in MKT data (Hill, Schilling, & Ball, 2004); an analysis of the 2005 data, however, returned multiple yet uninterpretable factors and strong correlations between hypothesized subscales (Hill, 2007). The 2016 data revealed largely the same story: while some indices suggested two factors, the second factor comprised only one item, and a one-factor solution fit the data adequately but not perfectly (χ2 = 0.00; SRMSR (standardized root mean square residual) = 0.05; RMSEA (root mean square error of approximation) < 0.01; TLI (Tucker-Lewis index) = 0.662). For simplicity, then, we constructed single scales from both the 2005 and 2016 data. For both time points, we transformed one stem with multiple items and strong interdependencies between them into a single ordinal item for scoring.
To compare scores from different administrations of the MKT, we conducted mean/sigma equating (Marco, 1977). This procedure requires first scoring each test independently using item response theory methods. Then, using the 2005 item parameters as anchors, we mapped the 2015 item parameter to the 2005 scale. A plot of 2005 as compared with 2016 item difficulties indicated that the 2016 respondents answered MKT items correctly more often than 2005 respondents. Nevertheless, the item difficulties generally remained in the same position relative to one another, indicating that the items collectively performed similarly for both groups. As a result, a simple linear transformation was sufficient to link the 2015 item parameters to the anchor items from 2005. The one-item exception to this rule was omitted from scoring for both 2005 and 2016.
To assess the nature of the curriculum materials listed by teachers in the open-ended survey item, we identified and examined sample lessons provided by publishers. In total, we were able to characterize the materials used by 99% of teachers in the 2016 sample. For each sampled material, we retrieved and examined five or more lessons, preferring lessons on core mathematical topics (operations with rational numbers, proportional reasoning) where available. With this limited sample of lessons, we did not attempt to determine alignment of the content to the Common Core (e.g., coverage of fractions or algebra) at each grade level; however, we did examine lessons for the methods used to teach content (e.g., amount of teacher-led instruction) as well as the amount of student participation in mathematical practices, such as making arguments, evaluating conjectures, and solving nonroutine problems. Most textbooks followed a standard pattern, with very little variability across lessons. We created a binary measure to capture whether the materials asked students to engage in student exploration and/or mathematical practices (standards-based = 1), or whether the materials suggested a more direct-instruction format, with fewer opportunities for students to think and reason (standards-based = 0). Only one author conducted this work; however, she is an experienced mathematics educator familiar with analyzing curriculum (Charalambous & Hill, 2012). We also checked our categorizations with other published work, as described below, and with an executive in the publishing industry. A full list of titles and publishers, as well as the coding, are available on request.
To verify our categorization, we checked our coding against Polikoff (2015), who evaluated the cognitive demand of elementary versions of some of the textbook series we examined. The four series in common (Saxon Math, GoMath, enVision, and MathConnects) were scored by both Polikoff and our project as featuring low cognitive demand and thus as misaligned with current standards. Examples of standards-based materials in our sample included Connected Math, Core Connections, Everyday Mathematics, and EngageNY/Eureka.
Finally, we used the NCES CCD to link school demographic characteristics to each teacher in our sample. The CCD includes school-level information on student enrollment, student demographics, geographic location, and free and reduced-price lunch (FRPL) eligibility. Because the CCD contained missing data for some schools in some years, we linked teachers to schools using the nearest year available.
Results
Change in MKT Between Samples
Our analysis reveals that middle school mathematics teacher MKT improved by 0.14 SD on the 2005 scale (see Table 1). This difference is statistically and substantively significant, equivalent to the average teacher in the 2005 sample improving by 5 percentile points. Figure 1 shows the distribution of MKT scores at both time periods for our nationally representative samples. Not only is the average MKT score higher for 2016 teachers, but the newer sample contained significantly fewer low-MKT teachers. Specifically, while there was almost no change in the percentage of teachers who scored 1 SD or more above average, there was a 55% reduction in the percentage of teachers who scored 1 SD below the mean (19.3% in 2006 vs. 10.9% in 2016). Overall, there was less variation among MKT in the 2016 sample compared with the 2006 sample.

Density of scores across administrations.
Sample Characteristics

Note. Columns 2 and 3 present weighted sample averages with standard deviations in parentheses. Column 4 reports results from a weighted two-sample t test with standard errors in parentheses. MKT = mathematical knowledge for teaching.
Math major, math minor, and graduate math degree data were collected through the 2006 follow-up survey.
p < .10. **p < .05. ***p < .01.
Next, we investigated whether NCLB’s teacher quality policies could have supported this overall change in MKT. We found that despite NCLB’s focus on ensuring adequate subject matter background, middle school teachers in 2016 possessed fewer mathematics-specific degrees than in 2005 (60% vs. 38%), a trend which mirrors data from other national surveys (Baldi, Catharine, & Tadler, 2015; Lewis, Parsad, Carey, Bartfai, & Farris, 1999). We also examined whether individuals with characteristics that positively predicted teachers’ MKT in 2005 (see Table 2), including years of experience, mathematical background, a high school teaching background, and high school teaching credential, 1 were more prevalent in the 2016 data set. In fact, 2016 teachers had on average one fewer year of experience, and while the fraction of middle school teachers with previous high school teaching experience remained unchanged, fewer teachers held high school teaching credentials (41% in 2016 vs. 48% in 2005) and more held K–4 credentials (64% in 2016 vs. 52% in 2005).
Relationships Between Teacher Characteristics and MKT Scores
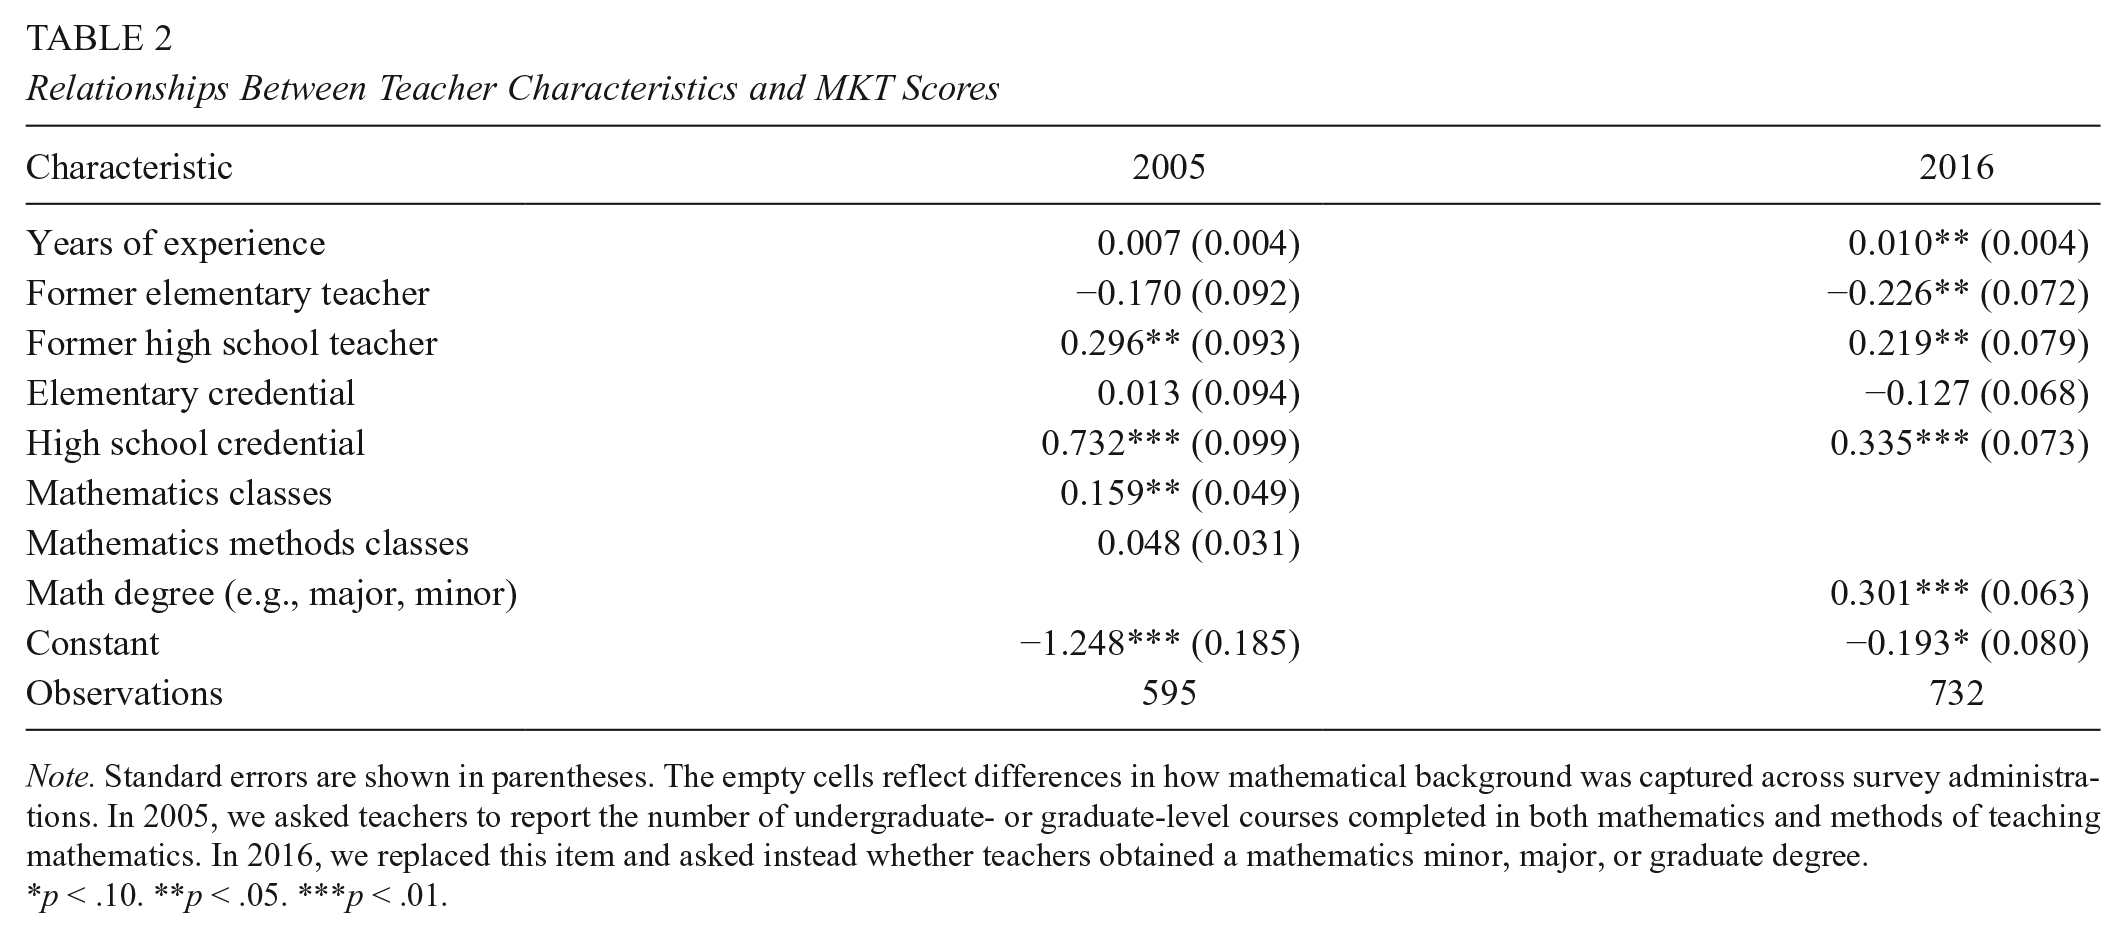
Note. Standard errors are shown in parentheses. The empty cells reflect differences in how mathematical background was captured across survey administrations. In 2005, we asked teachers to report the number of undergraduate- or graduate-level courses completed in both mathematics and methods of teaching mathematics. In 2016, we replaced this item and asked instead whether teachers obtained a mathematics minor, major, or graduate degree.
p < .10. **p < .05. ***p < .01.
These changes in middle school mathematics teacher educational background run counter to what one would expect, given the improvement in MKT scores. Thus, at best, the compositional changes we observed in the workforce cannot explain the increase in MKT scores; at worst, these compositional changes may have acted to depress the MKT levels of the sample overall. In fact, had the composition of the middle school mathematics workforce remained unchanged between 2005 and 2016, we predict MKT would have risen an additional 0.15 SD. 2
Given these findings, the improvement we observed in MKT seems puzzling. One possibility is that alternative- and emergency-certified teachers, perhaps including a disproportionate number of talented individuals who wished to bypass traditional teacher certification, could be more numerous in the 2016 data set. We did not ask about preparation pathways on the 2005 survey; however, NCES School and Staffing Survey data from 2007 to 2008 indicate that about 13% of all middle school teachers entered the profession through a fast track, including state, district, and university alternative certification programs (NCES, 2014). In 2016, 78% of our sample reported entering teaching through a college preparatory route, 12% through an alternative certification pathway, 6% without any formal training at all, and 4% through another pathway. In our 2016 sample, alternatively certified teachers did not have stronger MKT than traditionally certified teachers, and teachers without formal training scored significantly below both groups (Table 3). Although an increase in the number of alternatively certified teachers could have meant schools could be more selective in hiring traditional-route teachers, the lack of a differential in MKT score suggests that it is unlikely that the increase in alternatively certified teachers drove the increase in teacher MKT.
MKT Scores by Certification Type (2016)

Note. The reference category is traditionally trained teachers. This model does not include other controls. MKT = mathematical knowledge for teaching.
p < .05. **p < .01. ***p < .001.
Another possibility is that newer hires who remain in teaching (and thus appear in our sample) may have stronger MKT. We arrived at this possibility after graphing MKT by years of experience (Figure 2) for both the 2005 and 2016 samples and noting that newer teachers showed significantly stronger performance on the MKT in 2016. Specifically, Figure 2 shows that middle school mathematics teachers with less than 10 years of experience in 2005 had an average score of −0.28, almost 0.2 SD lower than the typical teacher that year. In contrast, middle school mathematics teachers with less than 10 years of experience in 2016 had an average score of 0.016, much closer to the overall average of 0.075 for that year. At both time points, teachers with 10 or more years of experience had scores that were similar across time and significantly higher than the average (0.18 SD above average). We can also use this figure to shed light on whether stronger NCLB certification requirements led to stronger subject matter preparation; if this were the case, we would expect to see a noticeable uptick in average MKT for teachers with between 4 and 8 years of experience in the 2016 data. However, no such uptick was apparent. Thus, highly experienced middle school mathematics teachers retain a small MKT advantage in both years, but new teachers in 2016 appear more knowledgeable than those in 2005.
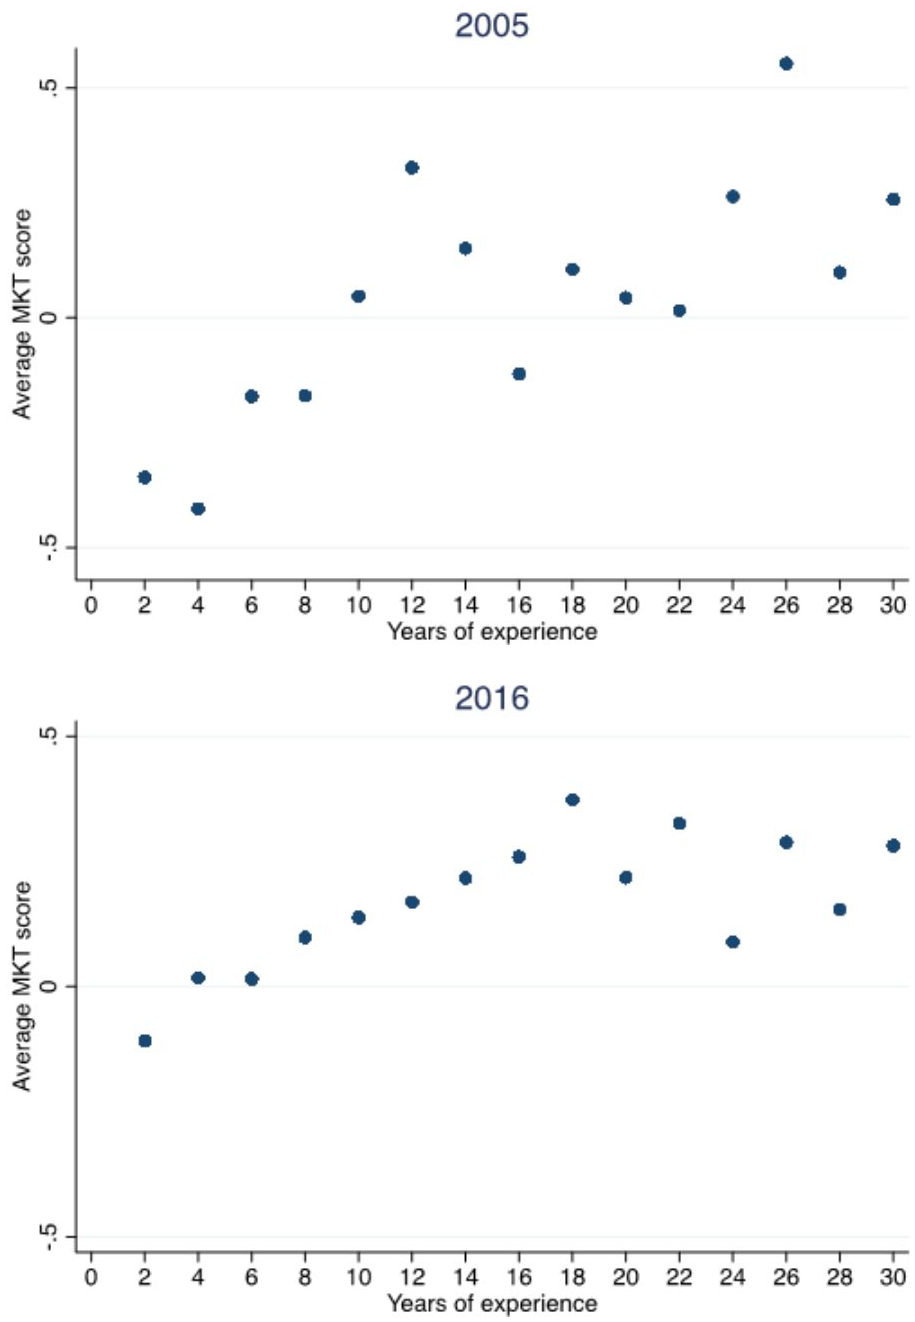
Teacher years of experience by MKT score, 2005 and 2016, binned in 2-year increments.
One final possibility is that teachers may have seen and remembered the MKT items from past professional learning experiences, artificially inflating MKT scores. Though 27% of teachers who took the 2016 survey indicated they had either taken these items before or were not sure whether they had taken these items before, these teachers scored slightly lower than teachers who indicated taking the items for the first time (difference = −0.088, p = .19).
Distribution of Teacher Knowledge
Table 4 shows that although middle school mathematics teachers’ MKT improved in all types of schools, change was not uniform. First, teacher MKT in urban and rural schools improved far more than teacher MKT in suburban schools. Second, teacher MKT in schools where more than half of the students were either African American or Latinx increased over two and a half times more than teacher MKT in schools where more than half of students were White. Finally, MKT levels in schools that serve relatively few FRPL-eligible students grew negligibly (0.04 SD), while MKT levels in schools in the three highest FRPL quintiles grew substantially (0.36 SD, 0.24 SD, and 0.27 SD, respectively; see Figure 3). Although these trends are encouraging, middle school mathematics teachers working in schools serving the poorest families still averaged a 0.6 SD lower on MKT than teachers working in schools serving the most affluent. Thus, gaps have narrowed in the past decade, but they remain far from closed.
MKT Scores by School Demographics

Note. Columns show the average MKT score of teachers who work in the named type of school. Schools categorized by the National Center for Education Statistics’ Common Core of Data. Ns represent sample size for 2005 and 2016 administrations. Standard deviations are shown below means in italics. MKT = mathematical knowledge for teaching.
p < .05. **p < .01. ***p < .001.

Teacher MKT scores, by student population.
Teacher Curriculum Use
Our survey revealed that middle school mathematics teachers relied less heavily on textbooks in 2016 than in 2006 (see Table 5). Specifically, nearly one fifth of 2016 teachers (19%) reported that they never used a published textbook to teach their focal class; this number is double our estimated upper bound for the number of individuals who did not use a textbook in 2006 (i.e., 10% of teachers did not list a textbook in 2006). 3 In 2016, another 29% said they only “sometimes” used a published text. Instead, 2016 teachers reported wide use of materials created with colleagues, materials they created from scratch, published supplemental materials (e.g., units or lessons from Math Solutions), and materials obtained from other teachers, including from web repositories like BetterLesson. Materials produced by governance organizations, such as states or charter networks, were also popular. Three quarters (76%) of 2016 teachers used materials from these organizations, and all but 8% used released items from district, state, or other assessments. Eighty percent of 2016 teachers also reported “sometimes” or “often” using online content videos, such as those available at Khan Academy. In 2016, in other words, many teachers acted as their own curriculum designers, piecing together lessons from multiple sources to construct students’ mathematical experiences.
Sources of Lesson Materials (2016)

Note. NCTM = National Council of Teachers of Mathematics.
We found moderate growth in the use of standards-based textbooks over this time period. Among teachers reporting that they did use a textbook in 2016, roughly one fifth (19%) used at least one standards-based textbook. In comparison, 8% of teachers in 2006 reported using a standards-based textbook. Our analysis also reveals that the market for textbooks has changed substantially since the first survey. Table 6 lists the 10 most commonly reported texts in 2006, including two write-in texts, Glencoe and Holt; Table 7 lists the 10 most commonly reported materials in 2016. A comparison of the tables reveals considerable reorganization within the middle school curriculum space, including several acquisitions and mergers (e.g., Pearson purchased Prentice Hall) and the appearance of new reform curricula and publishers.
Top 10 Most Reported Curriculum Materials, Grouped by Publisher (2006)

Top 10 Most Reported Curriculum Materials (2016)

Note. The percentage column refers to the percentage of teachers responding to the item (n = 442) who reported using the named text. For 2016, we combined Go Math and Big Ideas because both were owned by Houghton Mifflin Harcourt at the time of the survey and because the original survey asked only about Houghton Mifflin, not specific textbook titles.
Discussion and Conclusion
Our data suggest a modest positive change of 0.14 SD in middle school mathematics teacher MKT between the two time points, despite declines in the fraction of this population with formal mathematics training. Had the mathematical training in this population remained fixed, we predict that we would have observed an additional 0.15 increase in the average MKT score. This suggests that NCLB did not achieve its goal of attracting more mathematics majors and minors into middle school teaching but that teacher knowledge rose nonetheless. In contrast, our data suggest that NCLB’s goal of alleviating inequality in the distribution of teacher knowledge across student populations has been partially met, in large part because MKT levels in higher poverty middle schools improved markedly.
We argue that labor market changes may account for much of these gains. For instance, we saw stronger MKT among middle school mathematics teachers hired during and after the Great Recession (with roughly 0–8 years of experience, in Figure 2) and strong gains in MKT among medium- to high-poverty schools, where mathematics teacher shortages had been the most severe. These patterns are consistent with other evidence, including the arrival of stringent PRAXIS cut scores after 2010, several years after NCLB took full effect but in the midst of an upswing in applicants to teacher education programs and alternative certification pathways (Sawchuk, 2016). They are also consistent with analyses by Goldhaber and Walch (2014) and Nagler et al. (2015), which observed either improvements in the SAT scores of incoming teachers or improvements in average value-added scores among teachers during recessionary periods, including that of 2008.
We cannot rule out other alternative hypotheses with the data available. For instance, preservice training may be more focused on improving MKT in 2016 than in 2005. However, we cannot evaluate this hypothesis because preservice coursework is poorly documented over time. Nevertheless, because curricular changes tend to be implemented gradually, we consider changes in preservice coursework to be an unlikely candidate explanation for the relatively sharp discontinuity observed in new teacher performance and the narrowing MKT gap between more and less affluent schools.
Our survey further suggests that middle school mathematics teachers’ use of standards-based materials rose from 8% in 2006 to 19% in 2016, a substantial movement toward more cognitively demanding texts. We also noted that one in five teachers in the 2016 sample reported not using a major textbook at all, instead relying on materials from the internet and other sources. In contrast, only 10% of the 2006 sample did not identify a textbook they used.
Middle school mathematics teachers thus use textbooks more sparingly than before. It is difficult, however, to imagine teachers successfully constructing a coherent curriculum from resources found on the internet (for a similar argument, see Remillard & Reinke, 2017). An inspection of lessons on Pinterest and similar sites, as well as analyses of teachers’ use of supplemental materials more generally (Hill et al., 2008), suggest internet lessons may lack support for high-quality teaching. In particular, they may lack mathematical explanations to support teachers’ content knowledge, information about how students might learn the mathematics, and connections between the activity and the underlying mathematics. Furthermore, the internet appears rife with mathematical misdefinitions and oversimpifications, 4 allowing for errors to enter teachers’ classrooms.
Finally, we observed that though there remain strong inequalities in the distribution of middle school mathematics teacher MKT, these inequalities narrowed between surveys. These improvements, as also seen in Lankford et al.’s (2014) analysis, appear to come from improved MKT in the lowest SES schools. Future research should investigate the mechanism by which these improvements occurred—for example, whether high-quality alternative certification programs replaced very weak teachers in urban districts, whether those districts had larger hiring pools as a result of the recession, or whether urban districts reformed their hiring process to draw higher quality candidates away from suburban schools. Continuing this trend is critically important to U.S. education.
The news that middle school mathematics teacher quality appears to respond to labor market changes, rather than well-targeted policy, may be discouraging for many, for it does not suggest solutions under the control of teacher educators and policy makers. Understanding more about the influx of higher quality teachers—for example, whether it was driven by recent college graduates who failed to find jobs in other sectors, or by college graduates estimating wage differentials between teaching and other sectors—would help identify new policy targets. For instance, if the former is true, reducing the “costs” of becoming a teacher—even during strong labor markets—may be the best avenue for attracting talent to this particular grade band and subject matter. If the latter, support for stronger teacher wages may prove a better avenue for improvement. In either case, we argue that understanding the gains made during the Great Recession is critically important, and policy makers should actively seek ways to retain this progress.
Footnotes
Acknowledgements
This material is based on work supported by the National Science Foundation under Grant #1417731. Any opinions, findings, conclusions, or recommendations expressed in this material are those of the authors and do not necessarily reflect the views of the National Science Foundation. The authors would like to thank Barb Gilbert, Dan McGinn, Catherine McClellan, and Sophie Houston for their assistance with the article.
Notes
Authors
HEATHER C. HILL is the Jerome T. Murphy Professor in Education at the Harvard Graduate School of Education. She studies policies and programs designed to improve teacher and teaching quality.
VIRGINIA LOVISON is a PhD student and Partnering in Education Research fellow at the Harvard Graduate School of Education. She studies the economics of education with a focus on K–12 teacher quality.
THOMAS KELLEY-KEMPLE is a doctoral student at the Harvard Graduate School of Education. He studies policies and programs designed to improve school and teacher quality.