
Abstract
Colleges and universities increasingly rely on their websites to recruit students and convey information about tuition and costs of attendance. Given evidence of growing complexity in institutional tuition policies and cost-setting practices, the study examined how institutions’ websites present financial information to the public. Through content analysis of website data from 50 public colleges and universities, researchers sought to characterize patterns in the scope and quality of tuition information on institutional websites and to understand how these patterns might influence individuals’ conceptions of tuition and costs. The findings point to variation in informational quality across dimensions ranging from clarity of language use and terminology, to consistency and coherence of visual displays, which accompany navigational challenges stemming from information fragmentation and discontinuity across pages. Implications for research and improved institutional practice are discussed.
In today’s crowded higher education marketplace, colleges and universities rely heavily on their websites to recruit students and convey information about tuition and costs of attendance. In fact, according to the 2018 State of College Admission report by the National Association for College Admission Counseling, institutional websites are the “primary means by which colleges recruit first time freshmen, transfer students, and international students” (Clinedinst & Patel, 2018, p. 3). And while prior studies have illustrated that students and their families are often inadequately informed about college prices and financial aid (Grodsky & Jones, 2007; Hillman, Gast, & George-Jackson, 2015; Horn, Chen, & Chapman, 2003; Scott-Clayton, 2012; Velez, Horn, & Christopher, 2018), we know very little about how information delivery, through institutions’ webpages or other sources, may shape the ways students engage with financial information (Venegas, 2006).
More generally, the cost of a college education and concerns regarding affordability remain among the most vexing problems for students, families, and policy makers. For decades, researchers have been examining the factors that drive cost increases in higher education (see, e.g., Baumol’s 1967 writings on the Cost Disease and Bowen’s 1980 Revenue Theory of Costs), as well as the effects on students of tuition increases (Heller, 1997; Hemelt & Marcotte, 2011), financial aid strategies (Bettinger, 2004; DesJardins & McCall, 2010), and state-level aid programs (Delaney & Doyle, 2011; Doyle, 2006). The larger context surrounding these research efforts, and one of the catalysts for continued interest, has been the steady increase in the tuition and fees associated with attending a college or university (Ma, Baum, Pender, & Welch, 2017).
Numerous studies have examined relationships between tuition costs and student behavior in higher education. This literature has established that students decide to enroll and persist in college by comparing expected benefits and costs, based on the information available to them (Bettinger, 2004; DesJardins & Toutkoushian, 2005; Hearn & Longanecker, 1985; Hemelt & Marcotte, 2011; Hossler, Schmit, & Vesper, 1999; Leslie & Brinkman, 1997). Studies have also shown that when information is not clearly presented, efficiency in decision making deteriorates (Hearn & Longanecker, 1985; Perna, 2000, 2006b).
While a sizable body of research has examined the influence of tuition costs and financial aid on student decision making, little attention has been paid to the ways institutions disclose cost information to the public. Given the increasing reliance of students and their families on internet-based information sources in college decision making, along with the growing complexity of higher education systems and tuition policies (Poutré, Rorison, & Voight, 2017; Smerek, 2010; Wolniak, George, & Nelson, 2019), this gap in the knowledge base is problematic. Questions of equity and access also arise from findings which show that underrepresented students face disproportionate challenges in navigating informational resources such as guidebooks, websites, and search engines (Baum & Ma, 2014; Bergerson, 2009; Perna, Lundy-Wagner, Yee, Brill, & Teran, 2011).
Finally, though regulations issued by the federal government have—for nearly a decade—required colleges and universities to publish estimated costs of attendance (in the form of net price calculators), a recent study by Perna, Wright-Kim, and Jiang (in press) found inconsistency in institutional compliance with these requirements, as well as major limitations affecting the usability of cost calculators. As their work highlights, the accuracy of college cost information has serious implications for postsecondary enrollment and attainment, particularly for first-generation and low-income students. With the present study, we begin to address critical knowledge gaps by focusing specifically on the ways institutions package and present their financial information to the public, and by providing a necessary first step toward improving how institutions communicate complex tuition and cost information.
The Study
The purpose of this study is to examine how tuition and cost information is conveyed through the websites of public colleges and universities in the United States, to inform institutional practice, and to pave the way for future research on how information delivery may affect prospective students and families who are interested in researching and comparing higher education options. We aim to facilitate a better understanding of how institutional approaches to communicating tuition and costs may affect financial comprehension by identifying key challenges associated with how information is presented to the public.
The study was designed to advance two interrelated objectives. The first objective focuses on identifying and characterizing dimensions of variation in the quality of information presented on institutional websites. The second objective considers the implications of varied information quality on individuals’ search experiences. These objectives are reframed in terms of the following questions:
Along what dimensions does the quality of tuition and cost information presented on institutional websites vary?
How do variations in information quality shape user search experiences and conceptions of tuition and costs?
Why Information Matters
Key perspectives guiding this study are human capital theory and the related theory of demand, an important application of consumer choice theory and the fundamental economic concept that establishes the relationship between price (i.e., tuition) and quantity demand (i.e., enrollment) (e.g., DesJardins & Bell, 2006; Toutkoushian & Paulsen, 2016). Demand theory states that, all other factors being equal, as the price of a good or service increases, the quantity demanded by consumers will decrease. Applied to higher education, demand theory explains the anticipated negative relationship between tuition and enrollment, which has been empirically established through numerous studies (e.g., Allen & Wolniak, 2019; Dynarski, 2000, 2003; Hemelt & Marcotte, 2011; Kane, 1995; Leslie & Brinkman, 1987). The prevailing assumption underlying this relationship stems from human capital theory, which holds that students behave rationally in making their postsecondary choices by accounting for anticipated lifetime benefits (monetary and nonmonetary) as well as the projected costs (direct and indirect) of attaining a degree (Becker, 1993).
Even when consumers behave rationally, a barrier to optimal decision making occurs when the information available to buyers and sellers is asymmetric and/or imperfect. Asymmetric and imperfect information represents a situation in which the parties involved in an economic transaction possess unequal or imperfect amounts of information, which increases the likelihood for suboptimal decision making (Varian, 1992). Organizations like the Federal Trade Commission’s Bureau of Consumer Protection exist, in part, to monitor and limit the extent to which information about marketed products and services is inaccurate or misleading, in order to protect consumers. Altman (2012), for example, bridges information from behavioral economics and financial literacy to portray how financial education and other interventions may improve financial decision making.
A valuable extension of human capital theory that is particularly germane to the current study is Perna’s (2006b) work. In extending her conceptual model of college student choice, which highlights the nested nature of the college choice process (see Perna, 2006a), Perna argues that differences in the acquisition and use of information about college costs and financial aid are critical for understanding racial/ethnic and socioeconomic group differences in college enrollment. Other researchers have similarly reasoned that students from underrepresented minority and lower socioeconomic backgrounds are more sensitive to increases in tuition, potentially due to greater concern for relying on loans to pay for college (Boatman, Evans, & Soliz, 2017; Callendar & Jackson, 2005; Paulsen & St. John, 2002).
Prior research does not indicate if, or to what extent, students change their enrollment decisions because they are unaware of or misunderstand the associated tuition and costs. However, reports have demonstrated that high school students and their families generally lack accurate or complete information about college costs and financial aid (Grodsky & Jones, 2007; Hillman et al., 2015; Velez et al., 2018). It stands to reason that students’ postsecondary decision making suffers if barriers exist for accessing information on tuition and educational costs. To date, researchers have not examined the ways in which such information is communicated by institutions, or if institutional approaches to communicating introduce challenges accessing or interpreting the information. In other words, one of the central tenets within human capital theory when applied to higher education decision making—that students behave rationally based on the information available—has not been examined in terms of the quality of tuition and cost information presented by institutions.
Understanding Information Quality
Perna (2006b) has stated that “higher education institutions are positioned to play a central role in the transfer of information about college costs and financial aid to students and their families” (p. 1626), noting the potential benefits of large-scale initiatives that direct students to institutional websites (at the time the article was written, the College Promise Program served as a key example; see Ikenberry & Hartle, 2000). Extending this work, Perna and colleagues have recently engaged in a descriptive analysis of net price calculators found on institutional websites to assess how colleges and universities are communicating information to students about college costs (Perna et al., 2019). Preliminary results illustrate the variation that exists in the usability of information provided by net price calculators and point to the concerning practices among institutions in not complying with federal mandates in ways that ultimately deteriorate one’s ability to make informed comparisons.
Other studies specifically focused on information distributed by higher education institutions have examined college viewbooks and websites (Ford & Patterson, 2019; Hartley & Morphew, 2008; Saichaie & Morphew, 2014; Venegas, 2006). For example, grounded by the competing public and private purposes of higher education (e.g., Abowitz, 2008; Labaree, 1997; Slaughter & Rhoades, 2004), Saichaie and Morphew (2014) conducted a content analysis of 12 higher education institutions’ websites to raise concerns about the apparent overemphasis of institutional messaging toward credentialing and vocational purposes of higher education, at the expense of conveying learning-, citizenship-, and democratic-based goals. The authors suggest that such messaging may lead students to enter college without understanding the rigors or fundamental goals of a college education. Ford and Patterson (2019) also examined website content to explore how institutions present content related to student–body diversity. Examining screenshots from 128 colleges and universities, the authors reasoned that institutions strategically represent data through practices of omission, aggregation, and addition to promote positive images of ethnoracial diversity on their campuses that mask underlying challenges associated with the success of underrepresented college students.
In addition, Venegas (2006) drew from a cultural ecological model focused on numerous environmental influences (e.g., educational, familial, community; see Tierney & Venegas, 2009) to examine the ways in which low-income high school students access and utilize informational resources. Through a combination of focus groups and case studies, Venegas (2006) explored students’ critiques of their experiences navigating financial aid websites. The findings suggest that low-income students are challenged by a lack of access to the kinds of instrumental knowledge needed to successfully navigate financial aid processes through online resources. Importantly, none of these studies assessed higher education websites based on the accessibility, clarity, or consistency of information presented, limiting their implications for improved practice.
To further guide our thinking on how information is communicated through institutional websites, we refer to information and communication technology studies. For example, Loiacono, Watson, and Goodhue (2007) sought to measure how consumers evaluate websites in the context of e-commerce. Drawing on the theory of reasoned action (Fishbein & Ajzen, 1975) and the technology acceptance model (Davis, 1989; Venkatesh, 2000), Loiacono et al. (2007) suggest that the effectiveness of websites is determined, in part, by a combination of user beliefs about a site’s usefulness in gathering information and the site’s ease of use.
Other studies have similarly identified key aspects of information quality (Batini & Scannapieco, 2016; Katerattanakul & Siau, 1999; Wang & Strong, 1996). From these studies, we identify three key dimensions. First, based on the work of Wang and Strong (1996), is representational quality, which refers to interpretability of information, as defined by the appropriateness of language for a given audience, the clarity of data, and representational consistency of information. Second, Katerattanakul and Siau (1999) present contextual quality as encompassing the applicability, or relevance, of information to the target audience, the completeness of data presented, and the suitability of information quantity. And third, Batini and Scannapieco (2016) point to accessibility as the availability of information and ease of data retrieval by the target user, given their physical and sensorial abilities, and the technologies available. These three dimensions—representational quality, contextual quality, and accessibility—lend conceptual clarity to broader notions of the accessibility and accuracy of higher education institutions’ tuition and cost information.
Method
The study involved the collection and analysis of website content from a sample of 50 public 4-year colleges and universities. Using procedures consistent with qualitative content analysis, we engaged in iterative cycles of data sampling, coding, and categorization (Elo & Kyngäs, 2007). As a method that facilitates the systematic examination of visual and textual data, content analysis is particularly well aligned with researching the meanings and messages conveyed by content on college and university websites, which serve as a primary means of communication and marketing to prospective consumers (Clinedinst & Patel, 2018; Poock & Lefond, 2001), and affords flexibility in the development and use of inductive coding frames in cases where existing theory or empirical knowledge are thin (Schreier, 2012).
Data collection began with a field scan of 10 institutional websites that facilitated the structuring and definition of a preliminary coding frame, as well as piloting of a semistructured search protocol. Principal data collection began shortly thereafter and encompassed systematic documentation, coding, and comparison of artifactual data from 50 additional institutions. Data collection was conducted by the study’s authors and three trained research assistants (hereafter referred to as “the research team”). Consistent with the workflow of qualitative content analysis (Schreier, 2012), visual and textual data were divided into codable segments and evaluated according to a coding frame that we organized to reflect the information search process of a hypothetical prospective student. Figure 1 outlines our research activities by phase, which we describe in greater detail below.
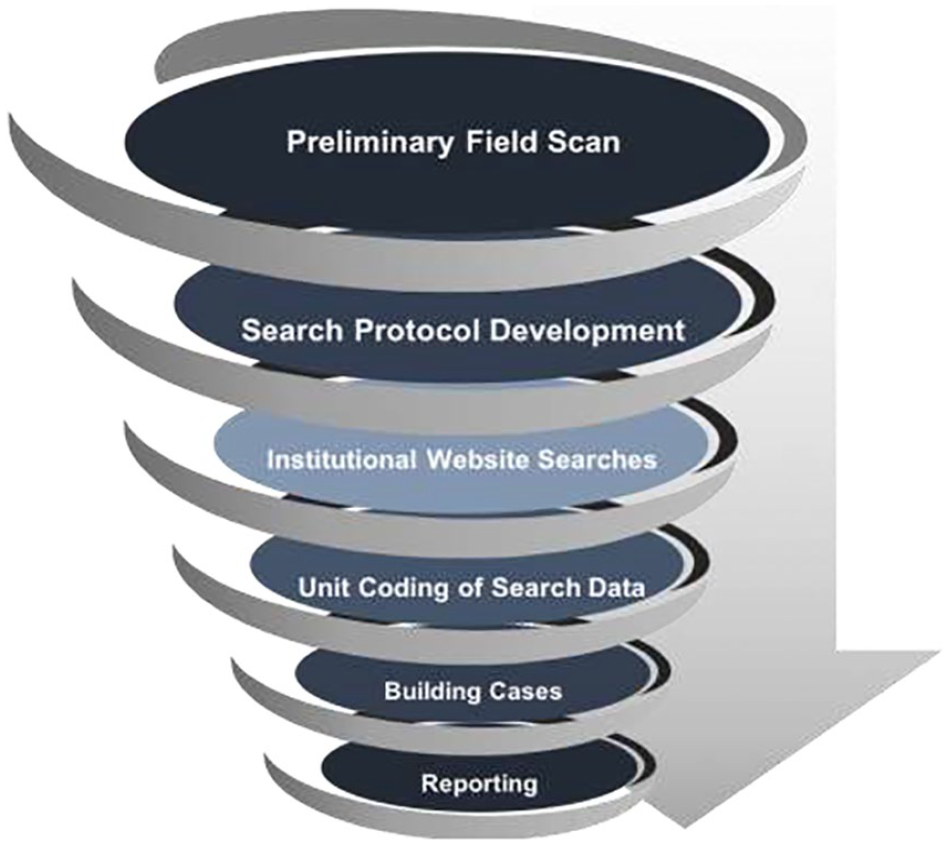
Study chronology and research activities cycle.
Field Scan and Search Protocol Development
We began by surveying the websites of 10 public undergraduate-serving institutions to identify common structural features, navigation tools, and content presentation strategies associated with tuition and cost information. These 10 institutions were randomly selected from a list of all 4-year public colleges and universities in the United States contained in the 2017 Integrated Postsecondary Education Data System. In the first phase of the field scan, we utilized screen capture tools to record visual and textual evidence from detailed searches for tuition and cost information on the websites of five institutions. Descriptive qualitative methods were used to catalogue and cluster these artifacts into concept-driven categories (Schreier, 2012). In addition to systematic description of the content presented on each of the webpages, we examined the material through an inductive lens, focusing on the symbolic meaning communicated in the design and placement of visual and textual data (Blanco Ramirez, 2016).
The research team went on to label, define, and operationalize emergent categories, noting useful indicators of each based on patterns we observed across sites. For each of the websites, members of the research team conducted independent comparisons of the segments (e.g., codable units that emerged from the inherent structure of the material) and descriptions applied to the content (Maxwell & Miller, 2008). Discussions and side-by-side comparisons of these doubly coded data yielded preliminary conceptual categories (Milian, 2017).
Once the team reached consensus around data segmentation strategies and preliminary categories, we developed a semistructured search protocol to systematically collect evidence of published tuition and cost information from websites of the remaining five institutions, with at least two team members assigned to code each page. We examined the results of this trial coding cycle to check for interrater consistency and evaluate the validity of the categories in the coding frame (Barbour, 2014). Researchers drafted analytic memos throughout the coding process, which were reviewed by the entire team, and we met frequently to review and resolve coding inconsistencies. In rare cases where inconsistencies could not be resolved, the team assigned a third person to collect and code data, which was then compared and discussed to achieve consensus.
Following minor revisions to the coding frame and search protocol, the team utilized the same approach to collect and analyze material for the full sample of 50 institutions. The structure of the final protocol (see Appendix A) elicited descriptions of the navigational decisions and actions, procedural evidence (i.e., screenshots), and evaluative commentary for each stage in the guided search for tuition and cost information. We also employed standardized enrollment parameters (Appendix B) to ensure that calculations conducted manually, and by using embedded net price calculator tools, were based on identical information across sites.
Institutional Sample
The sample consisted of 50 institutions randomly selected from the overall population of public 4-year institutions and was largely representative based on a set of institutional profile characteristics. After first defining our sampling frame to include all public, 4-year colleges and universities, we used a random number generator to identify 50 institutions, where each member of the target population (i.e., each institution in the sampling frame) had an equal probability of being selected. We repeated this process three times and evaluated each random sample according to representation across the following broad dimensions commonly used to characterize colleges and universities: Carnegie classification, undergraduate enrollments, historically Black college or university (HBCU) classification, and regional distribution. The sample ultimately used for data collection and analysis was the one that most closely mirrored the nation as whole across these dimensions.
Specifically, based on 2017 Integrated Postsecondary Education Data System data, for both the overall population and our selected institutions, the largest share of institutions had Carnegie classifications of “Masters Colleges and Universities” (34% nationally vs. 42% of sampled institutions), had doctoral degrees as their highest level of offering (49% nationally vs. 54% of sampled institutions), and had undergraduate enrollments within the 1,000 to 9,999 range (53% nationally vs. 52% of sampled institutions). Furthermore, the share of HBCUs in our sample closely mirrored the overall population (5% nationally vs. 6% of sampled institutions). In terms of the regional distribution, our sample was most concentrated in the Southeast (32%) and least concentrated in the Rocky Mountain region (4%), somewhat reflecting the national distribution, in which the largest share of public 4-year institutions is in the Southeast region (25%) and the smallest share is in the Rocky Mountain region (5%). Table 1 presents the sample characteristics relative to the full U.S. population of public 4-year colleges and universities.
Characteristics of Institutional Sample Versus All Public 4-Year Colleges and Universities
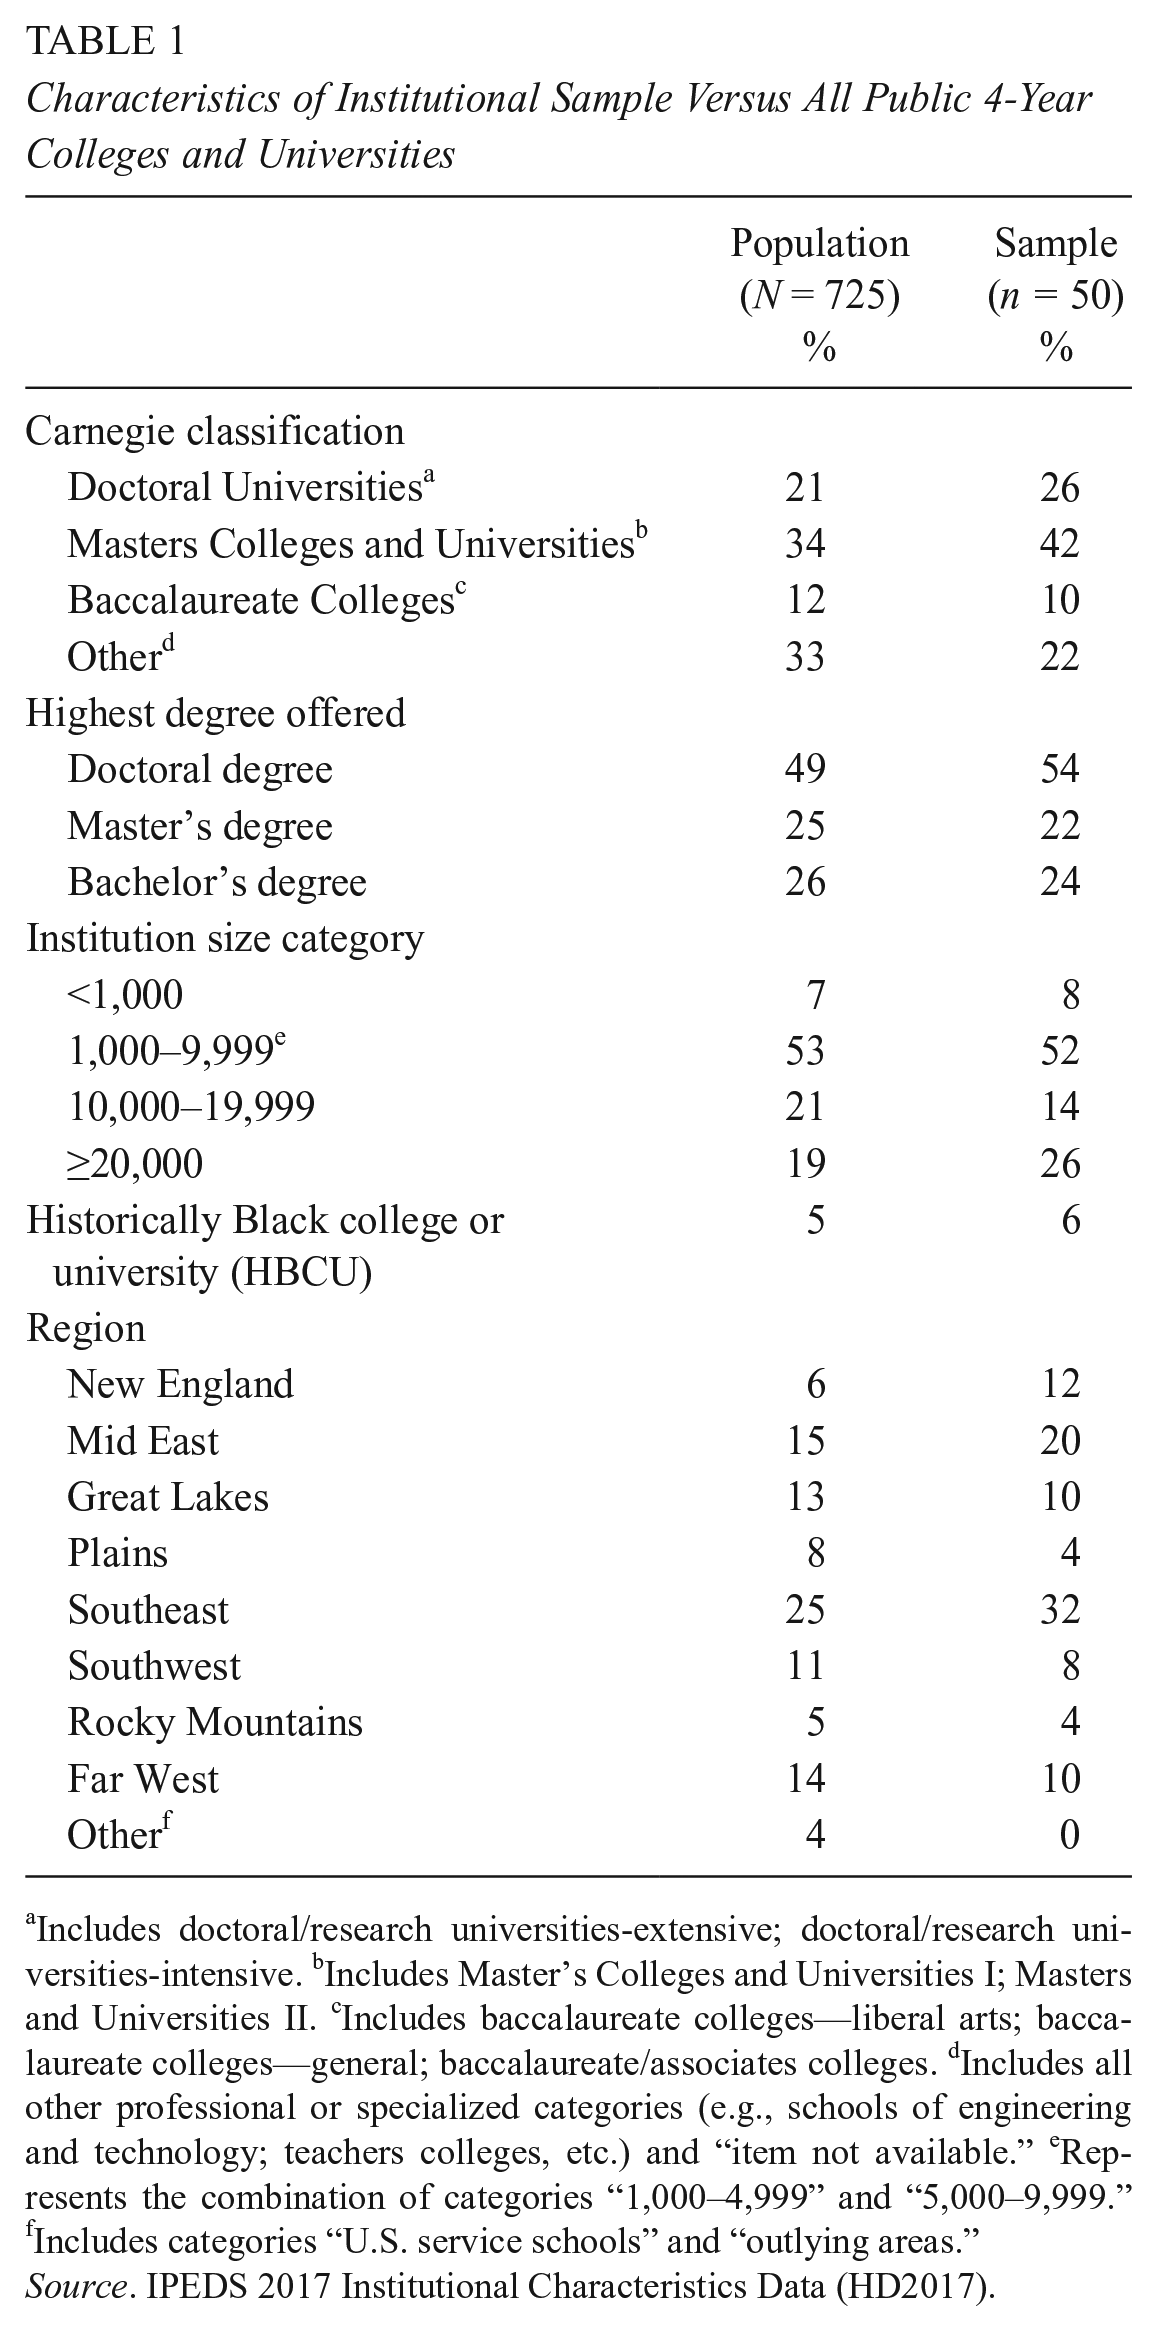
Includes doctoral/research universities-extensive; doctoral/research universities-intensive. bIncludes Master’s Colleges and Universities I; Masters and Universities II. cIncludes baccalaureate colleges—liberal arts; baccalaureate colleges—general; baccalaureate/associates colleges. dIncludes all other professional or specialized categories (e.g., schools of engineering and technology; teachers colleges, etc.) and “item not available.” eRepresents the combination of categories “1,000–4,999” and “5,000–9,999.” fIncludes categories “U.S. service schools” and “outlying areas.”
Source. IPEDS 2017 Institutional Characteristics Data (HD2017).
Data Collection
Following sample selection, we employed the search protocol to collect artefactual, process-oriented data, including detailed descriptive accounts of information searches and screenshot images of published page views from the websites of the 50-institution sample. For each institution, members of the research team were randomly assigned one of three defined undergraduate student profiles that corresponded to different programs of study (i.e., academic majors) and enrollment years (e.g., freshman, senior), to facilitate comparisons across institutions (Table 2) given that tuition and fees often vary by students’ major and year (Wolniak et al., 2019). Principal data collection occurred between October 2017 and May 2018, with confirmatory and supplemental information gathering continuing until August 2018.
Student Enrollment Profiles

To reduce the likelihood of ordering effects (based on the sequence of searches by enrollment profile), the order of three profiles employed for each institution was randomly assigned (Shaughnessy, Zechmeister, & Zechmeister, 2006) to members of the research team. Notably, observations from our initial field scan of 10 institutions highlighted evidence of variation in the representation (i.e., the visual placement and appearance) of tuition and fee information by academic program and enrollment year within individual institutions. To account for this variation, two researchers were assigned to collect data for each school’s website, using different enrollment profiles. In cases where the first analyst’s search yielded no evidence of variation in tuition or fees based on differing student enrollment profile, the analyst exercised discretion in determining whether subsequent searches were warranted. In all, 90 independent searches were conducted by the research team, across 50 institutions’ webpages. In addition to following the search protocol, reflective memos captured observations and insights derived throughout data collection.
Analysis
Our next phase involved analysis of the search protocol data. We developed a coding summary form to condense data from researchers’ narrative descriptions, interpretative commentary, and observations into frequency counts. Completed search protocols were independently reviewed by a lead member of the research team (i.e., not the researcher who had conducted the original search), who used a summary form to reduce the coded information and corroborate evidence supporting each of the observations. In cases where the reviewer could not readily ascertain whether the data had been accurately coded, they returned to the database of more than 2,000 screenshots, organized by institution, to locate confirmatory evidence.
We used these summaries of coded data to corroborate the salience of theoretically derived dimensions of information quality, including clarity, accessibility, and coherence. We also used the forms to synthesize information about specific website features—such as menus, cost summary tables, and data visualization displays—noting the frequency and outcomes of research team members’ engagement with these navigational tools and resources. Through analytic memos, coding summary records, and recurring conversations focused on the analytic process, we generated findings and emergent themes based on the captured data.
Results
Three overarching findings emerged from the content analysis, highlighting key navigational challenges and patterned inconsistencies in messaging around affordability, costs, and finances associated with college attendance. Below, we discuss each main finding and provide representative examples from the data.
Navigational Challenges
Despite variation in the presentation of tuition and cost information found on different websites, navigability arose as a consistent theme in the data. This theme highlights several ways in which the organization and accessibility of content across webpages detracted from the clarity and coherence of presented information.
Specifically, our analysis revealed that the general architecture of institutional websites is strikingly similar in terms of user flow, based on the path taken by a prototypical user when navigating a website to accomplish a given task. The design of websites conveys explicit and embedded assumptions about page visitors and their needs, interests, and goals for interacting with that site. Institutions of higher education face unique challenges in designing websites to anticipate and respond to the needs of myriad visitor groups, including prospective students, current students, alumni, researchers, faculty, and investors.
To this end, we found that most institutional websites appear to organize tuition and cost information sequentially in ways that funnel users from a school’s homepage to the admissions page, and then to more detailed cost breakdowns often housed on separate pages maintained by the offices of financial aid or the registrar. Although not uniformly, this flow of information provides, first, a broad and most simplified overview of attendance costs, imparting more detailed descriptions of fees and policies at later phases in the search process. A representative example of user flow, as reflected on one institutional website, is presented in Appendix C.
This basic design approach was encountered on more than half of the websites we studied. While the consistency of navigational logic facilitated our search for comparable evidence across institutions, we noted that it did not align as effectively with the interests of key user groups, such as continuing students or students whose majors or programs of study were subject to differential tuition rates (i.e., where tuition varies according to a student’s academic major). In the case of continuing students and some transfer students, navigating to the Admissions page to locate tuition and fee information may not align with their search goals. For students whose intended program of study incurs additional fees or tuition costs, the cost of attendance summary table may underestimate their projected expenses and leave students with an inaccurate impression of financial needs (this phenomenon has been the subject of recent reports by Wolniak et al., 2019, and Velez et al., 2018).
We also noted that financial aid and scholarship information was routinely divorced from cost of attendance overviews, particularly summary tables where tuition and fee information tended to be condensed and/or simplified. In more than three quarters of cases reviewed, links to financial aid offices were accessible through dropdown menus on the institutions’ homepage or clearly visible on admissions department pages. While links to financial aid resources, scholarship eligibility criteria, and FAFSA (Free Application for Federal Student Aid) filing information appeared prominently on nearly all of the websites we reviewed, these awards were rarely factored into cost of attendance. Instead, most websites accounted for financial aid eligibility through individualized cost estimates generated by net price calculators.
That we consistently found detailed cost information buried several pages and multiple steps into our searches was cause for concern over the transparency and visibility of this information. The kinds of details we are referring to include course materials fees, differential tuition rates, registration and matriculation fees, and mandatory room and board policies. Data from our search protocol revealed that, in roughly 10% of cases, obscured links, table footnotes, and/or downloadable files with supplemental information had been overlooked or misinterpreted by members of the research team, resulting in sizable discrepancies in cost calculations. Our observations suggest that the splitting of information across multiple pages and links may detract from users’ comprehension and synthesis of tuition and fee information, or even one’s ability to obtain accurate information.
Information Fragmentation
Our second main finding highlights both structural (i.e., placement and location) and semantic (i.e., meaning and interpretation) fragmentation of linked information across webpages. In cases where tuition and cost information converged from multiple sources—such as state-level university systems with multiple campuses, interstate consortia, financial aid service suppliers, and government entities—we found the coherence of information and ease of page navigability to deteriorate, disrupting information flow. The following examples illustrate the nature and scope of these observations, found in relation to incongruities within a nested context (such as a single campus within a larger university system), as well as in relation to externally sourced financial tools and resources embedded into their websites (such as net price calculators).
Within-System Discrepancies
Given that all 50 institutions in our sample were publicly funded, the tuition and fee structures published on most schools’ websites necessarily reflect both state- and campus-level policies. Though some institutions outline state- and campus-level finance policies simultaneously, others refer to policy and fee explanations housed by centralized systems; this forces one to navigate between disparate sources of information in determining applicable costs. Even within the same state system, individual schools vary in how state- and campus-level fees are presented.
The University of California (UC) system provides an example of this phenomenon. Within the UC system, although tuition and fee rates for in-state residents are established by the governing Board of Regents, each school has the autonomy to charge campus-specific fees. Campus websites appear to function independently in how they present these cost breakdowns and fee definitions. For example, UC Santa Barbara does not provide an overview for cost of undergraduate attendance. Instead, visitors are required to enter information into a “Cost of Attendance” tool to generate estimates. The resulting estimate (see Figure 2) delineates several expense categories. However, these categories, including tuition, are not well defined and it is unclear whether they apply to all students, or are based on different enrollment patterns or personal spending habits on such things as food and mobile phone usage.

Costs of attendance summary: University of California Santa Barbara. 1
Conversely, UC San Diego specifies an “estimated basic budget for undergraduates” (see Figure 3) which like UC Santa Barbara’s estimate encompasses in-state resident tuition and fees as well as campus-specific fees. However, UC San Diego also cites fees for “Orientation” and for “Documents” that are presented in a way (embedded within a table footnote) that leaves it unclear if those fees are reflected in the other estimates listed.
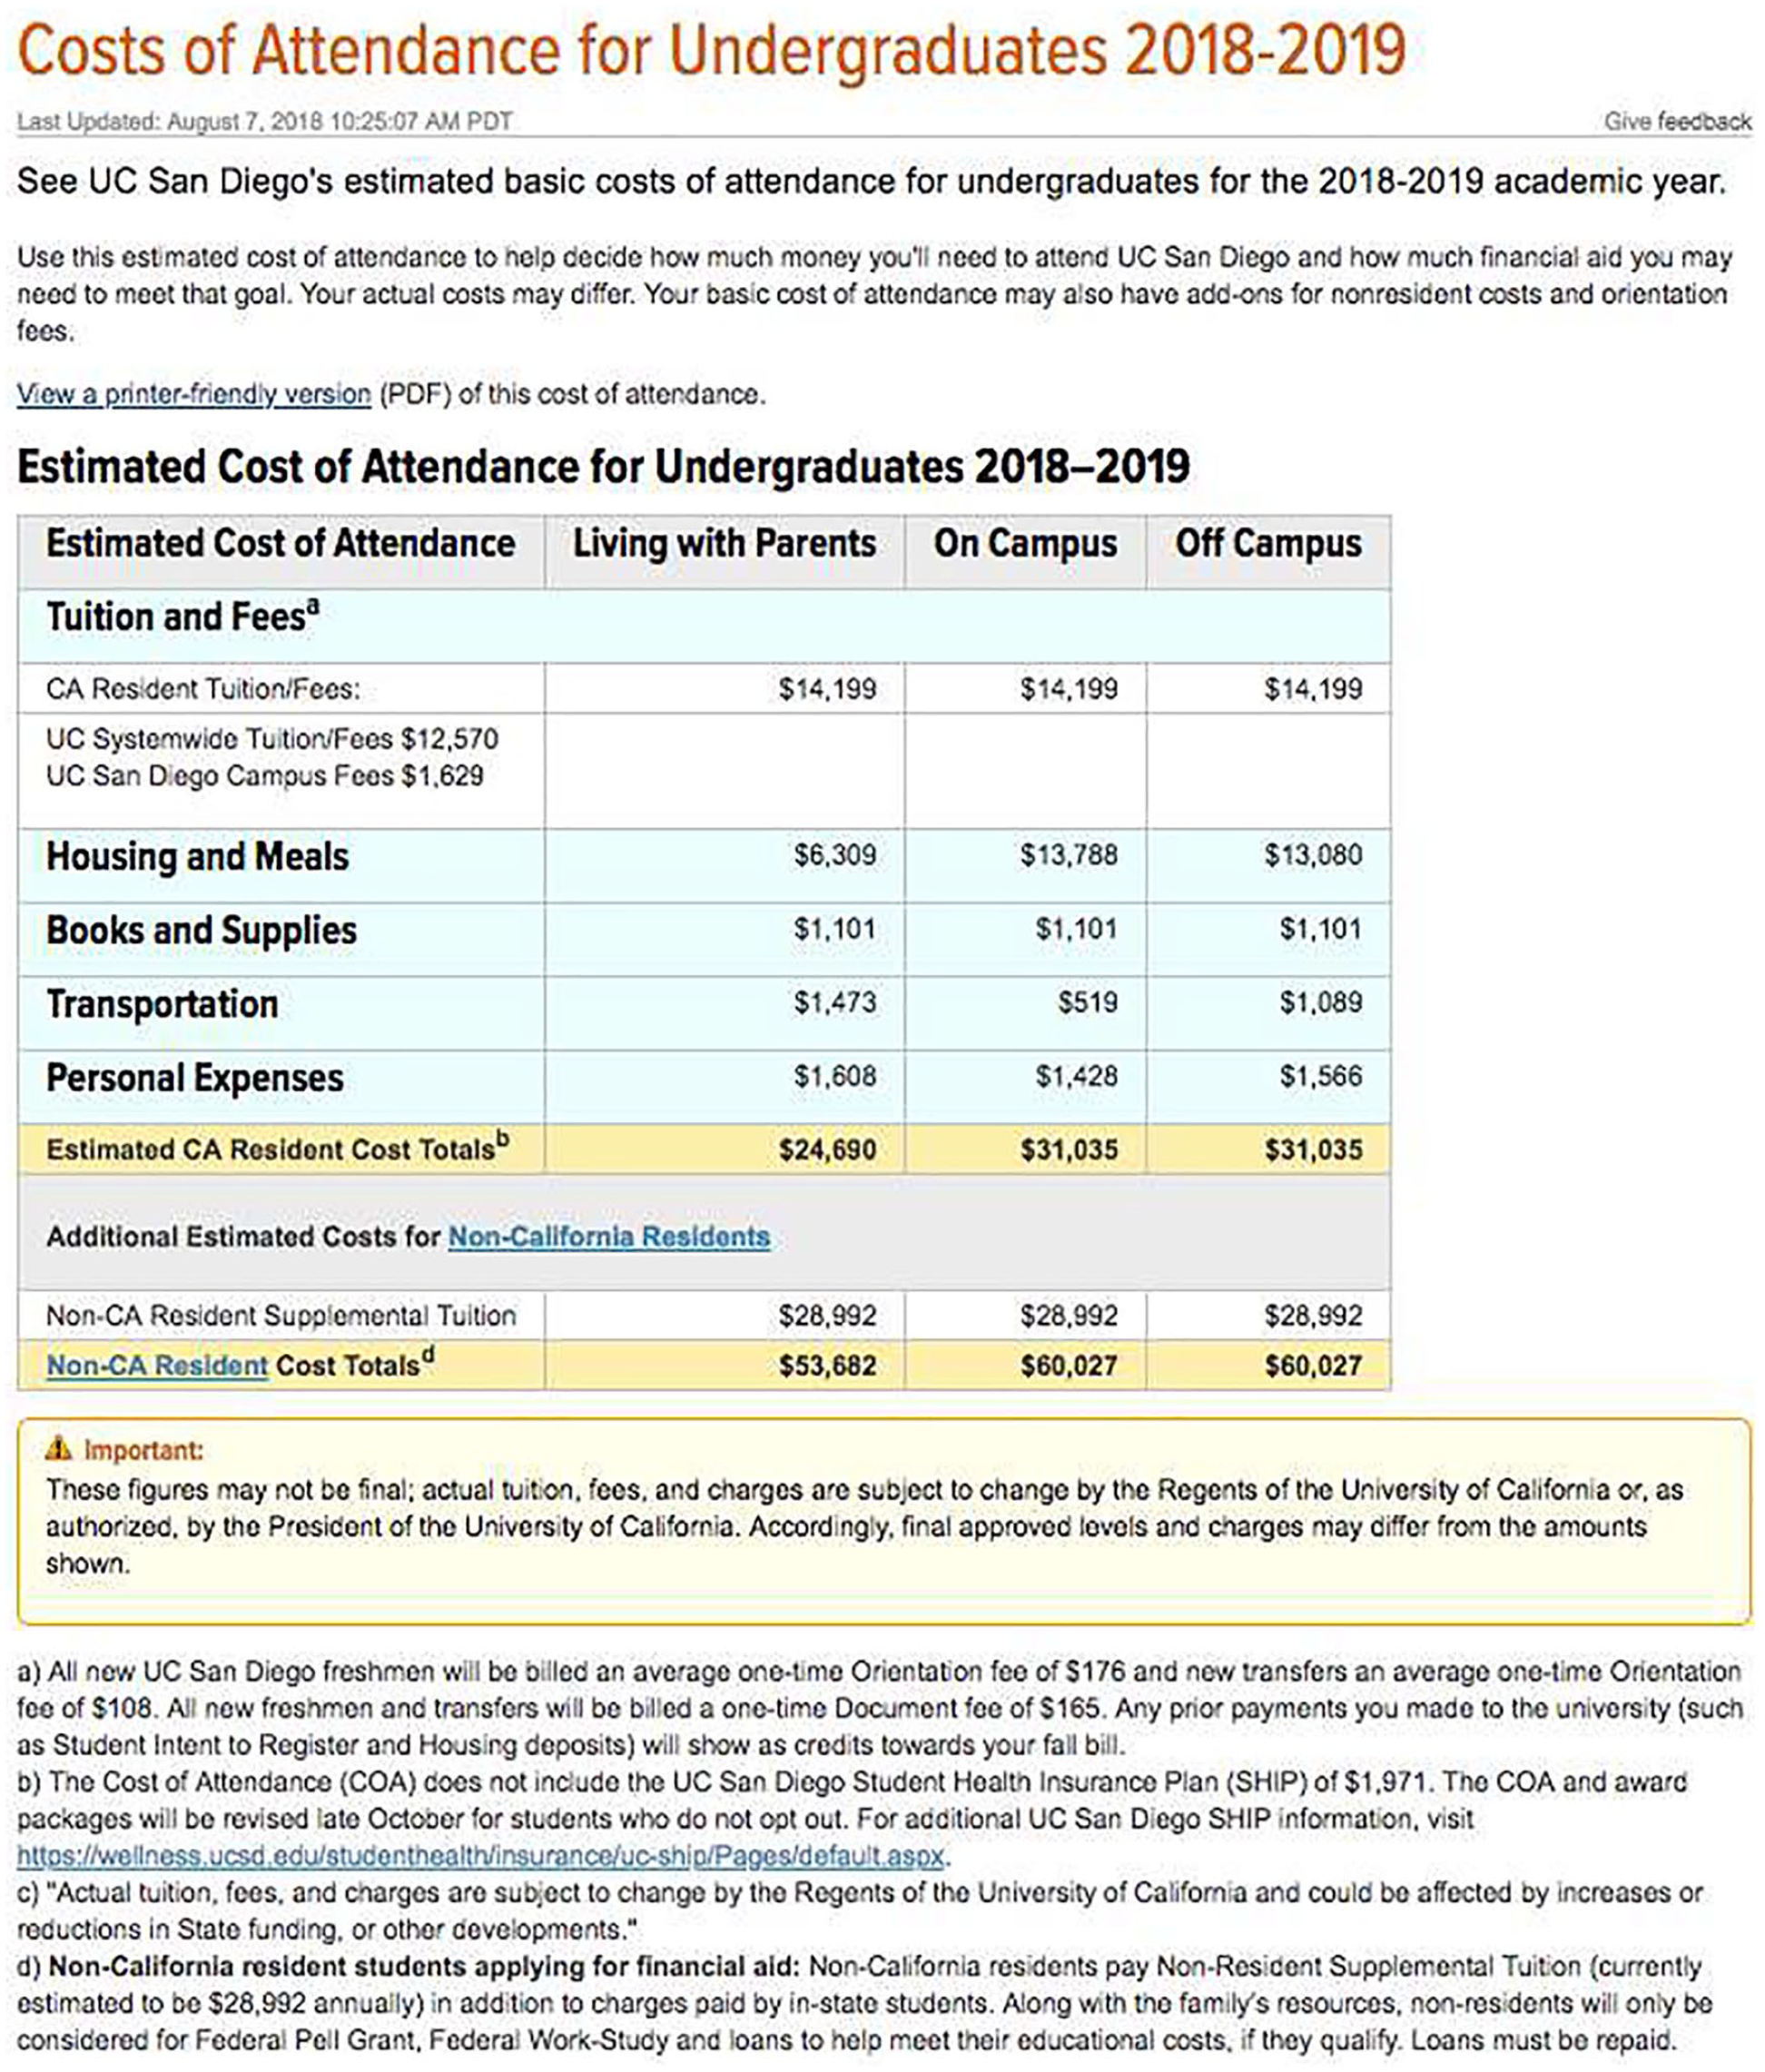
Costs of attendance summary: University of California San Diego. 2
As another point of comparison, UC Irvine’s website presents an even more simplified summary of costs for undergraduates. The table shown in Figure 4 makes no distinction between campus- and state-level fees and provides no definition or breakdown of aggregate expense categories. Instead, the table refers visitors to the Registrar’s page for additional details.
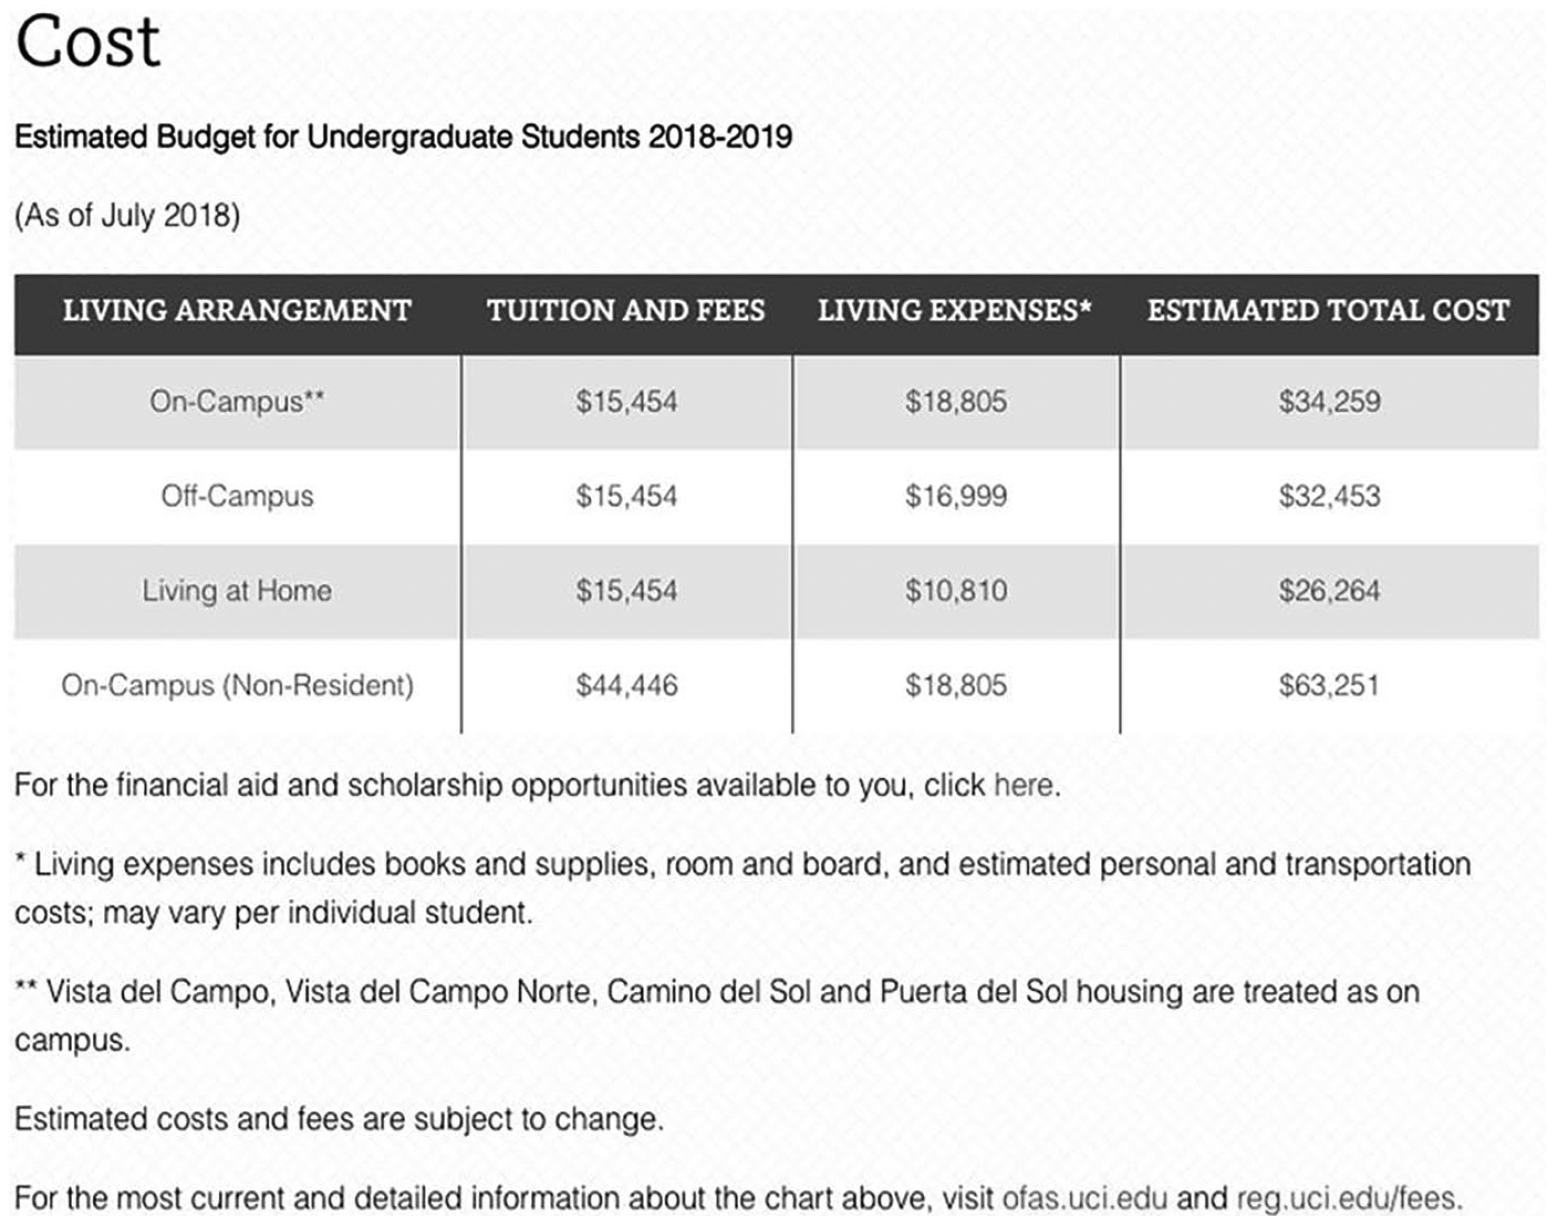
University of California Irvine cost table. 3
Although all three institutions are circumscribed by the same state system, a closer investigation of their websites revealed disparate strategies in the presentation of information and the structuring of the user experience. In all three cases, cost tables referred to expense categories that lacked detailed definitions or required visitors to navigate across multiple pages to locate additional information. State- and campus-level fees were often inconsistently represented. This tendency suggests differing levels of autonomy and control by institutions over their website content and design, even within the same state system. Idiosyncratic communication practices add an additional layer of complexity for students who seek to compare costs among different campuses within a particular college or university system.
Evidence similarly pointed to varying degrees of fragmentation in tuition and cost information presented on the websites of institutions participating in regional or interstate consortia. Tuition reciprocity agreements across schools or state university systems allow nonresident students from adjacent states to attend participating institutions at a predetermined, discounted tuition rate. While some schools negotiate bilateral agreements with other states or individual campuses, many choose instead to participate in broader interstate consortium agreements or tuition exchange programs, such as the Western Undergraduate Exchange, the Midwest Student Exchange, and the Academic Common Market. Our data show that institutions that participated in these consortium agreements or exchanges often presented negotiated rate categories alongside in-state and out-of-state tuition rates.
Issues arose when these institutions failed to meaningfully contextualize their policies or specify eligibility requirements for prospective students. In those situations, individuals are left to discern whether negotiated rates applied to all students.
Net Price Calculator Integration
We found additional evidence of fragmented and inconsistent information in cases where institutions embedded externally sourced financial tools and resources into their websites to facilitate the estimation of attendance costs or financial aid eligibility. Pursuant to federal policies outlined in a 2011 amendment to the Higher Education Act of 1965, institutions participating in the Title IV federal student aid program are required to post a net price calculator on their websites to assist current and prospective students and their families in calculating an estimated net price of attendance, which the U.S. Department of Education defines as the cost of attendance minus grant and scholarship aid (“Net Price Calculator Center,” n.d.). Institutions are given the option to develop and program their own institutional calculators or utilize a template provided by the U.S. Department of Education. Our data show that more than 40% of institutions in our sample elected to employ the universal template rather than create their own.
Our findings suggest the implementation of this policy, which was intended to enhance transparency around college costs, may have unwittingly compromised the consistency and clarity of information presented on institutional websites. Specifically, we found that information presented on schools’ websites routinely differed from what was generated through the net price calculator tools in at least one of the following ways: (1) the “currency” (see Stvilia, Gasser, Twidale, & Smith, 2007) of tuition and fee information, (2) requirements for on-campus housing and student health insurance policies, and (3) applicability of differential tuition policies by program or enrollment year.
First, the currency of tuition and fee rates employed by net price calculators varied considerably across institutions. Currency here refers to the age of applied tuition and cost rates, relative to the current academic year. In more than three quarters of the cases we examined, where institutions had opted to employ the federally designed net price calculator template, we noted outdated or discrepant tuition and fee information between schools’ websites and the calculator tool. The terms of use for the standardized net price calculator states that tuition estimates correspond to actual rates of tuition for a previous academic year, which in nearly all cases resulted in a 1- to 2-year lag when compared with the current academic year (see Figure 5). In numerous cases, outdated rates produced sizable discrepancies between cost estimates derived from net price calculators and our calculations based on institutions’ published cost of attendance tables, ranging from hundreds to several thousands of dollars.

Net price calculator terms of use. 4
Additionally, our analysis revealed inconsistencies surrounding mandatory service fees and housing requirements outlined on institutional pages when compared with the cost breakdowns from net price calculators, leading to confusion over the projected costs associated with housing and health insurance for full-time students. One example of this was found on the University of Oregon’s website, which indicated students entering as freshman are required to live in on-campus housing. And yet, the school’s net price calculator provided an option for users to select from three housing options, including off-campus and with family, resulting in expense estimates that vary by more than $8,500 for a single academic year (see Figure 6).

Comparison of net price cost estimates by housing option: University of Oregon. 5
In addition to room and board, institutions are required to account for other student expenses, such as transportation costs, in calculating net price of attendance. While some institutions offered definitions for miscellaneous expense categories, few if any explained how student transportation expenses were estimated. Furthermore, in cases where transportation costs could reasonably be expected to vary based on user input (e.g., due to a student’s on- or off-campus housing plan) the estimates were rarely adjusted.
Finally, patterned disparities in the cost estimates generated by net price calculators, compared with institutions’ tuition and fee summary tables, suggest that calculators routinely failed to account for differential tuition and fee structures, whereby student costs vary on the basis of enrollment year or academic program. In such cases, net price calculators tended to underestimate projected costs for students in specific programs or class years. We noted more cost discrepancies when net price calculator tools were externally sourced or maintained (i.e., when schools embedded a generic calculator template or linked to cost estimation tools on independent financial aid services sites like FastWeb) than when calculators were institutionally developed. In either case, inconsistencies stemming from outdated tuition rates and omitted campus-specific fees were further compounded by the exclusion of differential tuition rates assessed at the program level.
Data from Delta State University’s website exemplifies the multiplicative nature of these cost discrepancies. Like many schools, Delta State University presents a summary table outlining estimated cost of full-time attendance for the current academic year (see Figure 7). However, the same table directs visitors, via links, to the University Undergraduate Catalogue and the Student Business Services office for more detailed estimates and information on enrollment costs (denoted by red arrows in the Figure 7). The content on these linked pages revealed that additional course fees apply to at least 18 distinct categories of undergraduate courses, ranging from clinical training and fieldwork experiences, to psychology courses, to classes under a category referred to as Family and Consumer Sciences; fees ranged from $25 per course to $50 per credit hour.

Cost of attendance summary table: Delta State University. 6
Like many sites we reviewed across our institutional sample, Delta State University’s website utilized the federal template for its net price calculator (see Figure 8). The calculator requires users to enter basic personal information to determine their financial dependency status, residency, and eligibility for federal aid. The resulting calculations (see Figure 9) outlined the average price of attendance for the academic year 2015–2016, reflecting rates that were 2 years behind the current academic year, and 3 years out of date for students attempting to estimate costs for the upcoming school year (at the time data were collected). Neither the generated results nor the tool itself accounted for students’ enrollment plans in particular academic majors, meaning that the corresponding cost estimates may falsely estimate tuition and fee totals for individuals taking courses in any of the 18 categories subject to differential tuition policies.

Landing page for net price calculator: Delta State University. 7

Net price calculator results: Delta State University. 8
Collectively, our analysis suggests that third-party net price calculators are particularly prone to discrepancies in estimated costs of attendance when compared with other institutional sources of information. Schools utilizing custom or institutionally specific net price calculators showed far fewer informational discrepancies than those with externally sourced calculators. Similarly, we noted fewer issues with the visibility and functionality of links to in-house calculators compared with third-party tools; in two thirds of the cases where these links were visibly obscured or broken, a generic, externally sourced calculator template had been used.
In addition to informational consistency and link functionality issues, cost estimates produced by externally sourced or generic calculators rarely accounted for scholarship and financial aid awards. In contrast, several locally developed calculators used additional parameters—such as residency status, intended major, and standardized test scores—to calculate individuals’ tuition costs and/or eligibility for aid, including merit-based scholarships. While this degree of specificity was somewhat rare, even among schools with locally sourced calculators, generic calculator templates, like the one provided by the U.S. Department of Education, appeared to lack the customization options required to produce similarly detailed estimates. Findings reveal that the usefulness of net price calculators, as tools aimed at enhancing clarity around college costs, is heavily dependent on the structure and currency of constituent information, which varies considerably across institutions.
Language Use, Consistency, and Meaning
While the previous findings appear to implicate external structures or entities as key contributors to fragmentation in the tuition and cost information presented on institutional websites, we also found several internal inconsistencies in the ways financial information was packaged across pages within individual institutions. Our results suggest that inconsistency and ambiguity in the language used to characterize affordability of attendance, anticipated tuition expenses, financial aid availability, and proposed economic returns on individuals’ investments in higher education could lead to misconceptions on the part of students and their families. This is particularly concerning for individuals whose backgrounds are commonly associated with lower levels of financial literacy, including those with lower postsecondary aspirations, lower parental income and education levels, and those who identify as Black or Hispanic (Horn et al., 2003; Velez et al., 2018).
As previously noted, most institutional websites we reviewed presented an overview of attendance-related costs by way of their admissions pages. A school’s admissions page serves as a logical point of entry for prospective students and page visitors searching for application requirements and general costs of attendance. It follows, then, that cost summaries provided on schools’ admissions pages tended to be broad and minimalist in the information they provide, favoring strategies to “sell” rather than to show or explain. Admissions webpages routinely provide links to other pages or downloadable content with more detailed descriptions of policies and fees; menus and navigation bars found on schools’ admissions pages typically contained links to financial aid and the bursar’s office (the administrative departments typically tasked with overseeing student-related financial matters, including billing).
Our comparisons of website content across institutions uncovered practices we came to view as marketing strategies, which appeared in clear contrast to the detailed and sometimes intricate presentation of tuition policy found at later stages in the search process. We noted disparities in the aesthetic quality and informational clarity of key visual elements—such as tables, banners, images, and even menus—when navigating from admissions pages (typically intended to serve prospective students) to more internal-facing administrative departments like student accounts and the bursar’s office (typically intended to serve continuing students). Data revealed that nonadmissions pages more commonly contained technical language, undefined terms, and abstract or ambiguous fee categories, which, as noted, function as barriers to comprehension and disproportionately affect first-generation students and consumers with lower levels of relevant financial literacy.
For example, the language and visual design of tuition and fees summaries displayed on admissions pages underscored themes of affordability, transparency, and opportunity (see Figure 10). However, when navigating to more in-depth information on program costs and tuition rates, we often encountered visually cluttered tables with extensive course and departmental fees information (see Figure 11), mandatory fees without definitions (Figure 12), and ambiguously labeled fee categories, such as “Instructional Enhancement Fees” (Figure 13).

Admissions page costs summary: Weber State University. 9

Department fees: University of South Carolina. 10

List of semester fees: North Carolina State University. 11

List of instructional enhancement and differential fees: Midwestern State University. 12
These patterns suggest that visual design and language vary in systematic ways across institutional sites. On pages designed to appeal to prospective students as consumers, headings and text highlighting affordability, cost savings opportunities, and the economic rewards of higher education credentials overshadowed references to specific policies or fee categories. Conversely, pages that outlined detailed cost breakdowns, tuition rates by credit hour, and specific fee policies consistently used more technical language to characterize fees and mandatory charges in seemingly abstract terms. Evidence suggests that both strategies can obfuscate or detract from the clarity and transparency of tuition and cost information and may reflect institutional assumptions of what prospective students already know about details such as the courses they will take, or which college offers those courses.
Discussion
Given the importance of accurate and complete information in consumer decision making generally, and among prospective college students in particular, this study sought to identify and characterize dimensions of variation in the quality of information presented on institutional websites. Within today’s higher education system, colleges and universities rely heavily on their websites to recruit students and convey information about tuition and costs of attendance (Clinedinst & Patel, 2018). With institutional tuition- and cost-setting practices growing in complexity (Smerek, 2010; Weisbrod, Ballou, & Asch, 2008), students and families are left to shoulder the burden of navigating and interpreting a vast array of informational resources to assess the anticipated costs and financial realities of attending a particular institution or a given degree program. While the majority of prior research has described relationships between tuition changes and students’ enrollment responses (e.g., Hemelt & Marcotte, 2011), as well as differing levels of financial literacy among students and families (Horn et al., 2003; Velez et al., 2018), we have focused specifically on the ways financial information is presented by institutions through their websites. Our findings problematize the assumptions embedded within demand theory, and a central tenant of human capital theory, that students (as consumers) behave rationally in making their postsecondary choices based on the information available pertaining to costs and benefits of attaining a postsecondary education (Becker, 1993; Perna, 2006a). Our findings also offer new insights into how institutions’ communication practices tend to vary, and how such variations might influence individuals’ conceptions of tuition and costs.
By examining website content from a random sample of 50 public colleges and universities, we pursued two interrelated objectives. First, we sought to uncover observable patterns in the quality of tuition and cost information presented through institutional websites. Second, we assessed if variations in informational quality may shape the experiences of individuals who seek tuition and cost information from institutional websites. Based on our analysis of more than 2,000 captured screenshots, four overarching themes emerged.
First, despite considerable diversity in the scope and transparency of information presented by different institutions, variation in quality occurs along several dimensions, from clarity of language and usage of technical terminology to the consistency and coherence of visual displays. Second, data revealed notable similarities across institutions in the sequencing of information around tuition and costs, suggesting an intended flow of user engagement from general to specific, or from a cost of attendance overview to more fine-grained estimates based on enrollment plans. Despite these similarities, our third key finding highlights navigational challenges and information discontinuity stemming from the fragmentation of content across pages. It appears that the convergence of information from local (i.e., school-level) and external sources (such as state-level university systems, regional and interstate tuition consortia, and financial aid vendors) produced fissures and incongruences in the information presented. And finally, patterned discrepancies in page design, content specificity, and use of technical language across departmental and administrative offices within institutions highlights contrasting—and even competing—agendas for communicating financial information to different audiences comprised of prospective and current students.
These findings point to the ways institutional websites may contribute to misconceptions around actual cost of attendance and financial aid availability, while also undermining consumers’ confidence in the utility of school websites as resources. Given prior evidence indicating websites are most effective when they are easy to navigate and when users believe the information contained in the website is useful (Loiacono et al., 2007), the kinds of information fragmentation we uncovered appear to add another layer of complexity to an already difficult process of estimating the costs of attending college and may erode students’ ability to make the most informed, optimal decision about their postsecondary destinations.
For students, our results offer new evidence for expanding access to and comprehension of tuition and cost information and in so doing, improving decision making. Past research has shown the general misinformation students have about the differences between published college tuition and actual net price a family actually would pay (Cheng, 2012), differences in financial attitudes (Boatman et al., 2017), and the critiques students have of their experience navigating financial aid websites (Venegas, 2006). Our research takes this knowledge further, by uncovering the characteristics embedded within institutional websites that challenge the user experience. By highlighting specific dimensions of clarity and institutional practices detrimental to the quality of communication, our results afford insights into strengthening institutional practices in ways that expand information access to individuals.
Conclusions and Implications
Several conclusions derive from this study. In terms of practice, for institutions, the implications are clear: As the most public-facing element of a college or university, websites should be designed in ways that consider the experience and needs of the targeted audience (i.e., prospective and current students). Our results offer a road map for such changes by highlighting the importance of (1) using clear and descriptive language; (2) designing visual displays, navigational tools, and content that are consistent, coherent, and interconnected across pages and/or departments; and (3) integrating and aligning information across state and consortia levels. Perhaps most important, institutions must bring greater awareness and sensitivity to the assumptions embedded in tuition and cost information presented on their webpages, given disparities in students’ postsecondary and financial knowledge. Two discrete recommendations emanate from these findings.
First, given expanded focus on and interest in attracting and retaining more diverse student populations (e.g., Chang, Denson, Saenz, & Misa, 2006; Clarke & Antonio, 2012; Mayhew, Rockenbach, Bowman, Seifert, & Wolniak, 2016), tuition and cost information presented on school websites should address the unique needs and concerns of underrepresented and historically marginalized groups. For example, recent findings suggest that students from historically underrepresented groups (such as students from lower socioeconomic status backgrounds and those who identify as Black or Hispanic) may underestimate tuition costs (Velez et al., 2018) and feel greater aversion to taking out loans (Boatman et al., 2017). As such, efforts to redesign institutional websites should enlist support and guidance from campus officers, program leaders, and support providers serving underrepresented and/or historically marginalized groups to ensure that information and policies are effectively communicated and responsive to their concerns. Particular attention should be paid to the presentation of variable cost structures and differential tuition policies such as those affecting specific programs of study or enrollment classifications (e.g., first-year students, senior status, transfer students, etc.), as well as variance in fee definitions and rates across schools within larger state systems and interstate consortia, to ensure that cost estimates are transparent, consistent, and accessible to a diverse audience.
Second, institutions should avoid using third-party net price calculators. We found these to be particularly prone to discrepancies in estimated costs of attendance when compared with other institutional sources of information. This finding and recommendation dovetails with evidence from Perna et al. (2019), which uncovered several problems with the quality and accuracy of information provided by net price calculators. Ultimately, schools should opt for custom or institutionally specific net price calculators, which contain far fewer informational discrepancies and support more detailed cost estimates than externally sourced calculators.
Turning to research, future work should extend analyses to identify if website quality varies with such things as institutional selectivity and other aspects of the higher education system to further advance our understanding of potential stratifying factors affecting students’ postsecondary decision making. Subsequent studies would also benefit from the use of protocol and systems that allows for the gathering of page clicks or page views records, and to use a static (mock-up) website that does not rely on actual live websites in order to formally evaluate and measure different website designs.
Finally, for policy makers, our findings provide clear indication that the good intentions of the 2008 Higher Education Opportunity Act, which mandated that colleges and universities include a net price calculator, have failed on implementation (Cheng, 2012; Levine, 2014; Perna et al., 2019). In fact, a poorly designed website diminishes the potential value of such a tool, particularly when the information provided by a calculator is not up to date or accurate. In such cases, students are directly misled through a false sense of transparency. Furthermore, most institutions exist within larger state systems, many of which also participate in tuition reciprocity programs with neighboring states.
An important takeaway from this study is the communication tensions that arise from competing influences. Through improved strategies for the quality and accessibility of tuition and cost information—such as involving diverse student groups and campus-based offices in the redesign of websites and relying on custom, institutional-specific net price calculators—the benefits of attending college can be more fully realized, and tuition demystified.
Footnotes
Appendix A
Appendix B
Appendix C
Acknowledgements
The authors thank Cassie Kwon, Emily Zuccaro, and Fira Yagyaev for their assistance with data collection. In addition, we thank Dr. Amy Stich for providing helpful feedback on an earlier draft of this article. Finally, we gratefully acknowledge the Spencer Foundation, whose support of a prior project (Grant No. 201600165) served as a catalyst for the development of this study.
4.
Authors
LAURA A. DAVIS is a senior research analyst at the University of Chicago Consortium on School Research. Formerly an elementary classroom teacher, Davis studies issues of racial and cultural diversity in schools. Her current work examines postsecondary transitions of students from historically marginalized communities and the production of educational inequality in and across P-16 systems.
GREGORY C. WOLNIAK is an associate professor of higher education at the University of Georgia’s Institute of Higher Education. Wolniak’s research centers on how socioeconomic trajectories are affected by experiences in college, educational choices, and institutional environments, and the ways in which learning and developmental gains made during college translate to postcollege outcomes.
CASEY E. GEORGE is an assistant professor of higher education administration at the University of Louisville, where she also serves as assistant director for the Center for Economic Education. George’s research focuses on examining postsecondary access and equity for traditionally marginalized populations, with primary attention given to how institutional programs and policies affect students’ access and experiences.
GLEN R. NELSON is vice president for finance and business affairs at Idaho State University. Nelson is a higher education practitioner who has served in senior leadership roles at several public universities and systems, with research interests on the impact of policy decisions on the educational choices made by students from low-income backgrounds.