
Abstract
The purpose of this study is to use geographic information systems to map the spatial distribution of traditional public school closures and the opening of charter schools in Detroit. To achieve this purpose, we examine the following research questions: (a) How are traditional public school closures and the opening of charter schools spatially distributed throughout neighborhoods in Detroit during three education policy eras? (b) How, if at all, might these schools’ spatial patterns cluster in certain neighborhoods to create hot spots of traditional public school closures and/or charter school openings? As such, this descriptive study uses hot spot geospatial analysis to identify whether the spatial occurrence of traditional public school closures and charter school openings is randomly distributed or if it occurs in statistically significant spatial clusters. Rollback and rollout neoliberalism is used to theoretically frame the study and guide the analysis. Findings suggest that charter school openings occur more often in hot spots or concentrated ways than the closure of traditional public schools in Detroit. We conclude with implications for future research.
Neoliberal education policies are restructuring traditional public school systems across the United States (Lipman, 2011). This restructuring has disproportionately affected urban school districts and neighborhoods of color. Arguably, Detroit and its traditional public schools have been hit hardest by neoliberal restructuring, as evidenced by the district’s near bankruptcy, the district being under state control from 1999 to 2016, and the district having the second-largest charter school market in the nation (Arsen, DeLuca, Ni, & Bates, 2016; Khalifa, Douglas, & Chambers, 2016). Additionally, neoliberal policies have partly contributed to the proliferation of charter schools and >200 traditional public school closures during the last decade and half in Detroit (Grover & van der Velde, 2016). However, most mainstream narratives frame school closures in Detroit a-historically, a-racially, and only as the result of various social, demographic, and economic factors. These factors include population decline, uneven supply-and-demand dynamics, administrative incompetence, and fiscal mismanagement (Arsen et al., 2016). While these factors are critical, to frame school closures in Detroit only as a result of these factors obscures the ways that neoliberal education policies influence school closures and how charter schools have been opened (Yoon, 2016).
We therefore argue that the closing of traditional public schools and the concurrent opening of charter schools, especially in Detroit, can “be best understood in relation to the construction of neoliberal, social, [education], and economic arrangements” (Lipman, 2008, p. 120). 1 By neoliberal, we mean “a loose set of ideas, [practices, and strategies], that market principles should govern how society should work” (Spence, 2015, p. 141). Neoliberalism thus engenders a policy context that rationalizes less state support for public schools, the privatization of public education, and the use of reforms such as charter schools as a policy mechanism for “educational transformation.” Despite this policy context, a dearth of research has connected school closures in Detroit to the neoliberal, racial, and historical policy milieu that shaped the conditions for school closures and the simultaneous opening of charter schools across the city (for exceptions, see Gulosino & Lubienski, 2011; Pedroni, 2011; Wilson, 2015). Furthermore, while scholars have examined urban school closures, we know little about whether school closures and charter openings occur in spatially significant ways. Understanding these spatial patterns is important because it can help policy makers, district leaders, and communities develop effective policies and interventions to school closures and regulate charter openings.
The purpose of this study is to use geographic information systems (GIS) to map the spatial distribution of traditional public school closures and the opening of charter schools in Detroit. We thus examine the following research questions: (a) How are traditional public school closures and the opening of charter schools spatially distributed throughout neighborhoods in Detroit during three education policy eras? (b) How, if at all, do these schools’ spatial patterns cluster in certain neighborhoods to create hot spots of traditional public school closures and/or charter school openings?
This study extends the burgeoning research on geospatial analysis and school closures in two ways. First, we employ an underutilized GIS method in education research—hot spot analysis—to map the spatial distribution of traditional public school closures and charter school openings. Drawing on over four decades of data from the U.S. Census Bureau, City of Detroit, and Detroit’s Public School System, we use hot spot analysis to identify whether the spatial occurrence of school closures and charter openings across the city is randomly distributed or if it occurs in statistically significant spatial clusters. Second, to contextualize the district’s historical and contemporary context, we situate our study across three interrelated education policies that helped to shape the conditions for school closures over the past 40 years and, more recently, the spread of charter schools in Detroit. These policies include Milliken v. Bradley I (1974) and II (1977) school desegregation cases (hereafter Milliken), Proposition A (Prop A), and emergency management (EM) laws. Our aim is not to suggest causality between these policies and school closures and charter openings. Instead, using these policies as a backdrop, we seek to descriptively understand the context in which this phenomenon occurs.
Furthermore, we focus on these three policies because they continue to affect Detroit’s educational context. We specifically include the Milliken era (1974–1989) in our analysis because the first big wave of school closures in Detroit followed the Milliken decision (Grover & van der Velde, 2016), which accelerated declining student enrollment through White flight out of the district (Baugh, 2011). We also include Milliken because research suggests that past school desegregation decisions play a critical role in contemporary urban school closures but are often overlooked in the literature (Anderson, 2017).
In what follows, we review research on urban school closures in the United States, noting the racialization and “neoliberalization” of this process. In doing so, we position traditional public school closures and charter school openings as a joint market-based process occurring together. We next discuss our theoretical framework, the Detroit context, and the policy environment that laid the groundwork for school closures and charter openings in Detroit. Then, we discuss our geospatial methods, analysis, and findings. We conclude with implications for future research.
Racialization and Neoliberalization of School Closures and Charter Openings
Between 2006 and 2013, >1,200 traditional public schools were closed across 26 states in the United States. 2 These closures disproportionately occurred in urban school districts that predominantly serve Black and Brown 3 students, such as Detroit, Chicago, and New York City (Deeds & Pattillo, 2015; Ewing, 2018). 4 In each of these districts, >100 schools have been closed in recent years (Journey for Justice, 2014). According to research, schools that serve larger populations of Black and Brown students with economic need are more likely to be closed than schools with fewer students of color, even when the schools have similar academic performances (Center for Research on Education Outcomes, 2017). Research also indicates that schools mainly serving Black and Brown students are closed even though closures can be detrimental on multiple levels as they affect “every part of the education system from students to teachers to the neighborhoods around the schools and the city as a whole” (Grover & van der Velde, 2016, p. 21).
Scholars who take critical perspectives link school closures to political forces, corporate interests, and the policy contexts that allow neoliberalism to take shape (Lipman, 2011; Pedroni, 2011; Stovall, 2016). The neoliberal education agendas that focus on school closures manifest through policy justifications that render closures as a positive reform mechanism. These agendas purport to remove “low-performing schools” from the “education market” through competition, thereby producing viable schooling options for families (Brummet, 2014; Engberg, Gill, Zamarro, & Zimmer, 2012). School closures are therefore rationalized as good administrative governance, a logical intervention to “failing” traditional public schools, a consequence to underutilization of space, and a fiscally responsible option for distressed districts. However, these arguments for closing schools are still made despite empirical evidence showing that closing schools does not result in large savings, especially for big-city school districts, at least in the short run, without coupling it with large-scale teacher layoffs (Pew Charitable Trusts, 2011). 5
Moreover, there is an important relationship among federal, state, and local policy actors in how school closures and charter openings manifest. Federal policy actors 6 create a climate for neoliberal education policies that state and local actors in turn implement. As such, federal education policies in the United States have engendered an environment for school closures and the subsequent opening of charter schools in low-income Black and Brown communities (Good, 2017; Lipman, Vaughan, & Gutierrez, 2014). Policies such as No Child Left Behind created a high-stakes accountability environment that made school closures a “commonsense” neoliberal outcome to “underperforming schools.” Under this logic, No Child Left Behind encouraged school closures through market-based school reform policies that punished schools for low performance, introduced incentives, and promoted school choice (Green, 2017; Mintrop & Sunderman, 2009). Similarly, the federal government continued to close urban public schools, while new initiatives promoted the possibility of innovation in charter schools. The Race to the Top competition prioritized school closure as one of its remedies to “underperforming schools” (Deeds & Pattillo, 2015).
At the state and local levels, neoliberal policies have also been used to justify school closures and the concurrent opening of charter schools. This has been coupled with housing, labor, and other city policies that constrain urban life for children and families of color (Ewing, 2018; Green, 2017; Lipman, 2011). For example, research suggests that closing public schools and opening charter schools in Chicago “is linked to policies that mandate dismantling public housing, limit affordable housing options, and support gentrification” (Lipman et al., 2014, p. 3). Consequently, the massive school closures in Chicago—which resulted in >50 school closures in 2013 alone—have produced racialized outcomes leaving some Black communities with few traditional public open-enrollment schools (Lipman et al., 2014).
Impacts of School Closure on Students and Communities
The impacts of school closures on student educational outcomes are neutral at best and negative in other instances (Gordon et al., 2018). Students whose schools have been closed initially experience higher absenteeism and lower test scores, which in some cases decrease over time (Engberg et al., 2012). Research in Chicago suggests, however, that students from the 50 schools that were closed in 2013 experienced long-term negative impacts on their math test scores and grade point averages (Gordon et al., 2018). Furthermore, in schools that have been closed across the United States, students have noted less voice, decreased ability to affect school policies, weaker relationships with teachers, and lower academic performance in the schools that they attended after their neighborhood schools were closed (Kirshner, Gaertner, & Pozzoboni, 2010; Kirshner & Pozzoboni, 2011). While most students in urban districts move to lower or equally performing schools after closure, some studies suggest that when students move to higher-performing schools, they typically experienced better attendance and test scores. 7 However, the distance between high- and low-performing schools in many urban cities is so far that it prohibits some students of closed schools from attending higher-performing schools (de la Torre & Gwynne, 2009).
Additionally, the social-spatial and psychological impacts of school closure can be costly. Research indicates that school closures can destabilize communities, interrupt the lives of students and families, and cause receiving schools to become overenrolled (Gordon et al., 2018). The closure of schools can also lead to a type of social death or mourning because the connections among schools, students, families, and communities are lost (Ewing, 2018). The social impacts of school closure also include erasure of histories, student mobility issues, loss of jobs for teachers of color, and fractured school feeder patterns (Buras, 2013; Green, 2017). To compound these impacts, the psychological consequences of school closure interrupt a community’s sense of place and home (Journey for Justice, 2014).
Theoretical Framework
To frame this study, we draw on Peck and Tickell’s (2002) theorization of “rollback” and “rollout” neoliberalism. According to Peck and Tickell, neoliberalism represents “explicit forms of political management, intervention, and new modes of institution-building designed to extend the neoliberal project, to manage its contradictions, and to secure its ongoing legitimacy” (p. 396). Peck and Tickell characterize rollback neoliberalism as a type of dismantling, discreditation, and destruction of public institutions and goods. As the authors note, rollback is historically situated and represents a shift from Keynesian-welfare economics to free market economic theories characterized by marketization and deregulation. For example, rollback neoliberalism destroys public goods and institutions such as public schools, public housing, and labor protection policies (e.g., teachers’ unions and tenure; Lipman, 2013b; Moskowitz, 2017).
Conversely, the authors argue that rollout neoliberalism describes a policy logic that privileges entrepreneurial governance through new construction and consolidations. Rollout neoliberalism therefore engenders new institutions (i.e., charter schools) and policies that create markets in places where they had not previously existed, such as charter school markets in communities that once housed traditional public schools (Lipman, 2013a). Given the proliferation of charter schools in urban contexts and the ways that charter schools are marketed toward students of color, rollout neoliberalism is also imbued with racial consequences.
While Peck and Tickell’s (2002) theorization of rollback and rollout neoliberalism is a useful frame for this study, their analysis does not explicitly account for the nuanced ways that race and racism inform neoliberalism. Our conceptualization of neoliberalism centers race and racism by focusing on “the ways neoliberalism (its underlying philosophy) is fundamentally raced and actively produces racialized bodies” (Roberts & Mahtani, 2010, p. 248). We thus augment our analysis of neoliberalism with Roberts and Mahtani’s (2010) assertion: “To begin the process of racing neoliberalism, it is essential to understand neoliberalism as a facet of a racist society that works to both reinforce the racial structure of society, while also modifying the process of racialization” (p. 250).
Therefore, we apply the concepts of rollback and rollout to examine the closure of traditional public schools and the opening of charter schools, while maintaining a deep understanding of the ways in which race and racism anchor neoliberalism.
Detroit’s Context
Detroit occupies a complex and contested space that has and continues to be shaped by White racism, structural inequality, and residential segregation (Khalifa et al., 2016; Vojnovic & Darden, 2013). Detroit’s population peaked at 1.85 million people in 1950 and was known as the global epicenter of the automotive industry. However, within the broader context of rampant population decline, deindustrialization, suburbanization, and disinvestment in the public infrastructure, the landscape of Detroit has changed (Galster, 2012; Green, 2015; Wilson, 2015).
Currently, Detroit, with a gentrifying downtown, is the tale of two cities or what Tabb (2015) calls “selective revivification.” In one instance, downtown Detroit is rebranding itself as the place for cool, young, and discursively White hipsters to buy homes for cheap and to start a business (Reese, Eckert, Sands, & Vojnovic, 2017). The gentrifying downtown, which is composed of about 7.2 square miles, is seemingly immune to the hardships experienced throughout the rest of Detroit. For example, there are 53,000 vacant homes in Detroit, but downtown Detroit has a 90% occupancy rate (Moskowitz, 2017). From 2000 to 2010, Detroit lost 25% of its population, while downtown only lost 12.5%. Concomitantly, many of the private sector developments and investments have occurred downtown and not in other parts of the city (Reese et al., 2017). Given the changing context of downtown Detroit, Pedroni (2011) argues that the city is undergoing a “spatial fix—also a racial fix—[that] reproduces and intensifies inequality and exclusion along the lines of race, class, and ethnicity” (p. 206).
However, in another instance, Detroit’s neighborhoods are commonly portrayed in mainstream narratives as Black, destructive, impoverished, and ground zero for educational dysfunction (Moskowitz, 2017). 8 These perceptions also hold for many Black elected officials who are perceived as politically corrupt and poor fiscal managers (Wilson, 2015). Despite these binary conceptions about Detroit, the city faces harsh realities that are acutely felt in its public school system and that we maintain are connected to the city’s past and current educational policies.
Milliken v. Bradley: A Policy Precursor to School Closures
Since research connects school closures to school desegregation decisions, 9 we trace closures in Detroit back to the landmark Milliken v. Bradley school desegregation cases that occurred between 1974 and 1989. 10 In 1970, many of the high schools in Detroit’s suburbs were predominantly White, while the inner-city high schools were predominantly Black (Green & Gooden, 2016). As the Black community 11 fought for equal educational opportunities for its children, the Detroit School Board responded by ratifying a plan to integrate its high schools. The plan was met with intense resistance from White parents and Black nationalists who wanted separate, community-controlled Black schools (Baugh, 2011). 12 Consequently, Governor William Milliken signed Public Act 48 into law, which stopped the high school integration plan and put schools under community control.
The National Association for the Advancement of Colored People sued the state of Michigan and Detroit Public Schools because Public Act 48 violated the equal protection clause of the Fourteenth Amendment. They argued that the school board, as well as local and state governments, deliberately created racially segregated neighborhoods, attendance zones, and feeder patterns (Baugh, 2011). Consequently, the district court ordered a metropolitan busing solution between many of the White surrounding suburban school districts and Detroit. However, the Supreme Court reversed the decision in a 5–4 vote. 13
Following Milliken, the Detroit public school system experienced school closures for the next 15 years. As Grover and van der Velde (2016) assert, “the first major wave of closures came in 1976, as 14 mostly older schools were closed to comply with court-ordered desegregation policies” (p. 10). Another consequence of the Milliken decision was White flight to suburban districts, resulting in a loss of student enrollment and resources in the Detroit’s public schools. Grover and van der Velde further contend, “Though these closures [after Milliken] were heatedly opposed by some residents, they reflected the reality that the district could no longer sustain the large number of school buildings without bleeding district finances dry” (p. 12). Consequently, by 1982, another 15 schools closed as the district underwent reorganization, and for the first time, the district’s enrollment fell below 200,000 students. Even though the mandates of Milliken ended in 1989, nine more schools closed at the start of the 1990–1991 school year. With continued loss of students and resources, school closures continued and were further affected by another policy decision: Prop A.
Michigan’s Prop A
In August 1993, the Michigan legislature passed Public Act 145, which repealed property taxes as the primary funding source for K–12 education, eliminating approximately $7 billion in school operating funds (Summers, 2017). Approved on March 15, 1994, Prop A reformed Michigan’s school finance system. Prop A eliminated property taxes as the main source of school funding and allocated funds to districts on a per-pupil basis. 14 Thus, because of Prop A, school districts in Michigan have little discretion to increase tax revenue for education purposes (Arsen et al., 2016). Concomitantly, Michigan passed its charter legislation in 1993 and open enrollment/interdistrict legislation in 1996. This interdistrict open enrollment policy is known as Schools of Choice. The Schools of Choice provisions in Section 105 and 105c of the State School Aid Act allows participating school districts to enroll nonresident students into their districts. Under Prop A, the state sets per-pupil funding levels, but most operating revenue follows students if they attend a charter school or a school in another district (Arsen et al., 2016).
We thus contend that Prop A helped 15 to incentivize participation in interdistrict and charter school enrollments because education funding was no longer attached to property but now to students. In other words, traditionally White districts that were historically opposed to accepting Black students from Detroit were now open to receiving them because they could offset their declining balance sheets. Thus, through these policies, families can choose to send their children to charter schools or schools in districts outside their home district (if the district accepts them). The convergence of these policies (i.e., Prop A, charter school policy, and Schools of Choice) has negatively affected student enrollment in Detroit’s public schools (Grover & van der Velde, 2016). Within a decade after Prop A was passed, Detroit lost 26,403 students (Detroit Public Schools, 2015) and since its passage, >195 traditional public schools in Detroit have been closed. While we are not suggesting that Prop A was the sole and direct cause of traditional public schools closing in Detroit, we, like other scholars, do associate Prop A, with the charter school policy and Schools of Choice, with school closures in the city (Arsen et al., 2016; Grover & van der Velde, 2016).
The school finance system put in place by Prop A overwhelmed an already strained Detroit school district because as the district started losing students under Prop A, its fixed costs remained the same (Peters, 2012). Within this policy context, more families opted for schools in other districts and charter schools in Detroit. As the option for charter schools grew, so did the growth of for-profit charter schools in Detroit (Binelli, 2017; Lubienski, Gulosino, & Weitzel, 2009). As of recent, nearly 80% of charter schools in Michigan were operated by for-profit education management operators, while only 16% of charters were run by for-profits across the nation (Binelli, 2017). In sum, Prop A contributed to a climate of school closures in Detroit through extracting students and resources from the district via interdistrict transfers and charter policies (Hammer, 2011; Kang, 2015).
EM Policies and Detroit’s Public Schools
EM is a mechanism of state control enabling legislatures to appoint an individual or agent to oversee local cities or municipalities (Fasenfest & Pride, 2016). The governing reach of EM in Michigan is racially and economically inequitable. In Michigan, 51% of African Americans and 16.6% of Latinx residents lived in cities that were under EM during the 2008–2013 period, as opposed to only 2.4% of Whites (Lee et al., 2016). Furthermore, these policies provide sweeping power to the emergency financial manager, with little to no oversight from locally elected or appointed government officials (Bowman, 2013; Fasenfest, 2017), such as school boards.
The first state takeover of Detroit’s public schools occurred in 1999. By 2011, new policies were introduced in Detroit that shifted the authority of the emergency manager to hold oversight of fiscal and academic inadequacies of schools (Bowman, 2013). 16 As EM laws expanded to include jurisdiction over school districts, the market for charter schools increased as public schools closed due to mounting financial pressures and declining enrollment (Bowman, 2013). For example, since 1999, emergency managers and district CEOs closed nearly 200 public schools in Detroit to reduce operating costs, while 81 schools remained vacant at various periods (Hawkins, 2016). More recently, while under EM between 2009 and 2011, the district’s deficit grew to >$284 million, 59 schools were closed, and the district lost >20,000 students. During the same time, 21 charter schools were opened in Detroit under EM (Grover & van der Velde, 2016, p. 26).17,18 Like Milliken and the series of policies associated with Prop A, EM policies created a context that furthered school closures and charter openings.
Research Design
We used the case study method to illustrate the spatial distribution of traditional public school closures and the opening of charter schools in Detroit. Here, we describe our sampling techniques, data sources, and analysis.
Sampling and Data
We used purposive sampling to identify a school district where we could examine traditional public school closures and charter openings longitudinally. To address our research questions, we drew on a range of data sources. First, to collect data on student enrollment, we used the State of Michigan’s School Data Portal and the Detroit Public Schools’ annual financial reports. 19 Second, we used state, district, and geospatial data to identify charter schools’ location, type (e.g., for-profit vs. nonprofit), and school level. We also analyzed district documents that compiled traditional public school closures’ location and date of closure.
Additionally, we analyzed several demographic data from the U.S. Census Bureau, U.S. Postal Service, the City of Detroit, and the state of Michigan. These data included racial demographics, total population <18 years old, population <18 years old living below the poverty level, number of families living in particular neighborhoods, and number of families living below the poverty level by census tract. Our examination of these variables aligns with previous GIS research that examined these factors to gain insight into social, economic, and demographic aspects of neighborhoods (Gulosino & Lubienski, 2011). Since the U.S. Census Bureau does not collect school-level information, we mainly analyzed demographic data at the zip code and census tract levels.
GIS Mapping Procedures
We employed descriptive GIS because it “has a central role in all explanation, it is fundamentally important in and of itself [and] . . . we cannot construct meaningful causal explanations without [first having] good description” (King, Keohane, & Verba, 1994, p. 34). To map the geographic distribution and cluster of school closures and charter schools operating within Detroit, we took several steps. First, we compiled a spreadsheet containing a list of the public schools that had been closed in Detroit between 1976 and 2016, which included the school’s physical address, latitude, and longitude coordinates. We paid close attention to the schools that had been closed starting in the 1970s, because of Milliken, up to 2016. We geocoded these public schools’ addresses using ArcGIS 10.3.1 software.
We then repeated the geocoding process for each charter school that had been opened in Detroit between 1995 and 2016. This process resulted in the creation of two separate GIS layers: one containing traditional public school closures and one with charter school openings. For the base layers (i.e., background on which to map the schools), we acquired Detroit zip code data from the U.S. Postal Service and census tract and road data from the U.S. Census Bureau. Then, we downloaded census demographic data at the tract level from decennial data sets (1970–2010) and the 2012–2016 American Community Survey (2016) 5-Year Estimates data set for the most recent data. We specifically gathered data for race, family, and poverty for all the census tracts within Wayne County, Michigan. Finally, we mapped the location of current (December 2018) for-profit and nonprofit charter openings to see if there were any hotspots. However, we could not run an analysis for hot spots between for-profit and nonprofit charter school openings, because at least 60 of one type is needed, which there was not at the time of our analysis.
Hot Spot Procedures
Given this study’s purpose, we used the Spatial Statistics Tool 20 in ArcToolbox to conduct a hot spot analysis. Hot spot analysis identifies statistically significant spatial or geographic clusters of high values (i.e., hot spots) and low values (i.e., cold spots), which is important for identifying areas where an incident is occurring at unexpectedly high values, irrespective of zip codes, highways, or city lines. Through employing this mapping technique, we are able to see the spatial patterns of incidents occurring, because the calculations are based on specific incidents tied to geographic points on the ground. We overlaid zip codes on the hot spot maps to provide a sense of orientation and to understand how closures and charter openings occur across different spaces. Importantly, we used hot spot analysis over heat mapping because the latter lacks statistical significance. We also used hot spot analysis because it is underutilized in education research, despite its common use in other fields, such as epidemiology, crime, and ecology (e.g., Pelton & Smith, 2015). Thus, our decision to use hot spot analysis over other GIS techniques informs our conclusions and findings.
In our hot spot analysis, we calculated the Getis-Ord Gi* statistic for each feature in our data set. This statistic indicates where features with either high or low values cluster spatially. The hot spot analysis tool uses the randomization null hypothesis as the basis for statistical significance testing. The randomization null hypothesis for this analysis states, “There is complete spatial randomness in the distribution of traditional public school closures and charter school openings in Detroit.” To test this hypothesis, we calculated z scores, p values, and confidence levels bin (Gi_Bin) 21 for each feature. We did this to identify where features with high or low values cluster spatially. Through the Gi_Bin field, we identified statistically significant hot and cold spots. Features in the ±3 bins (features with a Gi_Bin value of either +3 or −3) are statistically significant at the 99% confidence level; features in the ±2 bins reflect a 95% confidence level; features in the ±1 bins reflect a 90% confidence level; and the clustering for features with 0 for the Gi_Bin field is not statistically significant. Finally, through this analysis, we identified areas within Detroit where the concentration of closures and/or charters is statistically significant.
Analysis
Our analysis included a four-step iterative process. First, we mapped the public school closures that occurred in Detroit from 1976 to 2016. Then, we mapped all zip code boundaries in Detroit. 22 Given the length of time and difficulty with accurately accounting for hot spots across changing neighborhoods, demographics, and school boundaries, we purposefully did not conduct a hot spot analysis for closures between 1976 to 2016. Second, we mapped the location of public school closures by policy era (e.g., Milliken). We use years to demarcate these policy eras, and in the case of Prop A and the EM laws, there is some overlap. In the maps corresponding to Prop A and EM laws, we also mapped the location of charter school openings and by type (for-profit vs nonprofit). Steps 1 and 2 helped us answer our first research question about the spatial distribution of traditional public school closures and charter openings. Third, we conducted a hot spot analysis for each of the three policy eras, spanning the four-decade period. For the Milliken map, however, we ran the analysis on only the school closure data set because charter school laws were not yet active. Our final spatial analysis procedure addressed the second research question, where we identified the existence of any hot spots in relation to the spatial distribution of school closures and charter openings across the metro area by each policy eras.
Limitations
This study’s sample focuses on charter school openings. While important, it does not account for charter schools that have closed in Detroit during the periods included in this study. Second, we used zip codes to delineate neighborhoods eligible for hot spots instead of census tracts. We used zip codes because of their consistency over the years. To address this limitation and to ensure that we had the most detailed information for the hot spots, we also retrieved demographic data for each census tract by the corresponding period. Obtaining these data helped us triangulate and provide context to better understand the makeup of each neighborhood. Finally, the Milliken and Prop A 99% hot spot zones are in close proximity but with two different zip codes and census tracts. However, given how census tracts change designations and how close they are in proximity, there may be some overlap between these zones, but calculating this difference is beyond the scope of this analysis.
Findings
Here, we present our findings and GIS maps to illustrate the spatial patterns that emerged. Our findings reject the null hypothesis that traditional public school closures and charter openings occur randomly and not in any hot spots in Detroit. The findings suggest that charter school openings more often occur in nonrandom hot spot clusters.
Mapping School Closures in Detroit, 1975–2016
To situate school closures in Detroit within its historical context, we first mapped school closures between 1975 and 2016 (i.e., the start of Milliken and the most recent American Community Survey data). We provide a single map that illustrates four decades of school closure data to show how widespread it was during this period. Table 1 outlines the school closures by policy era in Detroit.
School Closures in Detroit With Policy Eras
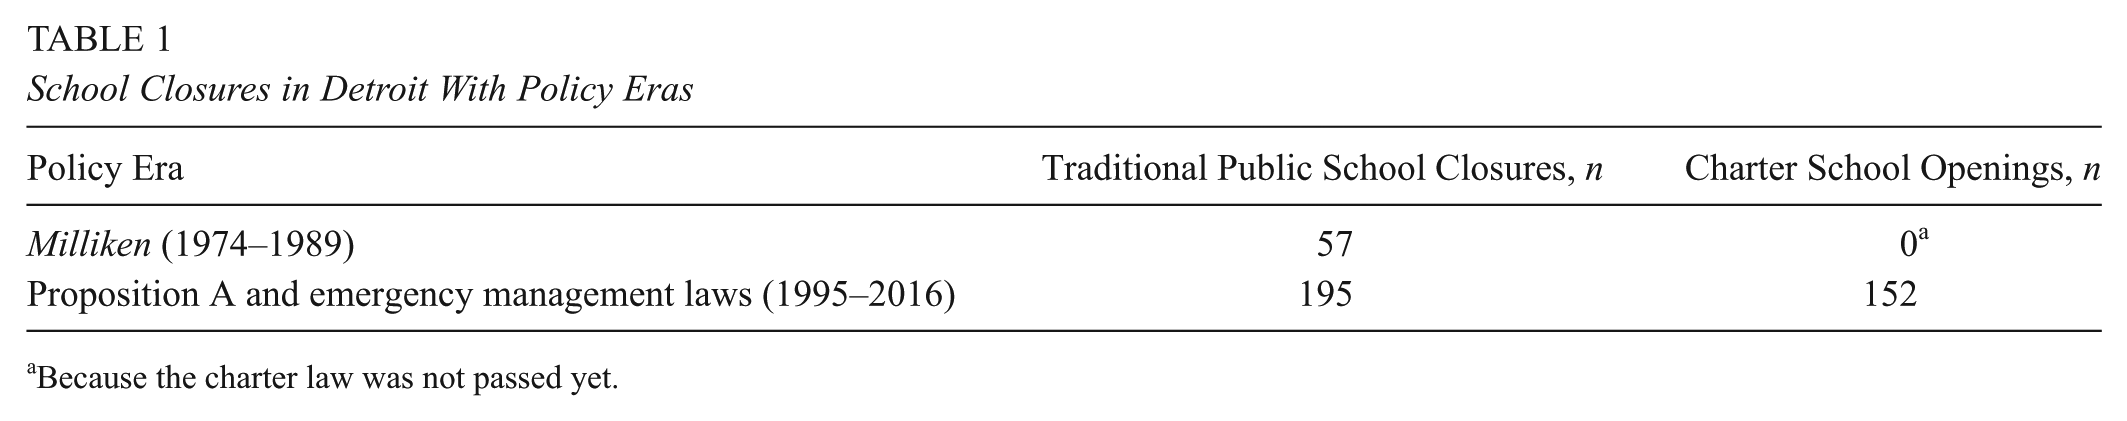
Because the charter law was not passed yet.
The map indicates that 252 traditional public schools closed in Detroit between 1975 and 2016 (see Figure 1). The findings also suggest that all zip codes in Detroit have experienced at least one school closure, except 48212. The zip code 48212 is actually part of Hamtramck, Michigan. 23 Hamtramck is its own city within Detroit, with its own school district, which is largely composed of people with Middle Eastern ancestry. Therefore, no Detroit schools could close in this zip code because it is not part of Detroit’s education system. In all, descriptively, the school closures have occurred randomly in terms of spatial distribution over the past 40 years in Detroit.

School closures in Detroit: 1975–2016.
School Closures During Milliken, 1975–1989
During the Milliken era, 52 traditional public schools were closed (see Figure 2). Our findings illustrate that there were four hot spot neighborhoods for school closures during this period. The hot spots for closure were densely located, across four census tracts, within two zip codes (48208 and 48210) that are near downtown, which historically was home to African Americans during Milliken (Sugrue, 2005). Of these four hot spots, one had 99% statistical confidence, two had 95% confidence, and one had 90% confidence, which illustrates the concentration of closure in this area. It is important to note, however, that due to Milliken students who lived in these zip codes might have been bussed to other schools outside their catchment areas. Additionally, the map illustrates that fewer schools were closed during this period on the city’s northeast and northwest sides of towns, which were mainly populated with White residents at the time (Baugh, 2011; Sugrue, 2005).

Hot spot analysis of school closures in detroit during milliken.
School Closures and Charter Openings During Prop A
Under Prop A, between 1995 and 2016, the findings demonstrate that there were no hot spots for public school closures. During this era, traditional public school closures occurred randomly in terms of spatial distribution (see Figure 3). Despite the fact that 195 traditional public schools have closed since the passage of Prop A, our analysis suggests that these closures did not occur in high-enough concentration to signal any hot spots.

Charter openings and Detroit Public Schools closures in Detroit between 1995 and 2016.
The spatial distribution of charter schools under Prop A identified hot spots for charter openings in the near/downtown areas (see Figure 4). Although charter schools have opened across Detroit since the passage of Prop A (n = 152), our findings suggest a statistically significant concentration of openings in zip codes 48202, 48208, and 48201. The highest hot spot value (99% hotspot confidence) is at the intersection of zip codes 48202 and 48208.
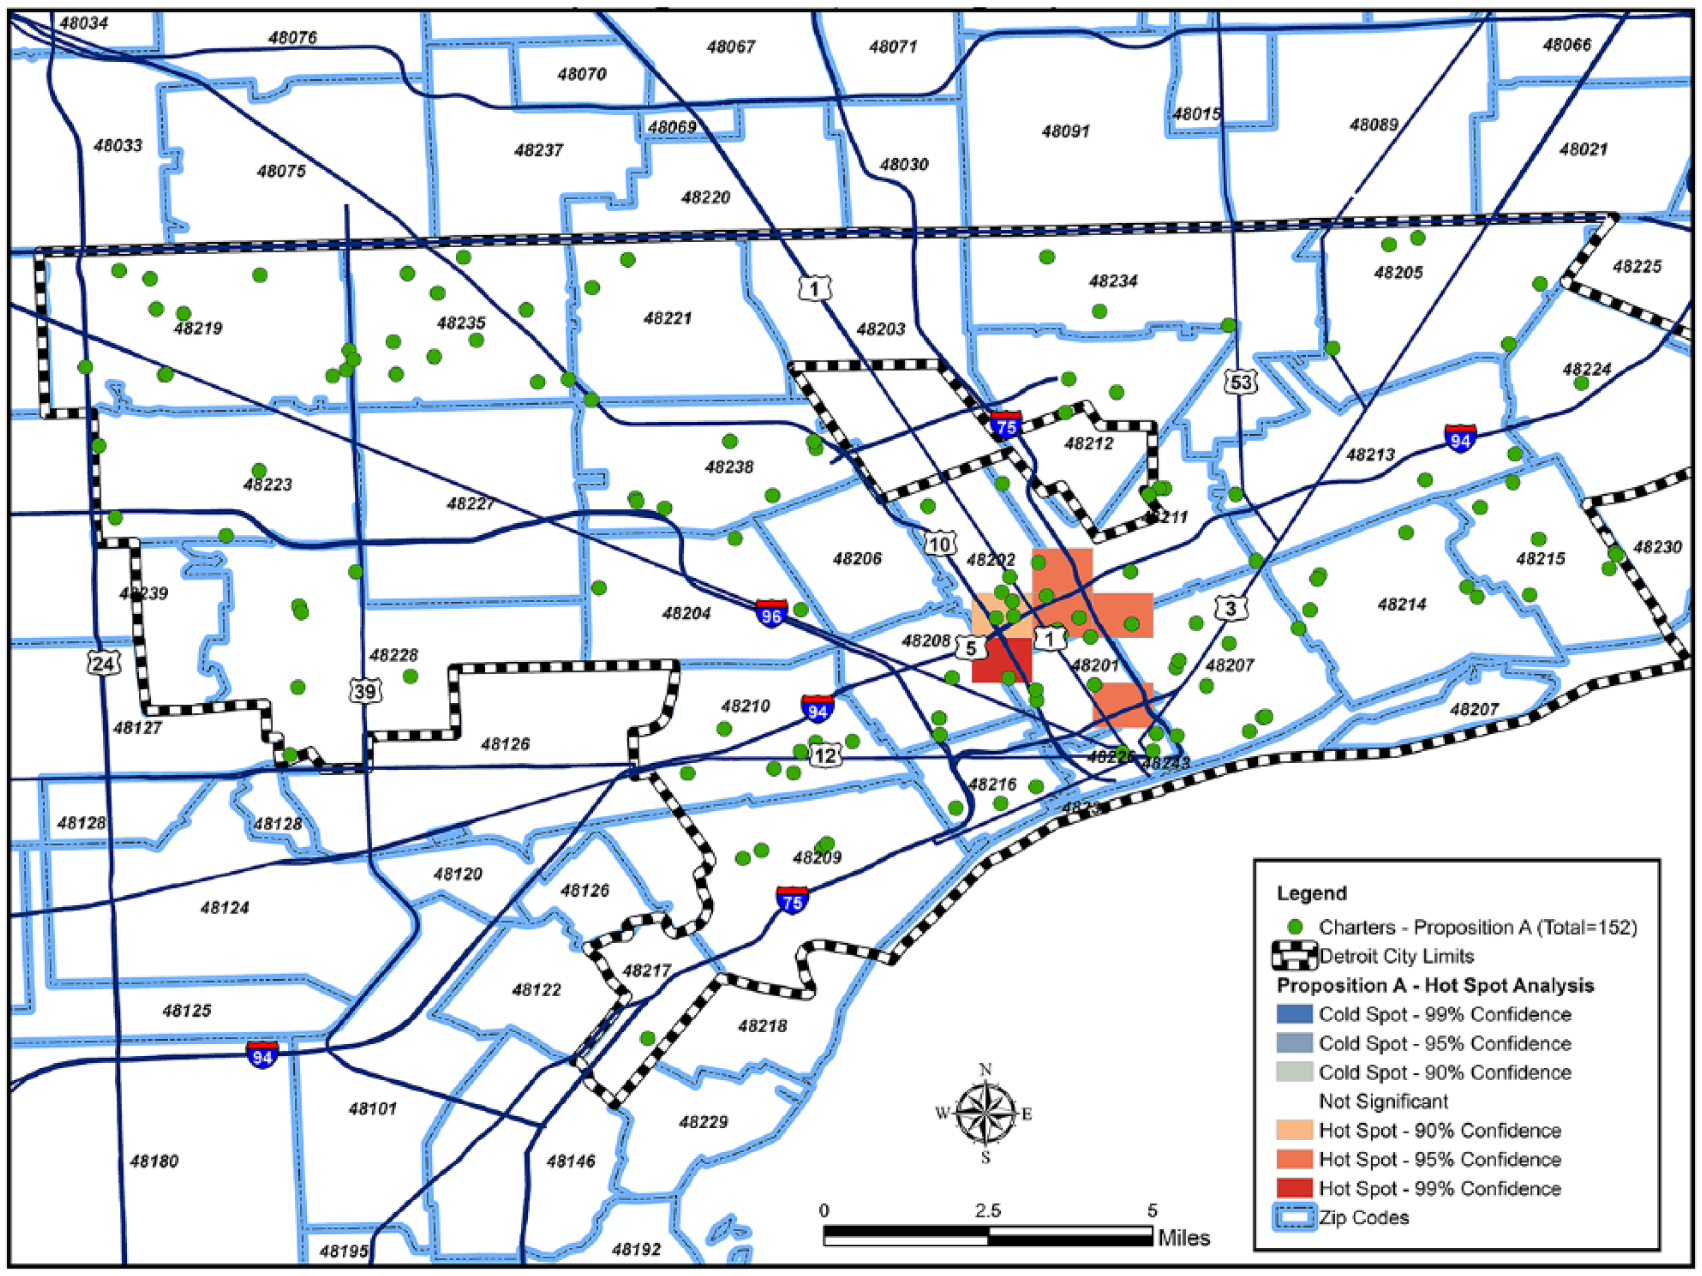
Hot spot analysis of charter openings in Detroit during Proposition A.
In 1990, the number of families living in Prop A’s 99% hot spot area for charter openings was 490, but that number declined to 334 in 2016. 24 In addition, the percentage of individuals who were <18 years old and living in the hot spot area declined from 20% in 1990 to 11% in 2016. Although there are fewer families living in the hot spot area, the percentage living in poverty rose from 31% in 1990 to 44% in 2016. The number of residents living in this hotspot who are <18 years old and living in poverty has remained high through the Prop A period. In 2000, the percentage of these individuals living in poverty was 44%, but in 2010 the number increased to 68%. During this period, the White population living in this hotspot went from 33% in 1990 to 47% in 2016, while the Black population declined, going from 51% in 1990 to 38% in 2016. The Latino/a population remained between 2% and 4% during this period.
There are currently 88 open-active or open-pending charter schools in Detroit. Of these 88 schools, 49 are for-profit charters, 31 are nonprofit, and 8 schools have no information. Only 10 of the for-profit schools have moved into old Detroit public school buildings. However, there are hot spots for charter school openings based on the current operation of charters in the city. 25
School Closures and Charter Openings Under EM Policies
Under EM policies between 1999 and 2016, our analysis found that there were no hot spots for school closures even though 195 traditional public schools closed during this period. However, our maps reveal two key findings about charter school openings in Detroit (see Figure 5). First, there was increased growth in charter schools during this period in the city. During this time, 116 charters opened. This growth in the charter school market may account for newly established charter schools or even existing charters that were reopened as new charter schools.

Hot spot analysis of charter openings in Detroit during the emergency management policies.
Second, our analysis reveals that there are hot spots of charter school openings only in certain parts of the city. Although charter schools have opened all across the city, the findings demonstrate that these hot spots are in greater concentration in predominantly non-White areas. For example, near Detroit’s downtown area, including zip codes 48201, 48216, and 48207, shows statistically significant clustering of charter openings at 95% confidence. With the exception of zip code 48216, which is largely racially mixed, demographic data show that zip codes 48201 and 48207 are majority Black with a small, but growing White population. We also find geographical clustering in zip code 48210, particularly south of I-94 and north of US Highway 12, where residents are majority Black and Latino/a. Further analysis of recent census tract data in zip code 48210 show that in areas with a greater concentration of charter school openings, only 7% of the population were White, as opposed to 23% for the entire zip code.
Discussion
Understanding the relationship between school closure and charter openings is a complex process and endeavor. This endeavor is complicated because of the nuanced factors of population decline, lower student enrollment, and the three policy environments that we described. Locating hot spots are, however, important because they help identify geographic areas that have experienced the most concentrated school closures and charter openings. This is important because it can help policymakers and school district leaders make decisions about enrollment, resource allocation, and where schools might reopen. In this section, we discuss the findings in relation to the reviewed literature on school closure, charter openings, and the theoretical framework.
As illustrated in the maps, despite the abundance of traditional public school closures in Detroit from 1976 to 2016, closures were not spatially clustered into hot spots, except during the Milliken era. However, there are hotspots for charter school openings even though 252 traditional public schools have been closed and only 152 charters have opened. Yet, our analysis illustrates that most places in Detroit where traditional public schools have closed and where charters schools have opened are not in the same location. Additionally, the hottest spots (locations) for charter school openings occurred during the EM policy era. Since our study does account for the type of charter schools that have opened, the higher rate of for-profit charter openings with political oversight of EM might suggest that there was a more welcoming market for charter schools (Lipman, 2011; Pedroni, 2011).
We also find that every zip code in Detroit was affected by school closures but not every zip code in the city has been affected by charter openings. Again, despite the hot spots of charter schools, this is reasonable given that school closures have been occurring at least 20 years longer than charter openings. However, within the theoretical framing of rollout and rollback neoliberalism, this suggests that charter openings do not have to occur as a direct response to school closures. In other words, although rollback and rollout neoliberalism theoretically occurs in tandem, it does not occur on a one-to-one basis in reality, according to our findings. That is, for every traditional public school that closes, there is not a charter school that opens in its place. Instead of rollout and rollback occurring on a one-to-one basis, our data indicate that rollback (i.e., traditional public school closures) most often occurs randomly and in low-density ways but rollout (i.e., charter school openings) occurs in smaller, more concentrated, and higher-density ways (i.e., hot spots). Put simply, rollback seems to be a more random and lower-density process that occurs broadly, while rollout happens in spatially concentrated clusters over smaller geographic areas.
Moreover, given the complexity of the school closure and charter-opening process, at times, it is difficult to associate them with a particular policy era, especially during years when eras overlap. As such, we consider this dynamic an outcome of policy spillover. That is, each policy creates what we call “policy residuals” that shape how each subsequent policy changed the broader educational landscape in Detroit. For example, the large number of traditional public schools that closed during Milliken and its impact helped to shape conditions to catalyze Prop A and EM thereafter because the district was losing resources and students, among other concerns.
Interestingly, only three zip codes (48206, 48203, and 48227) between 1995 and 2016 did not meet both criteria, experiencing only school closures but no charter openings. Based on the reviewed literature on the racialization of school closures and the theoretical framing of this study, there could be several reasons for this. Perhaps land use designations under EM encouraging private investment might explain the differential rates of school closure and charter openings in these three zip codes (Moskowitz, 2017). In the zip code 48203, for example, private investors were selected to “rehabilitate the city’s troubled economy” by converting a closed public elementary school vacant for 20 years into a community center surrounded by energy-efficient, net-zero homes (Michigan Radio Newsroom & Shaffer, 2018). Additionally, the occurrences of charter openings and school closures in Detroit (mostly Black and working class) align with the reviewed literature and theoretical framing that traditional public school closures and charter openings are a racialized and class-based neoliberal process (Peck & Tickell, 2002). Thus, our finding that charter schools primarily opened in communities of color seems reasonable given the fact that there are approximately 25,000 more seats than students in schools serving Detroit, in the event that that oversupply is being marketed to families of color.
Conclusion
This study has implications for future research. First, research might examine openings and closings of charter schools by type, the quality of these schools, and the outcomes that they produce for children. In trying to richly understand the unusually high concentration of charter school openings in an area, more research is needed that uses hot spot analysis to investigate how charter school openings relate to local housing markets over time. Additional research should analyze school closures and charter openings with population changes in the city (e.g., density). There is also a need to explore trends in charter enrollment, school district enrollment, and students’ exit from the district through open enrollment in suburban schools.
Research is needed to better understand how charter organizations make decisions about where they decide to open new schools and what are the implications of those decisions on traditional public schools and housing markets. While we can identify where charter schools are in high density with geospatial analysis, the maps do not allow us to understand the strategy, logic, and reasons for why charter schools open in concentration. Therefore, additional qualitative research is needed to examine these questions. This study also offers several implications for practice. School districts should consider which neighborhoods are hot spots for closure and charter openings before any decisions can be made about either. Districts should therefore use geospatial mapping to help schools, families, and community stakeholders better understand the history of closure and openings and what they could mean for a neighborhood. Finally, we hope that this study will push the field to engage in deeper analysis around this important and timely topic.
Footnotes
1.
See also Pedroni (2011) and ![]() .
.
2.
In fact, in recent years, a combined 600 schools were closed in Detroit, Washington, DC, Milwaukee, Chicago, Kansas City, and Pittsburgh—all majority-of-color school districts (Green, 2017; Journey for Justice, 2014; Pew Charitable Trusts, 2011).
3.
Black and Brown refer to communities of African, African American, and Black as well as Latina/o or Latinx decent, respectively.
4.
These and other northern cities have experienced population decline over the past few decades because of a number of factors, such as deindustrialization.
5.
Closing schools does not result in large savings, especially for big-city district budgets, at least in the short run unless combined with large-scale layoffs. The researchers argue that it is difficult to project long-term fiscal benefits (Pew Charitable Trusts, 2011).
6.
To be clear, federal policies or actors do not directly close local urban schools.
7.
See Engberg, Gill, Zamarro, and Zimmer (2012) for details.
8.
As ![]() notes, this mainstream narrative of Black Detroit is commonly perceived through a “dominant racially-coded narrative of Black, chaotic, crime-ridden industrial hulk with a vision of the metropolitan region as a gleaming, dynamic, hip (and discursively white) global hub of emergent mobility technology” (p. 211).
notes, this mainstream narrative of Black Detroit is commonly perceived through a “dominant racially-coded narrative of Black, chaotic, crime-ridden industrial hulk with a vision of the metropolitan region as a gleaming, dynamic, hip (and discursively white) global hub of emergent mobility technology” (p. 211).
9.
See Anderson (2017) and ![]() for details.
for details.
10.
There were two Milliken cases, one in 1974 and the other in 1977. In Milliken II, the Supreme Court affirmed ordered education components as a remedy to past de jure segregation and required the state to past half the costs.
11.
This includes, for example, parents and civic leaders.
12.
Although Black and White parents both resisted Milliken, they did so for very different reasons. Some Black parents wanted to control their own neighborhood schools because of the unequal treatment that they had with White people in schools. Some White parents, however, resisted because they did not want their children going to school with Black children because they felt they were inferior.
13.
Scholars argue that the Milliken decision cemented the racial and social economic inequities between urban and wealthy suburban school districts and ended mandatory metropolitan school desegregation remedies (Jones, 1992; Khalifa et al., 2016).
14.
Prop A also increased the state sales tax by 2 cents on each dollar and required that the states lowest-funded schools districts receive a basic level of education funding (for details, see Pratt-Dawsey, 2014).
15.
To be clear, we are not making a casual claim but instead describing the policy context in which closures and charters emerged in Detroit.
16.
State takeover in Detroit actually began in 1999 when Governor John Engler signed Public Act 10, which removed the Detroit school board and appointed an CEO.
17.
Although some of these public schools were later converted or reopened as charter schools, there is little evidence that these school-level changes addressed the structural or organizational factors (e.g., funding, quality teachers, academic and support services) that necessitated emergency management.
18.
In addition, emergency managers in Detroit could terminate district contracts and agreements, sell district assets, create and eliminate ordinances at will, and determine the power of the school board (Guyette, 2015).
19.
20.
The Spatial Statistics toolbox contains statistical tools for analyzing spatial distributions, patterns, processes, and relationships. While there may be similarities between spatial and nonspatial (traditional) statistics in terms of concepts and objectives, spatial statistics are unique in that they were developed for use with geographic data.
21.
The Gi_Bin field classifies the data into a range from −3 (cold spot, 99% confidence) to 3 (hot spot, 99% confidence), with 0 being nonsignificant.
22.
Importantly, there are schools just outside of Detroit’s boundaries that serve mostly Detroit students. Based on the type of analysis that we performed, these schools’ inclusion would almost certainly not shift our analysis—not enough of them would be in a single zip code to introduce another significant finding. But some of these schools serve 90% Detroit-address students, and tens of thousands of Detroit students in total leave the city. We wanted to acknowledge that this fact would not affect our findings, rather than omitting it entirely.
23.
Hamtramck has a long history as an immigrant community, which previously was largely populated by Polish immigrants. More recently, the city is mostly home to immigrants from the Middle East. In 2015, its city council became the first majority Muslim council in the United States.
24.
This is based on census and American Community Survey data.
25.
This study does not focus on charter school closings; however, 64 charter schools have closed in Detroit since 1995.
Authors
TERRANCE L. GREEN is an associate professor of educational leadership and policy at the University of Texas at Austin. His research examines the relationship among educational leadership, schools, and neighborhood-communities, with a focus on racial and educational equity.
JOANNA D. SÁNCHEZ is a program manager at Excelencia in Education, a nonprofit in Washington, DC, whose mission is to accelerate Latino student success in higher education. Her research interests include Latino student success in higher education, school-family-community engagement with a focus on working Latino/a parents, and geospatial analysis in educational policy.
ANDRENE J. CASTRO is a PhD candidate in the educational leadership and policy department at the University of Texas at Austin. Her research explores policies and leadership practices affecting the teacher workforce, cultural politics in education, as well as intersections between schools and communities.