
Abstract
Universal public prekindergarten programs have been expanding in recent years, but not all eligible families apply to these programs, for reasons that are not well understood. Using two cohorts of students (N = 8,391) enrolled in Boston Public Schools, we use geographic information systems to combine administrative records with census data to compare the student-, neighborhood-, and school-level characteristics of kindergarteners who did and did not apply to the Boston Public Schools prekindergarten program. We find that nonappliers are more likely to be non-White (SD = 0.27), low income (SD = 0.11), and dual language (SD = 0.58), particularly those who did not attend any other prekindergarten program. We find similar differences at the neighborhood and school levels. Our study provides some of the first descriptive information on the sociodemographic characteristics and spatial distribution of families who opt out of applying to universal prekindergarten programs. Findings may inform recruitment strategies to promote equitable and universal prekindergarten enrollment.
Keywords
Gaps in academic achievement develop before children ever attend school. At kindergarten entry, children from families in the top income quintile are 1.3 SD ahead of children from families in the bottom quintile in reading and math (Duncan & Magnuson, 2011). Attending preschool reduces some of these gaps: prekindergarten programs on average close about 40% of the reading and mathematics kindergarten readiness gap between low-income and middle-class children, and the most successful programs close nearly all of the low-middle gap (Chaudry, Morrissey, Weiland, & Yoshikawa, 2017). Beyond kindergarten entry, quasi-experimental research has found positive spillover effects of preschool attendance on the literacy and math gains of children’s kindergarten peers (Neidell & Waldfogel, 2010), perhaps through direct peer effects or indirect teacher effects (e.g., increased expectations for children, more time to focus on fewer struggling students).
In recent years, states and cities have been expanding public prekindergarten programs, in part due to their track record of reducing income-based school readiness gaps. Currently, 43 states and the District of Columbia offer free public prekindergarten programs, and five of these do so nearly universally, with a slot available for every family with an age-eligible child who wants one. Interestingly, take-up rates in the five state universal programs average only 71%, ranging from 60% in Georgia to 88% in the District of Columbia (Friedman-Krauss et al., 2018). To date, there has been very little research on the students who are eligible to attend a no-cost prekindergarten program but choose not to participate. Some nonattenders likely attend alternate public options or private programs, but others do not attend any center-based 1 program at all. Information on who does not take up universal prekindergarten, particularly among low-income children who likely have fewer alternative options, may help states and localities better target recruitment and outreach efforts.
In the present study, we examine patterns of prekindergarten application behavior and elementary school enrollment for the Boston Public Schools (BPS) prekindergarten program. Using a rich set of descriptive data drawn from district and state administrative records, parent surveys, and the American Community Survey (ACS), we compare the characteristics of BPS kindergarten students who did and did not apply to the BPS prekindergarten program, the neighborhoods in which they live, and the schools they attend in the elementary grades. Within the nonapplier group, we also compare these characteristics by the type of care that a child received in lieu of the BPS program, paying attention to children whose families did not apply to the program and who subsequently did not attend any center-based program in the year before kindergarten.
The Boston context is one of broader policy interest for several reasons. First, Boston’s prekindergarten program has produced substantial positive effects on children’s school readiness skills (Weiland & Yoshikawa, 2013) and is open to all age-eligible children in the city. Second, BPS serves a racially, ethnically, and socioeconomically diverse student body similar to other school districts with universal prekindergarten programs, such as Washington, DC, and New York City. Third, BPS uses a lottery-based school choice system for prekindergarten through high school, allowing us to consider the downstream (and perhaps unintended) elementary school enrollment consequences of families forgoing their first opportunity to engage with the choice mechanism by electing out of prekindergarten application. Finally, we use geographic information systems (GISs) to examine spatial patterns in application behavior—a less commonly used but often uniquely insightful approach in education that can be applied to other localities that are expanding public prekindergarten programs, particularly those using choice mechanisms to allocate slots.
Prior Research on Preschool Attendance
The preschool 2 participation rate has more than tripled in the past 50 years in the United States, although access varies widely across the country (National Center for Education Statistics, 2010). Overall, 69% of 4-year-olds now attend center-based preschool in the year before kindergarten, with 44% of 4-year-olds accessing preschool through public funding (Friedman-Krauss et al., 2018). The remaining 31% of 4-year-olds may be in home-based nonrelative care settings, such as family day cares, or may be taken care of by neighbors, parents, or other relatives (Laughlin, 2013). Differences in preschool attendance by family income are large, with 83% of children in the top income quintile attending versus 50% of those in the bottom quintile (Whitehurst & Klein, 2015). These differences matter in terms of children’s experiences and development: nationally, center-based preschool programs on average are the least variable and highest quality among nonparental care options (Chaudry et al., 2017), and attending preschool better prepares children for kindergarten, as compared with other options (Yoshikawa, Weiland, & Brooks-Gunn, 2016). Isolating an explanation for preschool attendance gaps is a challenge given economic and social conditions that confound true differences in preferences with inequities in access—for example, in much of the literature, it is unclear whether families did not enroll their children in center-based prekindergarten settings because they prefer other settings or because they cannot afford to do so. For this reason, we turn to a broad literature across multiple disciplines, focusing on the dimensions of early care markets, market failures, and behavioral factors that affect child care choices and the observed differences in child care preferences that intersect with demographic characteristics.
Early Care Markets
Given the unequal coverage of free public programs nationwide, both the cost and the supply of options are presumably major drivers of who attends prekindergarten and who does not. Full-day prekindergarten for a 4-year-old costs $8,000 on average, which is almost 15% of pretax average family income and >25% of earnings for families in the bottom two income quartiles (Child Care Aware of America, 2014; Noss, 2014). Access to transportation may be an additional cost barrier, particularly among low-income families who report practical concerns, such as program location being among the most important factors in their care decisions (Peyton, Jacobs, O’Brien, & Roy, 2001; Tang, Coley, & Votruba-Drzal, 2012).
The supply of low- or no-cost programs may also influence selection into center-based care (Coley, Votruba-Drzal, Collins, & Miller, 2014). For example, only 31% of eligible 3- to 5-year-olds in the United States are served by the Head Start program, and capacity varies considerably by state (National Head Start Association, 2017). Furthermore, supply considerations are not limited to total quantity of seats. Perception of program quality is also related to the take-up of prekindergarten (Crosnoe, Purtell, Davis-Kean, Ansari, & Benner, 2016). If parents do not perceive the supply of public programs nearest to them to be high quality, they may be less likely to enroll their children.
Market Failures and Behavioral Factors
There may be transactional costs and information gaps associated with applying to and enrolling children in prekindergarten that explain why some families forego prekindergarten even when public options are available. As trends of public assistance programs in the United States demonstrate (e.g., Medicaid, Temporary Assistance for Needy Families, and Supplemental Security Income), transaction costs such as information acquisition and application completion are important in explaining take-up rates (Aizer, 2007; Currie, 2004). In the context of public prekindergarten, learning about the benefits of prekindergarten and how the application process should be navigated can present a cost that is a deterrent in and of itself to families (Currie, 2004), particularly when that process is embedded in a broader school choice mechanism that may seem opaque to families (Pattillo, 2015). This informational gap may be particularly salient for families with less access to cultural knowledge about how the education system functions (Lareau, 2015), especially if they have not been exposed to school choice systems or research documenting the benefits of preschool attendance. This process may then lead parents to opt out of the public option entirely, rather than navigate the lottery process (Shafir & Tversky, 1992).
In addition, when faced with a range of options that include formal and informal care, families may not prioritize a choice whose largest benefits for children do not occur in the immediate term (Mullainathan & Thaler, 2000; Simon, 1955). For example, the additional academic and socioemotional benefits of a program may not be recognizable to families until later in schooling, so we might expect them to choose an informal child care option that better suits their work hours but is less focused on kindergarten readiness in part because of this time delay.
Importantly, foregoing prekindergarten can have additional consequences when a prekindergarten program is part of school choice system, if attending prekindergarten leads to differential school choices or selections for kindergarten and beyond settings. In other words, attending prekindergarten might in some systems allow children to get a “foot in the door” into higher-quality schools going forward (Bailey, Duncan, Odgers, & Yu, 2017) versus not attending. If so, there is increased urgency around identifying disadvantaged students who are passing on these additional potential benefits of prekindergarten.
Family Characteristics, Neighborhood Characteristics, and Choice Factors
Family structure (Han, 2004), cultural preferences (Brooks-Gunn & Markman, 2005), and neighborhood characteristics (Liu & Anderson, 2012) play a role in early childhood education and care decisions. Work schedules and family size are correlated with early education and care choices. For example, irregular scheduling demands created by part-time employment, employment with irregular hours, and welfare-to-work programs are associated with higher rates of selection into home care (Fuller, Kagan, Caspary, & Gauthier, 2002; Han, 2004). Similarly, families with more children and married mothers are more likely to use parental care (Han, 2004).
Among parents of young children, there are widely noted different preferences, beliefs, and practices by racial/ethnic and social class groups (Brooks-Gunn & Markman, 2005) that imply heterogeneous early child care preferences. In one study of the parents of 3- to 5-year-olds, White parents assigned more value to socioemotional goals, such as turn taking and sharing, than Black and Latino parents, and Black and Latino parents assigned more value to learning basic academic skills than White parents (Liang, Fuller, & Singer, 2000). Others found that White parents were more likely to place value on socioemotional characteristics of programs, such as positive emotional climate, while Black and Latino parents prioritize comprehensive services, convenience, and home-school relationships (Barbarin et al., 2006). Differences by maternal education and home language also suggest wide variation in early care preferences, with higher maternal educational attainment associated with center-based enrollment (Greenberg, 2011; Johansen, Leibowitz, & Waite, 1996) and limited English proficiency associated with relative care (Sandstrom & Gelatt, 2017).
Neighborhood characteristics are also correlated with early care choices. For example, families in neighborhoods with higher immigrant populations and those with lower average incomes are less likely to utilize center care (Liu & Anderson, 2012), perhaps as a result of strong social networks that provide families with more informal options. For example, low-income families are more likely to identify the safety, trustworthiness, and flexibility of their care arrangement as being as or more important than program quality (Lowe & Weisner, 2004). Furthermore, families in neighborhoods with strong social networks may be more likely to use informal nonrelative care, such as family day care, as an alternative to center-based care (Brandon, 2004; Burchinal, Nelson, Carlson, & Brooks-Gunn, 2008; Suárez-Orozco & Suárez-Orozco, 2009; Takanishi, 2004). Finally, considerations such as neighborhood safety may influence care choices as families consider their ability to safely access care (Bandy & Moore, 2009).
Current Study
Data on nonappliers in universal prekindergarten contexts are arguably best suited to identify the demographic characteristics that may be associated with prekindergarten take-up because of the elimination of direct cost constraints from the equation and the ability to assess the potential downstream consequences of prekindergarten application on future school enrollment. In this study, we focus on the prekindergarten application behaviors of the 80% to 85% of kindergarten-aged students in Boston who enrolled in traditional public schools for elementary school between 2008 and 2011 (U.S. Census Bureau, 2011). Using data from two cohorts of BPS kindergarten enrollees in the 2008–2009 and 2009–2010 school years, we address the following three research questions:
Research Question 1: How do kindergarteners who did and did not apply to BPS prekindergarten differ on observable baseline demographic characteristics and measures of student achievement in third grade?
Research Question 2: Where do kindergarteners who did and did not apply to BPS prekindergarten live in the city, and how do they differ on observed neighborhood characteristics?
Research Question 3: What are the characteristics of the schools attended by kindergarteners who did and did not apply to BPS prekindergarten in elementary school?
We refer to these kindergarten groups as the appliers (those who applied to attend prekindergarten in BPS) and the nonappliers (those who did not apply to attend prekindergarten in BPS) throughout the article. We focus on kindergarten enrollees because they represent children whose families, by revealed behavior, are interested in a public education in BPS and thus are strong candidates for applying to and/or enrolling in the prekindergarten program provided by the same district. For each research question, we conduct subgroup comparisons within the nonapplier group by prekindergarten care setting (i.e., private centers, Head Start centers, family day cares, or at home with a family member). By disentangling the characteristics of students by alternative settings, we are able to produce a more nuanced picture of the nonapplier population in comparison with its applier peers.
Methods
The Boston Prekindergarten Program
Application to the BPS prekindergarten program is open to any child in the city, regardless of income or other risk factors. During our study years, it was based entirely in the public schools, paid teachers on the same scale as K–12 teachers, and subjected teachers to the same educational requirements of K–12 teachers (e.g., a master degree within 5 years and grade range certification). It offered enrolled families a full school day of care, with before- and after-school options available in most schools. Prekindergarten students who lived more than a half mile from school were also provided bus transportation following the same guidelines as elementary-age children (BPS, 2018). A previous study of the prekindergarten program found that students who attended BPS prekindergarten entered kindergarten with higher literacy, language, math, executive function, and socioemotional skills than did students who did not attend the program (Weiland & Yoshikawa, 2013).
Although the program has been expanding since 2005, with 2,800 seats available in the 2016–2017 school year, there continue to be fewer available seats in the program than eligible children (BPS, 2016). This capacity limitation means that while all children can apply to attend, assignment to prekindergarten is not guaranteed for all who apply (BPS, 2018). During our study years, the program served approximately 2,000 prekindergarten students, as compared with a population of approximately 4,000 kindergarten students enrolled in BPS. Notably, the majority of publicly funded prekindergarten programs are targeted by income or risk factors (Friedman-Krauss et al., 2018); BPS’s universal offer of free prekindergarten therefore offers the opportunity to learn from those who do not apply, even though not every child is guaranteed a seat.
Importantly, BPS uses a school choice mechanism to assign children to schools, employing a lottery when demand for seats exceeds supply. Application to BPS prekindergarten uses the same process that the district uses for K–12 school assignment, meaning that electing out of prekindergarten application merely defers rather than bypasses the school choice process. Therefore, we anticipate that participating in the school assignment process early, by applying to prekindergarten, could have two benefits. Those who win seats in prekindergarten are guaranteed spots in that school through the highest offered grade, meaning that prekindergarten application represents an early opportunity to win a seat in one’s preferred elementary school. 3 For those families who apply to popular elementary schools for prekindergarten and do not win a seat in the program, they have the opportunity to try again for kindergarten when additional seats become available.
Sample
The study sample included 8,391 students who were enrolled in kindergarten in BPS for at least 1 day in the 2008–2009 and 2009–2010 school years. Of these 8,391 students, 50% (n = 4,220) applied to and/or attended BPS prekindergarten in the previous school year, while 50% (n = 4,171) did not. In the current study, we focus on families who ultimately choose the public school system for elementary school, as indicated by their kindergarten enrollment in BPS. We are particularly interested in the differences between public school families who do and do not apply to the program because the nonappliers ultimately delayed their entry into BPS by 1 year, rather than choosing to enroll in a different sector for K–12. Therefore, we see this population of students as representing those Boston students most likely to apply to the BPS prekindergarten program. Figure 1 in Appendix A describes the application and enrollment pathways for the full universe of potential BPS kindergarten students, with our study sample highlighted in the shaded boxes.
Most families applied to the Boston prekindergarten program via the lottery, which occurs in four rounds in the 6 to 9 months prior to the start of the school year. The lottery process allows parents to rank up to 10 program choices, to which a family may have priority status based on home location and sibling enrollment. In the cases where space is still available after the lottery, children can also apply and enroll later in the summer or during the school year. Ultimately, BPS’s prekindergarten application system gives families a range of school options from which to choose but does not guarantee a family its top choice or, in some cases, any choices. Thus, we focus on prekindergarten application behavior rather than enrollment to capture the full population of students who indicated interest in the program.
Prekindergarten recruitment efforts
BPS engages in a variety of outreach efforts to recruit families to apply to prekindergarten through the citywide Countdown to Kindergarten program (Bardige, Baker, & Mardell, 2018). Beginning in the year before a child is eligible to attend prekindergarten, parents can attend information sessions about the application process (held in multiple languages, depending on neighborhood composition) and visit schools. Countdown also hosts playgroups at elementary schools, community centers, and libraries around the city, special events and collaborations with local museums, and neighborhood events in the late summer to celebrate the start of school for new enrollees (Countdown to Kindergarten, 2018). Finally, Countdown posts ads around the city, including on the subway, with information provided in multiple languages about enrollment and key application dates, and it works with housing development agencies, hospitals, and community partners to reach families (personal communication with Sonia Gomez-Banrey, July 31, 2018). Countdown’s recruitment is conducted citywide and is not focused in any particular neighborhood or among particular groups (personal communication with Sonia Gomez-Banrey, December 3, 2018).
Data
Demographic characteristics and third-grade achievement
We use student-level district administrative data to generate binary indicators of gender (male), race/ethnicity (Asian, Black, Hispanic, White, or mixed/other), dual language (as determined by home language and English language learner status at kindergarten), birth country (United States or other), first language (English, Spanish, Vietnamese, and other), free or reduced-price lunch (FRPL) status, and special education status. For FRPL status and special education status, which are time-variant characteristics, we used the student’s status from their first BPS year.
We also include several measures of student achievement and schooling experiences at third grade. In our study years, students in BPS took the Massachusetts Comprehensive State Assessment (MCAS) beginning in third grade. For English language arts and math, we standardized each student’s third-grade score on the mean and standard deviation of all third graders within BPS taking the given exam in that year. If students were retained, we used their scores from their first third-grade test administration. Test score data in this article accordingly can be interpreted as a given group’s performance as compared with the average BPS third grader. From administrative records, we also constructed a binary indicator to indicate if a student had been retained in K–2 and a binary indicator for ever receiving special education services in K–3 (defined as having an individualized education plan). Finally, we include a binary indicator to indicate if a student is still enrolled in BPS in third grade as a measure of retention in the district.
Geographic indicator
We also used the district administrative data to identify where each study participant lived in Boston in prekindergarten or kindergarten. While the data did not include student addresses, we took advantage of the administrative “geocode” associated with each student record, which is used in the school assignment process, to narrow the home address of students to a roughly three-block area (average size of 0.06 square miles). When possible, we took the geocode from the participant’s prekindergarten-eligible year school records (n = 4,806, 57% of sample). If the student did not have a BPS school record for his or her prekindergarten eligible year, we used either the 3-year-old school record, for the sample members who attended the city’s small 3-year-old program (n = 180, 2% of sample), or the kindergarten school record (n = 3,402, 41% of sample). Given the nature of our comparison groups, the geocode from our nonapplier sample is primarily from the student’s kindergarten record, while the geocode for appliers is primarily from the student’s prekindergarten record.
Ideally, we would be able to determine where all students lived in their prekindergarten-eligible year, given the possibility that families moved to or within Boston between the prekindergarten and kindergarten years. While we cannot assess what proportion of nonappliers moved just before kindergarten, we can infer from the proportion of appliers who have different geocode values in their prekindergarten and kindergarten years (12%) that a small but nonnegligible proportion of nonappliers likely moved to or within Boston between the prekindergarten-eligible year and kindergarten year. Despite this asymmetry in data availability, we chose to use the earliest geocode available because home address influences both priority status to each school in the school assignment process and the number of non-BPS options near a child’s home. However, we also conducted our analyses using the kindergarten geocode for all students and found similar results (available upon request).
School context data
We used publicly available data from the Massachusetts Department of Elementary and Secondary Education to capture the characteristics of the schools in which each student enrolled for kindergarten and third grade, linking each student with the school in which she or he was enrolled for the longest period that year. We included sociodemographic indicators (percentage of students from low-income families, English language learners, students who speak a non–English language at home, students with disabilities, male students, and students who are Asian, Black, Hispanic, or White) and indicators of academic performance (percentage of third-grade students who were proficient or higher on the English language arts and mathematics sections of the Massachusetts Comprehensive Assessment System). Finally, we included measures of a school’s percentage of licensed teachers, teachers retained from the previous school years, and students who remain in the school throughout the school year (stability rate), as well as the average class size.
In addition to these publicly available school-level characteristics, several measures specific to our study were generated. First, we calculated the number of prekindergarten programs (classrooms) offered in each BPS school and the ratio of kindergarten seats to prekindergarten seats in 2008–2009 and 2009–2010 as measures of the size of the prekindergarten program and the relative change in size between prekindergarten and kindergarten cohorts, respectively. For example, a school with 1 prekindergarten classroom of 15 students and 1 kindergarten classroom of 30 students would have a prekindergarten program value of 1 and a kindergarten:prekindergarten seat ratio of 2:1. To assess the relative popularity of the prekindergarten programs, we used the prekindergarten application data to determine number of applications per seat in each program. Finally, we created a binary indicator of whether the school is an Early Learning Center, which typically serves only students from prekindergarten through kindergarten or first grade. Early Learning Centers also provide a 10-hour day, similar to many community-based organizations, whereas other BPS schools provide only a 6.5-hour day. We hypothesized that parents might view Early Learning Centers as particularly convenient and appropriate settings for prekindergarten.
Prekindergarten care setting
Outside of BPS, there is a robust early education market in Boston. In addition to the 64 BPS schools that offered 4-year-old classrooms through the BPS prekindergarten program in our study years, there were two charter elementary schools with prekindergarten classrooms, 206 licensed center-based prekindergarten programs (serving >10 children in a formal setting), 898 licensed family day cares (serving 6-10 children in the provider’s home), 42 Head Start classrooms, and 137 other licensed programs (otherwise unaffiliated with a public or private education system; Massachusetts Department of Early Education and Care, 2009a). 4
When students applied to BPS for kindergarten, their parents answered a set of questions about their children’s last care experience. Parents were asked to input the name and location of their child’s last school, the grade completed, and the type of program from a list of 6 options (Head Start, private and public prekindergarten, licensed and unlicensed family day care, and none). For the students who did not attend BPS for prekindergarten, we used these data to identify their prekindergarten care setting. Because parents often disagreed about setting care type, these data were extensively cleaned to reconcile conflicting parent reports and to verify program type with official resources (for detail, see Weiland & Yoshikawa, 2013). We also used district administrative records from the prekindergarten year to identify which students enrolled in BPS prekindergarten.
Using the geolocator feature of ArcGIS software, we also geocoded the prekindergarten market to account for the number of early care options available to families within 1 mile of their homes. Specifically, we geocoded the addresses of all public schools and charter schools in Boston that enrolled prekindergarten students, Head Start centers with 4-year-old classrooms, private and family day care centers serving 4-year-old students and having valid licenses in 2007 and 2008 (Massachusetts Department of Early Education and Care, 2009b), and nonpublic schools recognized by the Massachusetts Department of Elementary and Secondary Education that enrolled prekindergarten students in 2007 and 2008. Figure S1 in Appendix B shows where these centers are located in the city by setting type.
Neighborhood data
We used 5-year ACS block group estimates (2009–2013) to measure the characteristics of the surrounding neighborhood of kindergarten enrollees. Block groups are the smallest census geography for which ACS 5-year estimates are available, are nested within census tracts, and are generally defined to contain between 600 and 3,000 people (U.S. Census Bureau, 2018). Unlike the decennial census, which counts all persons in the United States in a census year, ACS estimates are generated with a random sample of 3.5 million households and collected on a monthly basis. The 5-year estimates are generated with 60 months of collected data over 5 years and estimate the average number of people in a given category within a census geography (U.S. Census Bureau, 2009).
To generate a picture of the neighborhood characteristics of our sample participants, we include indicators of race (Asian, Black, White, multirace, and other), ethnicity (Hispanic/Latino), marital status (never married, married), home language (limited English proficiency, English only, Spanish, Indo-European languages, Asian/Pacific Island language, and other languages), educational attainment (no degree, high school diploma, some college, associate degree, bachelor degree or above), employment (labor force participation, unemployment rate), geographic mobility within the past 12 months, housing occupancy (renter occupied, vacant), percentage of residents with incomes under the federal poverty line, and percentage of residents in female-headed households with incomes under the federal poverty line. Appendix C provides a complete list of the variables that we used, including type and source.
Analytic Approach
Our analytic approach combines descriptive statistics and mapped visualizations of student-, school-, and neighborhood-level characteristics.
Neighborhood characteristics
To link neighborhoods to individual students, we digitized a map of the 856 geocode units described here from a 2012 document made publicly available by the City of Boston to generate a geocode shapefile for the city. We used this geocode file as our base map for the majority of visualizations, aggregating student- and neighborhood-level characteristics to the geocode level.
To generate the neighborhood-level characteristics, we used the spatial intersection feature of the ArcGIS software to intersect Boston block groups from the U.S. Census Bureau’s TIGER/Line shapefile and our digitized geocode shapefile. For each block group–geocode intersection, we calculated the proportion of total block group area covered by the intersecting geocode. In all, 45% of geocodes (380) lie within one block group; 37%, two block groups (317); 13%, three block groups (109); 4%, four block groups (35); and the remaining 1%, split across five or six block groups.
For each geocode, we used the calculated proportions to reweight the ACS data and generate geocode-level estimates for the neighborhood characteristics as follows:

where Estg is the weighted geocode-level estimate, Estx is the original ACS estimate, and Wx is the proportion of that block group estimate covered by geocode g. Figure S1 in Appendix D shows a stylized example of these intersections and the subsequent geocode-level estimate calculation.
To assess the effect of reweighting the ACS data to generate geocode-level estimates, we compared the subsequent geocode-level values to the ACS estimates from which they were derived. Figure S2 in Appendix D demonstrates this comparison visually for race percentage (White) and ethnicity percentage (Hispanic). These visual comparisons give us reasonable confidence that the reweighting procedure was successful. However, given the imprecision introduced by sampling error in the original ACS estimates and our reweighting procedure, we use bootstrap estimation where group means and corresponding standard errors are estimated with multiple replications of randomly generated (with replacement) subsamples of our study sample.
Descriptive statistics
We used simple linear regression to estimate the difference in means between nonappliers and appliers on student-level (Research Question 1), neighborhood-level (Research Question 2), and school-level (Research Question 3) characteristics:

where Yi is the characteristic of interest, β0 is the mean for K1 appliers, nonapplier is a binary indicator set to 1 if the kindergartener did not apply to BPS prekindergarten, β1 is the estimated difference in means between appliers and nonappliers, and ε i is the student-level error term. We used a linear probability model for binary outcomes.
Results
Descriptive Statistics
Table 1 describes our sample by prekindergarten application status and prekindergarten care setting. Panel 1 shows the care setting of prekindergarten appliers, who represent 51% of the kindergarten enrollee sample. Overall, 92% of those who applied to the program enrolled in BPS prekindergarten. Panel 2 describes the care settings of prekindergarten nonappliers. For 17% of nonappliers, prekindergarten care setting is unknown. Among those who have care setting data, 32% attended private programs; 36%, Head Start; 3%, other public schools in Massachusetts; 7%, family day cares; and the remaining 22%, no prekindergarten experience. In our subsequent analyses, we compare appliers and nonappliers as well as appliers and nonappliers who enrolled in private care, Head Start, family day care, no formal care, and unknown settings to capture the diversity of prekindergarten experience within the nonapplier group. Given the small number of students attending other public options, we do not analyze this group separately. Furthermore, students who attended programs in other public school districts are not the primary group of interest given that these students lived outside the BPS district during their prekindergarten year.
Comparison of 4-Year-Old Care Settings for BPS Kindergarten Enrollees Who Did and Did Not Apply to BPS Prekindergarten

Note. Missing data for 689 preschool nonappliers (17% of all nonappliers). Proportions are calculated for nonmissing data. BPS = Boston Public Schools.
Research Question 1
Table 2 summarizes our findings for our first research question (what are the characteristics of kindergarten appliers and nonappliers?) by comparing the student-level characteristics derived from the BPS administrative data. Columns 2 and 3 show the average percentage of students with each characteristic for the prekindergarten appliers and nonappliers. Columns 4–8 show the average percentage of students with each characteristic within the nonapplier group by prekindergarten care type. Bold indicates differences in the values for each group that are statistically significant at the p < .001 level as compared with the applier group.
Comparison of BPS Kindergarten Enrollees Who Did and Did Not Apply to BPS Prekindergarten on Observable Baseline Characteristics

Note. Values are presented as percentages unless noted otherwise. Bold values are significantly different from the applier group at the p < .001 level. In addition to the five nonapplier counterfactual subgroups presented here, 120 students enrolled in other public districts in Massachusetts and 2 in a charter school. Means for this group are available upon request. BPS = Boston Public Schools.
Overall, nonappliers are less likely than appliers to be White (11% vs. 15%), more likely to be Black (35% vs. 29%), less likely to be Asian (7% vs. 9%), more likely to speak English as a first language (62% vs. 59%), and less likely to speak Vietnamese (2% vs. 5%). They are also more likely to qualify for FRPL (82% vs. 74%), substantially less likely to receive special education services in their first BPS year (7% vs. 17%), and somewhat more likely to have been born outside the United States (8% vs. 5%). With regard to special education service receipt, this difference is likely due to policies that guarantee young children with disabilities access to early care settings, rather than an effect of prekindergarten access itself. Nonappliers also score, on average, 0.15 SD lower on the third-grade English language arts assessment and 0.17 SD lower on the third-grade math assessment, are less likely to receive special education services in kindergarten through third grade (20% vs. 27%), are more likely to have been retained in kindergarten through second grade (15% vs. 9%), and are slightly less likely to be still enrolled in BPS in third grade (78% vs. 81%). Many of these differences are large in standardized terms, ranging from 0.20 to 1.0 SD of the applier mean.
Within the nonapplier group, there is considerable heterogeneity (see columns 4–8 in Table 2). Across all groups, nonappliers who attended private care are the most likely to be White, the least likely to be Hispanic, and the least likely to be dual language. They are also the least likely to qualify for FRPL and to be receiving special education services but the most likely to speak English as a first language. Importantly, there is also heterogeneity within the nonapplier private care group. In Boston, income-eligible students can attend private care using tuition vouchers through child care subsidy dollars. When we compare private care students who do and do not qualify for FRPL as a proxy for potential tuition voucher usage, we find that FRPL-eligible private care students are much more likely to be Black and Hispanic and dual language (similar to the other nonapplier care groups), while non-FRPL-eligible private care students are substantially more likely to be White (46% vs 15% of appliers) and to speak English as a first language (88% vs 59% of appliers; see Appendix E). In contrast, nonappliers attending Head Start and family day cares are the least likely to be White and the most likely to be Hispanic and are most likely to qualify for FRPL. Nonappliers for whom care setting is unknown or who reported no care were also more likely to qualify for FRPL but were among the most likely to speak either Spanish or another language as their first language.
At third grade, these groups vary considerably, with private care students scoring significantly higher on third-grade assessments than appliers and other nonapplier groups and with nonappliers who attended family day care or stayed home scoring lower than appliers and the average nonapplier (Table 2). Private care nonappliers are also the least likely to have received special education services and to be retained in grade. These differences are even more pronounced when the private care group is split by potential voucher usage (Appendix E). Private care nonappliers who did not qualify for FRPL scored, on average, 0.75 SD higher than the average BPS third grader on math and English language arts assessments and were the least likely to receive special education services, be retained in grade, or be enrolled in BPS in third grade. Private care nonappliers who did qualify for subsidized lunch look more similar to the average nonapplier.
Research Question 2
An analysis of the neighborhood-level data shows that appliers and nonappliers are concentrated in different neighborhoods in Boston, which vary by language and demographic makeup. Using the Hot Spot Analysis tool in ArcGis, we identified which geocodes have statistically significantly different high and low densities of the relevant group in comparison with surrounding geocodes, which are visualized in red and blue, respectively. Panels 1 and 2 in Figure 1 highlight the spatial differences in application behavior by neighborhood, with pronounced differences in nonapplier “cold spots,” or areas with comparatively few nonappliers. Panels 3–6 visualize the density of nonappliers in each care type, indicating that there are also neighborhood-level differences within the nonapplier group by prekindergarten setting.

Distribution of appliers and nonappliers by care type: (1) appliers, (2) nonappliers, (3) nonappliers: no care, (4) nonappliers: family day care, (5) nonappliers: Head Start, (6) nonappliers: private care. The Hot Spot Analysis tool of ArcGIS calculates a Getis-Ord-Gi* statistic for each spatial feature. To determine statistically significant differences in densities for a given group within a spatial feature, the local sum of the group for the feature and its neighbors is compared with the sum of all features, with a resulting z score and p value based on the difference between the expected local sum and observed local sum. Relevant maps for the students missing counterfactual data and for students who attended another public school district for prekindergarten are available upon request.
To characterize these differences, we present the average characteristics of the neighborhoods in which our sample lives in Table 3. We find that nonappliers live in neighborhoods with more non-White people, more people who speak a language other than English, slightly lower educational attainment, fewer owner-occupied housing units, more unemployed people, and more people living under the poverty line. Although the magnitudes of these differences are not as large as the student-level differences (1–4 percentage points, or 0.01–0.24 SD of the applier mean), when taken together they indicate a pattern in which nonappliers live in less advantaged communities. Again, similar to the student-level characteristics, we find that the private care nonappliers live in the most advantaged neighborhoods on average, while the nonappliers in other forms of care, no care, or unknown care live in the least advantaged communities.
Comparison of BPS Kindergarten Enrollees Who Did and Did Not Apply to BPS Prekindergarten on Observable Neighborhood-Level Characteristics

Note. Values are presented as percentages unless noted otherwise. Data are missing for 3% of the sample. Bold values are significantly different from the applier mean at the p < .001 level. In addition to the five nonapplier counterfactual subgroups presented here, 120 students enrolled in other public districts in Massachusetts and 2 in a charter school. Means for this group are available upon request. BPS = Boston Public Schools.
One might hypothesize that differences in prekindergarten application would be due, in part, to differences in the number of early care options available to families. To investigate this potential, we identified all of the early care options within a mile of the centroid of each geocode and compared the average number of each type of option for applier and nonappliers (Table 4). We did not find meaningful differences in the number of early care options by application status. Rather, we found an average of nearly 60 centers near a child’s home, including 8 BPS schools, 2 or 3 private elementary schools, 7 or 8 private early care centers, 37 family day cares, and 2 Head Start centers. We see this as evidence that, in Boston, differences in application to prekindergarten are unlikely to be a function of differential availability of other options.
Number of EEC Options by Application Status

Note. Number of care options within each type were calculated by identifying all care centers in Appendix B with addresses within 1 mile of the geocode centroid in which a student lived in her or his prekindergarten or kindergarten year. The 1-mile “as the crow flies” radius was used to mirror the distance that Boston Public Schools uses to determine which schools are in a child’s “walk zone.” BPS = Boston Public Schools; EEC = early education and care.
p < .05. **p < .01. ***p < .001.
Research Question 3
Finally, we hypothesized that if prekindergarten application represents an early entry into the choice mechanism, prekindergarten application behavior may be correlated with the characteristics of the elementary schools that students attend in kindergarten (e.g., the “downstream” hypothesis). To answer this research question, we first looked at school-level rates of application behaviors and type of prekindergarten care. By kindergarten- and third grade–enrolled school, Figure 2 visualizes the variation across schools in standard deviations from the BPS-wide mean rates of kindergarteners appliers and nonappliers. Figure 3 shows these differences for the nonapplier care–type groups. These figures suggest that student application behavior varies by school, with some schools serving large populations of nonappliers in their kindergarten classrooms.

Difference in school-level rates of appliers and nonappliers from BPS-wide rates in kindergarten and third-grade school. Dots represent the proportion of kindergarten enrollees who did and did not apply to prekindergarten in kindergarten- and third grade–enrolled schools. The largest and darkest dots are those schools where the difference in the proportion of kindergarten enrollees who did or did not apply to prekindergarten is ±2.0 SD of the proportion for all BPS elementary schools, while the smallest and lightest dots are those schools where the difference in proportions is within 1.0 SD. BPS = Boston Public Schools.

Difference in school-level rates of nonapplier care–type enrollment from BPS-wide rates in kindergarten and third-grade school. Dots represent the proportion of students in kindergarten- and third grade–enrolled schools for each alternate prekindergarten setting. The largest and darkest dots are those schools where the difference in the proportion of kindergarten enrollees who did or did not apply to prekindergarten is ±2.0 SD of the proportion for all BPS elementary schools, while the smallest and lightest dots are those schools where the difference in proportions is within 1.0 SD. Relevant maps for the students missing counterfactual data and for students who attended another public school district for prekindergarten are available upon request. BPS = Boston Public Schools.
To better understand these school-level differences, we compared the characteristics of schools attended by kindergarteners by application status and nonapplier care type (Table 5). We found that appliers were more likely to attend kindergarten in an Early Learning Center than nonappliers, many of which are highly competitive in the prekindergarten application process due to the number of interested families in relation to available seats. This indicates that for families who would prefer an Early Learning Center for K–1, applying to prekindergarten increases the likelihood of kindergarten attendance in an Early Learning Center. We also found that appliers were more likely to attend kindergarten in schools with smaller kindergarten:prekindergarten seat ratios, meaning that they attended schools with smaller cohort growth. Given that cohort growth size is not related to the total number of prekindergarten programs offered in a given school, these are schools with fewer new entrants at kindergarten.
Characteristics of Kindergarten-Enrolled School by Application Behavior

Note. Values are presented as percentages unless noted otherwise. School-level data were missing for 3% of the sample. Values that are significantly different from the applier mean at the p < .001 level are indicated in bold. In addition to the five nonapplier counterfactual subgroups presented here, 120 students enrolled in other public districts in Massachusetts and 2 in a charter school. Means for this group are available upon request.
We found that appliers attended schools with fewer White students, fewer economically disadvantaged students, and lower third-grade proficiency rates on math and English language arts, as well as schools that were slightly more popular for prekindergarten as indicated by the number of applications per seat. Appliers were also substantially more likely than nonappliers to attend an Early Learning Center. Within the nonapplier group, we see a similar pattern to our previously discussed results, in which private care nonappliers attended schools with more White students, fewer Hispanic students, fewer economically disadvantaged students, and similar third-grade achievement rates as compared with schools attend by appliers. In contrast, the other nonapplier groups attended schools with more non-White students, more economically disadvantaged students, and lower third-grade proficiency rates. We found a similar pattern of results by third grade–attending school (Table 6).
Characteristics of Third-Grade School by Application Behavior

Note. Values are presented as percentages unless noted otherwise. School-level data are missing for 25% of the sample (students who were not enrolled in a public school in Massachusetts in third grade). Values that are significantly different from the applier mean at the p < .001 level are in bold. In addition to the five nonapplier counterfactual subgroups presented here, 120 students enrolled in other public districts in Massachusetts and 2 in a charter school. Means for this group are available upon request. BPS = Boston Public Schools.
Discussion
Our findings produce a consistent picture of the differences in characteristics between children and families that apply to prekindergarten in BPS and those who do not. Nonappliers are more likely than appliers to be from marginalized racial and ethnic groups, speak languages other than English, and be of low income. These differences are mirrored in a comparison of the sociodemographic makeup of the neighborhoods in which these students live and the schools they attend. Our findings match the prior literature, which suggests that White families, English-speaking families, and higher-income families tend to be more likely to enroll their children in formal prekindergarten or care settings (Crosnoe, 2007; Sandstrom & Gelatt, 2017; Turney & Kao, 2009; Whitehurst & Klein, 2015). Notably, appliers are considerably more likely than nonappliers to receive special education in K–3 yet are less likely to be retained and have markedly higher test scores at the end of third grade.
However, when we break down the nonapplier group by prekindergarten care setting, we find considerable heterogeneity. Nonappliers who attend private care are, in the aggregate, more advantaged than their nonapplier and applier peers, while students in other care types and students who do not attend formal prekindergarten settings are even more disadvantaged than their applier peers. Third-grade outcomes differ substantially within the nonapplier group; for example, private care nonappliers score higher than all other groups, including appliers, on standardized tests by a notable margin, while nonappliers in family day care or parental care score markedly lower than all other groups. Importantly, even within the private care group, the students who likely attend private care through the use of a tuition voucher are considerably less advantaged than their higher-income private group peers. These findings suggest that as prekindergarten programs expand, they should pay attention to identifying and targeting children who are unlikely to enroll in any prekindergarten program, if they want to draw in the most disadvantaged students rather than targeting nonappliers in general. For example, in New York City, the rapid expansion of universal prekindergarten that began in 2014 included an outreach team of specialists who were responsible for calling families and canvassing local communities to recruit and enroll families who may not otherwise have reached out to the program (Westat, 2017). In the face of limited program capacity like that in Boston, it is particularly important to target recruitment to students most likely to attend no center-based prekindergarten program in the absence of a BPS option.
Our findings also suggest that students who do not apply to prekindergarten in BPS are more likely to attend lower-performing elementary schools, elementary schools with more students of color, and elementary schools with more economically disadvantaged students. This implies that not only are nonappliers less likely to receive a prekindergarten education, but they are also less likely to attend some types of elementary schools. This may be a direct effect of their later entry into Boston’s choice system, or it may reflect findings in prior literature suggesting that low-income families, who are represented significantly more among nonappliers, value quality but often have to make care decisions based on practical concerns (Liu & Anderson, 2012; Lowe & Weisner, 2004). Either way, their entry into relatively lower-quality elementary schools than that of appliers may partially explain why their third-grade outcomes are lower than those of their applier peers. In terms of early participation in the school choice process, few studies have explicitly studied the downstream effects on school quality; thus, we see this as an area for future exploration.
Finally, we provide new insights into how school districts and researchers can utilize GISs to understand program participation. In this study, we use geographic indicators that were already collected by BPS to identify where appliers and nonappliers lived in Boston to better understand not only the sociodemographic characteristics of the groups but also the spatial differences in application behavior in the city. This analytic approach can be used in any context to target neighborhoods with low prekindergarten application rates (i.e., “cold spots”) and to identify areas that might benefit from capacity expansion (i.e., “hot spots”).
Our findings are limited in a few ways. By focusing on kindergarten students in BPS, we cannot estimate differences between appliers and nonappliers who choose the charter and private sectors for schooling. This is a limitation of our findings particularly if a school district wanted to compete with these schools to recruit students. Our subgroup comparisons are also limited by the relatively large percentage of nonappliers for whom we have no information about prekindergarten setting. We include this group in our analyses, but without knowing if or where they attended elsewhere, it is difficult to propose recruitment solutions for this group. Also, our data were limited to Boston and follow children who attended the program almost 10 years ago to measure third-grade characteristics. Descriptive analyses of more recent cohorts could yield different findings if the composition of children who applied to the program in recent years changed.
In addition, while BPS is similar to many large urban districts demographically and has an integrated public prekindergarten program, the school choice mechanism used to allocate scarce prekindergarten seats may limit the generalizability of our findings along two dimensions. First, the presence of the assignment mechanism may discourage some parents from applying at all, although we argue in this case that because parents will have to participate in the assignment process for kindergarten, this barrier should be less salient. However, in a district with open enrollment in prekindergarten, the patterns of application behavior by demographic characteristics could be different. Second, school assignment mechanisms vary across districts, which may limit the generalizability of our downstream effect findings to other choice districts.
Finally, we are limited by data constraints. Research on the uptake of out-of-school programming finds that families are less likely to have their children participate if they live in a neighborhood that is unsafe or where residents do not support one another (Bandy & Moore, 2009). Concerns about neighborhood safety may be salient to the parents of young children, especially if they must walk to access their school, and may be more relevant to the families of disadvantaged children who may be more likely to live in less safe neighborhoods or in proximity to lower-quality schools. Future work that incorporates neighborhood safety data would shed light on this potential correlate with prekindergarten application behavior. Furthermore, without qualitative data, we can assess only the characteristics of children and families who do not apply to the program, not why they are not applying. By asking parents why they did not apply to the BPS prekindergarten program during kindergarten registration, the district could gather more insight on parent preferences for early care.
Our findings provide a first look at the characteristics of children and families who do and do not apply to a free public prekindergarten program, the neighborhoods in which they live, and the schools they attend for elementary school. Free universal prekindergarten programs can address kindergarten readiness gaps and ensure that all children enter kindergarten with the skills they need to achieve. Unfortunately, if not all parents who send their children to public school in K–12 are applying to prekindergarten, this potential equity mechanism is diminished. Analyses of who applies to prekindergarten programs can aid localities in recruiting the students who could benefit most.
Footnotes
Appendix A: Study Sample
Figure S1 describes how the population of BPS kindergarten students in 2008 and 2009 may have or may not have enrolled in BPS for kindergarten and prekindergarten.
Of all kindergarten students associated with BPS, 1,844 applied to kindergarten but did not enroll (Box A). Of these nonenrollees, about half had not applied to BPS prekindergarten either (A1), and half had applied to BPS prekindergarten (A2). Of the prekindergarten appliers, about half enrolled in BPS prekindergarten (A2a), and half did not (A2b). Box A2b illustrates families who tried for a BPS school twice but ultimately chose to enroll elsewhere.
Our sample focuses on those BPS kindergarten students who did enroll in the district for kindergarten (Box B). Of these enrollees, about half did not apply to BPS for prekindergarten (B1), and half did (B2). Of those who applied to prekindergarten, >90% enrolled in prekindergarten (B2a), and around 8% did not (B2b).
Appendix B
Appendix C
Definition of Data Elements
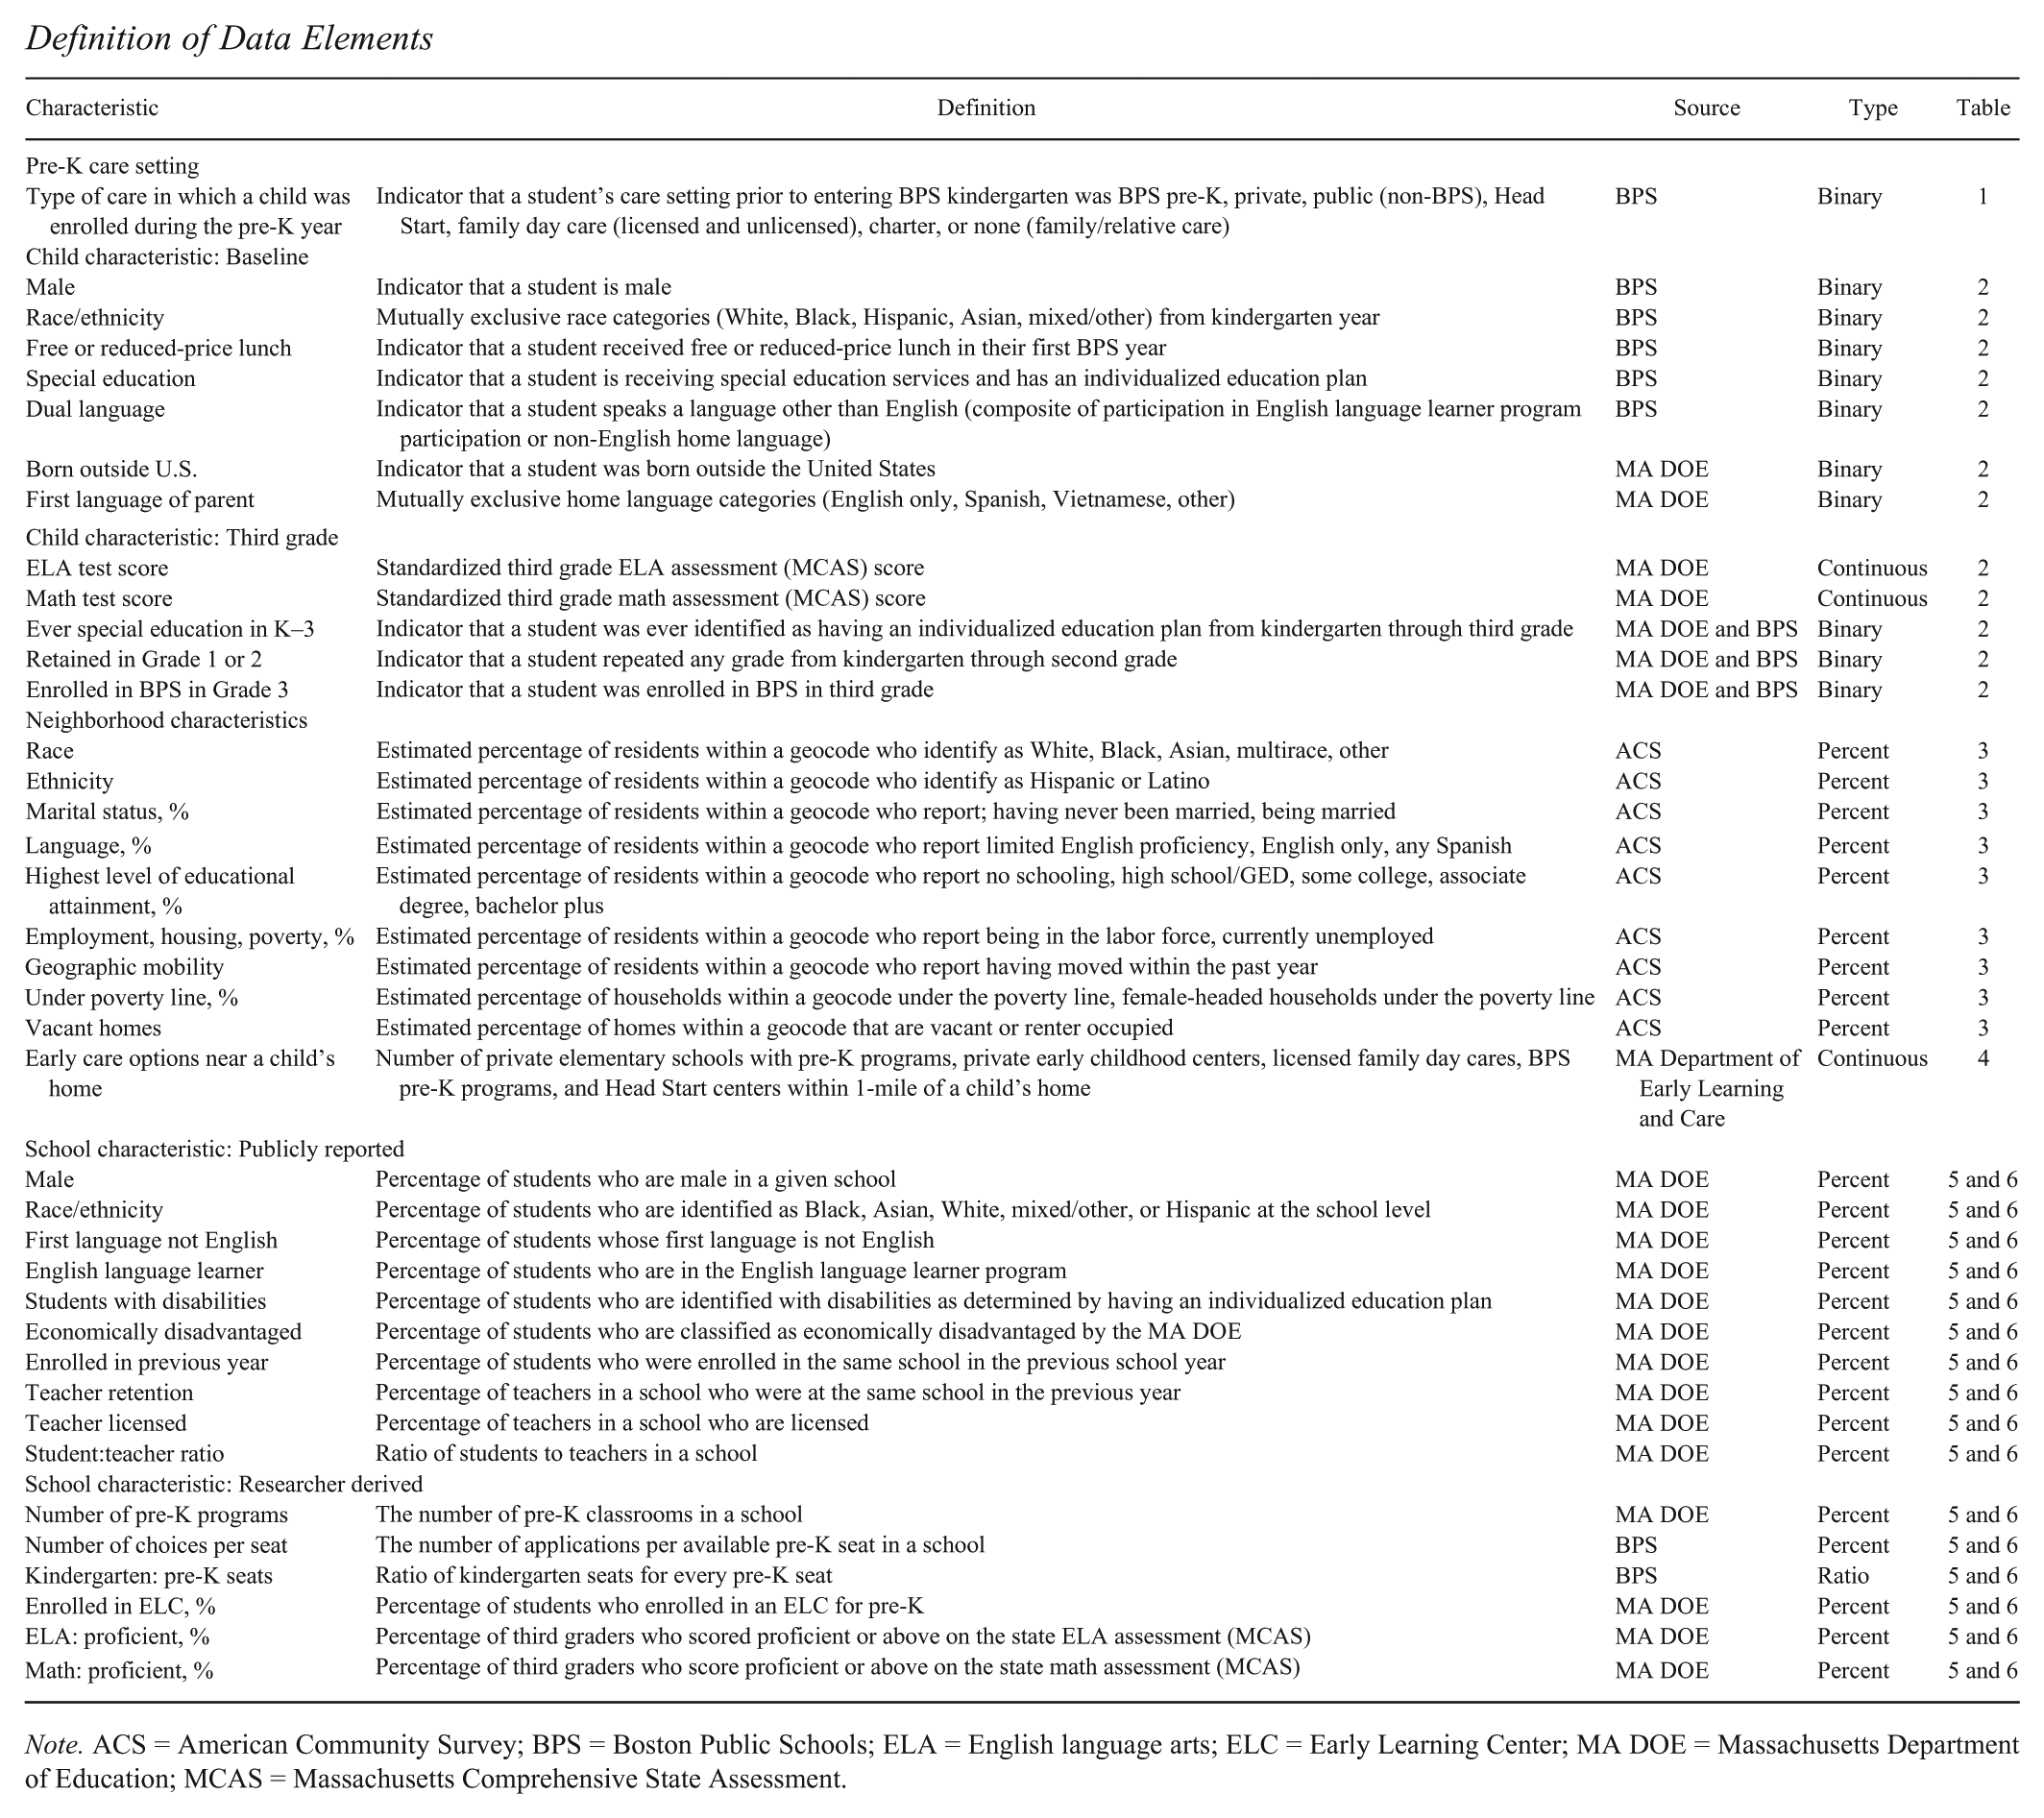
| Characteristic | Definition | Source | Type | Table |
|---|---|---|---|---|
| Pre-K care setting | ||||
| Type of care in which a child was enrolled during the pre-K year | Indicator that a student’s care setting prior to entering BPS kindergarten was BPS pre-K, private, public (non-BPS), Head Start, family day care (licensed and unlicensed), charter, or none (family/relative care) | BPS | Binary | 1 |
| Child characteristic: Baseline | ||||
| Male | Indicator that a student is male | BPS | Binary | 2 |
| Race/ethnicity | Mutually exclusive race categories (White, Black, Hispanic, Asian, mixed/other) from kindergarten year | BPS | Binary | 2 |
| Free or reduced-price lunch | Indicator that a student received free or reduced-price lunch in their first BPS year | BPS | Binary | 2 |
| Special education | Indicator that a student is receiving special education services and has an individualized education plan | BPS | Binary | 2 |
| Dual language | Indicator that a student speaks a language other than English (composite of participation in English language learner program participation or non-English home language) | BPS | Binary | 2 |
| Born outside U.S. | Indicator that a student was born outside the United States | MA DOE | Binary | 2 |
| First language of parent | Mutually exclusive home language categories (English only, Spanish, Vietnamese, other) | MA DOE | Binary | 2 |
| Child characteristic: Third grade | ||||
| ELA test score | Standardized third grade ELA assessment (MCAS) score | MA DOE | Continuous | 2 |
| Math test score | Standardized third grade math assessment (MCAS) score | MA DOE | Continuous | 2 |
| Ever special education in K–3 | Indicator that a student was ever identified as having an individualized education plan from kindergarten through third grade | MA DOE and BPS | Binary | 2 |
| Retained in Grade 1 or 2 | Indicator that a student repeated any grade from kindergarten through second grade | MA DOE and BPS | Binary | 2 |
| Enrolled in BPS in Grade 3 | Indicator that a student was enrolled in BPS in third grade | MA DOE and BPS | Binary | 2 |
| Neighborhood characteristics | ||||
| Race | Estimated percentage of residents within a geocode who identify as White, Black, Asian, multirace, other | ACS | Percent | 3 |
| Ethnicity | Estimated percentage of residents within a geocode who identify as Hispanic or Latino | ACS | Percent | 3 |
| Marital status, % | Estimated percentage of residents within a geocode who report; having never been married, being married | ACS | Percent | 3 |
| Language, % | Estimated percentage of residents within a geocode who report limited English proficiency, English only, any Spanish | ACS | Percent | 3 |
| Highest level of educational attainment, % | Estimated percentage of residents within a geocode who report no schooling, high school/GED, some college, associate degree, bachelor plus | ACS | Percent | 3 |
| Employment, housing, poverty, % | Estimated percentage of residents within a geocode who report being in the labor force, currently unemployed | ACS | Percent | 3 |
| Geographic mobility | Estimated percentage of residents within a geocode who report having moved within the past year | ACS | Percent | 3 |
| Under poverty line, % | Estimated percentage of households within a geocode under the poverty line, female-headed households under the poverty line | ACS | Percent | 3 |
| Vacant homes | Estimated percentage of homes within a geocode that are vacant or renter occupied | ACS | Percent | 3 |
| Early care options near a child’s home | Number of private elementary schools with pre-K programs, private early childhood centers, licensed family day cares, BPS pre-K programs, and Head Start centers within 1-mile of a child’s home | MA Department of Early Learning and Care | Continuous | 4 |
| School characteristic: Publicly reported | ||||
| Male | Percentage of students who are male in a given school | MA DOE | Percent | 5 and 6 |
| Race/ethnicity | Percentage of students who are identified as Black, Asian, White, mixed/other, or Hispanic at the school level | MA DOE | Percent | 5 and 6 |
| First language not English | Percentage of students whose first language is not English | MA DOE | Percent | 5 and 6 |
| English language learner | Percentage of students who are in the English language learner program | MA DOE | Percent | 5 and 6 |
| Students with disabilities | Percentage of students who are identified with disabilities as determined by having an individualized education plan | MA DOE | Percent | 5 and 6 |
| Economically disadvantaged | Percentage of students who are classified as economically disadvantaged by the MA DOE | MA DOE | Percent | 5 and 6 |
| Enrolled in previous year | Percentage of students who were enrolled in the same school in the previous school year | MA DOE | Percent | 5 and 6 |
| Teacher retention | Percentage of teachers in a school who were at the same school in the previous year | MA DOE | Percent | 5 and 6 |
| Teacher licensed | Percentage of teachers in a school who are licensed | MA DOE | Percent | 5 and 6 |
| Student:teacher ratio | Ratio of students to teachers in a school | MA DOE | Percent | 5 and 6 |
| School characteristic: Researcher derived | ||||
| Number of pre-K programs | The number of pre-K classrooms in a school | MA DOE | Percent | 5 and 6 |
| Number of choices per seat | The number of applications per available pre-K seat in a school | BPS | Percent | 5 and 6 |
| Kindergarten: pre-K seats | Ratio of kindergarten seats for every pre-K seat | BPS | Ratio | 5 and 6 |
| Enrolled in ELC, % | Percentage of students who enrolled in an ELC for pre-K | MA DOE | Percent | 5 and 6 |
| ELA: proficient, % | Percentage of third graders who scored proficient or above on the state ELA assessment (MCAS) | MA DOE | Percent | 5 and 6 |
| Math: proficient, % | Percentage of third graders who score proficient or above on the state math assessment (MCAS) | MA DOE | Percent | 5 and 6 |
Note. ACS = American Community Survey; BPS = Boston Public Schools; ELA = English language arts; ELC = Early Learning Center; MA DOE = Massachusetts Department of Education; MCAS = Massachusetts Comprehensive State Assessment.
Appendix D: Neighborhood Characteristic Generation
Appendix E: Private Care Nonappliers
Demographic Characteristics of the Private Care Nonapplier Group by FRPL Status

| Characteristic | Not FRPL | FRPL |
|---|---|---|
| Male | 50.98 | 53.22 |
| Race | ||
| White | 46.08 | 7.44 |
| Black | 18.14 | 45.21 |
| Hispanic | 22.79 | 39.77 |
| Asian | 6.62 | 4.43 |
| Mixed/other | 6.37 | 3.15 |
| Special education | 3.69 | 5.29 |
| Dual language | 11.79 | 28.04 |
| Born outside U.S. | 5.16 | 4.72 |
| First language | ||
| English | 88.21 | 72.96 |
| Spanish | 5.41 | 15.74 |
| Vietnamese | 1.23 | 2.29 |
| Other | 6.39 | 12.73 |
| Third-grade outcomes | ||
| ELA test score, SD | 0.76 | 0.08 |
| Math test score, SD | 0.72 | 0.00 |
| Ever special education in K–3 | 10.07 | 19.46 |
| Retained in Grade 1 or 2 | 3.36 | 13.58 |
| Enrolled in BPS in Grade 3 | 69.36 | 78.40 |
| n | 408 | 699 |
Note. Values are presented as percentages unless noted otherwise. BPS = Boston Public Schools; ELA = English language arts; FRPL = free and reduced-price lunch.
Acknowledgements
Thanks to the BPS, Jason Sachs, Brian Gold, Sonia Gomez-Banrey, the BPS Department of Early Childhood coaches and staff, the BPS Department of Research (particularly Erin Cooley, Barry Kaufman, and Peter Sloan), Nicole Wagner, Kamal Chavda, Carrie Conaway, and the Massachusetts Department of Elementary and Secondary Education. Special thanks also to the Causal Inference in Education Research Seminar participants and the Equity in Early Education Lab, both at the University of Michigan.
Funding
The author(s) disclosed receipt of the following financial support for the research, authorship, and/or publication of this article: This study is funded by the Institute of Education Sciences (R305A140059 and R305B150012).
Notes
Authors
ANNA SHAPIRO is a doctoral candidate in educational policy, leadership, and innovation at the University of Michigan School of Education. Her research interests include public early childhood policy analysis, the effects of early intervention for children with or at risk for developing disabilities, and issues in special education measurement.
ELEANOR MARTIN is a doctoral candidate in educational policy, leadership, and innovation at the University of Michigan School of Education. Her current research interests include interventions in the zero-to-three space that support child development, particularly for disadvantaged children.
CHRISTINA WEILAND is an assistant professor at the School of Education at the University of Michigan. Her research focuses on the effects of early childhood interventions and public policies on children’s development, especially children from low-income families.
REBECCA UNTERMAN is a senior research associate at MDRC. Her current research includes a study of Small Schools of Choice in New York City, career and technology education programs in New York City, and an evaluation of Success Academy Charter Schools.