
Abstract
Educational psychology is replete with verbal or qualitative definitions through which students can be considered members of categories, such as learning disabled, autistic, or gifted. These conceptions carry quantitative implications regarding the incidence rates of the phenomena they describe. To be scientifically useful, such definitions should have sufficient specificity and internal consistency. We analyzed four influential definitions of giftedness and assessed their internal consistency by computing the giftedness rate implied by each. Results reveal that the proportion of individuals who meet the standard of giftedness under some definitions is unrealistically high (e.g., >75% in some conditions). The implication of this work is that the rigor and internal self-consistency of educational concepts requires improvement. The field must carefully consider the quantitative implications of its concepts, statements, and definitions. An Open Science Framework project page containing R code, a technical appendix, and all figures and tables from this paper is available at https://osf.io/6e7g9/.
A growing focal point in social science research has been the broad flexibility researchers have in collecting, analyzing, and reporting data. This flexibility has been termed the “garden of forking paths” (Gelman & Loken, 2014) or “researcher degrees of freedom” (Simmons, Nelson, & Simonsohn, 2011). Such flexibility is problematic because it can harm veracity, generalizability, and trust (Makel & Plucker, 2017). Related, problems with vagueness of verbal theories and weak statistical testing of them have also long been discussed in psychology (e.g., Borsboom, 2006; Hampton, 2007; Meehl, 1978). These problems have numerous parallels in education. For example, proficiency, achievement, underachievement, bullying, and most other educationally relevant concepts can be defined and measured in numerous ways. Such flexibility can influence results as fundamental as how many students possess or experience the condition.
To serve as an illustration and introduction to how seemingly specific verbal definitions can influence fundamental aspects of education research, we focus on implications of different definitions of giftedness. Like with many educational constructs, there is no consensus on what the term gifted means. The literature is replete with conceptual definitions of the term (cf. Sternberg & Davidson, 2005; Plucker, Rinn, & Makel, 2017), from those based solely on high IQ to multifactorial definitions. Moreover, there are also many operational definitions, like the use of multiple criteria in identification processes, that may not be formal theoretical conceptions but serve the role of defining what giftedness “is” as a general concept. Thus, in addition to formally developed conceptions of giftedness, we considered a set of operational definitions that are imbued with theoretical resonance.
Students considered to be “gifted” under differing definitions are distinct populations, and yet practitioners and researchers treat them as equivalent because they bear a common label (Carman, 2013). Empirical research has not interrogated the quality or consistency of the definitions themselves. One of the few ways that the quality of definitions can be directly assessed is by evaluating their internal consistency. In other words, is it possible for all of the definition’s claims, assumptions, or specifications to be simultaneously true? A definition that cannot meet this fundamental criterion of verisimilitude requires revision or abandonment. Our method for testing internal consistency was to compute the incidence rate of giftedness implied by a definition of giftedness. These estimates of “how many” can be compared across definitions but, most importantly, can be considered in light of the developer’s expected incidence rate. A large discrepancy between the expected and the computed incidence rate suggests a problematic lack of internal consistency.
In this paper, we analyzed some of the most commonly used definitions of giftedness. They are (a) high cognitive ability, (b) multiple criteria definitions, (c) Renzulli’s (1978, 2005) three-ring model, and (4) the position statement of the National Association for Gifted Children (NAGC; 2010). We hope that the results illustrate why quantitative or psychometric analysis must accompany quantitative or psychometric arguments when conceptual or theoretical ideas about giftedness are being considered.
Quantifying Definitions of Giftedness
Our method of quantifying conceptual definitions of giftedness is based on coding them with respect to the following four features 1 :
Domains: The number of traits, domains, or criteria to be considered (e.g., intelligence, academic achievement, leadership, psychomotor, or creativity).
Combination rule: The method for combining information on multiple criteria or across multiple domains.
Cutoffs: The required level(s) of these traits or criteria needed to be described as gifted (which necessitates knowledge of the comparison group).
Distribution: The statistical distribution of the traits or criteria. When more than one are considered, this distribution is multivariate by necessity, in which case the correlations (covariances) between the components is crucial. This feature is an auxiliary assumption rather than a core part of the definition, but it must be specified in order to perform the calculations (Farrell & Lewandowsky, 2018). We based our calculations on the univariate or multivariate normal distribution as appropriate and discuss the limitations of this approach in the Discussion section of this manuscript.
As we demonstrate below, calculating a giftedness rate under each definition of giftedness involves representing its positions with respect to these four factors. We turned to the literature for empirical estimates of the necessary correlations in the multivariate case. Our calculations were performed using bracketed values for these terms, allowing us to derive upper- and lower-bound estimates of the giftedness rate under each definition.
We use numerical computation or simulation to perform the calculations. Readers will find additional detail regarding our methods in the technical appendix to this piece, available in the online supplemental material. All computations were implemented in the R statistical programming language Version 3.4.0 (R Core Team, 2016); the code for producing the results in this paper is available via our project’s Open Science Framework page at https://osf.io/6e7g9/. All figures except Figure 1S (in the online supplemental materials) were produced using the ggplot2 package (Wickham, 2009).
How Many Students “Should” Be Gifted?
Each definition of giftedness will be judged based on the giftedness rate it implies. When possible, this can be accomplished by comparing the calculated rates against statements by the definition’s authors or contained in the definition itself. If a definition claims that fewer than 10% of students are gifted, but its own implied giftedness rate is 40%, there is a problem with internal consistency.
In other cases, there is no statement of the expected rate of giftedness under the definition, so we cannot interpret the implied rate as a measure of internal consistency. We note some relevant facts. According to Office of Civil Rights data from 2013–2014, 6.7% of American public school students are identified as gifted or talented. 2 Recent research in the field suggests that the current number of identified students is likely a substantial underestimate. For example, McBee, Peters, and Miller (2016) found that the sensitivity of a typical identification process is on the order of 30% to 40% due to poor psychometric performance. This implies that a substantially larger proportion of students actually qualifies as gifted (with respect to true scores) under existing identification criteria.
Peters et al. (2017) examined three state administrative data sets as well as a national data set of scores on the NWEA Measures of Academic Progress (MAP), a vertically equated computer-adaptive achievement measure that has an exceptionally high ceiling. Using the state achievement test data, they found that 20% to 49% of students were performing at least one grade level above placement in English/language arts, and 14% to 37% in mathematics. Using MAP data, they found that the percentage of students performing above grade level was 14% in math and 35% in reading. These percentages translate into millions of students. Against a standard of which students need more challenge, the Peters et al. (2017) data suggest that the answer to the question of how many students are gifted is likely a great many more than are currently being identified.
These findings suggest that a relatively high implied rate of giftedness is not necessarily unreasonable unless it is indicative of poor internal consistency. However, rates in excess of 50% become problematic in the sense that if the word gifted means anything, it is a departure from the normative levels of ability or accomplishment. If the majority of students are gifted, then giftedness is normative by definition and therefore not a condition requiring a label. For this reason, we believe that implied giftedness rates greater than 50% are fundamentally problematic in spite of our general agnosticism regarding what the rate “should” be.
Model 1: General Cognitive Ability
We begin with the simplest definition of giftedness to illustrate the method. The connection between giftedness and IQ goes back at least to Lewis Terman, who in addition to developing the Stanford-Binet intelligence test in 1916 also began the longitudinal genetic study of genius in 1921, which followed high-IQ individuals throughout their lives. The use of IQ tests to identify students as gifted continues today, with 45 state definitions including intelligence as at least a part of their definitions of giftedness and 16 states requiring IQ scores for gifted identification (McClain & Pfeiffer, 2012).
We explore the consequences of the definitions themselves and do not consider the practical complexities of actually implementing identification schemes based on these models (cf. Lohman & Korb, 2006). Calculating the expected giftedness rate using “high IQ” is straightforward: Only one domain is considered (IQ), the cutoff is directly specified, the distribution is a univariate normal distribution (Warne, Godwin, & Smith, 2013), and no combination rule is required. Variability in the giftedness rate under IQ-based conceptions is solely a function of the cutoff IQ presumed to be indicative of giftedness. Terman (1926) identified students with an IQ of 140 or higher as gifted. As Figure 1 displays, the giftedness rates under an IQ-only model is approximately 9.1% at a cutoff of 120, 2.2% at a cutoff of 130, and 0.4% at a cutoff of 140. Incidence rates would vary across schools, but such variation would not influence the number of gifted students in the general population. The results for this model, assuming a cutoff at the 95th percentile (approximately equal to an IQ of 125), a commonly observed cutoff for states that use IQ (McClain & Pfeiffer, 2012), are included in the first column of Table 1.

Giftedness rates by cutoff under an IQ-only definition of giftedness. The three shaded areas, beginning at IQ scores of 120, 130, and 140, encompass 9.1%, 2.3%, and 0.4% of scores, respectively.
Summary Table Estimating the Proportion of Individuals Estimated to Be Identified as Gifted Under Various Definitions of Giftedness

Note. M/C = multiple criteria; NAGC = National Association for Gifted Children. “Or” rule classifies students as gifted if they exceed the cutoff on any assessment. “And” rule classification requires exceeding the cutoffs on all assessments.
Model 2: Multiple Criteria/Multiple Domains
Background
Many definitions of giftedness include multiple factors, such as achievement, motivation, or creativity. This type of definition is sometimes referred to as a multiple-criteria model (Krisel & Cowan, 1997). According to the NAGC (2015) State of the States report, most state policies for identifying gifted students consider both IQ and academic achievement. Many states strongly weight high achievement in specific academic subjects in their gifted education identification policies (McClain & Pfeiffer, 2012; NAGC, 2015).
Method
Two specific examples will be considered. In the first (Model 2A), giftedness is defined by two criteria or domains (e.g., academic achievement in reading and mathematics); in the second (Model 2B), by three criteria or domains (e.g., IQ, math achievement, and reading achievement). In both examples, we set the cutoff in each domain at the 95th percentile, implying that a student must demonstrate achievement in the top 5% relative to national norms to “qualify” with respect to each domain. We held the cutoffs constant because their effect on the giftedness rate is intuitively obvious and because we wish to focus on the impact of the combination rule and the correlation(s) between the criteria. Thus, while holding the cutoffs constant, we manipulate the number of domains, the correlations between them, and the combination rule.
Our calculations assume that the joint distribution of the scores follows a multivariate normal distribution, implying that the marginal distribution for each individual component follows a univariate normal distribution. The multivariate normal distribution describes the correlations between scores as well as their means and variances; we can manipulate these correlations to examine how the giftedness rate changes depending on the strength of the relationship of scores across criteria. For example, we would expect a strong correlation between reading and language arts achievement scores (r = .87, as reported by McGrew, LaForte, & Schrank, 2014) but a lower correlation between IQ and creativity (r = .36 to .54, depending on how creativity is measured; Preckel, Holling, & Wiese, 2006). Of course, the precise values of these correlations will vary across samples based on measurement error, differences across measures, outcomes, and samples.
As mentioned above, the decision rule for how the criteria are combined plays a key role in determining the giftedness rate. The “and” combination rule requires qualifying scores on all the criteria simultaneously, whereas the “or” rule requires a qualifying score in only one criterion. Because these two rules define the upper and lower bounds of the identification rate, we will not provide calculations under the “mean” rule (McBee, Peters, & Waterman, 2014). The giftedness rate under various conditions can be calculated by integrating the multivariate normal distribution in various ways according to the combination rule; see the technical appendix in the online supplemental materials for details.
Results
Results from Models 2A and 2B are summarized in Table 1. When a top 5% cutoff is used, under the “and” rule, the proportion of students meeting the criteria for giftedness ranges from around 0.25% if the two variables are uncorrelated scores to 5% if they are perfectly correlated. Under the “and” rule, a low correlation between criteria means a lower proportion of students will qualify, because it is relatively uncommon to exceed the cutoff on both criteria.
By contrast, the proportion identified as gifted under the “or” rule ranges from nearly 10% when the criteria are perfectly uncorrelated to 5% when they are perfectly correlated. This is because the “or” rule provides people with multiple opportunities to qualify—students need only be strong in one area to be gifted. The highest giftedness rate occurs under the “or” rule with a zero correlation between criteria; in this case, each additional criterion considered creates a completely independent opportunity to exceed the cutoff. Figure 2 displays the impact of combination rule and the correlation between criteria in two-assessment multiple-criteria definitions.
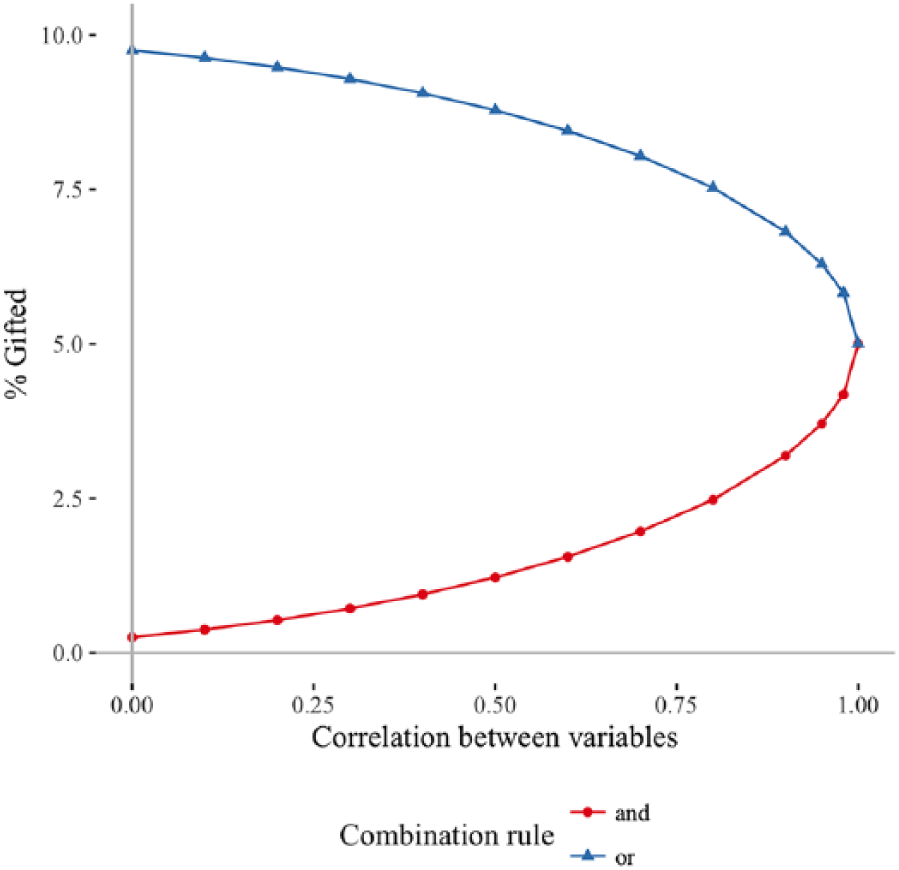
Giftedness rate under two-assessment multiple-criteria definition by combination rule and correlation between criteria. Cutoff on both assessments is set to the 95th percentile.
A similar pattern is observed for the three-criterion model. Again, the giftedness rate depends strongly on the correlation between the criteria and the combination rule. The addition of the third criterion makes the “and” rule even more restrictive by providing an additional hurdle that must be cleared to qualify as gifted. Its impact is stronger when the correlation between the domains is low. Conversely, a third criterion makes the “or” rule even more permissive; each additional criterion provides another opportunity to qualify.
Under multiple-criteria models, the devil truly is in the details. Let us imagine a hypothetical definition of giftedness stating, “Gifted students comprise the top 5% of demonstrated achievement in the core academic subjects of reading and mathematics.” 3 Clearly, this definition is based on an “and” rule and specifies cutoff scores at the 95th percentile, seemingly with respect to national norms, although the specific reference group (e.g., school building, school district, the state, the nation) is not mentioned. The giftedness rate under such a definition will therefore depend entirely on the correlation between reading and mathematics scores.
Justification for our bounds on the correlation parameter
Obviously, the aforementioned ranges are based on hypothetical scenarios where the correlations between domains are at the extremes. However, such extremes are not the case in the real world. More precise estimates can be developed by relying on more realistic estimates of intercorrelations across domains. Estimates of the reading–mathematics correlation vary depending on the specific measures used and age groups considered. Harlaar, Kovas, Dale, Petrill, and Plomin, (2012, Table 2) reported r = .27 for the correlation between the Non-Numerical Processes subscale of the National Foundation for Educational Research 5–14 Mathematics Series and the Woodcock-Johnson III Reading Fluency subscale. This was the lowest of several reading–mathematics correlations they reported. In the Woodcock-Johnson IV (WJ-IV) technical manual, McGrew et al. (2014, Appendix F) found a correlation of r = .67 between the “broad reading” and “broad mathematics” domains of the WJ-IV.
Parameters for the Renzulli Three-Ring Model Simulation
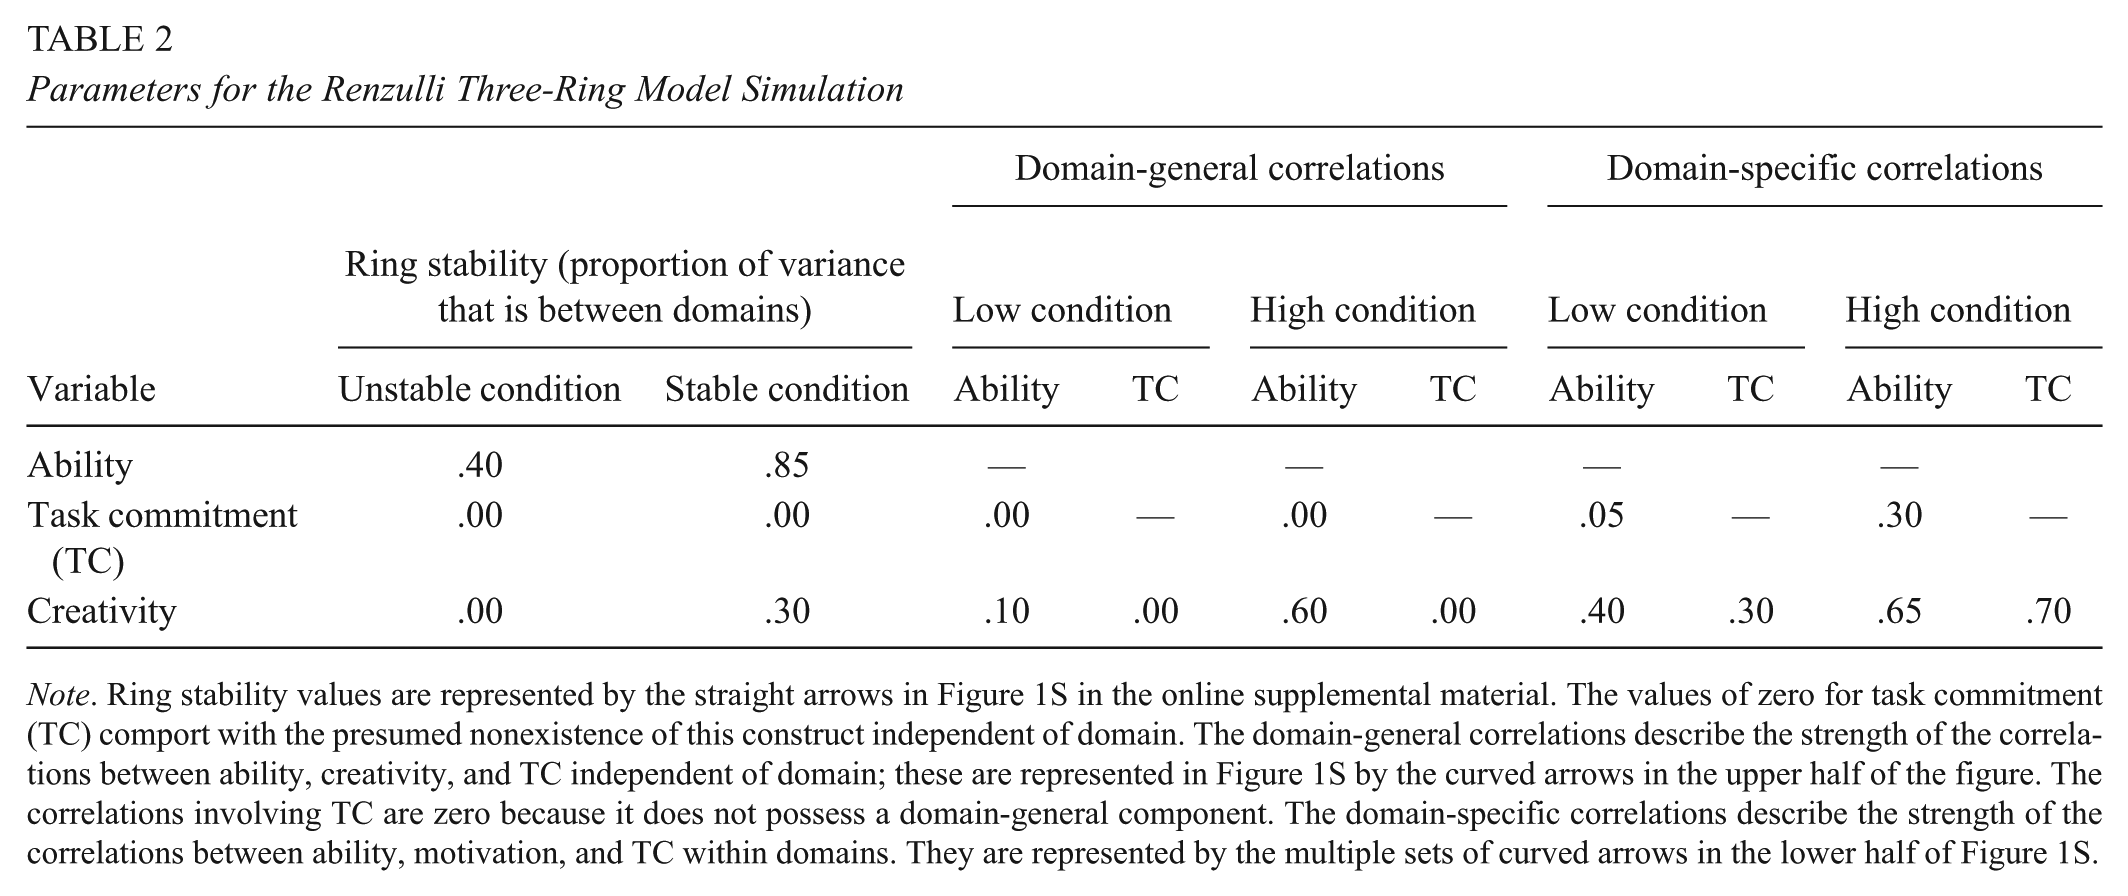
Note. Ring stability values are represented by the straight arrows in Figure 1S in the online supplemental material. The values of zero for task commitment (TC) comport with the presumed nonexistence of this construct independent of domain. The domain-general correlations describe the strength of the correlations between ability, creativity, and TC independent of domain; these are represented in Figure 1S by the curved arrows in the upper half of the figure. The correlations involving TC are zero because it does not possess a domain-general component. The domain-specific correlations describe the strength of the correlations between ability, motivation, and TC within domains. They are represented by the multiple sets of curved arrows in the lower half of Figure 1S.
Results
Using the top 5% cutoff for giftedness, a correlation of r = .27 yields a giftedness rate of 9.3% under the “or” rule and a rate of 0.65% under the “and” rule. A correlation of r = .67 yields a rate of 8.2% under the “or” rule and 1.8% under the “and” rule. Therefore, for a definition to remain internally consistent, multiple-criteria systems based on the “and” rule must be designed around the assumption that 2% or less of the student population will qualify, whereas “or”-based definitions must presume that 8% to 10% of the population will qualify. These ranges are limited to multiple-criteria definitions that rely only on very few criteria that use only one combination rule. The next two models demonstrate how combination rules can used in more complicated fashion (Model 3) and the impact of having many multiple criteria (Model 4).
Model 3: Renzulli’s Three-Ring Model
Background
In 1978, Renzulli published an influential paper questioning what makes a student gifted and called for a reexamination of the definition of giftedness. In the nearly four decades since, this paper has been cited over 2,000 times and has grown extremely popular in schools (Mathews, 2014; McClain & Pfeiffer, 2012). Under Renzulli’s model, there are three relevant clusters of traits: above-average ability, creativity, and task commitment. These clusters combine and interact with each other to enable students to exhibit gifted behaviors and to facilitate creative accomplishment (Renzulli, 2005). Students who exhibit sufficient levels of ability, creativity, and task commitment in any of 11 general domains (which have at least 45 specific performance areas) will demonstrate gifted behaviors in that domain. These domains are mathematics, philosophy, religion, life science, visual arts, social sciences, language arts, physical sciences, law, music, and movement arts. Individual students are identified as “gifted” if they are expected to perform gifted behaviors a sufficient proportion of the time to merit educational opportunities not typically provided in regular classrooms.
Renzulli developed an identification system to accompany his theoretical model of giftedness. However, it is not a quantitative application of the three-ring model, so we do not consider it further (see the technical appendix for description). One virtue of the three-ring model is that it describes the conditions under which outstanding accomplishments could be expected to arise—that is, when ability, task commitment, and creativity are all present with sufficient intensity. Thus, our analysis attempts to determine the proportion of students who achieve outstanding accomplishment in all three areas based on the logical quantitative consequences of the three-ring model. Our interpretation of the three-ring definition is that gifted behaviors operate within domains. The specific areas listed by Renzulli are a nonexhaustive list that is subsumed within the 11 general areas (J. S. Renzulli, personal communication, February 28, 2016). Thus, our analysis focused on these 11 general domains rather than the 45 specific domains described by Renzulli (2005).
Quantitative analysis is complicated because the model explicitly situates the three rings of ability, creativity, and motivation within domains—and lists 11 domains as specific examples. Because the giftedness rate depends on the correlation between the three rings within the 11 domains, we were forced to consider how giftedness is manifested both across and within domains. Renzulli’s three-ring definition is therefore quantified as follows:
Number of domains or criteria: 11, each containing three “rings” of ability, creativity, and task commitment.
Combination rule: Composite; “and” rule within domains; “or” rule between domains.
Cutoff(s): All three rings within a domain must be at the 85th percentile or higher.
R. Distribution: A weighted composite of two multivariate normal distributions representing between- and within-domain contributions, as described below.
Method
We used Monte Carlo simulation for this analysis because exact analytical solutions would have been intractable considering the complexity of the combination rule, which is essentially 11 sets of “ands” each joined by an “or.” A similar method was presented in McBee et al. (2014) for analyzing the performance of Georgia’s multiple-criteria identification system. Model specifications and justifications may be found in the technical appendix.
Results
The results from Model 3 are displayed in Table 1 as well as in Figure 3. The proportion of students who are gifted according to the three rings varies somewhat across conditions. The lowest giftedness rate (9.4%) was found in the stable-ring/weak-within-domain correlation condition. The highest rate (25.2%) was found in the unstable-ring/high-within-domain correlation condition. The estimated Monte Carlo error for this analysis was .
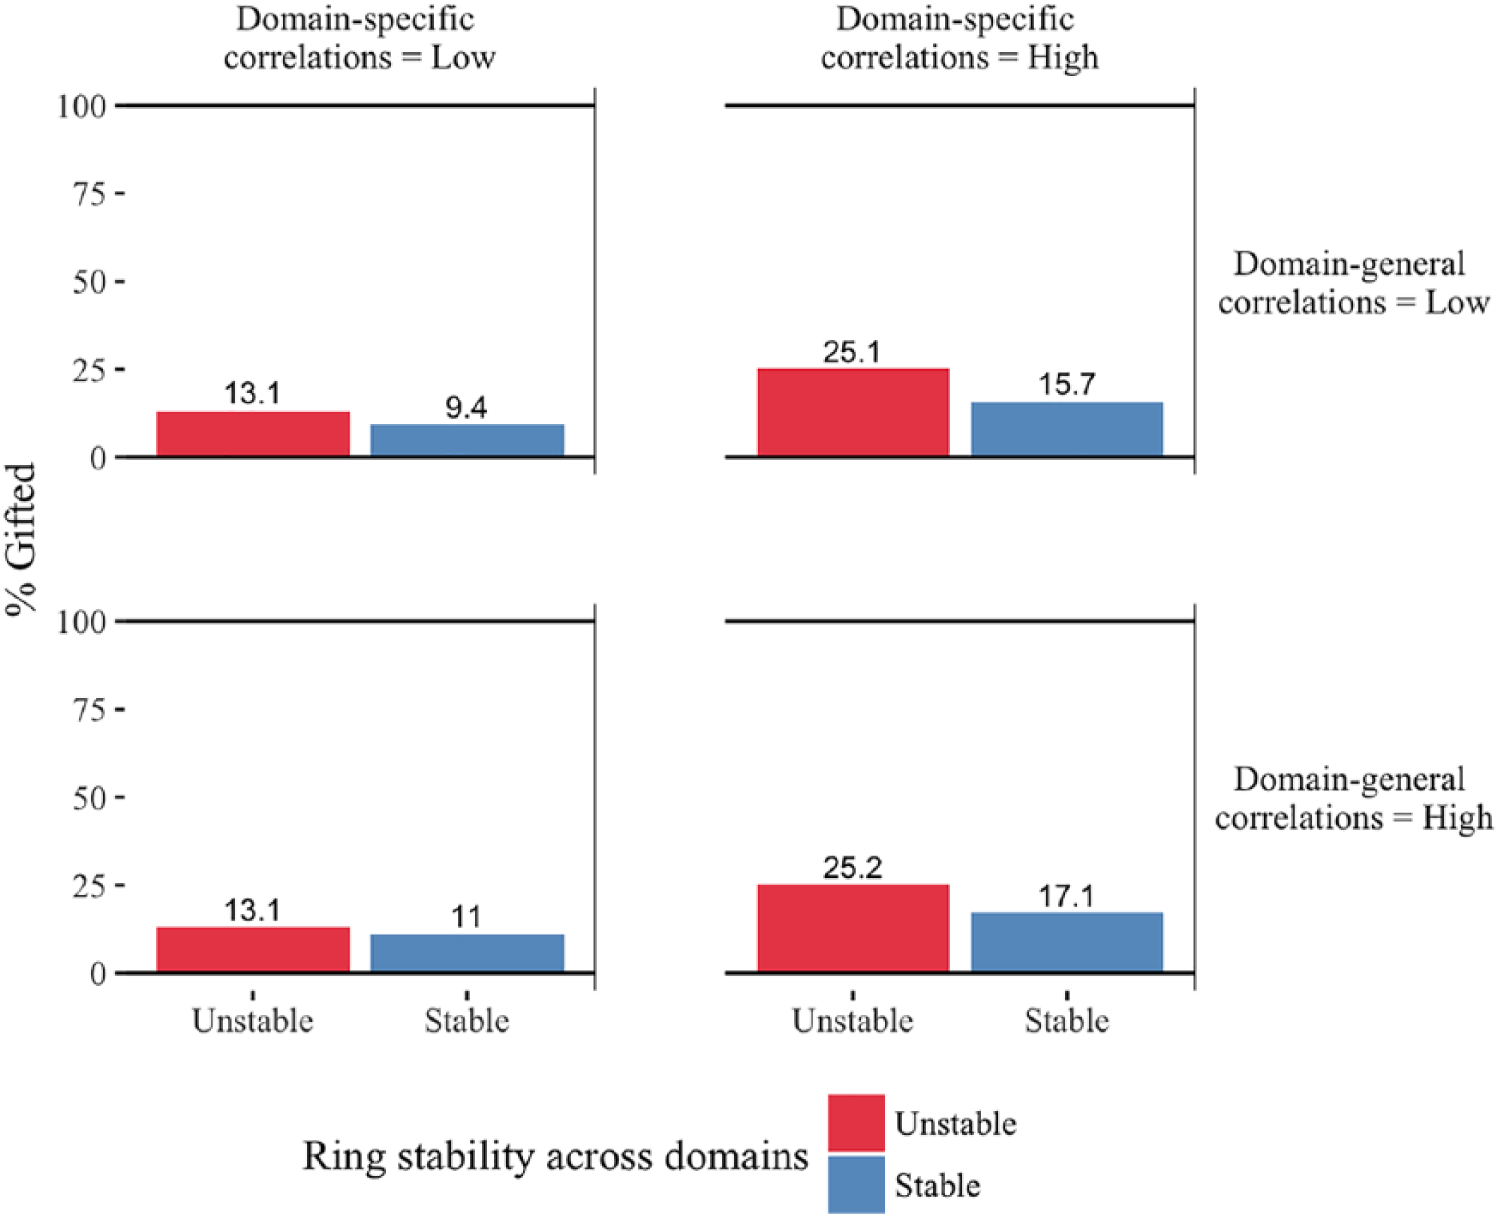
Proportion of gifted students according to Renzulli’s three-ring model by ring stability, domain-general ring intercorrelations, and domain-specific ring intercorrelations. See Table 2 for specific parameters used in each condition. Calculations based on a Monte Carlo simulation with n = 100,000 repetitions and the 11 domains from Renzulli (2005). Estimated Monte Carlo error ±0.12%.
A few general patterns were observed. First, the giftedness rate tended to be higher in the unstable-ring condition. As discussed, the three-rings model is a set of “ands” each joined by an “or,” and low correlations increase the identification rate under an “or” rule. The unstable-ring condition creates a lower correlation between the domains, thus increasing the effective number of independent “chances” to qualify, raising the overall giftedness rate. Second, the between-domains correlations hardly affected the results, probably because two of the three correlations were fixed to zero in both conditions. However, the within-domain correlation (i.e., correlations between rings increases the probability that all three of them are above the cutoff) had a strong influence on the giftedness rate.
Renzulli’s proposition that the talent pool should include 15% of the students is a plausible value for this model. The higher these domain-specific correlations become, the more sensitive the giftedness rate becomes to ring stability. Low levels of ring stability coupled with high domain-specific correlations lead to giftedness rates of 25%—not necessarily higher, we believe, than what Renzulli intended.
Model 4A: NAGC Position Statement—Childhood/Ability-Centric Variant
Background
Founded in 1954, NAGC is an organization dedicated to supporting families, educators, and researchers who work with gifted and talented children. On its website, NAGC states that “academically gifted and talented students in this country make up approximately six to ten percent of the total student population (three to five million students).”
4
In 2010, NAGC published a position statement titled Redefining Giftedness for a New Century: Shifting the Paradigm. This position statement was not specifically intended as a statement on identification (P. Olszewski-Kubilius & K. Speirs Neumeister, personal communication, March 15, 2016) but does articulate a clear conception of giftedness and is considered to be one of the “definitions of giftedness” by NAGC (n.d.-c). The document defined giftedness as follows: Gifted individuals are those who demonstrate outstanding levels of aptitude (defined as an exceptional ability to reason and learn) or competence (documented performance or achievement in top 10% or rarer) in one or more domains. Domains include any structured area of activity with its own symbol system (e.g., mathematics, music, language) and/or set of sensorimotor skills (e.g., painting, dance, sports). (NAGC, 2010, p. 1)
The statement specifies both symbol systems and sensorimotor skills as domains of giftedness. Although six domains are listed, these were intended only to be examples (P. Olszewski-Kubilius & K. Speirs Neumeister, personal communication, March 15, 2016).
We performed two versions of our analysis. The first version considered the case of childhood giftedness (Model 4A); the second, adult giftedness (Model 4B). This is necessary because the NAGC position statement describes a developmental trajectory for the nature of giftedness from childhood to adulthood where childhood giftedness is understood in terms of ability or potential, largely relative to academic subjects that all students are engaged in learning (e.g., math, language arts, and reading). On the other hand, giftedness in adulthood is embodied through advanced achievement and the quality of contributions to a specialized domain. Mere ability no longer defines giftedness. According to the position statement, “As individuals mature through childhood to adolescence, however, achievement and high levels of motivation in the domain become the primary characteristics of their giftedness” (NAGC, 2010, p. 1). The primary distinction between our childhood and adulthood analyses is how the “top 10% or rarer” reference group was determined, although additional differences also exist.
Method
The NAGC definition of giftedness is essentially an “or” combination rule with many criteria. We analyze this model using the same mathematics used for the “or” multiple-criteria system. By positing a multivariate normal distribution for the involved criteria, the giftedness rate can be calculated by numerically integrating the distribution to calculate probability. The cutoff (“top 10% or rarer”) is specified in the definition. All that is needed to do the calculation is to decide on the number of, and plausible correlations between, criteria.
A complicating factor is that two overarching categories are posited: symbol system (i.e., cognitive-academic) and sensorimotor. Clearly, criteria are nested within these domains, and the correlation between criteria within these umbrella categories should be larger than the correlations for criteria between categories. For example, the correlation between mathematics achievement and reading achievement should be higher (due to both being within the symbol systems domain) than the correlations between math achievement and gymnastics or drawing ability.
Ad hoc “guesstimation” of the correlations between the variables is indefensibly arbitrary and unlikely to result in an acceptable correlation matrix. Our method for arriving at an acceptable and defensible correlation matrix was based on the confirmatory factor analysis model, which assumes that responses on a set of observed variables are caused by a smaller number of unobservable latent variables. Further detail regarding the method can be found in the technical appendix, but broadly, the NAGC definition is understood in terms of the four factors as follows:
Number of domains or criteria: Unbounded by the definition.
Cutoff(s): 90th percentile.
Distribution: Multivariate normal with correlations derived from a two-factor model.
Combination rule: “Or.”
Results
The analysis was computed under many different conditions, including the number of domains (six, 10, and 20), the factor loadings (Λ, ranging from 0.10 to 0.90), and the interfactor correlation between cognitive ability and athleticism (ranging from 0 to 0.6). The results are presented in Figure 4.

Gifted proportion according to National Association for Gifted Children position statement (childhood/ability-centered version) by number of domains, the correlation between domains, and the correlation between factors. Assumes that there are two general categories of domain, psychomotor and cognitive, and that half of the total number of domains fall into each category. Within-domain loadings describe the degree of correlation between domains within categories. Color and shape denote varying degrees of correlation between the psychomotor and cognitive categories.
When only six domains (three symbol systems and three sensorimotor) were considered, the percentage of the population that is gifted ranged from about 27% if the correlations between factors is high and the factor loadings are high (r = .6 and Λ i = .9) to 47% if the correlations between factors and the factor loadings are low (r = .0 and Λ i = .1). For 10 domains, the giftedness rate ranged from 32% to 65%. With 20 domains, the rate varied from 38% to 87%.
This pattern is consistent with the properties of an “or” combination rule. The more domains considered as part of giftedness and the lower the correlations between those domains, the more students identified. The giftedness rate approaches 100% as the number of qualifying domains increases. Given the NAGC’s statement that roughly 10% of students are gifted, the very high rate of giftedness implied by the NAGC definition of childhood giftedness indicates that this definition suffers from poor internal consistency.
Model 4B: NAGC Position Statement—Adulthood/Achievement-Centric Variant
Background
Adulthood involves specialization into a narrow area of expertise. Although the available number of domains increases in adulthood compared to childhood, limitations in time and attention limit an individual’s participation to a relatively small number of domains. A person might be an eminent lawyer, an accomplished chess player, an intermediate runner, and a novice pianist. But that person is not a pilot, race car driver, ballet dancer, or poet. Developing skills in those areas would limit the opportunity to become accomplished in others.
Although the NAGC position statement is vague on this point, we confirmed that the intended point of comparison for the “top 10%” consists of all individuals who participate in the domain, not all individuals (P. Olszewski-Kubilius & K. Speirs Neumeister, personal communication, March 15, 2016). The importance of this distinction can be illustrated by considering chess. Most people do not play chess seriously; probably only a minority of U.S. adults even know the rules. The skill required to be in the top 10% of chess could be relatively low level if the comparison group includes those who do not play. Or it could mean a high level if the comparison group includes only active chess players. Because all children attend school and take all basic subjects, using the entire population as a reference group for academic performance is appropriate. However, because adults participate in only a small number of possible domains, using only those who participate in that domain as a reference group is appropriate for the adulthood model.
Method
We applied the NAGC definition of giftedness to adults by asking, “What proportion of the population is in the top 10% of performance in symbol-system or sensorimotor domains compared to the active practitioners of those domains?” To answer this question, we estimated the population at risk for participation in a domain as well as the distribution of developed skill and expertise in the domain (see the technical appendix for details).
The first difference between our NAGC adult (4B) and child (4A) models is that the benchmark for what is considered “gifted” changes from high ability in childhood to high achievement in adulthood. Because high achievement is benchmarked against specialized practitioners of the domain, the z-score cutoff for giftedness rises from z = 1.645 to z = 3.798.
The second difference is that more domains are open to adults than to children. The analysis presented here considered 100 and 200 domain conditions. The third change compared with the childhood NAGC analysis is that there is a proportionally smaller number of sensorimotor domains open to adults as compared with cognitive domains. Thus, our analysis considered only 20% of domains to be psychomotor. Despite being a smaller proportion of possible domains, this still represents a larger raw number of sensorimotor domains than used in the childhood giftedness example.
Results
Results from this analysis are presented in Figure 5 (note that the maximum value on the y-axis is 2%). The most striking result is the much lower rate of adulthood giftedness. When considering 100 domains, the giftedness rate ranged from 0.4% to 0.75%, with the slightly higher rate found under low factor loadings. For 200 domains, the giftedness rate ranged from 0.63% to 1.45%. The correlation between symbol-system and sensorimotor domains had almost no effect, likely as a consequence of the relatively small number of sensorimotor domains included in this analysis. The estimated Monte Carlo error for this analysis was ±0.09%.

Gifted proportion according to National Association for Gifted Children position statement (adulthood/achievement-centered version) by number of domains, the correlation between domains, and the correlation between factors. Scale of y-axis is extremely truncated; the maximum value is 2%, not 100%. Estimated Monte Carlo error ±.009%.
These results are consistent with the general behavior of the “or” combination rule. Adding domains and reducing the correlation in performance across domains leads to an increase in the giftedness rate. The absolute rates are relatively low because of the high standard of performance required to meet a within-discipline level of excellence (top 10% of participating individuals with the assumption that the vast majority of individuals do not participate in any given domain). Although the NAGC definition takes no position on the rate of giftedness among adults, we think these estimates of adulthood giftedness seem high. The results indicate that the implied rate of adult giftedness is somewhere between 1 in 66 and 1 in 200. We do not believe that 1 in 200 U.S. adults occupy the top 10% of performance in the domains that they practice.
Discussion
The limitations of verbal definitions have been discussed for decades. In this paper, we illustrated the impact verbal fuzziness can have in education. We calculated the giftedness rate under four definitions of giftedness. As illustrated in Table 1, when excluding adult giftedness, the proportion of students qualifying as gifted can range from less than 0.5% (under an “and”-based multiple-criteria definition) to as high as nearly 90% (under the NAGC childhood variant when low correlations between criteria are assumed). Moreover, a large range of plausible giftedness rates exists within definitions, largely depending on the correlation between the criteria that are deemed capable of providing evidence of giftedness.
The high giftedness rate calculated under the childhood version of the NAGC definition is especially problematic. NAGC explicitly describes the giftedness rate as 6% to 10% of the population (NAGC, n.d.-a) while also identifying the “all-children-are-gifted” trope as one of the top myths about giftedness (NAGC, n.d.-b). However, this is the logical consequence of its own definition of giftedness. The Renzulli three-ring model is also permissive under some conditions, but it is plausible for this model to create its intended giftedness rate of approximately 15%.
It is understandable why NAGC would be hesitant to exclude domains from the purview of giftedness; doing so would invoke conflicts of values that are difficult to reconcile. It is easy to avoid such disagreements when one perceives there to be no cost to adding additional domains. But our analysis reveals that there is a cost—the internal validity of the definition. Our analysis suggests that unless one is willing to bestow the gifted label on a large fraction of children, then (a) the domains considered must be circumscribed, (b) the standard for each criterion must be higher, (c) or an “or” combination rule should not be used. A definition asserting that roughly 10% are gifted, and that being gifted means being in the top 10% in any of a large set of subjects, skills, and endeavors, is a mathematical impossibility. Both of these statements cannot be true.
An alternative perspective would be to consider these results of the NAGC definition analysis (both versions) to be broadly compatible with a talent development worldview. From that perspective, although large numbers of children may possess the raw ingredients of giftedness, few will achieve adult eminence (or even expertise) due to many of them frequently lacking experiences required to develop elite performance or expertise. Subotnik, Olszewski-Kubilius, and Worrell (2011) described factors such as the availability of advanced learning experiences, psychosocial support, and continual motivation to engage in deliberate practice as requirements to developing talent. Such requirements produce a “leaky pipeline” in which many have potential for greatness but few achieve it. The large number of gifted children suggested by the NAGC definition might be considered a positive feature of the model rather than a shortcoming. However, it would suggest that current identification practices in the United States, which frequently select fewer than 10% of students for gifted education programs, are missing huge numbers of students. Such a stance would be compatible with other recent work (McBee et al., 2016; Peters et al., 2017).
Broad Implications
Imprecise verbal definitions in education can lead to hugely different results and implementation policies. Moreover, verbal definitions also run the risk of being internally inconsistent. Although our specific examples all relate to gifted education, the general principle can be extended to any number of other education-related constructs. For example, vague definitions of proficiency, success, or underachievement all lead to different groups being able to make different conclusions even when using the same data. More-precise definitions that include quantitative or numerical components will help avoid such disparities while providing more rigorous and reliable foundation for application and assessment.
Specific implications for giftedness
An environment in which 1 in 400 students is gifted should have vastly different educational offerings (and funding) than an environment where 5%, 15%, or 87% of students are gifted. Lamentably, with existing definitions of giftedness, we cannot tell which of these conditions we should expect to encounter. Such lack of clarity severely limits policymakers from implementing and evaluating appropriate educational opportunities for students. Moreover, this lack of clarity also severely hampers advocates and policymakers from knowing when “success” has been achieved. If 40% of students are considered gifted, the lack of mandated funding required to serve (or even identify) them grows even more appalling. Moreover, it further calls into question the rationale for grouping students by age (Peters et al., 2017).
Including many domains under the giftedness umbrella makes conceptual sense; individuals can pursue myriad domains. However, if the purpose of gifted identification is to select students to receive a particular educational service, domains identified may need to be encumbered by the number of domains served. This does not mean that domains that are not included are not important. Rather, in a world of limited resources, only so many domains can receive differentiated learning options in school. However, if the intent of gifted identification is to provide students (and their families) with information (and not necessarily services), then broadening the domains used in identification may have merit.
As states, districts, and schools consider how giftedness should be conceptualized, the debate is often limited to which conceptualization should be implemented, but vast variability can exist within conceptualizations. Thus, even if all schools relied on the same conceptualization of giftedness, implementation differences could lead to vastly different numbers (and types) of students identified as gifted. Each of the four features to quantify definitions (domains, combination rules, cutoffs, and distributions) has meaningful implication for determining who and how many students are identified as gifted. The “who” and “how many” are two hallmarks of assessing whether schools are using appropriate identification methods. With such variability within definitions, schools need to focus beyond simply which definition is selected to also how it is implemented. Without doing so, their values and the validity of their practices may not match their intentions.
Limitations
We attempted to minimize discrepancy between our understanding and the intent of those who developed the definition by contacting them for clarifications. All whom we contacted were extremely helpful. It is our sincere hope that their message was not meaningfully altered by our delivery. However, if this is the case, such discrepancy further illustrates the vagueness and ambiguity that are inescapable features of verbal theories. Definitions need to be unambiguously understandable if they are going to be implemented with fidelity.
Another limitation is that we assessed only four definitions of giftedness. Within the giftedness world, we note that the implications of Subotnik and colleagues’ (2011) comprehensive model of talent development was not assessed, but doing so would be fascinating. Moreover, as discussed above, giftedness is merely one construct within a sea of variables in education that can be conceptualized, defined, and implemented in various ways.
Reliable empirical data on domain-general and domain-specific correlations would allow more-precise estimates of the giftedness rate implied by each definition. It is important to note that the correlations between criteria are a more or less fixed property of the social and educational universe, not something under the control of the field’s theoreticians, unless more-precise assessments with higher specificity and sensitivity are developed. Calculating these correlations in giftedness is complicated by the two-stage process that many schools use in their gifted identification process (McBee et al., 2016). When a nomination is required before identification assessments are administered to students, correlations calculated between these assessments will be suppressed due to range restriction (Crocker & Algina, 1986). Empirically calculated correlation coefficients would therefore be downwardly biased unless these data are collected from all students in the school, not just a subset of potentially gifted students.
The existence of differential barriers to entry for gifted programs for otherwise equally performing students from different demographic backgrounds (e.g., Grissom & Redding, 2016) is a coinciding problem that complicates the issue. Grissom and Redding (2016) found that Black students were less likely to be referred to gifted programs than similar White students when taught by non-Black teachers. Although this reality needs to be recognized, rectified, and monitored, it is not a necessary consequence of any existing definition. This problem also illustrates how assessing theories in practice can grow more difficult; practice does not always follow what is preached.
Another assumption underlying these results is that the distributions of scores, including their variances and covariances, are identical for different demographic groups, an assumption that is questionable (e.g., Johnson, Carothers, & Deary, 2008; Makel, Wai, Peairs, & Putallaz, 2016). Similarly, the assumptions we made regarding upper and lower bounds for factor loadings and correlations have a strong effect on the results. In the absence of reliable or consistent empirical estimates of these parameters, we tried to bracket the true values of these parameters. Readers may disagree with our choices, but we have tried to be transparent about them. Interested readers may download our R code from the project page on the Open Science Framework (https://osf.io/6e7g9/) and alter the correlations or employ alternative multivariate distributions to assess alternative assumptions. The technical appendix contains discussion of technical limitations.
Conclusion
As illustrated with giftedness, many definitions in education that make intuitive sense have unanticipated effects on the number of individuals considered relevant. We hope the results of these analyses illustrate the value that quantitative analysis can contribute to theoretical and practical arguments in education. It is one thing to assert that a certain percentage of students demonstrate a trait or feature; it is quite another to show that this percentage naturally arises from the definition’s features. Additionally, this type of analysis reveals ambiguities in the definitions themselves. Such ambiguities must be clarified if ideas are going to be uniformly implemented as educational policy and evaluated for their ecological validity.
Supplemental Material
DS_10.1177_2332858419831007 – Supplemental material for The Quantitative Implications of Definitions of Giftedness
Supplemental material, DS_10.1177_2332858419831007 for The Quantitative Implications of Definitions of Giftedness by Matthew T. McBee and Matthew C. Makel in AERA Open
Footnotes
Acknowledgements
Thanks to Joe Renzulli, Ann Robinson, Rene Islas, Paula Olszewski-Kubilius, Kristie Speirs Neumeister, and the National Association for Gifted Children (NAGC) Board of Directors (2016 as well as members of the 2010 Task Force creating the NAGC position statement) for answering our clarifying questions about their definitions. Thanks also to Frank Worrell, Scott Peters, Jonathan Wai, and Jennifer Jolly for feedback on earlier drafts of this manuscript. Finally, thank you to Catherine Bergman for her work on Figure 1S, which is presented in the technical appendix.
Authors’ Note
The authors shared an early draft of this manuscript with the president of the NAGC, who then formed a task force (cochaired by the second author) that is currently updating the organization’s definition of giftedness.
Notes
Authors
References
Supplementary Material
Please find the following supplemental material available below.
For Open Access articles published under a Creative Commons License, all supplemental material carries the same license as the article it is associated with.
For non-Open Access articles published, all supplemental material carries a non-exclusive license, and permission requests for re-use of supplemental material or any part of supplemental material shall be sent directly to the copyright owner as specified in the copyright notice associated with the article.