
Abstract
Using state-representative teacher surveys in three states—Texas, Ohio, and Kentucky—we examine teachers’ implementation of college- and career-readiness (CCR) standards. What do teachers report about the specificity, authority, consistency, power, and stability of their standards environment? How does their policy environment predict standards-emphasized instruction? Do these relationships differ for those who teach different subjects (math and English Language Arts [ELA]), different grades (elementary or high school), different populations (English Language Learners [ELLs], students with disabilities [SWDs]), and in different areas (rural, urban, or suburban)? We found elementary math teachers taught significantly more standards-emphasized content than elementary ELA teachers, whereas secondary ELA teachers taught significantly more standards-emphasized content than secondary math teachers. Teachers of SWDs and rural teachers taught significantly less of the emphasized content. In all three states, we found greater buy-in (authority) predicted increased emphasized content coverage among ELA teachers but not among math teachers.
Keywords
Introduction
Since the passage of the Every Student Succeeds Act (ESSA) in December 2015, K–12 standards-based reform is in the midst of a period of growing decentralization as states revise their standards, assessments, and associated policies (Polikoff, 2017). The resulting cross-state variation in standards, and the growing within-state differences in teacher supports and political rhetoric, suggest there may be wide variations in how teachers experience standards-based policy. Or, we may be overstating the extent to which state policy contexts are substantively different from teachers’ perspectives. To understand if and how standards-based reform improves student learning, we first must understand how teachers view and experience these policies and whether their perceptions of their policy environments have relationships to what teachers teach. Standards-emphasized instruction sits at the core of the theory of change of standards-based reform (M. S. Smith & O’Day, 1991). If teachers do not change what they are teaching to match state standards, standards-based policies may be much ado about nothing.
Despite backlash to the Common Core State Standards (CCSS) and the declaration by education secretary Betsy DeVos that “Common Core is dead” (U.S. Department of Education, 2018), college- and career-readiness (CCR) standards remain viable because of a series of institutional logics (DiMaggio & Powell, 1983) in both the political and professional spheres. The general public expects there to be some standards in K–12 public education and some level of accountability regardless of the name attached to the standards themselves—or their specific content (Bovens, 2007). In their 2015 book, Supovitz and Spillane (2015) identify seven reasons for supporting standards, and this study focuses on their second rationale: influencing core classroom interactions between teachers and students. Policymakers continue to set academic expectations for teachers in the hopes that teachers will teach to them, and this trend is arguably centuries old (Gamson, 2015).
Importance of the Study
Our study is novel in its efforts to measure how teachers experience policy and whether these perceptions relate to instruction. According to other surveys, teachers have made major instructional shifts in response to standards (Kane, Owens, Marinell, Thal, & Staiger, 2016)—but this conclusion relies on reported change rather than reported instructional content. We advance the field in this regard by measuring standards-emphasized content items while still accounting for differences in teacher professional development, classroom resources, and school-level random effects.
Successful standards implementation requires policymakers to think carefully about teacher learning and interpretation of the policy’s message (Spillane, Reiser, & Reimer, 2002). Previous studies of standards-based reform efforts have described state and district initiatives as well as how teachers perceive policy (e.g., Goertz, 2005; Spillane, 1999). This implementation research has chronicled the successes and failures of standards without proposing a unified framework to consider what is necessary for effective implementation (Hamilton, Stecher, & Yuan, 2008). There continues to be unevenness in professional development opportunities across and within schools in the implementation of standards according to Supovitiz, Fink, and Newman (2016). Other studies have established that much more alignment work needs to be done, particularly in the realms of instruction and system incentives (Massell & Perrault, 2014). This study considers all of these implementation issues in their totality, rather than focusing on a single initiative or intervention, a holistic approach that better captures the multiplicity of messages that teachers receive from policymakers. We consider whether teachers listen to these complex policy messages in deciding on their own instruction—or, as the decades-old loose-coupling argument goes, ignore them altogether (Weick, 1976).
Rather than examining standards policies “as written,” we ground our study in the idea that it is educators’ interpretations and beliefs about the policies that shape their reactions (e.g., Desimone, 2002). The best-designed standards policy matters little if its primary implementers, teachers, have wholly different interpretations (H. C. Hill, 2001; Spillane, 2009). Contemporaneous surveys show that even several years after adoption, most teachers felt that they still had not received adequate professional development on how to teach the standards (Troia & Graham, 2016). It is therefore of critical importance to examine teacher perspectives on the resources and supports they receive related to implementing standards, the instructional challenges they face, and whether these factors influence their use of standards in the classroom.
We build on prior work by detailing teachers’ implementation of college- and career-readiness standards and examine whether instruction is shifting to match the standards. We take an inclusive approach, unusual in the standards-based reform literature, by comparing and contrasting teachers of general education students, students with disabilities (SWDs), and English language learners (ELLs). Using state-representative surveys administered across three states in 2015–2016, we describe how teachers perceive policies related to their state standards. Our study allows several important comparisons by comparing the experiences of teachers across three states along three dimensions: geography (rural, suburban, and urban), grade level (elementary or secondary), and subject area (teachers of math, English Language arts [ELA], SWDs, and ELLs). In the following, we describe the importance of these particular contrasts and their implications for more deeply understanding how teachers and students are experiencing one of our nation’s major and ongoing education reforms.
First, there has been limited work on standards-based policy for SWDs and ELLs. Some describe standards-based reform as experienced by teachers of SWDs (e.g., Bacon, 2015) and ELLs (e.g., Figueroa-Murphy & Haller, 2015) by documenting how teachers struggle to differentiate instruction while still meeting accountability system demands. Others consider how ELLs might be better represented in the design of common standards (Flores & Schissel, 2014). But we are unaware of studies that directly examine how SWD and ELL teachers experience policies in comparison with general educators and how their use of standards in the classroom differs from other teachers. We also compare urban, suburban, and rural teachers, given economic and geographic differences that may influence the policy environment (Johnson & Howley, 2015). For example, rural districts face unique administrative challenges in standards implementation; they enact policy across wider geographic areas with fewer staff and resources (Yettick, Baker, Wickersham, & Hupfield, 2014). Thus, we would expect the policy system to be different in rural compared to other environments. Finally, we expect there to be significant grade-level differences as elementary schools have historically been more receptive and amenable to reform (Schueler, Goodman, & Deming, 2017).
State Background
The three states in this analysis—Kentucky, Ohio, and Texas—are diverse both geographically and in terms of their approach to CCR standards. These three states include both former CCSS adopters and a non-CCSS state. Kentucky and Ohio were early adopters of CCSS, while Texas did not adopt CCSS, instead choosing to develop state-specific CCR standards. Further policy differences are described in Table 1, including the relative rigor of each state’s standards according to Carmichael, Martino, Porter-Maggee, and Wilson (2010), where Texas is considered to have the highest rigor in both subjects. Ultimately, these differences between state standards are quite small as there is a core curriculum across all three states (Porter, McMaken, Hwang, & Yang, 2011). Our outcome of interest—standards-emphasized instruction—measures the difference in the current standards from the state’s prior iteration to identify which content areas should have shifted the most.
Demographic and Policy Information on Three Partner States

Note. ELA = English language arts; CCR = college- and career-readiness.
We focus on ELA and math because they are the two subjects for which all states have standards, the only subjects covered by CCSS, and the most tested subjects; thus, we would expect them to be most influenced by standards-based policy. We use a state-representative sample in both elementary and high schools. This design allows for grade-level instructional contrasts and enables us to highlight the differences between these two extremes as high schools are less prevalent in standards implementation studies (Polikoff, 2017). Resource constraints prevented us from including middle school; we consider this an important area to add to future research.
It is important also to note the inherent difficulty in studying standards, which may often be loosely coupled from classroom instruction (Weick, 1976). Polikoff (2017) notes the lack of causal evidence concerning the CCSS and their effectiveness; the most compelling causal studies address earlier eras of standards-based reform centered on No Child Left Behind (e.g., Dee & Jacob, 2011). To address these empirical concerns, we employ a well-tested theoretical framework, described in the following.
The Policy Attributes
In designing the teacher survey, we used the policy attributes framework and its five dimensions—specificity, authority, consistency, power, and stability—as well as resources, challenges, and professional development to quantify aspects of the policy environment (Porter, Floden, Freeman, Schmidt, & Schwille, 1988). The policy attributes framework (Porter, 1994; Porter et al., 1988) has been used for decades in education policy research to analyze both systemic reform efforts (Clune, 1993) and comprehensive school reforms (Berends, Bodilly, & Kirby, 2002; Desimone, 2002; Polikoff, 2012). Studies of standards efforts in the past decade have described state and district initiatives as well as how teachers perceive policy (Spillane, 1999; Stecher et al., 2008), but few have provided systematic data to compare experiences across states or linked policy perceptions and key inputs to teachers’ reported instructional changes. The policy attribute theory is particularly well-suited to examining the complexity of standards-based policy simultaneously, reflecting each key component of reform that must work in concert to achieve change (M. S. Smith & O’Day, 1991). Examining these components simultaneously is crucial to capturing the reality of how teachers experience an intricate web of policies originating from federal, state, and local governing bodies (Coburn, 2016; Marsh & Wohlstetter, 2013; Spillane, 2009). Recent studies have also deployed the attributes to understand complex systems such as research-practice partnerships, including how to develop and evaluate appropriate outcomes (Desimone, Wolford, & Hill, 2016) and how to evaluate school turnaround (K. Hill, Desimone, Wolford, & Reitano, 2017), which shows the continuing relevance of the theory to analyzing policy implementation.
Using this theory, we measure the policy environment by describing how specific, authoritative, consistent, powerful, and stable it is. Specificity describes how detailed or prescriptive a policy is. Authority reflects a policy’s legitimacy and status, which can be achieved through rules or law, historical practice, or charismatic leaders. Consistency is the extent to which policies are aligned and how policies relate to and support each other. Power reflects how policies are reinforced and enacted through systems of rewards and sanctions. Policies that have power include incentives for compliance. Stability is the extent to which policies change or remain constant over time.
To better contextualize these attributes, we describe examples of the most relevant standards policy issues of the day and how the attributes relate to them based on the survey items in the Appendix. Specificity is most salient in current debates over developing a coherent curriculum program (see Kaufman et al., 2018); it addresses the extent to which districts provide teachers with a prescriptive curriculum and accompanying resources. Consistency refers to alignment, addressing a longstanding concern in standards-based reform that tests and curricula are poorly aligned. Authority refers to the intrinsic belief that teachers hold concerning standards, whereas power refers to extrinsic motivators enacted through accountability policies such as teacher evaluations (Firestone, 2014). Stability is perhaps the simplest to explain, answering the question of whether teachers think the standards and associated policies will last. All of the attributes must work in concert to achieve the difficult task of changing the technical core of teaching over the long term (Spillane, Parise, & Sherer, 2011).
It is important also to consider whether the desire to change teacher instruction is the right focus. Polikoff and Porter (2014) argue that instructional alignment to standards is weakly associated with teacher quality, while raising teacher quality has been the subject of much recent policy research (e.g., Desimone, Hochberg, & McMaken, 2016; Stecher et al., 2018). This study is a departure from these approaches and is agnostic about relationships between standards-emphasized instruction and student outcomes—though clearly all of these efforts are aimed to help students. Rather, we ask more fundamentally whether standards are associated with teacher self-reported instruction as this is the first step toward finding any future relationships to or effects on student outcomes. Without the presence of these relationships, the entire theory of standards-based reform as enacted over the past 25 years seems on shaky ground (Mehta, 2013).
We readily acknowledge the many tradeoffs of different approaches to measuring policy and our primary outcome of interest, standards-emphasized instruction. Document analysis reflects “true” policies as written; however, we believe teachers understanding and “lived” experiences with policy are the conditions that are most potentially influential in changing behavior (Coburn, 2016; Desimone, 2002; H. C. Hill, 2001; Spillane, 2009). Further, we understand validity threats to teacher self-report (Burstein et al., 1995; Desimone, 2006, 2013; Desimone, Smith & Frisvold, 2010) and interpret our data with this in mind. But, we also constructed our measures to ensure teachers were not aware of the desired reports and were reporting on behaviors (as opposed to evaluating their own instruction). Here the attributes helped create reliable constructs without alerting teachers to the desired responses. We also administered the surveys in a confidential and nonevaluative environment. Under these conditions, teacher self-report data have been shown to be valid and reliable (Fowler, 2013; Mayer, 1999). Observation can measure quality in ways limited by survey data, but it is labor intensive, time-limited, and subject to rater bias. Our study, while correlational, begins to address the question of whether CCR standards might be shifting instruction, and it examines which elements of the policy environment play the most significant role in predicting these shifts.
Resources, Challenges, and Professional Development
In addition to the attributes, we measure three key factors in teachers’ policy environment: resources, challenges, and professional development (PD). In designing the survey, we identified the challenges and resources that are most often cited in the literature. Instructional resources play a critical role in moderating teachers’ use of standards in the classroom by providing aligned curricula, scope-and-sequence documents, and other resources for lesson planning (Ball & Cohen, 1996; Raudenbush, Rowan, & Cheong, 1992). While relationships between student achievement and resources can be inconsistent or weak (Hanushek, 1997), standards themselves may be boosting resource investments, as they did during prior periods of reform (Dee, Jacob, & Schwartz, 2013).
But even in schools where teachers receive robust resources, challenging working conditions can stymie teachers’ best efforts to implement standards-based reform. Challenges—such as student absenteeism and mobility (Allensworth & Easton, 2007), a wide range of student abilities presenting challenges for differentiation (Fuchs & Fuchs, 2006), a lack of administrative or parental support, and frequent changes in policies and school priorities (Coburn, 2006)—can interfere with teachers’ ability to leverage resources and professional development. We considered all of these challenges in our survey design.
Finally, professional development remains the central mechanism for fostering standards-emphasized instruction. Ongoing, interactive, content-focused, collaborative, and coherent forms of PD (Desimone, 2009) mobilize teachers to learn and refine ways of using available resources that best meet the needs of their students. Coaching, one prominent form of professional development, has been shown in many circumstances to be effective at raising achievement (Desimone & Pak, 2017; Kraft, Blazar, & Hogan, 2018). PD provides teachers with the sense-making opportunity to engage with the standards and their available resources in their zones of enactment, which are the spaces in which “reform initiatives are encountered by the world of practitioners and ‘practice,’ delineating that zone in which teachers notice, construe, construct and operationalize the instructional ideas advocated by reforms” (Spillane, 1999, p. 144). While links between PD and instruction are mixed (Desimone, Smith & Phillips, 2013; Kennedy, 2016), we expect that high-quality PD focused on content standards would boost teachers’ standards-emphasized instruction (Penuel, Fishman, Yamaguchi, & Gallagher, 2007).
The framework in Figure 1 illustrates the overarching model that guides our work. It depicts the relationship between the policy attributes, resources, challenges, professional development, and instruction. The policy attributes both determine and are determined by resources and challenges, as shown in the bidirectional arrows. State policy contexts and geography influence all of the elements of the framework, so we estimate each state analysis separately rather than pooling across states, which leverages our stratified sampling design. The outcome, what we label standards-emphasized instruction, is the critical objective of any attempt at standards-based reform. Ultimately, if policy does not shift instruction for students, the standards will not matter much, and the vision of standards-based reform as laid out by its earliest advocates will not be realized. Standards-based policy by design is meant to foster organizational coherence and strengthen the technical core of instruction (Spillane et al., 2011).

Framework for standards-emphasized instructional shifts.
We examine the following research questions:
Research Question 1: How do teachers perceive their policy environment? That is, how do they perceive the policy attributes of specificity, consistency, authority, power, and stability and their resources, challenges, and PD related to CCR standards? Specifically, how are they similar or different across states; for teachers of ELA, math, SWDs, and ELLs; and for teachers in urban, suburban, and rural schools?
Research Question 2: To what extent are teachers covering content emphasized in their state’s CCR standards, and how does coverage of this standards-emphasized content differ for teachers of ELA, math, SWDs, and ELLs and rural, suburban, and urban teachers?
Research Question 3: To what extent do teachers’ policy environments predict the degree of standards-emphasized instruction?
The null hypotheses we are testing is that there are no significant differences between states and teacher types and no relationships between policy attributes, resources, challenges, and PD to the degree of standards-emphasized instruction. Rejecting the null in any of these instances—that is, finding significant relationships between states, teachers, policy attributes, resources, challenges, PD, and instruction—will have broad relevance to future standards-based reform implementation efforts.
Hypothesized Policy Differences Among States, Districts, and Teacher Types
Our first research question assumes that different teachers—separated by state, subject, grade level, and urbanicity—experience policy differently. In addition to distinct state policy environments, we look at each subject area differently because of the level of change demanded by the new standards, which varies by subject, as well as past research showing different outcomes for math compared to English (Dee & Jacob, 2011; Porter et al., 2011). Elementary math teachers may also react differently to directives asking them to cover fewer topics more rigorously than secondary ELA teachers, who may be asked to abandon long-taught units centered on favorite works of fiction (Achieve, 2013).
We expected PD in rural areas to be of lesser quality because of resource, personnel, and distance constraints, which would lead to less standards-emphasized instruction (Glover et al., 2016). We test whether policy perceptions hold constant across rural, suburban, and urban districts, and we use measures of teacher judgments of the usefulness of their PD when quantifying teacher professional development. We also expected policy differences to emerge when comparing general education teachers to teachers of SWDs or ELLs. Prior studies of reform documented teachers of SWDs as skeptical of the applicability of common standards to their students (Dorn, Fuchs, & Fuchs, 1996), and qualitative studies have found skepticism concerning the CCSS for both SWDs and ELLs (e.g., Figueroa-Murphy & Haller, 2015).
Data
We selected states to achieve variation in the type of standards they adopted and include both Common Core and state-specific standards. Kentucky is our smallest state by population, with fewer than 1 million students enrolled compared to nearly 2 million students in Ohio and 5 million students in Texas. Kentucky also has far fewer districts, only 173, compared to Texas’s 1,239. It is also a far more rural state, with over a third of its P–12 population in rural areas. Texas is a more urban state with a much higher population of English language learners and non-White students. It spends far less per student, with Ohio spending the most of the three states. These demographic details are described in depth in Table 1.
College- and career-readiness standards implementation deadlines were also quite different across the three states, with Texas implementing its own standards first, while both Ohio and Kentucky adopted and then dropped or revised the CCSS on different timelines. Kentucky fully implemented its standards far more quickly than Ohio. Considering these substantial state policy differences, any similar findings across all three states would be all the more notable.
The study has a multistage sampling design, with districts selected with probability proportional to the square root of student enrollment size (PPS), schools selected with equal probability within the elementary school group and the high school group, and teachers selected with equal probability within each teacher group. We employed a stratified random sampling technique designed to ensure the sample was representative of districts in Texas, Ohio, and Kentucky. We included 42 Texas districts, 42 Ohio districts, and 89 Kentucky districts in the sample (there was a larger number in Kentucky because of integration with ongoing state survey data collection). In each district, we sampled up to two elementary schools and two high schools, making sure to capture representative samples of traditional public and charter schools based on demographics. In each elementary school, we sampled two fifth-grade math teachers, two fourth-grade ELA teachers, one teacher of SWDs, and one teacher of ELLs. In each high school participating in the study, we sampled two ELA teachers and one teacher in each of the following specialties or subjects: SWD, ELL, Algebra I, Algebra II, and geometry. We chose the three math subjects because they are the most common high school math courses in order to maximize the number of high school target course responses we obtained. Further, we wanted to identify math classes enrolling students who were likely to be required to take the state mathematics assessment. Of the eligible teachers, in Ohio, 417 of 654 sampled teachers responded (conditional response rate: 64.8%); in Texas, 603 of 1,089 (55.3%); in Kentucky, 740 of 1,890 (39.2%).
We examined patterns of nonresponse in each state for areas of concern—district size, district type, urbanicity, school type (elementary, high school, charter, and non-charter), student demographics (free and reduced-price lunch, race, ethnicity, and subject area)—and we found between 0% and 8% difference in respondent teachers’ school and district characteristics compared to the selected sample along each of these dimensions. In most cases, there were no significant differences between the target sample and the respondent percentages (the largest difference being in Ohio, where districts with only one high school were 8% less likely to respond). To correct for remaining response bias, we used a technique in Stata known as jackknife resampling, which systematically leaves out each observation and calculates the averages to make the estimates more accurate. We also weighted each district accordingly and report robust standard errors obtained from this procedure. For more information on our sampling size and methods, please refer to the Center on Standards, Alignment, Instruction, and Learning (C-SAIL) at c-sail.org.
Methods
Using survey jackknife procedures, we weighted all survey results based on state demographics (i.e., each response is weighted by district to accurately represent the population of the state). To compare teacher reports of their policy environment (Research Question 1), we used Wald tests of significance across teacher subgroups (by subject and geography) within the same state to establish significant differences. To compare across states, we used an ANOVA test of state summary data with a Tukey post hoc correction. We constructed the policy attributes measures by averaging the items, and we report the internal reliability for each attribute using Cronbach’s α. We used multi-item composites for each of our measures to increase reliability and validity (Mayer, 1999). We borrowed items on already validated national surveys where possible, and when we needed to create or adapt items, we went through a cycle of development, expert review, cognitive interview, and review (Desimone & LeFloch, 2004). To analyze geographic differences, we coded each district as rural, suburban, or urban using the district database from the National Center for Education Statistics, and we combined rural and town into a single category.
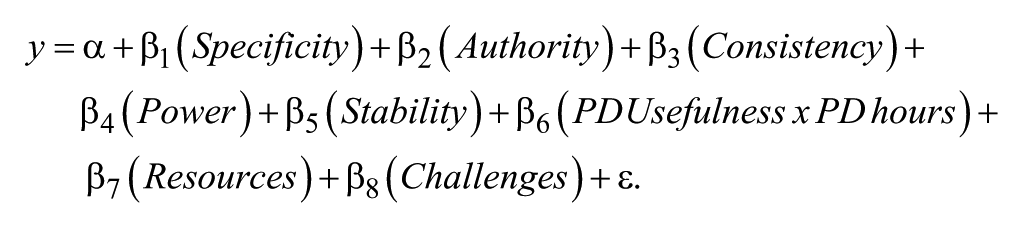
To determine the association between policy and aligned instruction (Research Question 3), we examined the variance between schools, which was significant for three out of the five attributes, indicating that we should use a hierarchical linear model (HLM) rather than an ordinary least squares regression. We use an HLM approach with school-level random effects, where y is the standards-emphasized content (explained in more detail in the following), α is the constant, and ε is the residual:
Measures
All of our measures of the policy attributes consisted of composite averages of multiple items listed in the Appendix. To measure specificity, we asked teachers their level of agreement with statements related to how detailed guidance from the district was around standards implementation, where 1 = strongly disagree, 2 = somewhat disagree, 3 = somewhat agree, and 4 = strongly agree. For specificity, α values ranged from 0.74 to 0.92, depending on the state. For authority, we asked teachers the extent of their agreement with statements that reflected their buy-in to the standards, such as if they thought the standards made learning relevant, if the standards were appropriate for their students, and if they gave them the flexibility they needed to help students below grade level (α range, 0.84–0.89). For consistency, we asked the degree to which teachers believed curricula, assessments, professional development, evaluations, and other policies were aligned (α range, 0.87–0.90). For power, we asked teachers about positive and negative repercussions for implementing the standards (α range, 0.65–0.66). For stability, we asked them to predict how long the standards and assessments would last in each state (α range, 0.77–0.86). These constructs were not highly correlated (the strongest correlation was only 0.32 between specificity and consistency), and these constructs have been significantly predictive in prior work (e.g., Polikoff, Porter, & Smithson, 2011).
The full list of the resources, challenges, and professional development survey items can be found in Table 2. To measure challenges, we provided a list of 10 school, classroom, and student challenges, generated from the literature, including lack of support from parents (Fan & Chen, 2001), large class size (Hanushek & Woessmann, 2017), and lack of planning time built into the school day (Dever & Lash, 2013), to name a few. We asked teachers to rate them as either not a challenge, a minor challenge, a moderate challenge, or a major challenge (on a scale of 1–4). To measure resources, we created a composite measure of the instructional resources teachers used and found useful. We selected these items based on those we thought would most influence the instructional core and teachers’ interpretation of standards-based policy (Spillane, 2009). To determine the dosage of standards-focused professional development, we averaged the five types of PD in Table 2 related to content standards as well as their usefulness as reported on a 4-point Likert scale (1 = not at all useful, 2 = somewhat useful, 3 = useful, 4 = very useful). We then multiplied this average (from 1 to 4) by the number of types of standards-based PD teachers reported receiving, which was organized into increments as a continuous variable (on a 1–5 scale, where 1 = 1–10 hours, 2 = 11–20 hours, 3 = 21–40 hours, 4 = 41–80 hours, and 5 = 81 or more hours). The result is the independent variable called simply PD, which captures both the usefulness and the dosage of standards-focused PD received (a multiplier of two categorical variables). Thus, a teacher who reported 41 to 80 or more hours of PD that was not at all useful would have a PD value of 4 (4 × 1), whereas a teacher who reported 1 to 10 hours of very useful PD would also have a PD value of 4 (1 × 4).
Resources, Challenges, and Professional Development Survey Items
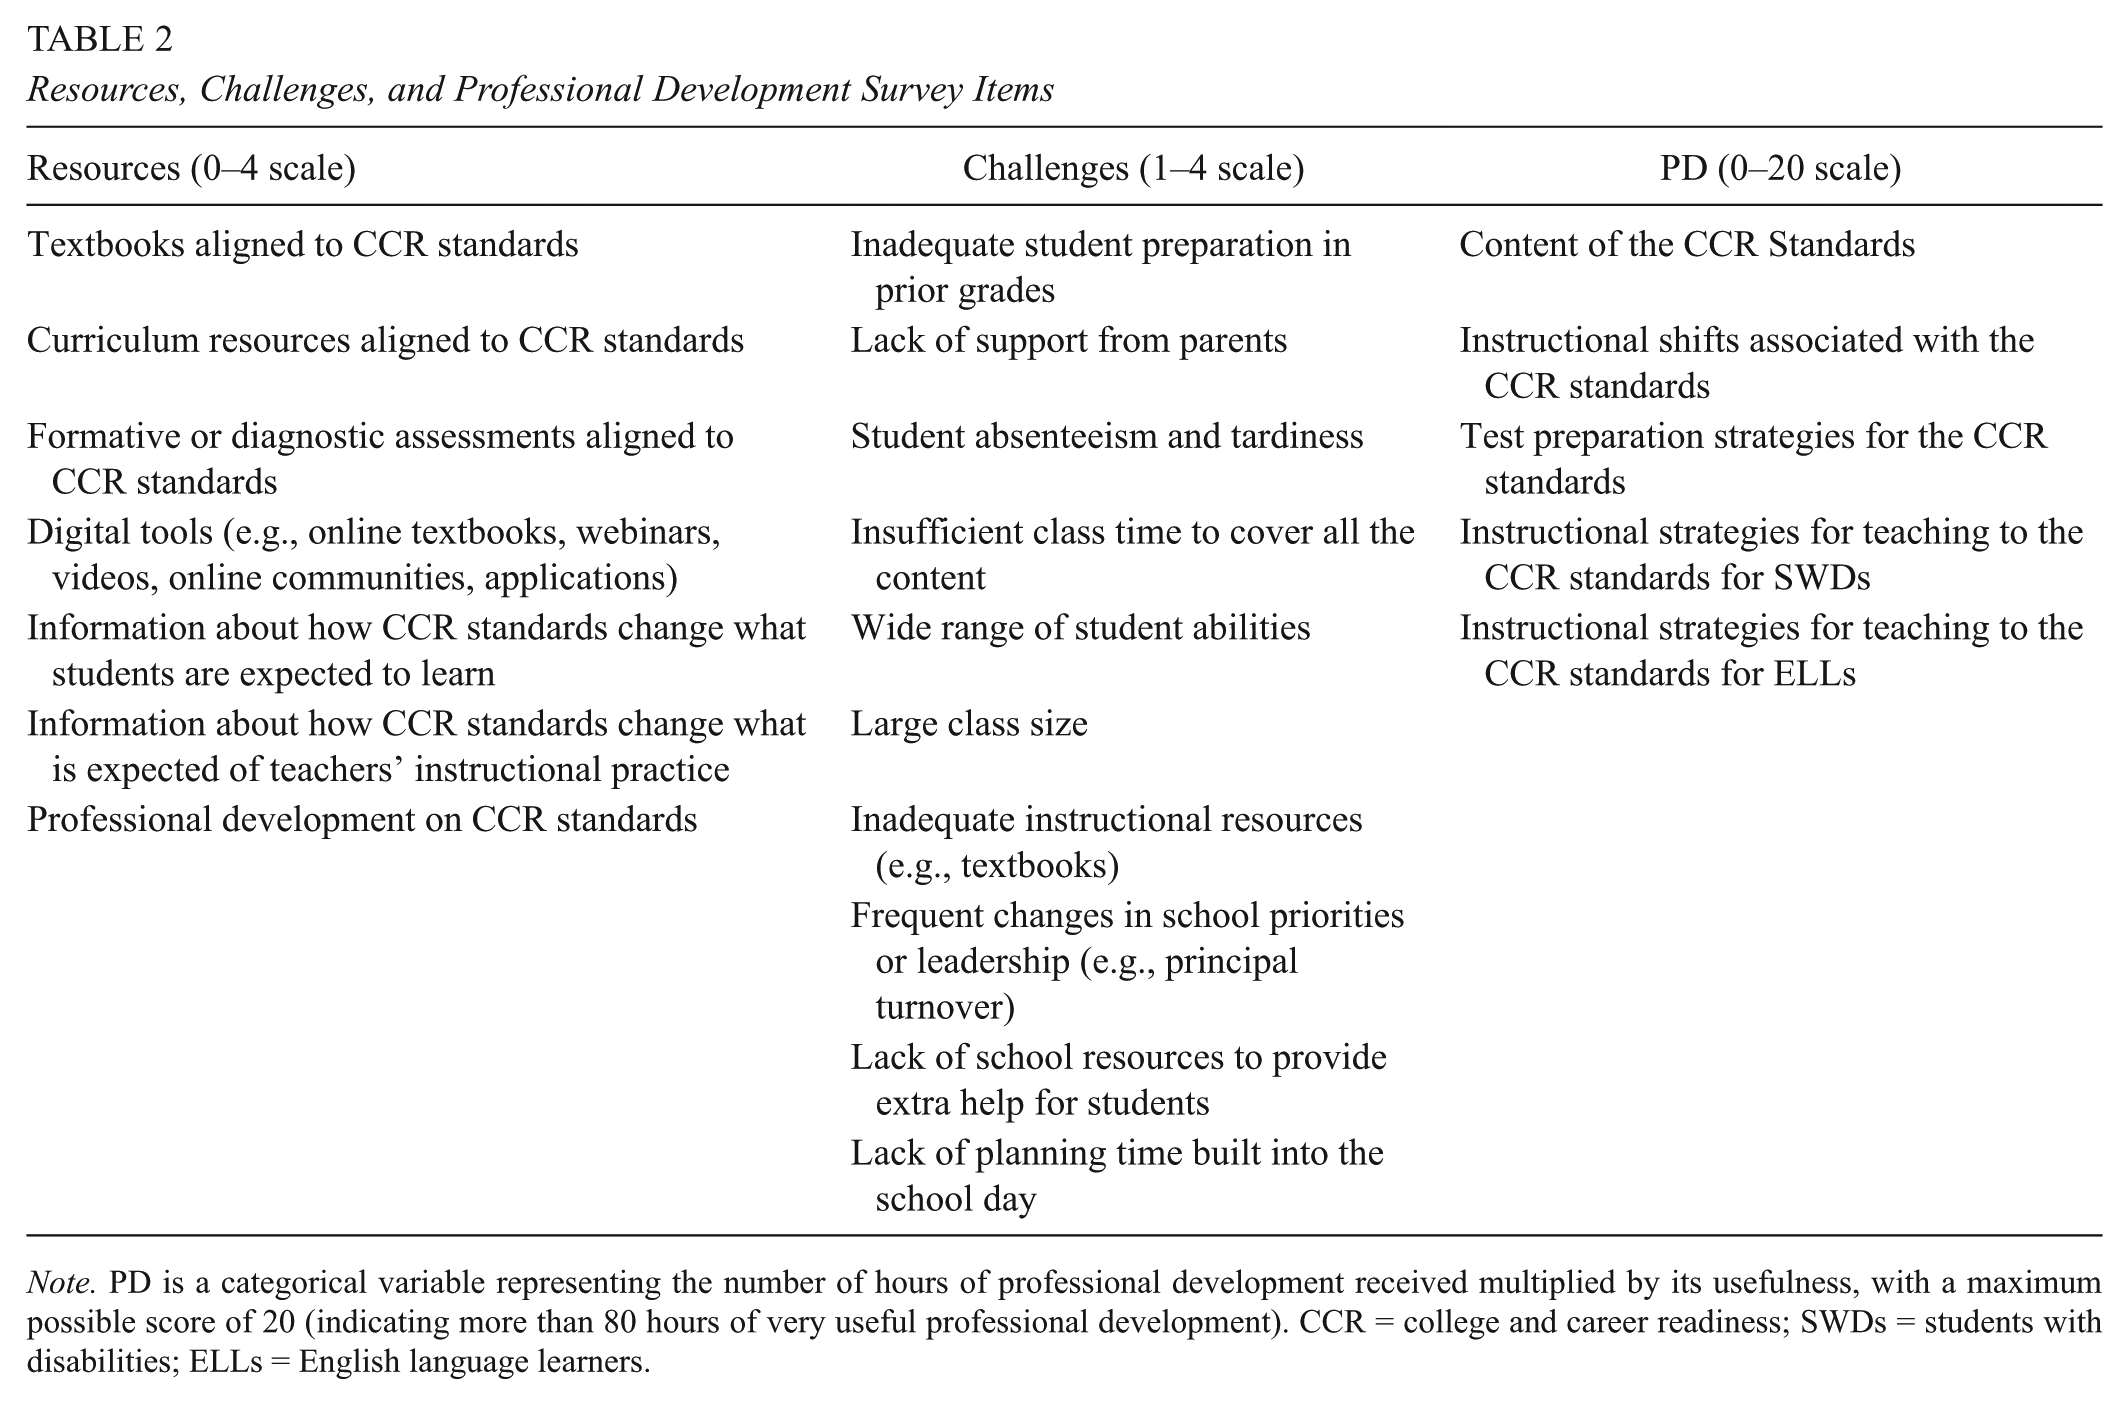
Note. PD is a categorical variable representing the number of hours of professional development received multiplied by its usefulness, with a maximum possible score of 20 (indicating more than 80 hours of very useful professional development). CCR = college and career readiness; SWDs = students with disabilities; ELLs = English language learners.
Standards-Emphasized Instruction
To measure standards-emphasized instruction, we started with content analyses of state standards in our partner states prior to the implementation of No Child Left Behind; we refer to this as pre-CCR standards. Trained content-expert raters coded the pre-CCR standards as covering topics and cognitive demands; the results were what teachers in these states should have been teaching before the CCR standards. We compared these pre-CCR results to content analyses of the current CCR standards in each state. We determined the particular content that saw the greatest average proportional increase at each grade level from pre-CCR to CCR standards, and we called this the emphasized instructional content. The de-emphasized instructional content was the content that saw the greatest decrease in coverage from pre-CCR to CCR standards. The list of emphasized and de-emphasized content by subject area can be found at c-sail.org.
This approach is known as a modified version of the surveys of enacted curriculum (SEC) approach (Porter, 2002). We asked teachers to report on the topics and cognitive demands that they covered. We then mapped content onto the topics (e.g., adding fractions) and cognitive demands (e.g., memorize, problem solve) from each state’s standards using trained content experts. This technique has been used and shown to be valid and reliable in multiple studies (Blank, 2004; Osthoff, 2007; Polikoff et al., 2011; Rowan, Camburn, & Correntti, 2004; Schmidt et al., 2001; Webb, 2002, 2007).
Findings
Research Question 1: How Do Teachers Perceive Their Policy Environment (Specificity, Consistency, Authority, Power, Stability, Resources, Challenges, and PD) Related to CCR Standards?
As shown in Table 3, scores closer to 2 (somewhat disagree on the majority of the items) versus 3 (somewhat agree) indicate perception gaps that should concern policymakers and states looking to bolster the strength of those attributes. We describe the significant differences in specificity, consistency, and authority between states, followed by the nonsignificant differences for power and stability.
Teacher Policy Attribute Means Across States, by Subject and Geography
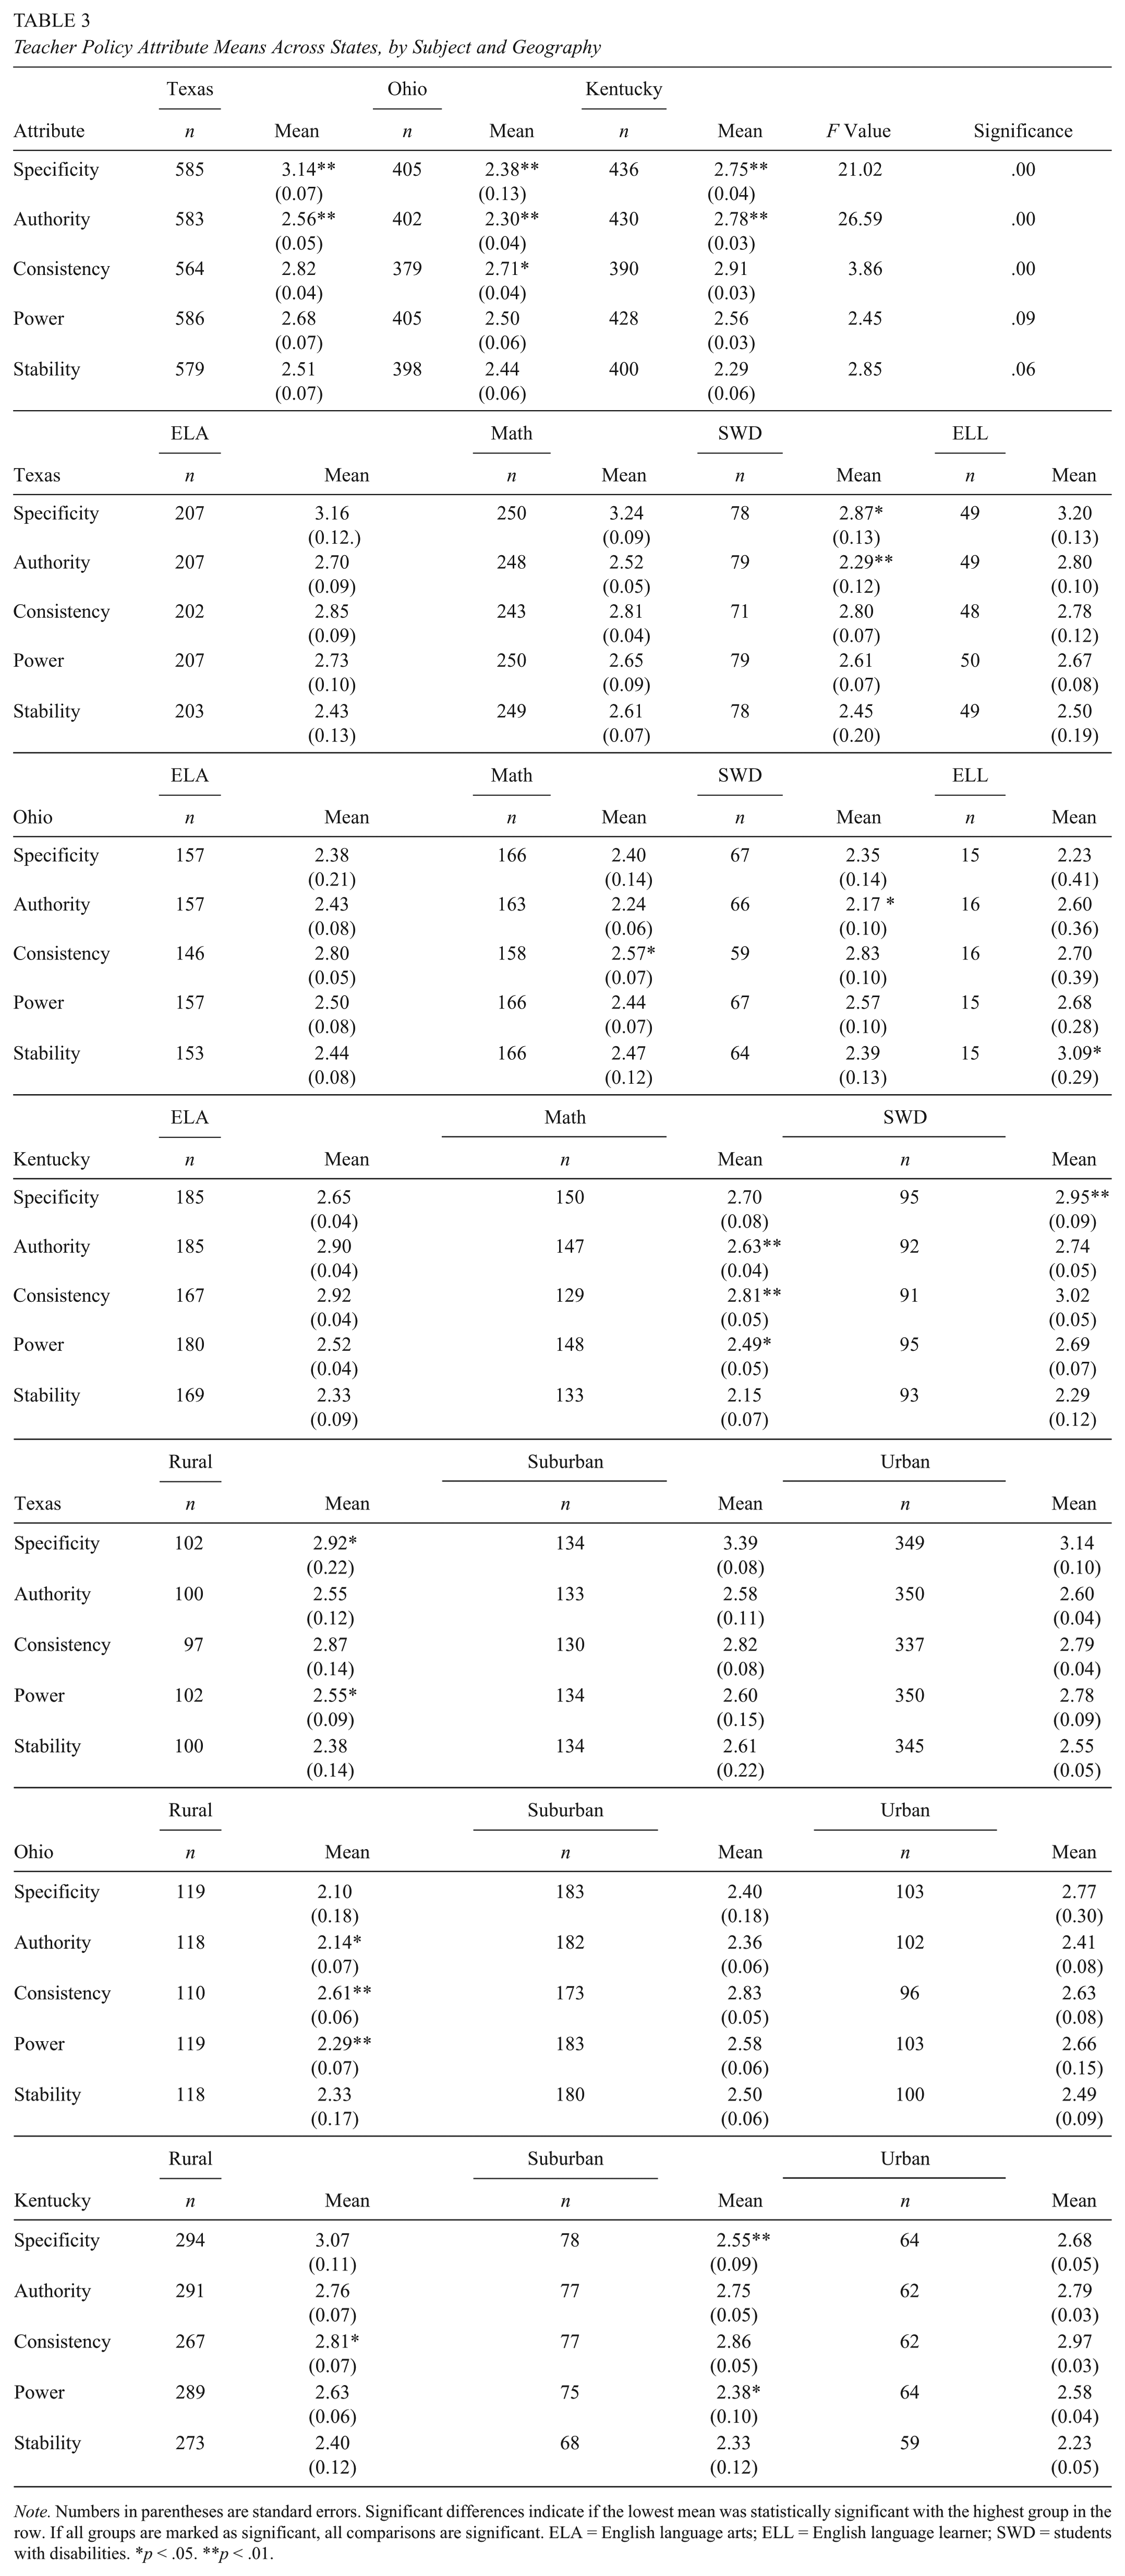
Note. Numbers in parentheses are standard errors. Significant differences indicate if the lowest mean was statistically significant with the highest group in the row. If all groups are marked as significant, all comparisons are significant. ELA = English language arts; ELL = English language learner; SWD = students with disabilities. *p < .05. **p < .01.
Teachers across all three states differed significantly in reporting the specificity of their standards environment, with Texas being highest (3.14), followed by Kentucky (2.75), and then Ohio (2.38). Ohio’s lower scores indicate that teachers there are significantly less likely to agree that districts have provided guidance on how much time to spend on content areas, the order they should teach content, and whether the standards clearly indicate what content to teach.
The states significantly differed on authority as well, with Kentucky being the highest (2.78), followed by Texas (2.56), and then Ohio (2.30). Kentucky teachers on average believed that the standards were somewhat appropriate, rigorous, and flexible for all students, whereas Texas and Ohio teachers were more ambivalent.
For consistency, Kentucky again was the highest at (2.91), followed by Texas (2.82), and then Ohio (2.71). But only Ohio’s and Kentucky’s consistency scores were significant, a difference of only 0.20. Consequently, we do not interpret this difference as particularly meaningful. All three states’ teachers perceive curricula, assessments, professional development, and administrative feedback to be aligned to their states’ CCR standards.
We found no statistically significant differences in how teachers rated the power of their policy environments, with Texas at 2.68, Kentucky at 2.56, and Ohio at 2.50. It may be the case that the frozen nature of accountability systems in 2016, with districts and teachers held harmless during the implementation of new assessments and systems until the approval of new ESSA accountability plans, kept power scores hovering around 2.5. Respondents were between somewhat agree and somewhat disagree in their opinion that they were being punished or rewarded for implementing the standards.
We found no statistically significant across-state differences in stability either. Stability scores were highest in Texas (2.51), followed by Ohio (2.44), and then Kentucky (2.29), with a score of 2 representing 3 years and a score of 3 representing 4 years. Most respondents expected the standards, tests, and current proficiency cut scores to last between 3 and 4 years.
We next tested resources, challenges, and professional development across states and include these results in Table 4. Texas teachers reported significantly higher useful resources (2.02), followed by Ohio (1.86), and then Kentucky (1.80). As for challenges, we found no statistically significant differences across states in Table 4 and thus focus on the average for the top five challenges in all three states, shown in Figure 2. The largest challenge by far was a wide range of student abilities, which 71% of teachers reported as a major or moderate challenge, followed by inadequate student preparation in prior grades (62%) and a lack of support from parents (59%).
Resources, Challenges, and Professional Development (PD) by Teachers’ Geography

Note. Numbers in parentheses are standard errors. Significant differences indicate if the lowest mean was statistically significant with the highest of the remaining two groups. *p < .05. **p < .01.

Cross-state percentages of moderate or major teacher challenges.
There were, however, significant and large differences in terms of the professional development teachers received across states. The largest possible PD score was 20 (5 types of standards PD × 4 = very useful), with Texas ranking the highest at 6.02, Ohio ranking second at 4.87, and Kentucky ranking last at 4.00. This finding suggests that Texas may have professional development practices worth emulating.
Research Question 1: To What Extent Are Teacher Perceptions of Their Policy Environment Similar or Different for Teachers of ELA, Math, SWDs, and ELLs?
We report unstandardized effect sizes to match the Likert scale—an effect size of 1.00 would mean a change from one category to the next (i.e., somewhat agree [3] becomes [4] strongly agree). In Table 3, only a few comparisons were significant with small effect sizes (ES). Specificity was significantly lower for SWD teachers than math teachers in Texas (2.87, ES = 0.37) but significantly higher for SWD teachers compared to math teachers in Kentucky (2.95, ES = 0.25). The authority scores for teachers of SWDs in Texas (2.29, ES = 0.41) and in Ohio (2.17, ES = 0.26) were significantly lower compared to ELA scores in those states. Math teachers experienced significantly lower consistency in Ohio (2.57, ES = 0.23) compared to ELA teachers. Scores below 2.5, which means responses skewed toward “disagreeing” that their policy environments were specific, consistent, authoritative, powerful, and/or stable, represent areas where state and district implementation efforts could be strengthened.
We found no statistically significant differences in the resources that different types of teachers received. Figure 3 details teacher subgroups that experienced significantly different challenges compared to general educators. Additional tables comparing challenges can be found at c-sail.org, but there were no clear patterns across the three states.

Significantly different students with disabilities (SWD) and English language learner (ELL) challenges compared to general educators (math and English language arts [ELA]).
We also found a few statistically significant differences in the types of professional development that teachers received. More information on the professional development received by teachers of SWDs compared to general education teachers (who consistently received significantly less PD on how to help SWDs attain grade-level standards) can be found at (Edgerton, Fuchs, & Fuchs, in press).
Research Question 1: To What Extent Are Teachers’ Policy Environments Different Based on Whether They Teach at Urban, Suburban, or Rural Schools?
Next, we considered whether policy environments differed by urbanicity in Table 3. We hypothesized that rural teachers would report having lower levels of the policy attributes, and this was often the case. Among teachers within the same state, there were many more significant differences based on geography compared to subject-area differences, as shown in Tables 3 and 4 and described in the following. Specificity, authority, and power were all seen as significantly lower in rural areas in both Texas and Ohio compared to the highest group, which was either suburban or urban. In Kentucky, rural teachers reported significantly lower specificity than urban teachers. We report the significant results only, in order from highest to lowest.
In Texas, suburban teachers had significantly higher specificity (3.39), followed by urban (3.14), and then rural (2.92) teachers. Power was significantly higher among urban teachers (2.78), followed by suburban (2.60), and then rural (2.55).
In Ohio, urban teachers had significantly higher authority (2.39), followed by suburban (2.35), and rural (2.24); and power (2.66 for urban teachers, 2.58 for suburban, and 2.29 for rural). Suburban teachers in Ohio reported significantly higher consistency (2.83), followed by urban (2.63), and rural (2.61). In Kentucky, specificity was significantly higher among urban teachers (3.01), followed by rural (2.69), and then suburban (2.62).
Though we found no significant differences by teachers’ geography for professional development, we found significant differences in terms of resources and challenges. In Table 4, we demonstrate that in Ohio, rural teachers received statistically fewer useful resources than suburban teachers (ES = 0.21), and Kentucky rural teachers received statistically fewer useful resources than urban teachers (ES = 0.33). Also in Ohio, urban teachers faced significantly greater challenges than suburban teachers (ES = 0.31), while Kentucky rural teachers faced significantly greater challenges than both urban and suburban teachers (ES = 0.25–0.26).
Research Question 2: To What Extent Are Teachers Covering Content Emphasized in Their State’s CCR Standards? How Does Coverage of Standards-Emphasized Content Differ for Teachers of ELA, Math, SWDs, and ELLs and for Rural, Suburban, and Urban Teachers?
In an ideal policy environment, we would expect to see significantly more coverage of the standards-emphasized content when significance tested against the standards de-emphasized content. As Table 5 shows, we found that in all three of our study states, opposite of our expectations, ELA elementary teachers covered significantly less of the standards-emphasized content. At the high school level, the inverse was true: In Texas and Ohio, ELA high school teachers covered significantly more of the standards-emphasized content, though in Kentucky, there was no significant difference.
Comparing Standards-Based Content Emphasis by Subject and Geography

Note. For n values <8, ELL teacher respondents are excluded. Numbers in parentheses are standard errors *Indicates significant differences for between emphasized/de-emphasized within subject (i.e., ELA teachers vs. SWD teachers on emphasized instruction), or between rural and at least one other geographic group, or for the difference between emphasized and de-emphasized in the “Difference” column. ELA = English language arts; ELL = English language learner; SWD = students with disabilities. *p < .05. **p < .01.
In every state, elementary math teachers covered significantly more emphasized content, which was the opposite of the ELA trend. At the high school level, only one state, Kentucky, showed any significant difference in math content coverage—and there, math teachers covered significantly less of the emphasized content.
In no state were differences between general education and ELL teachers significant, pointing to a promising trend of ensuring the same content for those students. The same was not true, however, for teachers of SWDs in Texas and Ohio, where teachers taught significantly less of the standards-emphasized content. In Texas, rural high school math teachers taught significantly less standards-emphasized content than suburban high school math teachers. In Ohio, rural ELA teachers taught significantly less standards-emphasized content at both the elementary and the high school levels compared to suburban teachers.
Research Question 3: To What Extent Do Teachers’ Policy Environments, Challenges, Resources, and PD Predict the Degree of Standards-Emphasized Instruction?
Incorporating the previous analyses as hypothesized predictors, Table 6 shows the results of our HLM. We find few significant predictors for any of our hypothesized independent variables, with the exception of authority. Overall, these findings suggest weak linkages between standards-emphasized instruction and four out of five policy attributes, resources, challenges, and professional development. However, authority is a positive significant predictor of emphasized content for ELA teachers in all three states (ES = 0.15, β = 0.23 in Texas; ES = 0.12, β = 0.20 in Ohio, and ES = 0.18, β = 0.24 in Kentucky). Resources also significantly and positively predicted standards-emphasized instruction among math teachers in Texas (ES = 0.26, β = 0.25).
Results of Hierarchical Linear Regression Model for Standards-Emphasized Content by State and Subject Area

Note. Standard errors in parentheses after weights were applied. *p < .05. **p < .01.
Considerations in Interpreting the Results
As with all survey data and nonexperimental studies, there are important caveats to interpreting these results. Our survey items are self-report, and therefore, predictive relationships within them may contain endogeneity. It should be noted that in our survey we did not signify which content items were aligned with the standards; thus, teachers were not evaluating the alignment of their instruction. Further, teachers reported on a range of subject-specific content, and ELL and SWD teachers reported on both subjects, which should make our instructional conclusions more valid. Our method (surveys of enacted curriculum) has also been shown to be reliable and valid across multiple studies (Blank, 2004; Osthoff, 2007; Polikoff et al., 2011; Webb 2002, 2007).
Still, we do not use causal inference methods, so the relationships we find are predictive or correlational, not causal. Interpreting survey data should acknowledge the complexity of different ways of knowing. This includes the idea that quality of teaching can differ dramatically from observation and self-report (Cohen, 1990), while behaviorally based behaviors have reportedly high correlations with observations (Mayer, 1999). And as we noted previously, teacher quality and instructional content may not be closely related (Desimone et al., 2016; Polikoff & Porter, 2014). Triangulating our data with policy document analysis and classroom observation would undoubtedly add dimensions and insight to our findings.
Discussion
One of the main contributions of our study is the use of the policy attributes framework to quantify implementation and test for relationships to instruction. Using this framework, one of our key findings is that teacher reports of state standards policies and the alignment of teachers’ instruction to standards are remarkably similar despite state-level differences in written policy, as judged by studies of state policy during this same time period (Alexander, Jang, & Kankane, 2017; Polikoff, 2017). We find suggestive evidence in three states of a federalizing effect, where teachers are less sensitive and cognizant of changes in local policy and more attuned to national policy, mirroring trends toward the nationalization of education policy opinion (Levendusky, 2013; Polikoff, Hardaway, Marsh, & Plank, 2016; Supovitz, 2017). These similarities held for the two states that adopted the CCSS—Kentucky and Ohio—as well as Texas, the state in our study that developed its own standards. The existence of these similarities suggests that the common standards movement, even in its current state-by-state iteration, has been successful at shaping common policy perceptions among teachers. This finding by itself, absent any causal evidence of student outcomes, is a victory for those who have sought to standardize district-level education policies, even in states like Texas that have been notoriously resistant to federal intervention.
Despite many similarities, we found some important differences by subject, urbanicity, and special populations. Teachers of SWDs report lower authority (buy-in) for the standards and significantly less standards-emphasized instruction, which is consistent with previous work highlighting the tension between standardization and differentiations for SWDs (Dorn et al., 1996; Figueroa-Murphy & Haller, 2015). The persistence of these special education divides may not be surprising, but they remain of great practical relevance. In a related study, we note that while district administrators and principals in these states think the standards are appropriate for SWD, teachers disagree (Edgerton et al., in press). This study provides further evidence for the continuing exclusion of SWDs from standards-emphasized instruction based on teachers’ own self-report. This exclusion from the technical core remains deeply troubling—or, viewed more positively—suggests that teachers are in fact differentiating their instruction to meet the demands of individualized education plans.
Rural teachers as a whole experienced less robust policy environments, though this phenomenon was more pronounced in Texas and Ohio, which are more urban states overall than Kentucky. With an increased focus on rural America among federal policymakers, this finding highlights an important divide within the teaching profession itself in the implementation of policy. Our findings provide suggestive evidence of what Jimerson (2005) calls “placism”—the inherent bias toward urban areas in the construction of federal education policy. If SWD teachers and rural teachers do not perceive their policy environments to be as strong, we might anticipate declines in standards-emphasized instruction and worsening achievement gaps over time. In other words, students on individualized education plans and rural students may fall farther and farther behind if they do not make instructional shifts in line with their colleagues. We already find these teachers covering significantly less of the standards-emphasized content.
Another key difference we found is between math and ELA teachers. Standards-based policy seems to have taken root most significantly among elementary math teachers. In all three of our partner states, elementary math teachers are significantly more likely than elementary ELA teachers to cover more of the content emphasized by their state’s standards. This finding is consistent with previous work suggesting variation in outcomes for math and ELA (Dee & Jacob, 2011; Porter et al., 2011) and that ELA practices may be more difficult to change (Achieve, 2013).
Of the policy attributes, authority was the only one predictive of standards-emphasized instruction; this finding is consistent with prior work showing that authority was the strongest predictor of lasting change in the context of earlier school reform attempts (Desimone, 2002). Taken together, these instructional findings show that state policies may struggle to promote one type of content over another, as has been the case for much of the course of standards-based reform (Cohen, 1990). In all three states, authority and power were normally distributed; as a result, these variables were better predictors in our model. The other policy attributes were slightly skewed, which we would expect to result in them being less predictive. States seem to be showing much more success at aligning ELA instruction than math instruction through the policy attribute of authority, or buy-in, compared to rewards and sanctions (power) or specific curricular materials (specificity).
Implications
To return to a question raised in the introduction, is standards-based reform on shaky ground? We show that relationships between policy and instruction remain modest, similar to their relationships in previous reform environments (T. Smith, Desimone, & Ueno, 2005), but these relationships are similar across state lines. The use of the attributes in both constructing and analyzing these data reveals that teachers’ intrinsic belief in the appropriateness of the standards does relate to their instruction and that merely providing support (through resources and professional development) is not enough. We suggest that policy does have the ability to boost the technical core rather than remaining a loosely coupled system (Coburn, 2004). While we take no position concerning the ethics, relative importance, and effects of standards-based reform, we show that the maintenance of standards-based reform rests on teachers believing in the standards. We find that teachers in three states do find them useful and appropriate for planning instruction, with the exception of their students on individualized education plans. We suggest that while some may view this instructional gap as problematic, perhaps teachers are evincing their belief that they know best how to serve their students. A more pessimistic reading of our results suggests a continuing environment of lower expectations for students with disabilities (Edgerton et al., in press).
If teachers across three states report remarkably similar policy environments, what does this mean for the future of K–12 standards policy? State policy environments may have a marginal relationship to instruction, particularly in mathematics, another example of “tinkering towards utopia” (Tyack & Cuban, 1995). But viewed more positively, this study may be highlighting the relative success of CCSS in creating common policy perceptions six years after their adoption—even in a state like Texas that did not formally adopt them but instead echoed them in their own iteration (Porter et al., 2011). Other studies focus on highlighting differences in state laws and regulations (e.g., Alexander et al., 2017), but we find that these state policy differences do not manifest themselves in significantly different teacher perceptions that are meaningful across most of the policy attributes. Instead, we suggest that if the first goal of setting standards is to shift instruction, our significant authority finding implies that the first step is to cultivate teachers’ belief in seeing their state’s standards as useful, manageable, and appropriate. Developing a model with all of the attributes bolsters the notion that there is no silver bullet to change teacher behavior. Policymakers, administrators, and researchers must continue to work to convince teachers that changing their instructional habits benefits their students as well as provide evidence that a causal relationship exists. In the current policy environment, local actors—in this case, teachers—are the ones truly driving (or resisting) change (Marsh & Wohlstetter, 2013).
Coburn (2016) cautions against using policy research to learn the same lessons over and over again, and this study makes a new and important contribution to discussions of state accountability systems. Here we find that using the policy attributes theory reveals that authority is the only attribute with significant relationships to standards-emphasized instruction, even more so than power. Authority is the policy attribute that captures the “soft” persuasiveness of the standards rather than the “hard” power of rewards and sanctions. Policymakers often gravitate toward easy to quantify solutions, such as curricula (which provide specificity) and accountability (which provides power mechanisms for rewards and sanctions). Our findings suggest that facilitating teacher understanding, buy-in, and belief in the standards may be a more powerful leverage point.
While building up authority may be more difficult, expensive, and time-consuming, our results show how important these inherent teacher perceptions may be to shifting instruction, though we note again our results are correlational in nature. By examining how different teachers experience their standards policy environments and how those experiences are related to instruction, we aim to guide policymakers in identifying targets for increased support and attention. If policymakers wish to realize the goal of standards-based reform—a K–12 system where all students regardless of subgroup status receive standards-emphasized, grade-level instruction—we all must deepen our understanding of how we can shape policy in a manner that facilitates popular teacher support. This study demonstrates that many implementation gaps in instruction persist several years after the adoption of more rigorous standards and that the most well-funded policies for achieving instructional change (e.g., teacher evaluation and increased accountability) show insignificant relationships to instruction. Meanwhile, recent and developing studies find that achievement gains have slowed in this latest era (Alexander et al., 2017). Policymakers may be well advised to focus on cultivating teacher buy-in as they seek resources to support teachers’ standards implementation.
Footnotes
Appendix
The following appendix lists all of the survey items used to construct the policy attribute scales.
Acknowledgements
Many thanks, first and foremost, to the Institute of Education Sciences for funding this work. We thank our collaborators at the American Institutes for Research, specifically Michael Garet and Seth Brown, who led the survey data collection, and their team, as well as Rui Yang, who assisted with the Stata coding and cleaning of the survey data. We are also grateful for the participation of our partner states, Texas, Ohio, and Kentucky, who provided feedback on technical reports. Finally, a thanks to the implementation team at the University of Pennsylvania Graduate School of Education, as well as Andrew Porter, who commented on earlier drafts of this paper.
Authors’ Note
The content is solely the responsibility of the authors and does not necessarily represent the official views of the Institute of Education Sciences or the U.S. Department of Education.
Declaration of Conflicting Interests
The authors declared no potential conflicts of interest with respect to the research, authorship, and/or publication of this article.
Funding
The authors disclosed receipt of the following financial support for the research, authorship, and/or publication of this article: This research was supported in part by Grant R305C150007 from the Institute of Education Sciences in the U.S. Department of Education to the University of Pennsylvania.
Authors
ADAM K. EDGERTON is a third-year PhD student in education policy at the University of Pennsylvania Graduate School of Education. His research interests include the politics of standards-based reform, teacher policy, and collective bargaining agreements.
LAURA M. DESIMONE is the associate dean of research at the University of Delaware’s College of Education and Human Development. She studies policy effects on teaching and learning.