
Abstract
This study examines whether parents’ overall satisfaction with their child’s early childhood education (ECE) program is correlated with a broad set of program characteristics, including (a) observational assessments of teacher-child interactions; (b) structural features of the program, such as teacher education and class size; (c) practical and convenience factors (e.g., hours, cost); and (d) a measure of average classroom learning gains. It then describes associations between parents’ evaluation of specific program characteristics and externally collected measures of those features. Leveraging rich data from a sample of low-income parents whose 4-year-olds attend publicly funded ECE programs, we find little correspondence between parents’ evaluations of program characteristics and any external measures of those same characteristics. We discuss policy implications, especially in light of recent federal and state informational initiatives, which aim to help families make informed ECE choices.
In recent years, there has also been growing interest among both policymakers and researchers in informational interventions—programs or policies that work by providing individuals with relevant information at key decision-making points—as another potentially powerful lever for quality improvement in ECE (Dechausay & Anzelone, 2016; Zellman & Perlman, 2008). The 2014 reauthorization of the Child Care and Development Block Grant emphasized consumer information and required that all states create easy-to-use search portals where parents could identify child care options and view information about their safety and quality. Similarly, the Obama administration’s Race to the Top–Early Learning Challenge grants, which competitively allocated roughly $1 billion to 20 states since 2011, required applicant states to implement and validate a quality rating and improvement system (QRIS), which is an early childhood accountability system meant to improve quality in part by providing parents with quality information about ECE programs.
The idea behind these initiatives is that families, and particularly, low-income families, struggle to navigate the complex ECE landscape and to evaluate the quality of their ECE options, leading them to make suboptimal choices. Proponents of informational interventions posit that by providing parents with clear, easy-to-access information about the quality of their ECE options, parents will select higher-quality programs, creating incentives for programs to improve and for the lowest-quality ECE settings to exit the market.
The promise of these increasingly popular informational campaigns depends on the extent to which an inability to accurately assess ECE quality contributes to parents selecting suboptimal options. Existing research does show that most parents report high levels of satisfaction with their child’s program and that they rate program features more favorably than do trained observers (e.g., Barros & Leal, 2015; Cryer & Burchinal, 1997; Grammatikopoulos, Gregoriadis, Tsigilis, & Zachopoulou, 2014; Helburn & Bergmann, 2002; Meyers & Jordan, 2006)—findings consistent with the notion that parents struggle to accurately assess their child’s program.
However, parents’ high levels of self-reported satisfaction do not necessarily imply that parents are inaccurate assessors of program quality, nor does it guarantee that informational interventions will lead to improvements. If parents are choosing lower-quality programs because high-quality programs are nonexistent, oversubscribed, or too costly, then information alone will likely prove ineffective. It could be that parents—particularly, low-income parents who have less flexibility in choosing care—have chosen the best care that was available to them and rate their programs in comparison to other local options.
Parents’ satisfaction may also be driven by parents’ accurate evaluation of factors, such as location, hours, cost, or other program features, that they find important but are not typically explicitly included as quality measures. To date, studies of parents’ evaluations of child care programs have compared parent and researcher ratings, using tools specifically designed by researchers to capture the ECE learning environment (e.g., Cryer & Burchinal, 1997; Helburn & Howes, 1996; Mocan, 2007). It may be that the aspects of program quality that these tools capture are not the ones parents consider most central when selecting programs for their children or when evaluating their child’s care setting.
Existing research has not examined how a broader set of program characteristics, including factors such as cost, location, and hours, relate to parents’ satisfaction with their child’s ECE program, nor have existing studies examined whether parents are able to evaluate ECE programs on key dimensions that may drive decision making, particularly among relatively constrained low-income parents. This is an important gap in the literature. To design effective information systems, policymakers need a clear understanding of the program features that drive parents’ satisfaction with their care setting—and whether parents are already able to accurately assess those features. Given the targeting of many of these interventions toward low-income families (e.g., the Child Care and Development Block Grant serves families that receive child care subsidies; in many states, QRIS participation is required only for programs receiving public dollars), it is particularly important to answer these questions among low-income families who face different choices and constraints than their higher-income counterparts.
This study aims to fill these gaps using data from a sample of low-income families whose children attend publicly funded ECE programs in Louisiana (Head Start, prekindergarten, and subsidized child care). We test whether parents’ satisfaction with their child’s program is predicted by a broad set of program features, including (a) observational measures of process quality (e.g., measures of teacher–child interactions), (b) structural quality measures typically included in QRIS systems (e.g., teacher education and experience), (c) measures of program convenience (e.g., hours of operation), and (d) average classroom learning gains. We also explore to what extent parents’ evaluations of specific program features (e.g., warmth, convenience, etc.) are related to these measures. This study will inform both policymakers seeking to design effective informational interventions and researchers looking to understand how parents evaluate the quality of their child’s ECE program.
The Promise of Information Interventions in ECE
Providing consumers with accessible information about the quality of service providers can lead to changes in their behavior and to quality improvements in the rated organizations. These types of informational interventions have been effective across a variety of settings, ranging from hospitals (Dafny & Dranove, 2008; Jin & Sorenson, 2006; Pope, 2009) to restaurants (Jin & Leslie, 2003; Wong et al., 2015). In the K–12 sector, experimental evidence indicates that parents shift their school choices in response to easy-to-understand school quality information (Hastings & Weinstein, 2008) and that, in turn, their children’s outcomes improve. Quasiexperimental research also suggests that publication of school report cards leads students to leave poorly evaluated schools (Friesen, Javdani, Smith, & Woodcock, 2012; Hanushek, Kain, Rivkin, & Branch, 2007; Koning & Van der Wiel, 2013).
This literature suggests a potential role for information interventions in ECE, and indeed some initial experimental work shows promise (Dechausay & Anzelone, 2016). However, the ECE market differs from the K–12 setting in ways that may influence the potential impact of information interventions. In particular, relative to K–12, the ECE market is characterized by far greater variability with respect to hours of operation, cost (e.g., between free Head Start and prekindergarten programs and private child care centers that generally require a fee, even when subsidized), available transportation, and other logistical factors. Moreover, these differences from the K–12 setting may be particularly relevant for low-income families, who face fewer choices than high-income families and have more binding constraints due to work schedules, transportation issues, and other logistical concerns. Low-income families likely have fewer choices than their higher-income counterparts, and this difference in choice is likely greater for ECE than K–12 decision making. Indeed, although parents report that they value warm, safe, and engaging ECE programs (Barbarin et al., 2006; Bassok, Magouirk, Markowitz, & Player, 2017; Chaudry et al., 2011; Cryer & Burchinal, 1997; Meyers & Jordan, 2006; Rose & Elicker, 2008; Shlay, 2010), research indicates that their actual choices—especially among low-income families—are oftentimes driven by practical concerns around affordability, location, and convenience (Chaudry et al., 2011). Parents constrained by practical factors may focus primarily on those factors and be less responsive to the quality measures typically included in informational interventions, such as QRIS.
Parents’ Satisfaction With and Evaluation of Their Child’s ECE Program
Parents tend to report being highly satisfied with their child’s ECE program (Helburn & Bergmann, 2002; Meyers & Jordan, 2006). For example, a recent nationally representative poll of families with children under 5 reported that 88% of parents rate their child’s program as “very good” or “excellent” (National Public Radio, 2016). Similarly, data from a representative survey of families using child care in Minnesota revealed that 86% of parents would “always” choose the same program again (Chase & Valorose, 2010). This pattern persists even among low-income samples, for whom program quality tends to be lower. For example, Raikes, Torquati, Wang, and Shjegstad (2012) reported that 74% of their sample of subsidy-receiving mothers rated the overall quality of their child’s program as “perfect” or “excellent.” Similarly, Van Horn, Ramey, Mulvihill, and Newell (2001) found that nearly all mothers in their sample of subsidy recipients reported being highly satisfied with their current ECE program.
These high levels of satisfaction are consistent with the K–12 literature, which also finds that parents rate their children’s schools highly (Education Next, 2016). However, parents’ high ratings of ECE programs are incongruent with the low levels of quality in many ECE programs, particularly those serving low-income students, as measured using researcher-developed observational tools focused on the classroom environment. For example, Burchinal and colleagues (2010) reported that 87% of publicly funded preschool classrooms have levels of instructional support that are too low to promote learning.
There are a number of plausible explanations for this misalignment. The first is that parents’ satisfaction with their program may be driven by features that are not typically included in researchers’ definitions of quality. A parent may, for example, rate a program highly because it is close to their workplace, offers long hours, and provides two meals daily. This type of “functional quality” is distinct from “quality” as typically measured by researchers or included in QRIS systems. In this scenario, parents’ high levels of satisfaction may reflect accurate evaluations of the aspects of ECE that are most salient to them. Existing research has not explored this possibility.
A second possible explanation for the high levels of parents’ satisfaction is that parents are poor assessors of quality. Theoretical work suggests that ECE markets are characterized by imperfect information (Blau, 2001; Mocan, 2007; Morris, 1999). Most parents do not spend enough time in an ECE program to accurately evaluate program quality, and young children are unreliable reporters of program quality. Instead, parents rely primarily on recommendations from family and friends, and on program features that may be easy to discern but are weak indicators of quality (Forry, Isner, Daneri, & Tout, 2014; Layzer, Goodson, & Brown-Lyons, 2007; Meyers & Jordan, 2006; Mocan, 2007). This asymmetry of information may result in adverse selection in the ECE market and the provision of lower-quality ECE than is optimal (Mocan, 2007; Morris, 1999). If this is the case, informational interventions may prove particularly promising.
An existing body of empirical research has directly explored parents’ ability to evaluate ECE programs by first asking parents to rate their child’s program using an observational measure that aims to capture aspects of the classroom environment and then comparing these parent ratings with those completed by trained observers on identical scales. These studies consistently indicate that parents rate the quality of their child’s ECE program more highly than do trained observers (Barros & Leal, 2015; Grammatikopoulos et al., 2014; Helburn & Howes, 1996). For example, Cryer and Burchinal (1997) demonstrated that when parents and trained observers both use the Early Childhood Environment Rating Scale (ECERS; Harms, Clifford, & Cryer, 1998), parents rated program quality 6.07 (out of 7), whereas the trained observers rated the same programs as 3.47.
Parents’ inflated ratings of the items included in these observational scales—in conjunction with parents’ high levels of satisfaction—are often seen as evidence of their inability to discern between low- and high-quality programs, an assumption that has, in part, driven the proliferation of informational interventions in ECE markets. However, the fact that parents rate program features more highly than trained observers does not necessarily indicate a problem accurately assessing quality. One possibility is that parents are accurate evaluators of their child’s ECE setting, but their sense of guilt or anxiety around leaving a young child in anything but a high-quality program may keep them from characterizing their child’s program as low quality when responding to surveys (Lamb & Ahnert, 2006). Another possibility is that parents’ inflated ratings of ECE programs may still be correlated with observer ratings. The evidence on this is mixed. Several studies find only modest correlations between parent evaluations and trained raters (Barros & Leal, 2015; Cryer, Tietze, & Wessels, 2002; Torquati, Raikes, Huddleston-Casas, Bovaird, & Harris, 2011). However, Mocan (2007) used the same data as some of these earlier studies and demonstrated that parents’ ratings do parallel those of trained observers after scaling for overestimation.
Other recent studies also provide evidence that parents’ ratings can align with externally collected measures. For instance, Araujo, Carneiro, Cruz-Aguayo, and Schady (2016) report that Ecuadorian parents’ ratings of kindergarten teachers are correlated with both the average value-added score of the teacher’s classroom and the teacher’s score on the Classroom Assessment Scoring System (CLASS; Pianta, La Paro, & Hamre, 2008), a widely used tool for measuring the quality of teacher–child interactions. Similarly, in the U.S. K–12 sector, Chingos, Henderson, and West (2012) find that parents’ assessments of school quality are strongly related to average test scores.
Limitations of the Existing Literature
The existing research on both parents’ satisfaction and their ability to accurately evaluate ECE quality is limited in a number of important ways. First, as noted above, research shows that low-income families are constrained by cost and convenience considerations when selecting ECE for their children (Forry et al., 2014; Forry, Simkin, Wheeler, & Bock, 2013; Grogan, 2012; Kim & Fram, 2009; Rose & Elicker, 2008). For example, families who work full-time or who have multiple employment settings may find half-day ECE programs or programs that require substantial additional commute time frustrating or ultimately untenable. However, no studies we are aware of have examined whether parents’ satisfaction with ECE is related to program characteristics such as their location, cost, or other practical features. If parents’ program satisfaction is tightly linked to objective measures of cost and convenience, and parents are able to accurately evaluate these program features, it may be that parents are already identifying and using the features of quality that are most relevant for their choices. If this is the case, informational interventions may not change parents’ ECE decisions.
Second, and relatedly, nearly every study that compares parent evaluations with trained observers uses the Environmental Rating Scales (ERS; Harms et al., 1998). These scales represent one widely used measure of ECE quality. However, a number of recent studies have raised questions about the ERS (Gordon, Fujimoto, Kaestner, Korenman, & Abner, 2013; Hofer, 2010; Layzer & Goodson, 2006; Perlman, Zellman, & Le, 2004). Even assuming that the ERS scales accurately capture quality, they may not measure all the aspects of quality that are most salient in the decision making of families, particularly, low-income families.
Third, most existing studies that directly compare parents’ evaluations of quality with observed quality were conducted prior to the rise of publicly funded prekindergarten and underrepresent low-income families (Cryer et al., 2002; Cryer & Burchinal, 1997) or were conducted overseas (Araujo et al., 2016; Barros & Leal, 2015; Grammatikopoulos et al., 2014). There are no studies that reflect the current early childhood landscape and, particularly, the diverse set of preschool options available to 4-year-olds (e.g., Head Start, state prekindergarten, subsidized child care).
Present Study
In this study we address two research questions. First, to what extent is overall parental satisfaction with a child’s ECE program related to a wide range of specific program features? Second, to what extent are parents’ evaluations of specific program features aligned with external evaluations of those features?
This study is the first we are aware of to examine the correlates of parental satisfaction with ECE. It improves on the existing literature in several ways. The primary one is that we consider a far more comprehensive set of program characteristics than earlier studies exploring either parental satisfaction or parental evaluation of program features. Our study includes program features commonly used in QRIS and other informational interventions (e.g., measures of teacher–child interactions, teacher education, and opportunities for parental involvement) as well as measures not typically included in QRIS, such as aspects of convenience (e.g., hours, sick care) and measures of children’s learning gains on direct assessments, with particular attention to features that may be salient for low-income families.
A second contribution of the current work is that we leverage a much more recent sample of providers serving primarily low-income families and that our sample includes the full range of available publicly funded preschool programs, including Head Start, state-funded prekindergarten, and subsidized child care settings. By providing a broader, more current exploration of parental satisfaction with and evaluation of ECE programs in a sample that is often the target of informational interventions, the study aims to inform the design of policies intended to help families make informed ECE decisions.
Method
Data and Sample
Data were collected during the 2014–2015 school year as part of a larger study examining efforts to improve quality in Louisiana’s ECE system. Five Louisiana parishes were included in the study and were selected from 13 parishes that were part of a “pilot year” for a new QRIS in Louisiana. The five parishes were chosen to maximize regional diversity and include both urban and rural communities. Within parishes, all ECE programs were eligible if they (a) were participating in the state pilot (which included all Head Start and prekindergarten programs and a portion of child care programs that accepted subsidies) and (b) included classrooms that primarily served typically developing 4-year-old children. We selected 90 programs across the five parishes, with probability of selection in each parish proportional to the total number of programs in that parish relative to the total number of programs across all five parishes. Within parishes, we randomly selected a stratified sample of Head Start programs, prekindergarten programs, child care centers, and Nonpublic Schools Early Childhood Development programs (NSECD), which are nonpublic ECE settings that accept state funding for low-income children. 1 Within each program, all teachers of classrooms serving primarily typically developing 4-year-olds were randomly ordered, and the first teacher from each program was contacted. Once a teacher agreed to participate, all parents and children from that classroom were recruited to respond to surveys and for direct child assessments. Response rates were moderate to high. The director survey response rate was 94%, the teacher survey response rate was 98.8%, and parent survey response rates were 78% in the fall and 54% in the spring.
The sample for this study was drawn from the 906 parents who responded to the spring survey, which measured parents’ assessments of the quality of their program. 2 In order to explore patterns within a fixed sample of parents, we restricted our analysis to parents whose children were in classrooms with valid information on all quality measures. From these parents, two samples were constructed. The first was an “overall satisfaction sample” (n = 636) that included parents who responded to both items assessing their overall satisfaction with their child’s program (see below) as well as all child- and family-level covariates. The second sample included all parents who evaluated all individual program features and also indicated which two program features they liked most (n = 566). 3
Families in the study were predominantly low income, 57% reported annual income less than $25,000, and most parents (85%) did not have a bachelor’s degree (see Table 1). About two thirds of the children in the sample were Black.
Descriptive Statistics, Program Features, and Child and Family Demographics, N = 636

Note. N represents sample based on parent response to the overall satisfaction items and covariates items (sample used in Table 3). CLASS = Classroom Assessment Scoring System; NSECD = Nonpublic Schools Early Childhood Development. CLASS is a widely used, validated classroom observation tool that assesses the quality of teacher–child interactions on a 1-to-7 scale. Because the average classroom learning gains scores are calculated using the standardized residuals from a regression, the mean for this variable is zero by design.
Measures
Parents’ Satisfaction
Information on parents’ satisfaction with their ECE program was drawn from the spring parent survey. Parents responded to two items about their overall satisfaction with the program: “Overall, how satisfied are you with the child care/preschool program you selected for your child?” and “How likely would you be to choose this child care/preschool program if you had to do it again?” These items were scored on a 4-point Likert scale ranging from not satisfied/not likely to very satisfied/very likely. Consistent with previous research exploring parents’ satisfaction with ECE settings, we found high levels of satisfaction (see online Appendix A, Table A1). These two items were dichotomized, such that a 1 indicates that parents were “very satisfied” and “very likely” to choose the program again; 0, otherwise.
Parents’ Evaluations of Program Features
In the spring, parents were asked to evaluate seven specific features of the care setting: opportunities to learn academic skills, opportunities to learn social skills, warm/affectionate caregivers, a clean and safe environment, convenient hours, convenient location, and affordability. Parents were asked how much they agree that their current program provides each feature of care, scored on a 4-point Likert scale ranging from strongly disagree to strongly agree. Sample items included “My child’s main caregiver/teacher is warm and affectionate” and “This child care/preschool program is affordable for my family” (see online Appendix A for a full list of items).
Like the satisfaction items, there was limited variability in parents’ responses to the evaluation items. Just 3% to 5% of parents chose either of the two bottom categories (see online Table A1), consistent with previous literature documenting that parents tend to evaluate their care settings highly. Because over 90% of parents selected either of the top two responses (agree or strongly agree), the variation was primarily between parents who indicate they “agree” and those who “strongly agree.” As such, these items were coded dichotomously such that a 1 indicates strong agreement, and 0 indicates all other responses. 4
Finally, parents were asked to consider six program characteristics similar to the ones discussed above (e.g., learning, teacher–child interactions, convenient location and hours) and identify the two they “liked most” about their child’s program. These questions were recoded into a series of six nonmutually exclusive dummy variables in which 1 indicates the feature was one of the two that parents liked the most and 0 otherwise (see online Appendix A). Responses to these items capture a combination of parental satisfaction and evaluation because identifying the “best” features comes after some evaluative process. Based on earlier studies, we anticipated there might be little variation in parents’ reports of both overall satisfaction and their evaluations of specific program characteristics. As discussed above, parents may feel some internal or external pressure to indicate their young child is in a “good” ECE program. We included these “favorite” items on the survey to give parents an opportunity to endorse certain program characteristic without criticizing others.
Observed Program Characteristics
We considered a broad set of program characteristics, including measures of (a) observational assessments of process quality, (b) structural features of the program, (c) practical and convenience factors, and (d) a measure of average classroom learning gains (see Table 1).
Observational assessments of process quality
Process quality was assessed using CLASS (Pianta et al., 2008), a well-validated, widely used classroom observation tool that measures the quality of teacher–child interactions. For example, 18 states use CLASS as part of their QRIS, and Head Start uses CLASS as part of its professional development and quality monitoring.
On average, classrooms were observed four times for 40 min per visit over the course of the school year by trained CLASS observers, in accordance with best practice. Previous research demonstrates that teacher–child interactions can be organized into three broad domains: instructional support, emotional support, and classroom organization (Hamre et al., 2013). Instructional support includes concept development, quality of feedback, and language modeling; emotional support includes positive climate, negative climate, teacher sensitivity, and regard for student perspectives; and classroom organization includes behavior management, productivity, and instructional learning formats. These dimensions were each scored on a 7-point scale and averaged to create domain scores. This study considered both the overall CLASS score and the three domains.
CLASS codes demonstrated a high level of reliability. Fifteen percent of observations were double-coded by two data collectors, and intraclass correlations (ICC) indicated high levels of agreement between coders (emotional support, ICC = .812; classroom organization, ICC = .878; instructional support, ICC = .883; total score, ICC = .902). Moreover, internal consistency was strong, with Cronbach’s alphas ranging from .77 to .96.
Structural features
Measures of structural quality typically used in QRIS included teacher reports of their years of experience teaching children younger than kindergarten age, teacher-reported highest level of education (less than a BA, more than a BA, with BA omitted), and class size (teacher report of classroom enrollment on the first day of school). We also include an indicator for whether the program has regular opportunities for parental involvement (defined as more than four opportunities) because 90% of QRIS rating systems include measures of family involvement.
Practical and convenience features
Convenience features were drawn from the director survey and included a continuous measure of the average length of the school day across all weekdays; indicators for whether the program provides summer care, transportation, or sick care; a continuous measure of the number of services that the program provides for children (i.e., health screenings, developmental assessments, therapeutic services, counseling services, and social services); and an indicator of whether some families need to pay to attend the program.
Average classroom learning gains
Parents may be more satisfied with an ECE setting when they observe their children making noticeable developmental gains. Although we do not have assessment data for all children in our sample, 12 children from each study classroom were selected at random for direct assessments on a series of widely used measures of math, literacy, and executive function by a trained researcher. Assessments occurred in the fall and spring of the preschool year. As a proxy for children’s learning in the ECE setting, we generated average classroom gains by averaging the child-level residuals from individual regressions of each of the six spring assessments (described below) on each corresponding fall assessment.
Children’s math skills were assessed using the Applied Problems subscale of the Woodcock-Johnson (Woodcock, McGrew, Mather, & Schrank, 2001); literacy was assessed using the Peabody Picture Vocabulary Test (Dunn & Dunn, 1997), the Test of Preschool Early Literacy (Lonigan, Wagner, Torgesen, & Rashotte, 2007) Phonological Awareness test, and the Woodcock-Johnson Picture Vocabulary test. Executive function was assessed using the Head Toes Knees Shoulders task (HTKS; Cameron Pointz, McClelland, Matthews, & Morrison, 2009) and the pencil tap test (Blair, 2002; Diamond & Taylor, 1996). The HTKS asked children to inhibit a dominant response (touching their head or toes when asked by an adult) for a nondominant response (touching the opposite of what had been previously instructed) and is thus linked to inhibitory control, working memory, and cognitive-flexibility executive-function domains (McClelland et al., 2014). The pencil tap task asked children to respond to various pencil tap sequences, varying the sequence to require children to use both working memory and cognitive-flexibility skills.
Covariates
We estimated models both with and without demographic covariates. Covariates were included to account for child and family characteristics that may be correlated with program characteristics, parent satisfaction, and parent evaluations of specific program features. These included child age, gender, and race as well as parent education (coded as a four-level categorical variable: less than a high school education, high school education, some college, with bachelor’s degree or more as the omitted category), and a seven-category measure of family income.
Analytic Strategy and Hypotheses
We ran linear probability models in which we regressed the two measures of overall satisfaction, the seven specific parental evaluation items, and the six “most liked” items on each observable program characteristic individually. These models allowed us to explore which program characteristics are most highly associated with parental satisfaction and also whether parents’ evaluations of specific program characteristics correlated with external measures of those same features. We hypothesized that parents’ satisfaction with their program would be particularly correlated with practical program characteristics, such as location, hours, and cost. We also hypothesized that parent evaluations of a specific aspect of program quality would be more highly correlated with closely corresponding measures of quality. For example, we expected parental evaluations of convenience to be associated with hours of operation, provision of sick care and summer care, and transportation. We expected evaluations of affordability to be linked to whether some families have to pay for the program as well as the number of enrolled children in the classroom, as that is a likely driver of program price. We hypothesized that parents’ evaluations of warmth would be correlated with CLASS and teacher education and experience. Finally, we posited that parental evaluations of learning or academic skill provision at the program would be correlated most strongly with CLASS instructional support, teacher education and experience, and average student learning gains.
We also ran models in which we regressed each evaluation measure on the full set of program features to explore how much variation is explained by this extensive set of quality measures. If a significant proportion of the variance in any of our satisfaction or evaluation measures was predicted by the observed program features, this would provide evidence that parents use program features to evaluate their child’s ECE program. All models were run with and without controls for child and family characteristics, and all standard errors were clustered by program. Continuous independent variables (CLASS domains, teacher experience, number of children in the classroom, hours of operation, number of services provided, and learning gains) were standardized, dichotomous variables in 0/1 form. Results were not sensitive to the use of linear probability models as compared to logit models.
Results
Descriptive Statistics
Table 1 provides descriptive information for the programs in the sample. Programs had, on average, moderate CLASS scores, with low levels of instructional support, consistent with national CLASS data (Burchinal et al., 2010). The modal teacher had a bachelor’s degree, and average teaching experience was 11.27 years (though 45% of teachers had 5 or less years of experience). On average programs operated for 8 hr a day, and all children were in programs that offered services for at least 7 hr a day. Most of the sample attended a program that was free for all attendees (83%).
Parental Satisfaction
Table 2 provides descriptive information on parental satisfaction across three sets of measures. Overall levels of parent satisfaction were high, consistent with previous literature. Nearly 70% of parents were “very satisfied” with their program and reported being “very likely” to choose their program again. There was more variability in parents’ evaluations of specific program features, although ratings remained high. For example, roughly 75% of parents “strongly agreed” with individual statements that their program supports academic (79%) and social (75%) development; has a warm and affectionate caregiver (75%); offers a clean, safe environment (73%); and is affordable (74%). A smaller percentage strongly agreed that their program has a convenient location (69%) or that it offers convenient hours (63%).
Descriptive Statistics, Parental Ratings of Early Childhood Education Program

Note. N represents sample based on parent response to overall satisfaction items and covariates.
There was more substantial variation in parental satisfaction when measured with the “most liked” items. For example, although 79% of the sample reported that “helping the child learn” was one of their two favorite program features, just 44% reported that teacher–child interaction was among their favorite features, 12% selected program environment, 23% selected convenience, and just 6% selected affordability.
Associations Between Program Features and Overall Satisfaction
Table 3 presents both unadjusted (Model 1) and covariate-adjusted (Model 2) relationships between parents’ overall satisfaction with their child’s program and individual measures of program quality. These models show no consistent relationship between any program feature and parents’ overall satisfaction with their program and showed no substantive differences across models. Just two coefficients (of 64) were statistically significant at conventional levels, a finding that did not exceed what would be expected by chance. The adjusted R2 values from the saturated models—in which we regressed overall satisfaction on all quality measures simultaneously to assess the proportion of the total variance in satisfaction explained by our full set of quality measures—were quite low across all four models. Three percent of the variation in parental satisfaction was explained by our program features, and this rose to just 5% with the addition of demographic covariates (see bottom panel, Table 3).
Associations Between Program Features and Overall Satisfaction

Note. N = 636. Rows represent the individual association between one program feature and parent satisfaction from a separate regression. Dichotomous independent variables are coded as 0/1; continuous independent variables are standardized. Clustered standard errors are presented in parentheses. Model 1 includes program features only; Model 2 also includes family income, parent education, and child age, race, and gender. The R2 term reflects the proportion of variance accounted for if all program features are included in a single regression. CLASS = Classroom Assessment Scoring System.
p < .10. *p < .05. **p < .01.
Associations Between Program Features and Parent Evaluations
Table 4 presents the unadjusted relationship between individual measures of program quality and parent ratings of specific program features as well as adjusted R2 values from models that include all program features simultaneously. Covariate-adjusted models are presented in online Appendix B, Table B1 and are not substantively different from the unadjusted models.
Associations Between Program Features and Parent Evaluations of Specific Program Features
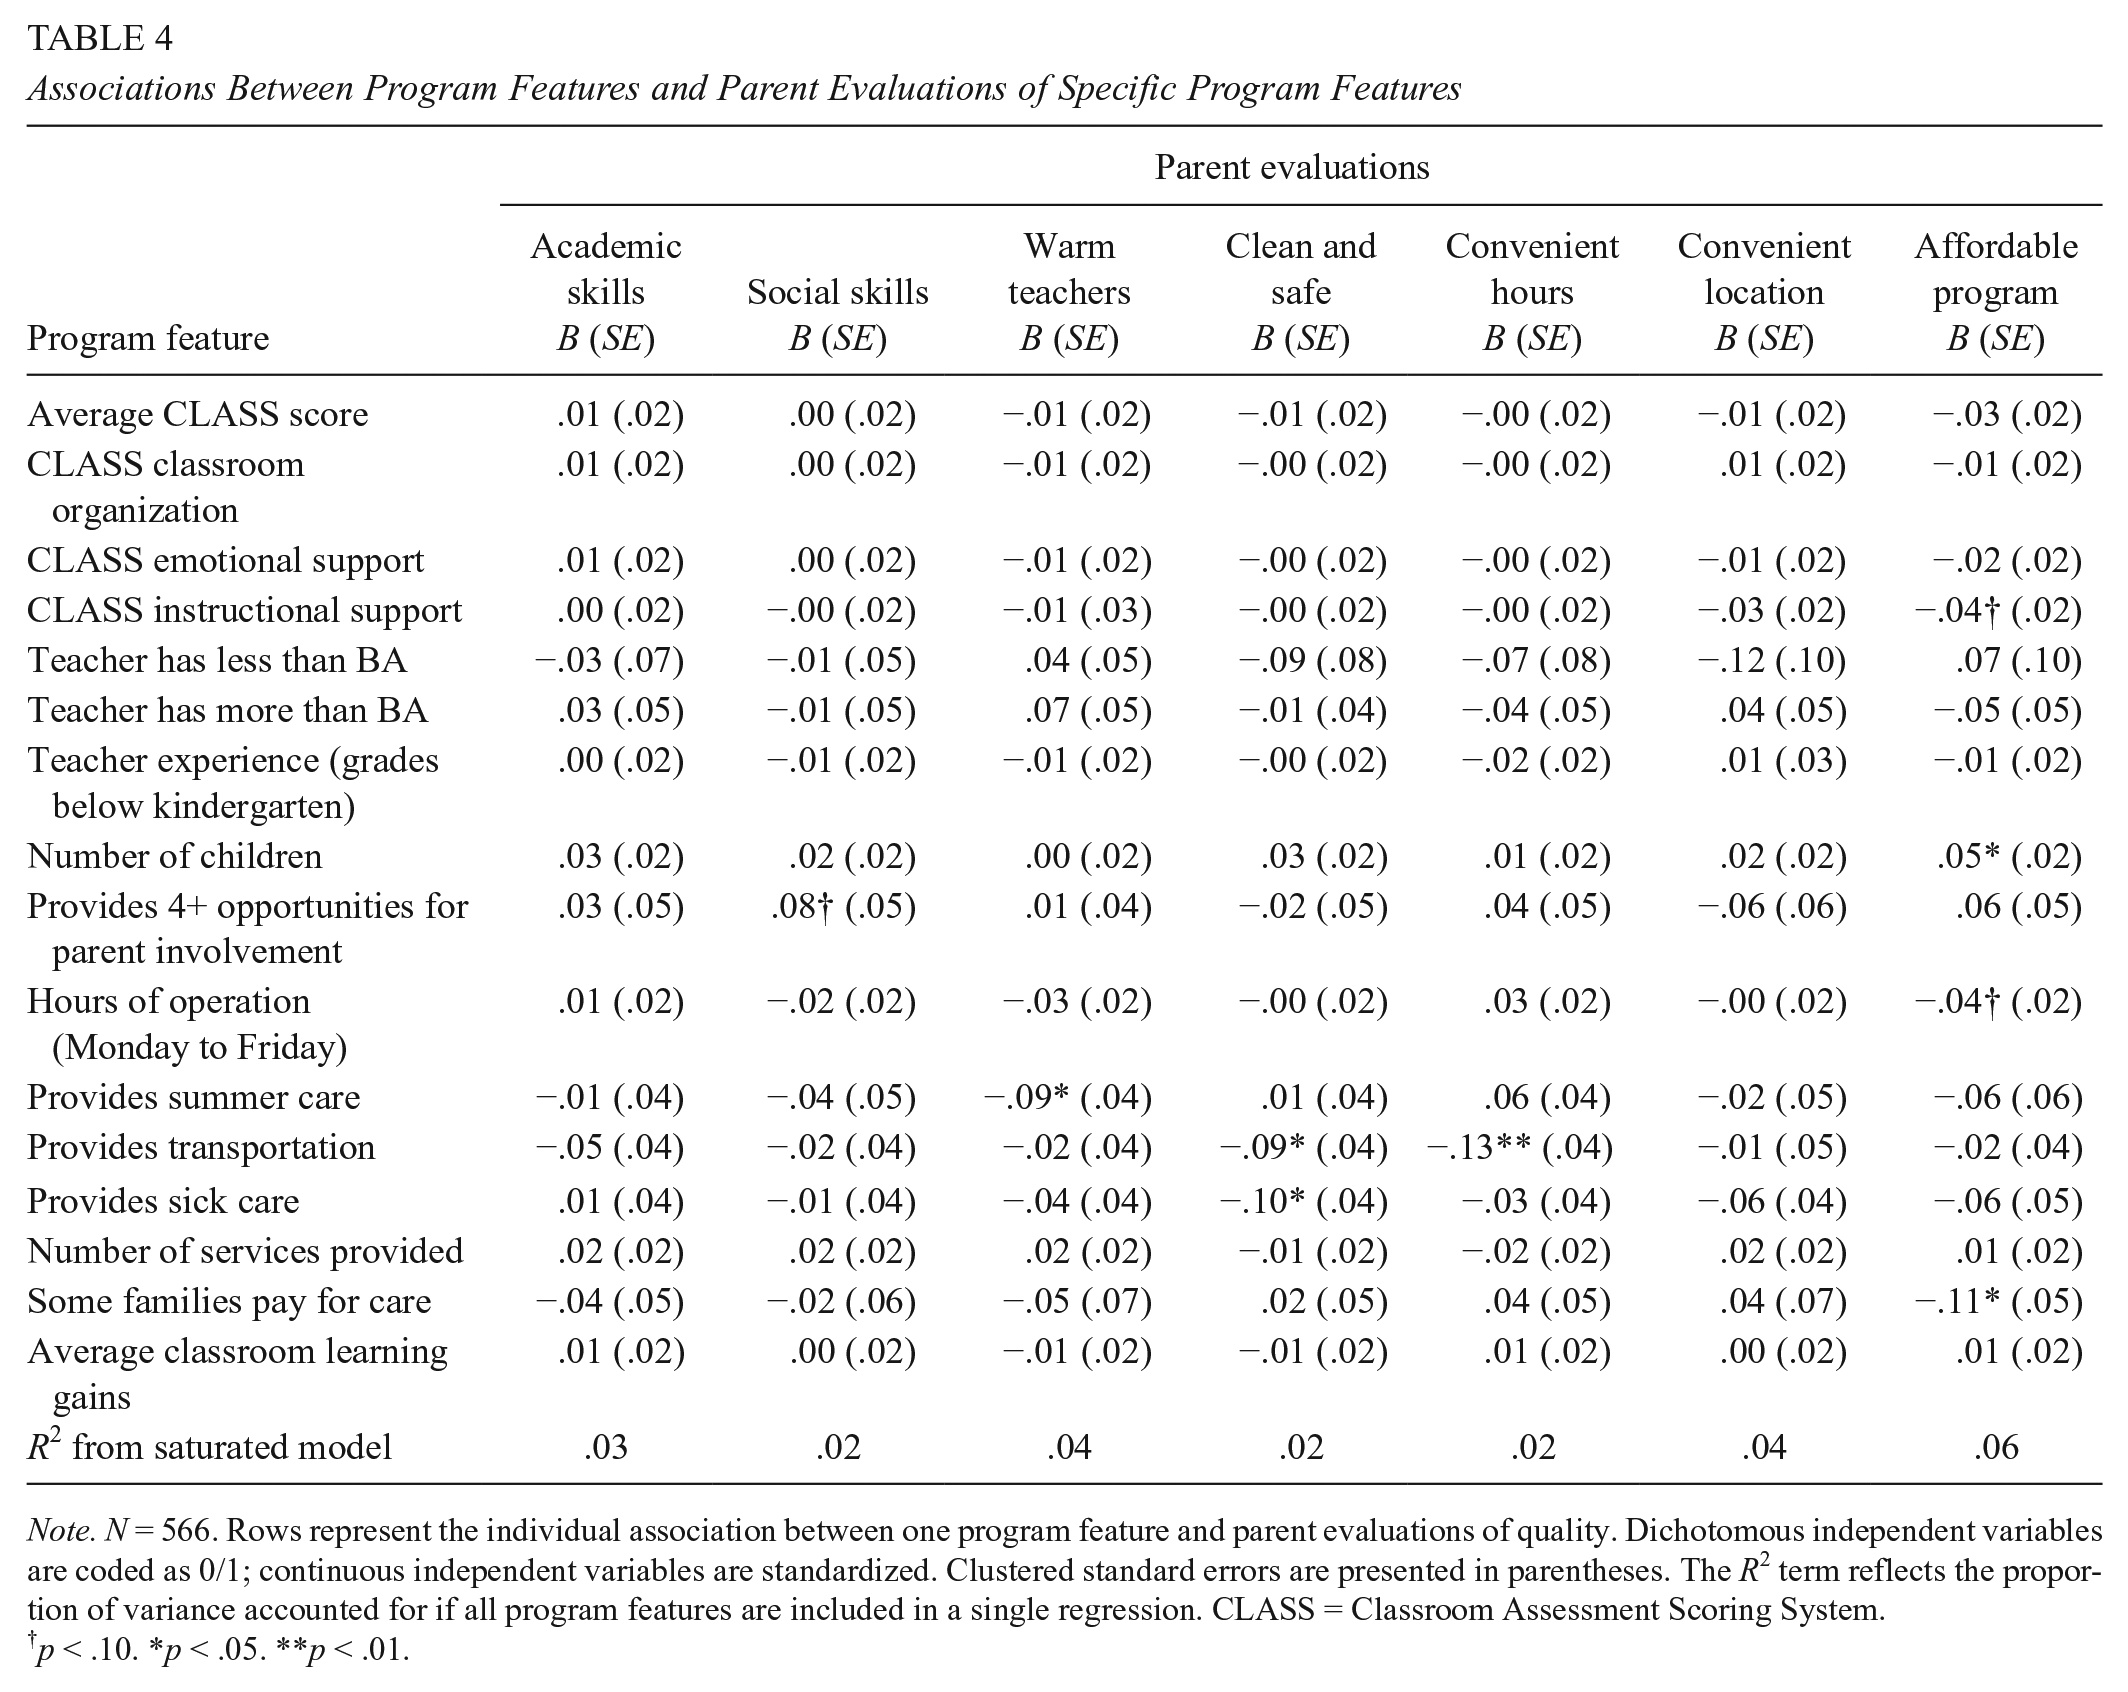
Note. N = 566. Rows represent the individual association between one program feature and parent evaluations of quality. Dichotomous independent variables are coded as 0/1; continuous independent variables are standardized. Clustered standard errors are presented in parentheses. The R2 term reflects the proportion of variance accounted for if all program features are included in a single regression. CLASS = Classroom Assessment Scoring System.
p < .10. *p < .05. **p < .01.
Table 4 reveals limited associations between observed program features and parental ratings of specific program features. Only six of 112 (~5%) associations between program characteristics and parent ratings of specific aspects of quality were statistically significant, and in most cases, patterns did not align with hypothesized relationships. None of the program characteristics were associated with parents’ satisfaction with their child’s learning. Only an indicator for whether the program provided summer care was significantly (although negatively) related to parents’ assessments of teacher warmth. Programs that provided transportation were rated as somewhat less clean and safe and convenient. Parental ratings of affordability were positively associated with the number of children in the classroom and negatively associated with attending a program that was not free. In models that simultaneously accounted for all quality measures, program features explained very little of the variation—just 2% to 6%—in any of the evaluation measures (see bottom row for R2).
Although we explored relationships between all observed program features and all parental ratings, we did not expect associations among all variables. Instead, we expected that parent evaluations of specific aspects of ECE quality would be more tightly linked with measures of quality that were more closely aligned. Figure 1 presents a visual representation of the relationships we hypothesized would be stronger based on previous research and theory overlaid with the findings from the present study. As indicated by the highlighted cells, just two of the hypothesized relationships were observed in the present data, both of which linked classroom features to affordability. Specifically, number of children in the classroom was positively correlated with affordability, and the dichotomous indicator that some families at the program had to pay for care was negatively correlated with affordability.

Hypothesized and observed relationships between program features and parental evaluations of program features. Parental evaluations are represented by the columns; observed features are listed in the rows. The shaded boxes represent the relationships we hypothesized might be observed in the data; the +/− signs indicate observed relationships and their direction (positive or negative). The highlighted cells represent statistically significant relationships that correspond to our hypotheses.
Finally, Table 5 shows results from unadjusted regression models in which we predict whether a parent indicated a particular program feature was one of the two features they liked most. Online Appendix Table B2 presents these models with the addition of covariates; findings do not substantively differ. There were 11 statistically significant coefficients across 96 estimates, somewhat more than expected by chance. However, as above, these observed measures of quality predicted very little of the variation—just 3% to 5%—of any “most liked” item.
Associations Between Individual Program Features and Parents’ Choice of Most-Liked Program Features

Note. N = 566. Rows represent the individual association between one program feature and parents’ selection of most-liked program features. Dichotomous independent variables are coded as 0/1; continuous independent variables are standardized. Clustered standard errors are presented in parentheses. The R2 term reflects the proportion of variance accounted for if all program features are included in a single regression. CLASS = Classroom Assessment Scoring System.
p < .10. *p < .05. **p < .01.
Figure 2 summarizes the expected and observed associations between quality measures and child outcomes. As indicated by the highlighted cells, three of the hypothesized relationships were observed in the data. Parents were more likely to list learning as one of their two favorite features in classrooms where teachers held more formal education. They were also more likely to list convenience as one of their two favorite features in programs that provided longer hours. Finally, they were less likely to choose the learning environment as a favorite in classrooms with greater numbers of children.

Hypothesized and observed relationships between program features and parents’ two most-liked program features. Parental evaluations are represented by the columns; program features are listed in the rows. The shaded boxes represents the relationships we hypothesized might be observed in the data; the +/− signs indicate observed relationships and their direction (positive or negative). The highlighted cells represent statistically significant relationships that correspond to our hypotheses.
Many hypothesized relationships were not supported by the data, and some relationships that were not hypothesized emerged. Some of the nonhypothesized associations seem plausible, specifically those related to affordability. For example, although not hypothesized, the provision of summer care and length of day might be positively associated with affordability because these features prevent parents from having to purchase additional care. Similarly, CLASS scores and teacher education might be negatively associated with affordability because these are features of higher-quality, and therefore potentially more expensive, programs. Thus, although limited, there were modest correlations between program features and parents’ most-liked program features. Notably, however, these correlations clustered around easy-to-observe features (e.g., affordability, convenience) rather than more-difficult-to-observe features (e.g., quality of learning or interactions).
Discussion
This study uses unique data, including multiple parental assessments of their child’s ECE program and extensive information about program features to provide new insights about parental satisfaction in ECE as well as parents’ abilities to evaluate specific features of their child’s ECE program in a low-income sample. We find that none of our extensive set of program characteristics related to parents’ overall satisfaction with their child’s ECE setting. This pattern is somewhat surprising and counter to our hypotheses that factors like cost and convenience would relate to broad satisfaction measures. Further, in models in which we include all 15 of our observed program characteristics, we predicted less than 5% of the variance in overall parental satisfaction. It is not clear whether the low explanatory power of our models is due to our omitting key factors that are essential to parents or if instead we identified the relevant factors but did not measure them with enough precision, a point we return to below.
We also find little evidence that parents’ evaluations of specific program characteristics correlated with external measures related to those same constructs. Given that the parental evaluation items were drawn from a survey administered in the spring of the child’s preschool year, and that they therefore reflect parents’ summative assessment after observing their child’s experience in the classroom for a full school year, we expected stronger alignment. That said, these results echo earlier research (Cryer et al., 2002; Mocan, 2007) that demonstrated weak correspondence between observed quality and parental assessments but did not include the program features that are commonly hypothesized to be most salient for low-income parents (e.g., cost and convenience).
Notably, a slightly stronger pattern of significance did emerge in models predicting parents’ selection of a program feature as “most liked.” These items are unique to this study and were designed to provide parents with the opportunity to express a preference for one feature over another without having to denigrate their child’s program. In models that predicted these outcomes, there is some limited indication that parents are able to accurately evaluate relatively easy-to-measure program features, such as hours of operation, number of children, and teacher education (Figure 2). Still, taken together, the current findings suggest little correspondence between low-income parents’ evaluations of program characteristics and external measures of those same characteristics.
The study makes a number of contributions. First, it is the only analysis we are aware of that examines the correlates of parental satisfaction with their child’s ECE programs. Second, we consider a much broader range of program characteristics than have other studies of parents’ ability to evaluate ECE. We include items commonly included in QRIS (e.g., teacher education, number of children in the classroom, opportunities for parent involvement), observations of teacher–child interactions (CLASS), and measures of student learning gains based on direct assessments. Importantly, we also include measures of cost and convenience, which are particularly salient for low-income families making ECE choices but have been absent from previous research of their satisfaction or evaluation (Forry et al., 2013, 2014). Finally, the study relies on data from a sample of low-income families in a diverse set of publicly funded ECE programs, an important contribution given that earlier studies rely on data that are decades old or underrepresent low-income families.
The results suggest a potentially promising role for informational interventions, which have proven effective in some K–12 settings (Friesen et al., 2012; Hanushek et al., 2007; Hastings & Weinstein, 2008). In fact, the complexity of the ECE choice along with parents’ difficulty evaluating ECE quality suggests that there may be a particularly large role for informational interventions. Indeed, previous research suggests parents would be willing to use QRIS information specifically in their care choices (Elicker, Langill, Ruprecht, Lewsader, & Anderson, 2011; Starr et al., 2012; Tout, Isner, & Zaslow, 2011). Chase and Valorose (2010) report that 88% of their sample of Minnesota parents would find a QRIS “very helpful” (53%) or “somewhat helpful” (35%), a proportion that was higher among low-income parents (61% say “very helpful” as compared with 45%).
Informational interventions may be helpful to parents because they make comparison shopping easier, especially for low-income parents, who may have little time to research or visit ECE alternatives. Indeed, previous research suggests that parents engage in little to no searching for ECE (Bassok et al., 2017). Anderson, Ramsburg, and Scott (2005) report that 75% of their sample of subsidy-receiving parents considered just one program. Layzer and colleagues (2007) report that 41% of parents make their ECE decision in 1 day. Thus, providing parents with easy-to-understand information about local ECE options may give parents the ability to more easily compare different programs, including those they may not have heard of from their friends or family, and make different ECE decisions.
At the same time, informational interventions will only be useful to the extent that there are programs of varying quality that are accessible to parents. That is, informational interventions will help parents make better ECE choices to the extent that parents have a choice to make—a condition that may not always be the case for low-income families. If parents’ choices are driven primarily by the limited supply in their community, then providing information is not likely to shape parents’ decision making.
Limitations
Our study offers evidence that parents’ satisfaction is uncorrelated with a large set of program characteristics, and it also shows that parents struggle to evaluate ECE program characteristics. However, several data limitations are notable. First, our data stem from a broader study focused on the ECE experiences of 4-year-old children in Louisiana, most of whom are enrolled in publicly funded Head Start or public prekindergarten settings, and our sample includes relatively few children in subsidized child care centers. Although using a recent, low-income sample of parents of 4-year-olds is a strength, the small number of parents paying for ECE—just 17% of parents in the sample attended a program where some parents pay—limits the generalizability of the study. Head Start and public prekindergarten are not only free but also more highly regulated, which may have limited the variation in program features in the present sample. A sample that includes more subsidy recipients may provide more variability and thus yield stronger associations between program features and parent evaluations. This sample limitation should be addressed in future research.
Second, our analysis relies on parental self-report. There are various reasons why parents’ true assessments of program quality may differ from what they choose to report in a survey. For instance, it may be that parents are aware that their child’s ECE program is not ideal but nonetheless rate the program highly to relieve their own anxiety or to give what they perceive as the socially desirable response (Lamb & Ahnert, 2006). In ongoing work, we are examining whether parents’ actions (e.g., rankings of programs during a program enrollment period) are related to program characteristics in ways that differ from those seen when using parental reports of satisfaction.
Third, it may be that there are characteristics of parents that are correlated with both the characteristics of the ECE program and parents’ assessments. Online Appendices A1 and A2 show that findings were not sensitive to accounting for family characteristics. However, these analyses do not address the possibility of unmeasured confounds.
Fourth, it is possible that the null results in this article are influenced by measurement error. Although our study includes a diverse set of program features, our measures may not sufficiently measure the underlying program characteristics of interest (e.g., hours of operation or program provision of transportation may not fully capture convenience; our measures of teacher–child interactions may not fully capture the quality of these interactions). Future research should explore additional measures that may more directly relate to parents’ experiences in programs, for example, match between family work schedules and hours of operation or distance between home and program. A related measurement concern is that our measures of program characteristics are not directly aligned with our parental evaluation measures. Unlike previous work using the ECERS, which compared parent ECERS ratings with those of experts, we ask parents to evaluate features that are related to, but not directly aligned with, our observed program features.
Finally, as described in the Measures section, there is not a high level of variability in parent responses to the satisfaction and evaluation items (see online Table A1). Because of this, all variables were coded as “very satisfied”/“strongly agree” versus all other responses. The limited variability in the dependent variable substantially reduces our ability to detect associations between our program features and parent ratings and is a limitation of the present study. That is, a measure that captured greater nuances in parents’ satisfaction may have elicited associations between program features and satisfaction. On the other hand, it is also possible that our measure accurately captures low level of variability, that is, that parents do not evaluate their programs differently despite different program characteristics. Future research should continue to devise new measures that could adjudicate between these possibilities.
Conclusions and Policy Implications
Nearly every state has now turned to informational campaigns as a strategy to increase the quality of ECE programs. Between 2004 and 2014, the number of QRIS in the United States quadrupled, the Race to the Top–Early Learning Challenge grants required that states prioritize providing parents with up-to-date, easy-to-understand quality rating information, and the 2014 reauthorization of the Child Care and Development Block Grant required states to improve access to information about child care quality for parents.
The present study provides support for the hypothesis that low-income parents struggle to accurately evaluate ECE programs, suggesting that informational interventions may be an effective way to shape parental decision making and improve overall ECE quality. However, our key finding—that low-income families struggle to evaluate characteristics of their child’s ECE program setting, even after their child has been in that setting for months—does not necessarily imply that informational interventions, which aim to help parents with this process, will be effective.
First, even if informational interventions address parents’ difficulty in assessing key features of ECE programs by providing easy-to-access and accurate information, they will lead families to make different and better choices only if such choices are available. If families’ decisions are constrained by limited options that meet their needs, policies that address these supply issues would be more promising than policies around information. Second, there are many unanswered questions about exactly which type of information informational interventions, such as QRIS, should provide to parents. For instance, although a goal of these initiatives is to nudge parents into selecting “higher-quality” ECE options, measuring quality at scale is challenging. Existing research shows that many of the quality measures currently included in QRIS are poor predictors of children’s learning, and a growing body of QRIS validation studies has generally found no or inconsistent associations between QRIS ratings and children’s outcomes (Cannon, Zellman, Karoly, & Schwartz, 2017). In addition to refining the quality measures included in informational interventions, it may be important to create systems that also provide easy-to-access information about the program features that may constrain parents’ choices. For instance, Louisiana, where the current study was conducted, is currently rolling out an information portal for parents that highlights both practical program characteristics (e.g., location, eligibility, cost) and measures of classroom quality.
Third, participation in QRIS and other informational campaigns remains voluntary for ECE programs, and many QRIS systems have low rates of participation. Thus, even if parents have a set of local program options, quality ratings may not be available for local programs and thus may not influence parent decision making. Finally, to date, many QRIS and other informational interventions have focused more on measuring and improving program quality than on outreach to families. For instance, data from Indiana and Kentucky suggest that parents are unaware of existing QRIS (Elicker et al., 2011; Starr et al., 2012) and use QRIS at low levels, suggesting that effective informational interventions must also focus on parent outreach and provide specific, easily understandable, and relevant information.
Informational interventions have been central components in several prominent federal ECE improvement efforts. As policymakers pursue QRIS and other informational policies as a strategy for improving quality in ECE, it is important that more research address these issues and that informational systems be iteratively refined to reflect new knowledge. Future research should continue to probe the relationship between parents’ preferences, choices, and evaluations using diverse measures of quality and methods of identifying parent evaluations. In particular, experimental research exploring the impact of providing parents with different types of information is a crucial direction for future research, as is continued exploration of the role of ECE supply in shaping parents’ decisions.
Supplemental Material
ERO759954_Appendices – Supplemental material for Are Parents’ Ratings and Satisfaction With Preschools Related to Program Features?
Supplemental material, ERO759954_Appendices for Are Parents’ Ratings and Satisfaction With Preschools Related to Program Features? by Daphna Bassok, Anna J. Markowitz, Daniel Player and Michelle Zagardo in AERA Open
Footnotes
Acknowledgements
This research was supported by a grant from the Institute of Education Sciences (R305A140069). Opinions reflect those of the authors and do not necessarily reflect those of the granting agency. We thank the Louisiana Department of Education for their willingness to share data for this project, and the children, teachers, and families who generously agreed to participate in this study.
Notes
Authors
DAPHNA BASSOK is an associate professor of education and public policy at the University of Virginia. She studies large-scale efforts to improve early childhood education.
ANNA J. MARKOWITZ is a postdoctoral research associate at the University of Virginia. Her research focused on understanding how policies and programs exacerbate or ameliorate income-based disparities in child development.
DANIEL PLAYER is an assistant professor of public policy at the Frank Batten School of Leadership and Public Policy. He studies education policy.
MICHELLE ZAGARDO is a doctoral student at the University of Virginia. She is interested in the economics of early childhood education policy.
References
Supplementary Material
Please find the following supplemental material available below.
For Open Access articles published under a Creative Commons License, all supplemental material carries the same license as the article it is associated with.
For non-Open Access articles published, all supplemental material carries a non-exclusive license, and permission requests for re-use of supplemental material or any part of supplemental material shall be sent directly to the copyright owner as specified in the copyright notice associated with the article.