
Abstract
Classroom quality measures, such as the Early Childhood Environment Rating Scale, Revised (ECERS-R), are widely used in research, practice, and policy. Increasingly, these uses have been for purposes not originally intended, such as contributing to consequential policy decisions. The current study adds to the recent evidence of problems with the ECERS-R standard stop-scoring by analyzing eight studies offering 14 waves of data collection in approximately 4,000 classrooms. Our analysis, which featured the nominal response model, generalized partial credit model, partial credit model, within-category averages of total scores, and point-biserial correlations, revealed that all 36 items had categories that did not follow an ordinal progression with respect to quality. Additionally, our results showed that the category problems accumulated to the scale score. The results caution against the use of the standard raw scoring and encourage development of alternative scoring methods for the ECERS-R.
Major policy efforts aim to make preschool universally available and improve the quality of child care settings, with a goal of preparing all children for school (Child Trends, 2015; Pew Charitable Trusts, 2014; U.S. Department of Education, 2013). Importantly for our study, policies often dictate that observational measures are incorporated in an attempt to ensure high classroom quality. Often, raw scores (e.g., averaging across all items) from these measures are compared to cut scores, contributing to consequential decisions for child care subsidy levels, Head Start funding, and public recognition with medals (gold, silver, bronze) or stars (5-star, 4-star, etc.). One widely used measure to assess the quality of child care centers is the Early Childhood Environment Rating Scale, Revised (ECERS-R; Harms, Clifford, & Cryer, 1998). A compendium of state Quality Rating and Improvement Systems found that 40% of states used only the ECERS-R and another 40% used ECERS-R along with another quality measure (Child Trends, 2015). A recent survey of state pre-kindergarten policies similarly found that 19 states relied on ECERS-R for program monitoring (Ackerman, 2014). With such consequences for funding and reputation, these measures can have an outsized influence on teacher practice, similar to high-stakes student testing. Therefore, probing the psychometric properties of the measures is important.
Indeed, the validity of the ECERS-R scores for these uses has increasingly come into question because of the small associations between its scale scores and child developmental outcomes (e.g., Burchinal, Kainz, & Cai, 2011; Burchinal, Zaslow, & Tarullo, 2016; Layzer & Goodson, 2006). Among many of the reasons for these low associations, recent studies pointed to limitations with the ECERS-R standard stop-scoring (e.g., Gordon, Fujimoto, Kaestner, Korenman, & Abner, 2013). At first glance, the ECERS-R seems to have a simple Likert-like scoring, with category scores increasing from 1 (inadequate) to 7 (excellent). A thorough examination of the items and scoring process, however, reveals the potential for the score categories not to follow an ordinal progression because assigning higher scores depends on scoring decisions for lower scores (referred to as stop-scoring) and indicators that probe different aspects of quality are mixed together within some items (e.g., mixing of sanitation aspects of quality like handwashing with social aspects like conversations, as detailed in the following). Thus far, only a handful of studies have empirically tested the ordinal nature of the ECERS-R item categories, and a new version of the measure (i.e., the ECERS-3) has retained the same stop-scoring standard (Harms et al., 2015).
Given the concerns that have arisen about the ECERS-R scores, the purpose of this study was to perform a comprehensive analysis of the category functioning of the ECERS-R items. We focused on whether the categories were: (a) ordered (i.e., followed an ordinal progression), (b) redundant (i.e., two categories represented similar quality levels), (c) disordered (i.e., a subsequent category represented lower quality), and (d) underutilized (i.e., categories had a low probability of being used). Our analytic approaches featured three item response theory (IRT) models—the nominal response model (NRM; Bock, 1972), generalized partial credit model (GPCM; Muraki, 1992), and partial credit model (PCM; Masters, 1982). Although the PCM has been used more frequently in prior studies involving ECERS-R data, the NRM allows us to better diagnose the four types of problems the categories may have, and the GPCM allows us to examine how sensitive the results are to the PCM model assumptions that we detail in the following. Additionally, we calculated the within-category raw score averages and point-biserial correlations to examine how problems with the category functioning accumulated to the scale score level.
We used eight data sets with 14 waves of data collections. Our data analysis procedures consisted of parallel and stacked analyses, which followed recent calls for integrative and coordinated data analysis and robustness checking (Curran et al., 2008; Duncan, Engel, Claessens, & Dowsett, 2014; S. M. Hofer & Piccinin, 2009). The advantages of these procedures were twofold. The parallel analysis allowed us to determine whether the results replicated across the individual data sets (i.e., were robust across sample compositions and data collection; S. M. Hofer & Piccinin, 2009). Unfortunately, each data set was not amenable for the NRM because of sample size limitations. The stacked analysis integrated the separate data sets into one, leading to a sufficient number of cases for the NRM (Marcoulides & Grimm, 2017). By taking this multifaceted analytic approach, we gathered robust evidence on the category functioning of the ECERS-R items and provided detailed diagnostic information to guide future use and research involving the instrument.
The ECERS-R Scoring
Our examination of the ECERS-R scoring guidelines is why we expect problems with category usage. The instrument’s unique scoring rules reflect its origins in the 1970s as a checklist created in response to early education centers’ requests for guidance on self-improvement (Frank Porter Graham Child Development Institute, 2003). Reflecting these checklist origins, the ECERS-R includes over 400 indicators covering different aspects of quality (e.g., “sanitary conditions usually maintained,” “pleasant social atmosphere,” “books organized in a reading center”; Harms et al., 1998). To facilitate both observers and practitioners’ ability to mentally digest these hundreds of indicators, the instrument developers organized them into a few dozen items. Within each item, the indicators were further grouped to represent different scores ranging from 1 to 7, with the indicators listed at the odd-numbered categories (labeled 1 = inadequate, 3 = minimal, 5 = good, and 7 = excellent).
To further reduce burden on observers, the developers created a stop-scoring rule calling for observers to stop checking the indicators for an item once they reach a category that does not meet the scoring rules. Figure 1 visually represents these rules. For Category 1, all indicators are negatively oriented (e.g., “no interest centers defined”). If at least one of these indicators is endorsed, then the item receives a score of 1 and the observer moves on to the next item. If none of the Category 1 indicators are endorsed, the observer considers the indicators of Category 3. These indicators at Category 3 (and Categories 5 and 7) are positively oriented. If less than half of the indicators of Category 3 are present, then the score remains in Category 1, and the observer moves on to the next item. If at least half but not all of the indicators in Category 3 are present, the score is a 2, and the observer moves on to the next item. If all of the indicators in Category 3 are present, then the indicators of Category 5 are considered. Category 5 is then scored in a similar fashion as Category 3. A score of 7 is only given if all indicators under that category are met.
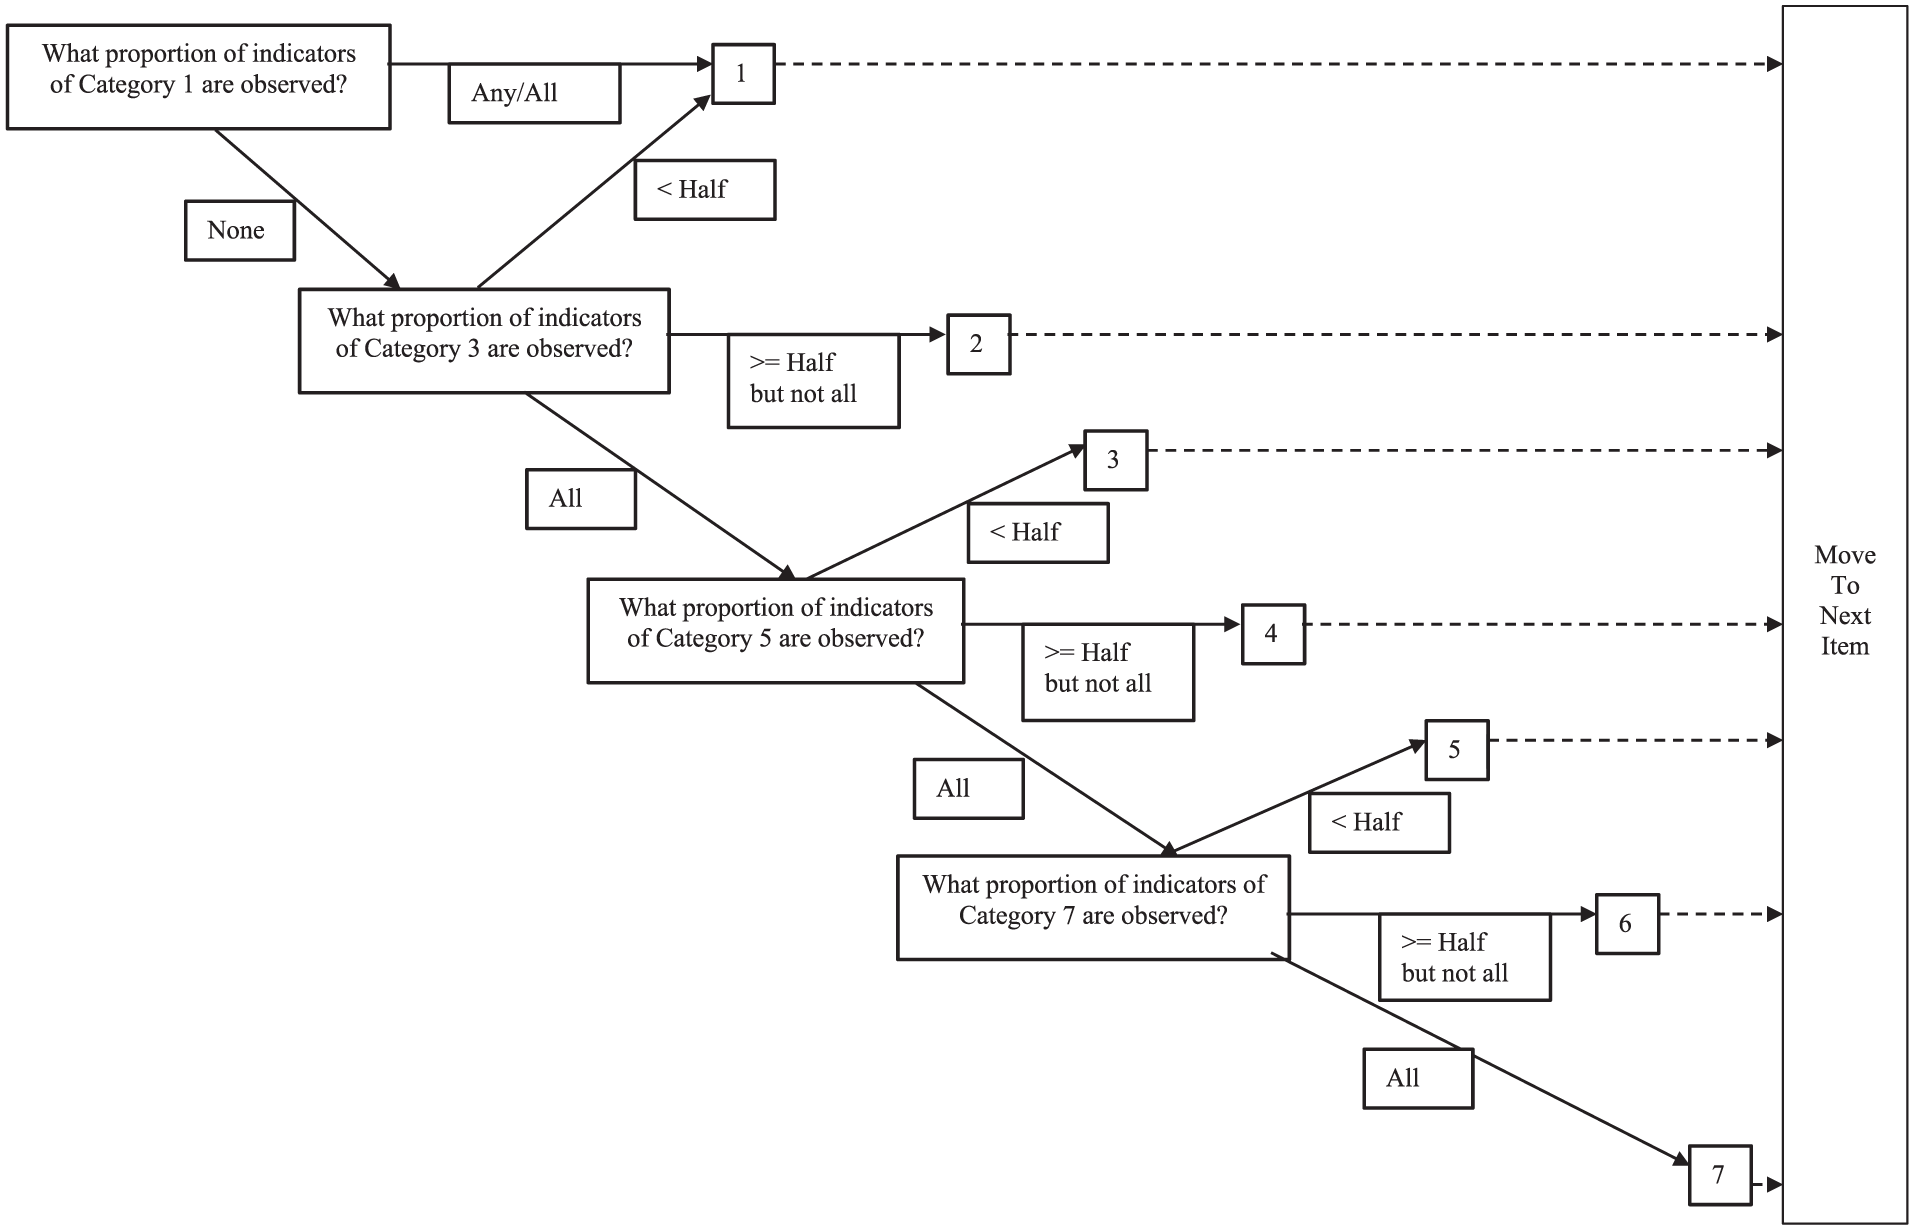
Visual representation of the Early Childhood Environment Rating Scale, Revised (ECERS-R) stop-scoring guidelines.
This stop-scoring process reduces the burden on the observers because only a subset of indicators needs to be considered for most items (especially when a classroom’s scores fall in the lower categories). If the scale developers’ placement of the indicators matched their actual locations on the quality continuum such that the indicators placed at higher categories truly reflected more quality than those listed at lower categories, then this scoring efficiency should not affect the categories’ ordinal representation of quality. However, to the extent that the indicators do not reflect an ordered progression of true quality, the stop-scoring might produce problems with category underutilization, redundancy, and disorder. We feature three such issues revealed by scrutinizing the indicator content: (a) complementary indicators, (b) basic versus advanced indicators, and (c) different-content indicators.
The first situation of complementary indicators is evident at Categories 1 and 3 for some items, where the two categories have nearly equivalent indicators that are phrased in opposite directions. The ninth ECERS-R item (greeting/departing) illustrates this issue. For example, “Greeting of children is often neglected” is an indicator under Category 1, and “Most children greeted warmly” is an indicator under Category 3. A classroom that meets the first condition (greeting is not neglected) would likely also meet the second condition (most children greeted warmly), potentially leading to Categories 2 and 3 being underutilized. Redundancy of these categories might also result due to slight variations between otherwise complementary indicators (e.g., words like warmly).
The second issue—presence of basic and advanced indicators at the same category level—may affect the chances of an observer perceiving evidence that meets the cutoff for odd scores (less than half of the indicators being observed) versus even scores (at least half but not all). Item 18 (informal use of language) offers an example. All of this item’s indicators deal with the quality and quantity of conversations, but within Categories 5 and 7, the indicators appear to tap into aspects that are: (a) basic (e.g., staff have individual conversations with most children) and (b) advanced (e.g., staff ask questions that encourage long and complex answers). The relative number of basic and advanced indicators at each of these categories will affect the chances of meeting the cutoff of “less than half” versus the cutoffs of “half but not all” or “all.” To the extent that meeting the less than half cutoff is particularly uncommon, odd scores (3, 5, and 7) will be underused. Notice that this issue is complicated because it depends not only on the focal category’s indicators but also those of the preceding and subsequent categories. Potentially, this issue could also produce redundancy or disorder to the extent that some basic indicators placed at higher categories overlap basic content placed at lower categories.
Although these issues of complementary and basic versus advanced indicators of the same content have not been featured in prior IRT studies of the ECERS-R, the final issue of mixing different aspects of quality has been discussed. Scholars and users of the ECERS-R have raised concerns that preschool classrooms can be scored in a lower category due to lax health and safety practices despite possessing other aspects of quality such as warmth and responsiveness of caregivers (Gordon et al., 2013, 2015; Layzer & Goodson, 2006). For instance, on the 10th item (Meals/snacks), stringent criteria for sanitary conditions (e.g., most children and adults wash their hands before eating) must be met before observers can consider the social aspects of mealtime (e.g., rich conversation and supportive relationships). The scale developers’ placement of indicators reflects a common belief held in the field that health and safety are more fundamental aspects of quality whereas the socio-emotional and academic nature of teacher-child interactions are more advanced aspects. However, if the placement differs from empirical ordering, it could lead otherwise higher quality classrooms to be scored in the lowest category. This mixing of different aspects of quality is particularly evident in the ECERS-R items that cover children’s personal care routines. Therefore, we expect category redundancy and disorder to be especially likely for these items.
Prior Studies on the ECERS-R Scoring
Just a few empirical studies have examined the ECERS-R for these potential problems with category functioning. Although their results are suggestive, these studies have not yet leveraged all of the item response theory tools. Most importantly, their focus on the PCM over the NRM is limiting because the PCM cannot separate category underutilization from category redundancy or disorder. This limitation is accentuated by the recent debate about the meaning of reversed thresholds under the PCM (Adams, Wu, & Wilson, 2012; Andrich, 2013), which can also be informed by the NRM’s detection of the specific type of problems evident in the categories.
More specifically, Gordon et al. (2013) applied the PCM to ECERS-R item-level data from over 1,300 classrooms participating in the nationally representative Early Childhood Longitudinal Study, Birth Cohort (ECLS-B) study, gathered using the stop-scoring rule. They found that every ECERS-R item had at least one pair of adjacent category thresholds that was out of order. Mayer and Beckh (2016) also used the PCM with a nationally representative German sample of 270 classrooms and replicated reversals of adjacent threshold estimates. These findings suggest some problems with category usage but not what the problems are. One culprit could be category underutilization, potentially occurring more often in categories that are odd-valued and correspond to lower scores, and in the personal care routines items, as we previously noted. The two published PCM studies only reported about the number of items with reversals in adjacent thresholds and did not detail which items and categories. Thus, an important contribution of our study is using the precision achieved by our stacked data file to pinpoint where such problems occur.
In the broader literature regarding the PCM, some researchers have also argued that reversals of adjacent thresholds from the PCM likely reflect unusual samples rather than problems with an instrument itself (Adams et al., 2012). That is, the fact that a category appears underused may simply reflect a sample that happened to exclude people (or classrooms) reflecting those scores. Although the two existing PCM-based studies of the ECERS-R relied on nationally representative samples—which should be less likely than convenience samples to have excluded classrooms representing certain scores on certain items—our replication of results across numerous data sets representing a range of care settings helps adjudicate whether the underutilization in the ECERS-R data is because of the instrument or the sample. Although thresholds are less precisely estimated in our parallel analysis than the stacked analysis, these data set–specific results could also offer insight into the root of the underutilization. Replicated problems in the same categories of the same items across the data sets would suggest that the instrument is the issue because the problems would not be specific to any one sample.
Other researchers have emphasized the possibility that reversals of the thresholds from the PCM model could arise because of disorder in the meaning of the categories (Andrich, 2013). In this case, interpretation of the overall scale score (either total or averaged) is muddled because a lower score could represent greater amounts of quality than a higher score. We leverage the NRM to separate these problems of actual category disorder and category underutilization. Our approach is consistent with researchers’ renewed attention to the effectiveness of the NRM for testing category functioning in rating scale data (Preston & Reise, 2015; Preston, Reise, Cai, & Hays, 2011; Thissen, Cai, & Bock, 2010). The NRM is more flexible than the PCM (the latter being nested within the former) and can distinguish among possible disorder, redundancy, underutilization, and order of categories for individual items. However, the NRM has been infrequently used, possibly because of its data demands. Sample sizes under 2,000 may be underpowered in identifying certain types of category problems (Preston & Reise, 2015). Our stacked data set provided the needed sample size, allowing us to test whether the NRM fit better than the PCM and illuminate the reasons for category threshold reversals under the PCM. We also analyzed the data with the GPCM. This model has not been used as frequently as the PCM for examining the category functioning of the ECERS-R. Including the GPCM, however, allowed us to determine whether the category problems reported based on the PCM reflected its constraint of all items to equally discriminate on the classroom quality level.
Other ECERS-R studies suggest the NRM might reveal problems with category disorder as well as category underutilization. Two studies analyzed indicator-level data from the ECERS-R, where observers had evaluated all indicators (rather than following the stop-scoring rule). In the first study, Lambert and colleagues (2008) analyzed indicators for a subset of ECERS-R items scored for 300 classrooms in Jamaica and Grenada. Consistent with possible category disorder, their estimated indicator difficulty levels differed from the instrument developers’ placement (e.g., an indicator that the instrument developers had placed at a score of 7 was estimated via Rasch modeling to reflect lower quality than an indicator placed at a score of 5 on the same item). Likewise, Gordon and colleagues (2015) analyzed indicator-level data for 36 of the 43 ECERS-R items, with the data coming from several hundred U.S. classrooms. They similarly found that two-thirds of the items had at least one pair of indicators that were empirically ordered in a different manner from the ECERS-R instrument developers’ placement. Beyond these indicator-level analyses, two studies also looked at possible disorder at the total score level, finding that within-category raw score averages and point-biserial correlations did not always increase with the score categories (Gordon et al., 2015; Mayer & Beckh, 2016). These results suggest that problems with category usage in the ECERS-R may be extensive and sizable enough to matter at the scale-score levels, although replication is needed beyond these two studies.
Summary and Focus of Our Study
Examining the ECERS-R scoring procedures suggests possible problems with category usage. Yet, just a few studies have examined the category functioning for the instrument. Our study advances the literature by using multiple analytic strategies (i.e., NRM, GPCM, PCM, within-category raw averages, and point-biserial correlations) and approaches (parallel and stacked analyses) replicated across eight data sets consisting of 14 waves. Our findings have important implications for the appropriateness of using ECERS-R scores in research studies and for consequential policy decisions; these uses amplify the advantage of our analysis of data sets from a wide range of samples (including centers serving low-income children and funded by state pre-kindergarten or federal Head Start programs, all the focus of policy efforts). Our more comprehensive analysis. especially because we included the NRM, let us differentiate among possible reasons for problems with category usage (e.g., category underutilization vs. category redundancy or disorder). The relevance of our findings is that they serve as evidence for the response process aspect of validity as outlined in Standards for Educational and Psychological Testing (American Educational Research Association, American Psychological Association, & National Council on Measurement in Education, 2014). Additionally, our findings offer more specific implications for future use and revision of the instrument than prior studies. Given our examination of the ECERS-R scoring rules discussed earlier, we anticipate underutilized and redundant categories to occur particularly often for the lowest categories (where indicators are sometimes complementary), for disorder to be especially common for items that mix indicators of different aspects of quality (like the personal care routines items), and to see each of these problems more often at odd- versus even-numbered categories (due to differences in their scoring rules).
Method
Data Sets
Our study involved secondary analysis of data from eight large-scale research projects that were conducted during the 2000s, all of which included ECERS-R item scores. These projects included the 2000 and 2003 cohorts of the Head Start Family and Child Experiences Survey (FACES), the Head Start Impact Study (HSIS), the Early Head Start Research and Evaluation Project (EHSRE), the Fragile Families and Child Wellbeing Study (Fragile Families), ECLS-B, the Preschool Curriculum Evaluation Research Initiative (PCER), and Quality Interventions for Early Care and Education (QUINCE). Details about the program types and family demographics for each project is in Appendix A (available online), along with details about the research teams and the training the observers received.
ECERS-R Data
Consistent with the majority of the studies on the ECERS-R, we focused on the first 36 items (omitting the item that was only scored if a child with an identified disability attended the program as well as items focused on parents and staff). Appendix B (available online) includes a summary of the item-level scores in the stacked 14 data sets/waves. The IRT models we used in this study require a certain number of classrooms to be rated with each category within an item so that the category parameters can be estimated. The data sets with fewer classrooms had instances in which one or more categories within an item went unused. Thus, for our parallel analysis (i.e., each data set analyzed individually), we followed prior research and collapsed unused categories with adjacent categories to ensure every category had at least one case (Linacre, 2004; Preston et al., 2011). Such collapsing was especially needed for the QUINCE data set, which had the smallest overall sample size (we collapsed categories for 6 items in Wave 1 and 20 items in Wave 2; for which items were rescored, see Appendix C online). Category collapsing was also needed for 1 to 3 items in each wave of the FACES data sets (e.g., for Item 2, Furniture for routine care, play, and learning, which was scored close to the maximum scale score of 7 in all waves).
Our stacked data set was formed using only the first wave of each data set to avoid nonindependence of observations, leading to item-level scores from 4,048 classrooms (after rounding the PCER and ECLS-B sample sizes, as per their reporting requirements; see Table 1). We recognize that by stacking the data sets, we implicitly assume invariance of parameters across data sets. Although sample sizes were insufficient to formally test for invariance across data sets with the NRM model, in another study, we used a factor analytic approach and found minimal noninvariance in the factor loadings (Gordon, Peng, Fujimoto, & Hofer, 2017). By assuming measurement invariance, our stacked data set resulted in every category within an item being used (95% of all possible categories were used at least 100 times), and thus none of the categories required collapsing for our stacked analysis portion of the study. To account for the different data sets possibly representing separate subpopulations within the overall population, we allowed the latent means and standard deviations to vary across the data sets in our NRM, GPCM, and PCM models by specifying them as multiple group models.
Demographics and Sampling Design for Each Data Set/Wave
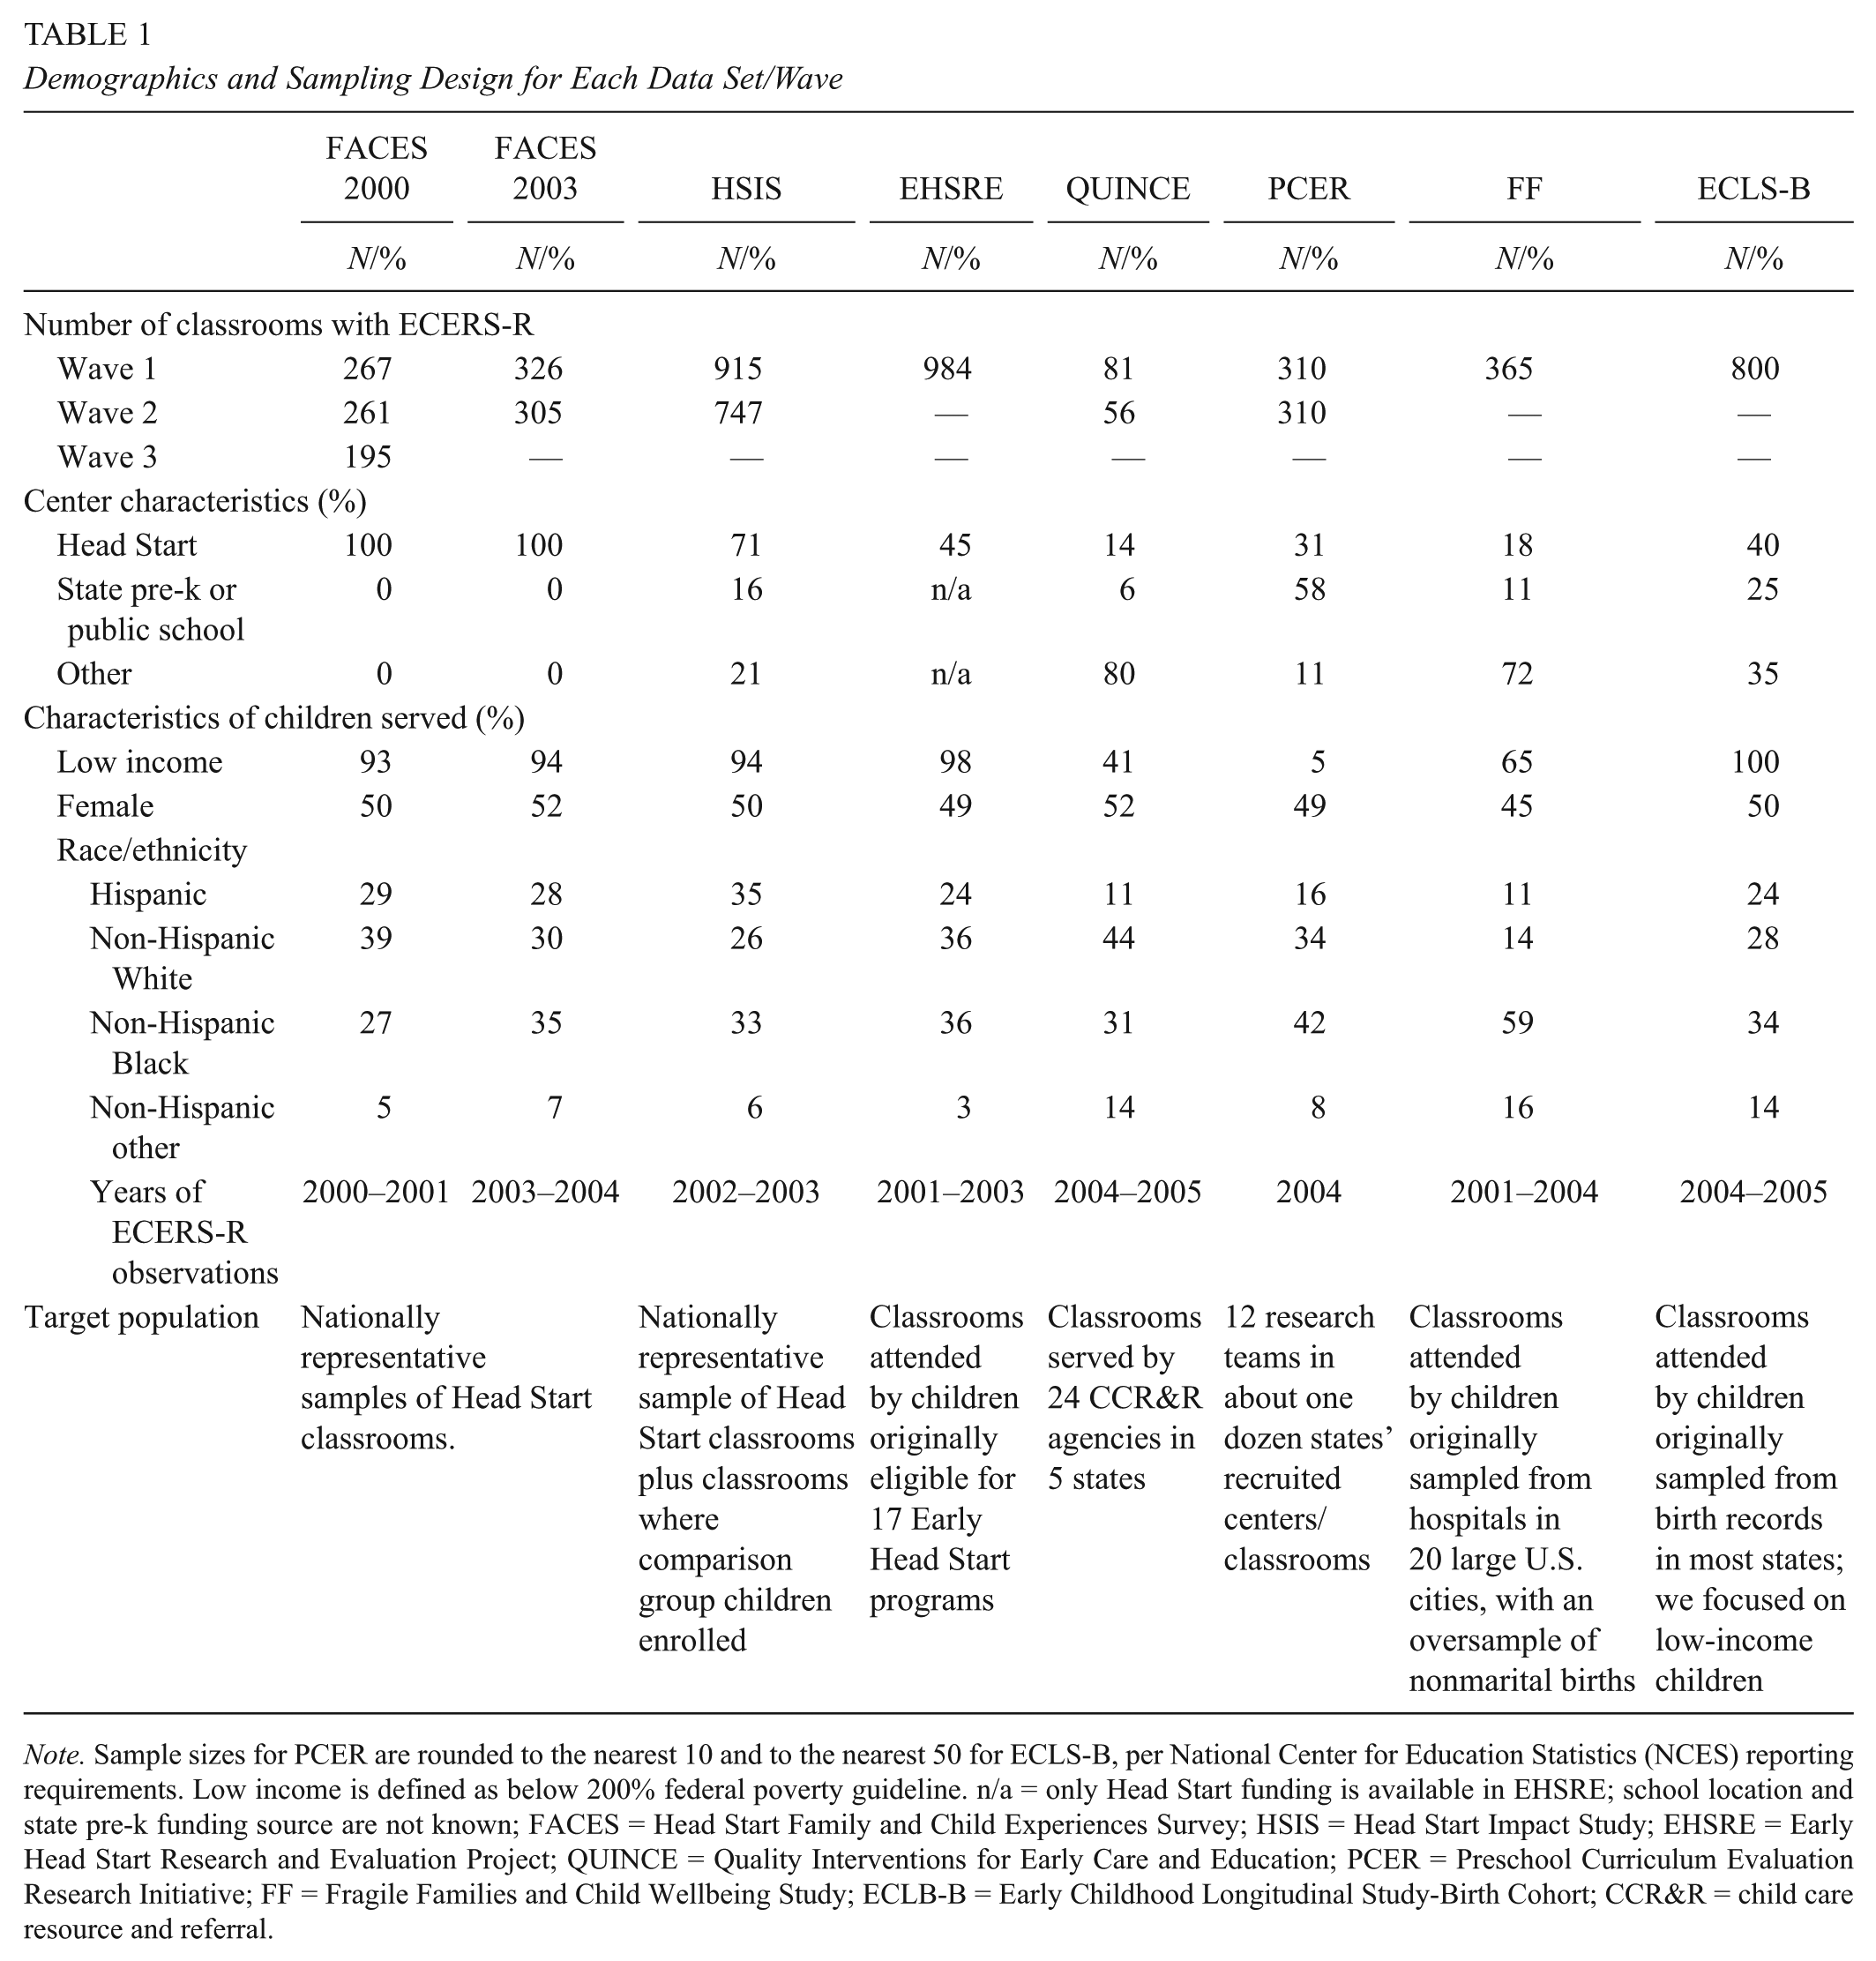
Note. Sample sizes for PCER are rounded to the nearest 10 and to the nearest 50 for ECLS-B, per National Center for Education Statistics (NCES) reporting requirements. Low income is defined as below 200% federal poverty guideline. n/a = only Head Start funding is available in EHSRE; school location and state pre-k funding source are not known; FACES = Head Start Family and Child Experiences Survey; HSIS = Head Start Impact Study; EHSRE = Early Head Start Research and Evaluation Project; QUINCE = Quality Interventions for Early Care and Education; PCER = Preschool Curriculum Evaluation Research Initiative; FF = Fragile Families and Child Wellbeing Study; ECLB-B = Early Childhood Longitudinal Study-Birth Cohort; CCR&R = child care resource and referral.
Analytic Approaches to Detecting Problems in the Score Categories
We provide a brief overview of the IRT models we used in our analysis (Appendix D includes a more detailed description of these IRT models, including an explanation of the various model parameters; Appendices E and F visually explain the concepts and present the results using category probability curves). Additionally, we describe our raw score approaches (i.e., within-category raw score averages and point-biserial correlations).
Item response theory approaches
In our presentation of the NRM, GPCM, and PCM, we use the following indices. The data sets are indexed using g (where g = 1, 2, . . . , 8 and each value represents a data set) in our multiple-group analysis. This subscript is not needed when each data set is analyzed by itself because all classrooms belong to the same data set (or group) in this case. The classrooms are indexed using i (where i = 1, 2, . . . , ng and ng is the number of cases in data set g). The items are indexed using j (where j = 1, 2, . . . , 36), and category scores are indexed using k (where k = 1, 2, . . . , mj, with mj being the highest score category for item j). In the stacked data set, mj equaled 7 for all items. In the parallel analysis, mj equaled 7 for the items in each individual data set where all categories were used and less than 7 for those items that had one or more unused categories (see Appendix C online for details about which items within a data set required rescoring).
The nominal response model
The NRM arrives at the probability of a rating of k on item j conditional on the quality level for classroom i in data set g (θ ig ) through:
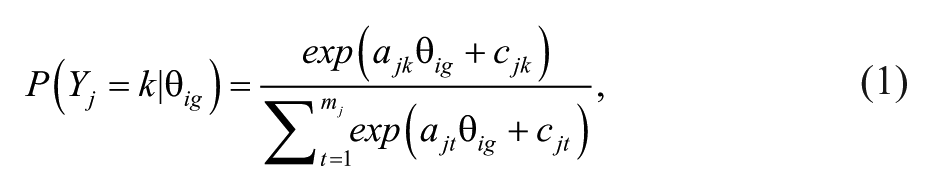
where ajk and cjk represent the kth category’s discrimination and intercept, respectively, for item j. The category boundary discriminations (CBDs), which depend on the category discriminations, is of primary interest when examining the ordering of the categories (Preston et al., 2011; Preston & Reise, 2015). The CBD for two adjacent categories (k – 1 and k) within item j is:

A large positive value for
The scoring function value (SFV jk ) for category k within item j is also of interest when examining category functioning:

and thus the SFV is

As a reexpression of the category discriminations under Thissen and colleagues’ (2010) parameterization of the model, SFVs provide the same conclusions as CBDs but on a more interpretable metric. As such, we report SFV results in online Appendix G to supplement the CBD results we present in the following.
The thresholds indicate when categories are underutilized, with the threshold for category k within item j (bjk) obtained through

(Thissen et al., 2010). All categories are ordered and sufficiently used when the category thresholds are monotonically increasing (i.e.,
Regarding the population distribution of classroom quality levels, they were assumed to be distributed as a univariate normal with a mean (M) and standard deviation (SD) in the population for each data set, that is,

where μ g and σ g are the M and SD, respectively, for the classrooms in data set д. The M and SD for the first data set were fixed to 0 and 1, respectively, for model identification.
The generalized partial credit model and the partial credit model
The GPCM is obtained from the NRM by setting the SFVs within each item (see Equation 3) to constants that increase in increments of 1 (e.g., from 0 to 6). The PCM is obtained by further constraining the overall item discriminations to be equal across all items. That is, a1 = a2 = … = aj = a36 = a. Because of these constraints, the category thresholds for the GPCM and PCM are obtained through

where disordered thresholds from these models indicate category underutilization and/or disorder.
Analytic steps
Our stacked analysis proceeded in the following manner to determine whether problems in the category functioning were occurring. In the first step, we examined the relative fit of the NRM, GPCM, and PCM to the stacked data set using the likelihood ratio test (LRT) and Akaike Information Criterion (AIC). Next, we tested each item for whether the SFVs increased in increments of one unit (i.e., fixed the first through seventh SFVs to 0 through 6, respectively) while all other items’ SFVs were freely estimated. Conceptually, this tested whether an item fit the GPCM (i.e., constraining categories to be ordered and equally discriminating on the measured trait) while treating all other items as fitting the NRM. We then compared the fit of each reduced model (i.e., the model with one item constrained) to the full NRM model using the LRT and AIC. For the 36 different LRTs, we performed the Benjamini-Hochberg (Benjamini & Hochberg, 1995) correction to reduce the chance of false discoveries (see Appendix H online for details; we thank an anonymous reviewer for suggesting this).
Next, we performed category-level examinations of all items flagged as problematic during the previous step, which involved inspecting the CBDs (and their 95% confidence intervals [CIs]) from the initial NRM analysis (see online Appendix H for details on how the standard errors were obtained to form the CIs). We considered two adjacent categories as disordered when the upper limit of the 95% CI for their corresponding CBD was less than 0, clearly redundant when the 95% CI included 0, redundant because the categories were not being distinguished enough when the CI included values greater than 0 and up to 0.5, and ordered when the lower bound of the 95% CI was greater than 0.5. The reason for the range of 0 to 0.5 for redundant categories is because a CBD can be viewed as the discrimination for two adjacent categories (Preston & Reise, 2015; Thissen et al., 2010). When the CBD is 0, the corresponding categories are indistinguishable. A convention for a CBD cutoff to indicate that the two categories are distinguished enough does not exist. Thus, we adopted 0.5 because researchers found that data generated with CBDs greater than 1.5 led to ordered data conforming to the Guttman pattern with unrealistic precision while data generated with CBDs less than 0.5 had unrealistic poor properties (Preston & Reise, 2015), suggesting that the generated data with CBD values set to less than 0.5 did not resemble ordinal data. We also examined whether the adjacent category thresholds under all three models were ordered, equivalent, or reversed (also using 95% CIs, but for the category thresholds in this case; see online Appendix I for details on the decision rules).
In our parallel analysis, we only used the PCM because none of the individual data sets for this portion of our study had the 2,000 plus cases that Preston and Reise (2015) found was typically needed for adequate power to test for category order with the NRM. We established whether adjacent pairs of PCM thresholds were disordered, equivalent, or ordered within each data set as in the stacked analysis. We then compared across the data sets to see whether disordered and equivalent pairs of adjacent thresholds occurred in similar category locations.
Within-category raw score averages and category-to-total point-biserial correlations
We also examined the within-category raw score averages and the category-to-total point-biserial correlations to investigate the impact the problematic categories detected with the IRT models might have at the scale score level (Adams et al., 2012; Wetzel & Carstensen, 2014). For these calculations, we first followed standard ECERS-R scoring by averaging item scores to form a total raw score for each classroom (although we used the first 36 rather than all 43 items, as noted previously). We next repeated the following calculations separately for each item. To obtain the within-category raw score averages for each item, we identified the classrooms rated with the same category score and then averaged those classrooms’ total raw scores. To obtain the category-to-total point-biserial correlations for each item, we correlated the total raw scores with dummy indicators as to whether a classroom was rated in each category (0 = no, 1 = yes). When higher categories represent increasing levels of quality, these within-category averages and point-biserial correlations should increase with the score categories. This monotonic increase is expected even though the point-biserial correlations will be negative for the lower scores because of the multicategory response structure of the ECERS-R (Adams et al., 2012; Mayer & Beckh, 2016).
Software
The parameters of the NRM, GPCM, and PCM were estimated using flexMIRT (Cai, 2017). We note two differences between the flexMIRT parameterization and the presentation of our results. First, flexMIRT fixes the first and last categories’ SFVs to 0 and 6, respectively. We added a constant of 1 to all SFVs so that they could be directly compared to the ECERS-R scores. Doing so does not alter any of the conclusions about the SFV results in online Appendix G. flexMIRT also parameterizes the thresholds differently from Equation 7. We used the previous notation to emphasize the similarities and differences among the NRM, GPCM, and PCM, although again our notation does not alter conclusions about threshold order, equivalence, and reversal (see online Appendix I for details on flexMIRT’s parameterization).
Results
We first present the results of the model comparison and the item-level tests based on the analysis of the stacked data set. Then we present category-level results regarding the CBDs and thresholds. We end with the within-category raw scores and point-biserial correlations.
Model Comparisons and Item-Level Tests
For the stacked data set, the NRM (AIC = 412,753) was strongly favored over the GPCM (AIC = 414,879) and the PCM (AIC = 417,734) based on the information criteria. The likelihood ratio test indicated that the NRM’s improvement in model fit over the GPCM, χ2(180) = 2,486, p < .01, and PCM, χ2 = 5,410, p < .01, were statistically significant. Between the GPCM and PCM, the information criteria favored the GPCM, and its improvement in model fit over the PCM was statistically significant, χ2(35) = 2,924.34, p < .01. The NRM being favored over the other two models suggests that a subset of items has categories that do not follow an ordinal progression and/or the categories within each of those items do not equally contribute to the measured trait.
Although the GPCM displayed greater model fit to the data over the PCM, we present the results from the PCM and reserve the results from the GPCM for online Appendix J for the following three reasons. First, the two models produced very similar findings in terms of category threshold conditions (as detailed in the online appendix). Second, the PCM matches the assumptions of the ECERS-R scale developers (i.e., the standard scoring uses the simple average of items). Finally, doing so allows our PCM results to be compared to prior published studies on the ECERS-R, which primarily have been based on the PCM when those studies used an IRT model for ordinal data.
Regarding the item-level tests, all items were statistically significant even after correcting for false discovery. This finding indicates that none of the items had SFVs that increased in increments of 1 (i.e., none of the items conformed to the GPCM). Conceptually, this means that none of the items had categories contributing equally to overall classroom quality, creating the possibility that disordered and redundant categories were present. Based on the item-level results, we proceeded with our analysis at the category level for all items.
Nonorder in Category Boundary Discriminations
The NRM identified extensive nonorder in the categories through the CBDs (values reported in Table 2). Of the 216 adjacent pairs of categories, there were 7 instances where the 95% CIs for the CBDs were below 0 (3%), which indicates that the categories corresponding to these CBDs were disordered. That is, the higher of the corresponding categories represented lower levels of quality than their immediately prior categories. There were 31 instances where the CIs for the CBDs included 0 (14%), which indicates that each pair of categories associated with these CBDs were clearly redundant. There were 150 instances where the CIs were above 0 but below or included 0.5 (69%). This indicates that the categories within each pair associated with each of these CBDs were not being distinguished enough to represent different levels of quality based on our cutoff of 0.5. Lastly, there were 55 instances where the CIs were above 0.5 (26%), which indicates that the categories within each pair associated with these CBDs were ordered.
Category Boundary Discriminations From the Stacked Analysis With the Nominal Response Model

Note. Values are category boundary discriminations (
95% CI for
95% CI overlaps 0.
5% CI greater than 0 and including values up to 0.5.
95% CI greater than 0.5.
Turning to the category locations and the item types where these problems were most extensive, the CBDs that were consistently negative or overlapping zero were concentrated at locations where the odd-numbered categories of 3 and 5 were the higher of the adjacent pairs of categories. For instance, all seven negative CBDs (with 95% CIs below 0) were for the boundary discrimination between Categories 2 and 3 (
Nonorder in Category Thresholds
Analysis of the stacked data set
The category threshold estimates produced during the analysis of the stacked data set with the PCM are in Table 3. The superscripts indicate problems of reversal or equivalence between the marked value and the immediately preceding threshold value. Nonorder in adjacent thresholds consistently occurred in two locations: for
Thresholds From the Stacked Analysis With the Partial Credit Model

Note. Values are based on the slope-threshold specification of the partial credit model, where monotonically increasing values indicate ideal category functioning. Thresholds begin with Category 2 because they are defined relative to the immediately prior category (see Equation 7). Results are from the analysis of the first or only waves of the eight data sets that were stacked together, n = 4,048 classrooms.
Value is statistically equivalent to the threshold just below it (i.e., overlapping confidence intervals).
Value is reversed in relation to the threshold just below it (lower confidence interval bound of lower threshold above upper confidence interval bound of higher threshold).
As noted earlier, the PCM threshold estimates may reflect problems introduced by assuming the categories are ordered when they are truly disordered, whereas the NRM can separately detect category disorder through the CBDs and category underutilization through the thresholds. In the case of the ECERS-R, the NRM revealed extensive problems in the threshold locations as well as the CBDs. That is, under the NRM, every item had nonordered thresholds. The pattern of problematic thresholds under the NRM was similar to those observed under the PCM, with most items having two or more nonordered thresholds that typically pointed to underutilization of Categories 3 and 5. However, the NRM showed more evidence of Categories 2 and 4 being underutilized than the PCM did, where these categories were also considered to be disordered based on the CBDs. In other words, the forced ordering of the SFVs under the PCM for the categories that were disordered resulted in category underutilization appearing at the higher category.
Analysis of each data set (parallel analysis)
As previously noted, the sample size precluded analyzing each data set with the NRM, but our parallel analysis with the PCM confirmed that nearly every item had at least one instance of reversed thresholds in most of the 14 replicate data sets/waves. More specifically, this was true for majority of the items: 90% to 100% in 10 of the data sets/waves, 81% in PCER, and 64% in FF. Category threshold equivalence was more frequently observed in the QUINCE data set, most likely because of its small sample size leading to standard errors that were over twice the size of those seen in other data sets and in turn resulting in more overlap between adjacent confidence intervals. Nevertheless, in QUINCE, half of the items still had at least one pair of reversed category thresholds in the first wave of data collection, as did one-quarter of the items in the second wave.
The locations of the threshold reversals were also consistent across data sets/waves. Every sample replicated problems of reversals between thresholds
Within-Category Averages and Category-Total Point-Biserial Correlations
The within-category averages of the raw scores are presented in Table 4. In nearly three-quarters (26 of 36) of the items, these values did not consistently increase from the lower to the upper of two adjacent categories (i.e., nonorder). Nonorder most frequently occurred for Category 3 (18 items) and Category 5 (8 items) and was especially evident for the personal care routines (Items 9–14). These findings were consistent with the location of problems in the category functioning identified by the NRM, GPCM, and PCM.
Within-Category Raw Score Averages and Category-Total Point Biserial Correlations From the Stacked Analysis

Note. Values are within-category raw score averages and category-total point-biserial correlations. Results are from the analysis of the first or only waves of the eight data sets that were stacked together, n = 4,048 classrooms.
Indicates overlapping confidence intervals for means.
The value is smaller than the preceding correlation for point-biserial correlations.
Indicates reversals based on confidence intervals for means.
Table 4 also includes the category-total point-biserial correlations. The correlations did not monotonically increase for two-thirds (24/36) of the items. These violations frequently occurred around Category 3, which was consistent with our other findings. In contrast, the point-biserial correlations were generally ordered in the upper categories. These differences could be because each point-biserial correlation uses data from all classrooms (with every classroom not in a focal category being in the reference group), whereas the within-category averages and the IRT parameters focus just on the classrooms in each pair of adjacent categories. Another possible reason for the different results could be the lack of a conventional cutoff for the needed increment in point-biserial correlations to signal redundant categories, such as those observed in the upper categories of the ECERS-R (e.g., Item 9 had nearly identical values for Categories 5 and 6).
Discussion
Our study provides empirical evidence of problems with the category functioning that we anticipated based on our examination of the ECERS-R manual. We also advance the handful of prior studies on this topic by using multiple analytic strategies (i.e., NRM, GPCM, PCM, within-category raw averages, and point-biserial correlations) and approaches (parallel and stacked analyses) involving eight data sets with 14 waves. Problems in category functioning were consistently evident across items, data sets, analyses, and approaches, and our comprehensive analysis helped pinpoint the locations and types of problems. For instance, problems were consistently evident with Categories 3 and 5, likely reflecting the instrument’s complex stop-scoring rules, as we described in the introduction. For many items, the problems detected in category functioning reflected category underutilization and redundancy. For other items—especially those capturing children’s personal care routine items (Items 9–14)—the problems included category disordering. Regardless of the category functioning problems, the fact that the SFVs deviated from the scale developers’ assigned scores for all items indicate that all categories within an item do not contribute equally to the measured trait (Preston & Reise, 2015). This finding, along with our other rigorous psychometric results, has important implications for using averages of ECERS-R developer-assigned scores for research and policy purposes.
As Preston and Reise (2015) cautioned in situations of small CBDs (which are based on the SFVs) like we found for the ECERS-R, “when category distinctions fail to discriminate, a researcher would not want to use a scoring strategy that aggregates raw integer item scores” (p. 392). Our findings raise concern with the current use of averaged scores for consequential decisions, echoing findings from earlier descriptive studies of the instrument (e.g., K. G. Hofer, 2010). In terms of research, the raw scores include error from the categories within an item not following an ordinal progression and equally discriminating. These could be contributing factors for the very small effect sizes between ECERS-R raw averages and child outcomes that are frequently reported.
Our study contributes to the literature on the category functioning of the ECERS-R items in several important ways. First, our study used parallel analysis to replicate findings across different data sets, indicating that the problems observed in the category functioning occurred in data from a range of different samples and data collection teams. This replication shows that the small set of published research demonstrating problems with the ECERS-R categories was not due to their unique samples. This replication drives our second major contribution because our samples come from settings that are the focus of current policy efforts. As a result, our findings have direct implications for the current use of the ECERS-R. A third contribution is that we were able to use the NRM and PCM in our stacked analysis. Doing so allowed us to differentiate the extent to which problems identified in prior PCM-based studies reflect only underutilization of a category versus also reflecting disorder and redundancy of categories.
Our findings are consistent with, but importantly extend, the small set of prior psychometric studies of the ECERS-R. For instance, our finding that category disorder occurred most often for the children’s personal care routines items is consistent with Gordon and colleagues’ (2015) indicator-level Rasch analysis. Their study revealed that nearly two-thirds of the indicators for these items were empirically ordered in a manner that differed from the category scores where the instrument developers had placed them. Our current findings are also consistent with prior studies (Gordon et al., 2013; Mayer & Beckh, 2016) where reversed thresholds under the PCM were interpreted as problems in the categories stemming from the stop-scoring rule combined with the greatest mixing of indicators that tap into different aspects of quality for these personal care routines items. In addition to this potential problem of mixing indicators, in the current study, we also highlighted ways in which the broader mixing of basic and advanced indicators—along with the presence of complementary indicators—might limit, if not preclude, the use of certain categories. We also found that problems accumulated to the scale score level, with all but four items having disordered within-category averages or point-biserial correlations, replicating the single-study evidence of each problem in prior studies (for averages, Gordon et al., 2015; for correlations, Mayer & Beckh, 2016).
Although our study used multiple analytic strategies to identify problems in the category functioning of the ECERS-R items across different data sets, we note some limitations. One limitation is that we could not use the NRM on the individual data sets because of their small sample sizes. In the parallel analysis with the PCM, we had to collapse categories with low frequencies in some data sets/waves, primarily the QUINCE data set, where we saw more equivalent thresholds than reversed thresholds. Collapsing categories did not appear to have an impact on threshold disordering because, in the items that did not require any collapsing, the nonordering in the thresholds appeared in the same category locations as observed in the stacked analysis, which did not require any category collapsing. We encourage future replication studies with sufficiently large samples to confirm that collapsing does not affect threshold conditions during an IRT analysis. It is also the case that many of our data sets included primarily lower-income children. Although these data sets were an advantage because these children are often the target of policy and we found that all categories were used in our stacked data set, additional replication with diverse samples is warranted. Such studies may wish to proceed in a two-step approach similar to what we used, especially when each data set lacks the sufficient sample size for the NRM. The first step could include a parallel analysis of the data sets using the PCM. If the category problems replicate across data sets, then the NRM could be fitted to the stacked data set to differentiate issues of category redundancy, disordering, and underutilization. The stacked analysis could also include calculating within-category means and point-biserial correlations to inform how item-level problems accumulate to the scale score level.
Another limitation of this study is that we did not have access to indicator-level data, particularly data with all indicators scored rather than stop-scored. Analyzing complete indicator-level data could further illuminate the reasons for the problems in the category functioning that our study detected. Such indicator-level analysis could also inform alternative scoring systems for the ECERS-R (and the new ECERS-3) as well as further refinement of item content (e.g., Clifford, Sideris, & Neitzel, 2012). Finally, limited simulation and empirical studies exist for using the NRM to examine the category functioning of rating scale items. Particularly challenging for applied scholars is how to determine when a positive CBD is too close to zero to reflect a lack of meaningful distinction between categories (i.e., redundancy). Regardless of whether a clear upper cutoff currently exists for CBDs to indicate order, CBDs of 0 and less than 0 are clearly problematic, of which there were many in our study. We encourage further methodological work to establish guidance regarding whether CBDs are large enough to indicate that their corresponding categories are sufficiently distinguished.
Although the new ECERS-3 manual advises users to consider scoring all indicators, it still retains the stop-scoring approach in its standard scoring guidelines and training materials and does not offer a specific scoring strategy based on all of the indicators. We recommend that practitioners, researchers, and policymakers move to alternative scoring methods (for both the ECERS-R and the ECERS-3) that yield quality estimates that are reliable and valid for research and policy use. By integrating models such as the NRM, GPCM, and PCM into iterative scale development, improved measures may yield larger correlations with children’s school readiness. If the stop-scoring approach is retained in future scale revisions, empirical evidence demonstrating that the indicators are ordered as organized within item categories should be produced, along with other reliability and validity evidence. Until then, our results combined with those currently documented in the literature caution against using the ECERS-R with the stop-scoring rule for research, policy, and practice.
Footnotes
Acknowledgements
The research reported here was supported by the Institute of Education Sciences, U.S. Department of Education, through Grant R305A130118 to the University of Illinois at Chicago (Rachel A. Gordon, PI) with a subcontract to Vanderbilt University (Kerry G. Hofer, PI). We gratefully acknowledge advice from Ariel Aloe and Everett Smith and research assistance from Rowena Crabbe, Danny Lambouths, Elisabeth Stewart, Kayla Polk, Jenny Kushto-Hoban, and Hillary Rowe in data extraction and literature review. The opinions expressed are those of the authors and do not necessarily represent views of the Institute, the U.S. Department of Education, or our consultants.
Authors
KEN A. FUJIMOTO is an assistant professor in the Research Methodology Program, Loyola University Chicago. Dr. Fujimoto’s research interests include development and applications of item response theory models.
RACHEL A. GORDON is a professor in the Department of Sociology, University of Illinois at Chicago. Dr. Gordon’s research interests include early learning and education, childhood care, families and work, adolescent development, and multilevel and longitudinal models.
FANG PENG is a graduate research assistant in the Department of Educational Psychology, University of Illinois at Chicago. Ms. Peng’s research interests include applications of item response theory models and test score equating.
KERRY G. HOFER is an associate/scientist at Abt Associates. Dr. Hofer’s research interest includes preschool education, teaching methods, and educational assessment and has been involved in numerous large-scale evaluations.
References
Supplementary Material
Please find the following supplemental material available below.
For Open Access articles published under a Creative Commons License, all supplemental material carries the same license as the article it is associated with.
For non-Open Access articles published, all supplemental material carries a non-exclusive license, and permission requests for re-use of supplemental material or any part of supplemental material shall be sent directly to the copyright owner as specified in the copyright notice associated with the article.