
Abstract
We measure college enrollment selectivity gaps by race-ethnicity using a novel method that is sensitive to both the level (2- vs. 4-year) and selectivity of the college in which students enroll. We find that overall Hispanic–White and Black–White enrollment selectivity gaps closed in the United States between 1986 and 2014. This overall closing of gaps appears to be related to the closing of high school graduation gaps. However, this contraction was driven almost entirely by students at the margin between no college and college enrolling in non-degree-granting programs. Among students who enrolled in degree-granting schools, Black students have enrolled at increasingly less selective institutions than White students, whereas Hispanic–White gaps remained relatively unchanged over the nearly 30 years of our study. These gaps are concerning because of their implications for long-term economic inequality.
In other words, the level and selectivity of a student’s postsecondary destination are important predictors of later-life outcomes, but this nuance has not been fully accounted for in discussions of college enrollment trends. Rather than tracking indicators of inequality by focusing on questions like “Did a greater percentage of White students than Black students enroll in college?” or even “Did a greater percentage of White students than Black students enroll in a selective college?” scholars and policymakers need to attend to the full spectrum of postsecondary education destinations.
We regularly observe, for example, that access to selective colleges does not appear equal between groups—minority and low-income students attend selective colleges at disproportionately low rates (Alon & Tienda, 2007; Astin & Oseguera, 2004; Bowen & Bok, 1998; Engberg, 2012; Posselt, Jaquette, Bielby, & Bastedo, 2012; Reardon, Baker, & Klasik, 2012). However, these findings do not help us understand the overall distribution of minority and low-income students in American higher education. If, concurrent to downward trends at the most selective colleges, minority enrollment is increasing at colleges that are moderately selective, then it may be that overall gaps in college destinations are closing, indicating that progress is being made in college access for underrepresented groups, if not at the most selective levels. Measuring these enrollment selectivity gaps is difficult because the American higher education system has a complex hierarchical structure, and access may increase at colleges of some levels and decrease at others. As a result, it has been difficult to say succinctly whether disparities in access have been increasing or decreasing over time.
We work to make such an assessment in this article. Specifically, we address four research questions: (a) How big are the gaps in the selectivity of college attended by White and traditionally underrepresented racial-minority students? (b) Within which levels of college selectivity are these gaps largest? and (c) How have these gaps changed over time? The ability to track changes in overall college enrollment selectivity gaps alongside other broad demographic and education trends—like changes in race-based gaps in income or high school graduation—can help identify important correlates of the gaps. Thus, we also ask, (d) How are trends in college enrollment selectivity gaps related to trends in race-based gaps in high school graduation, achievement, income, and parental education?
In answering these questions, we make three contributions to the understanding of racial stratification in postsecondary schooling over time. First, our measurement of enrollment selectivity gaps succinctly quantifies the extent of racial stratification across all levels of postsecondary education. This technique is helpful because it is difficult to simultaneously track changes in enrollment gaps across multiple levels of postsecondary type and selectivity. Second, in contrast to earlier work that typically examines enrollment gaps using national samples of high school students collected decades apart, we use data that capture nearly the complete populations of students enrolled in postsecondary education annually. Finally, we are among the first to look at macrolevel trends in gaps other than college enrollment to identify potential explanations for enrollment selectivity gaps. In this endeavor, we update and expand the work started by Kane (1994, 2004).
The Importance of College Choice
As college enrollment rates have grown, where—as opposed to if—a student attends college has become increasingly important (Hoxby, 2004). U.S. higher education is distinctly hierarchical, with many low-status, broad-access institutions at the bottom and relatively few high-status, exclusive-access universities at the top (Labaree, 2017). Students who attend more-selective colleges enjoy larger tuition subsidies, more-generous college resources, and more faculty attention (Hoxby, 2009; Hoxby & Avery, 2012). A growing body of research indicates that selective college attendance leads to higher average earnings (Black & Smith, 2004; Hoekstra, 2009; M. Long, 2008), and the largest benefits may accrue to minority and other disadvantaged students (Dale & Krueger, 2011).
But it is not only among the most prestigious schools that selectivity matters. Enrollment at less competitive schools, even those that are marginally selective, affects several important outcomes. College selectivity is related to the probability of completion both overall and for academically marginal and racial-minority students (Cohodes & Goodman, 2014; Goodman, Hurwitz, & Smith, 2017; Kurlaender, Carrell, & Jackson, 2016; B. Long & Kurlaender, 2009; Melguizo, 2006; Smith & Stange, 2015), and the probability of completing has implications for labor market outcomes and for the ability to manage student loan debt (e.g., Dynarski, 2015). Selectivity, across the full distribution of schools, is also related to initial earnings and earnings growth (MacLeod, Riehl, Saavedra, & Urquiola, 2015; Scott-Clayton, 2016) and even provides a premium to already-lucrative majors, like business and the sciences (Eide, Hilmer, & Showalter, 2016). However, racial-minority students are less likely to choose high-paying majors (Carnevale, Strohl, & Melton, 2013), which—although we do not track majors in this article—suggests that the economic implications of enrollment selectivity gaps are likely only exacerbated by differences in major choice.
Thus, one step toward improving racial economic equality is to promote greater parity in selectivity of college enrollment between race groups. Comparable levels of college enrollment between race and ethnicity groups makes it more likely these groups will see comparable economic outcomes. For this reason, it is important to track enrollment selectivity gaps.
Improving on Prior Higher Education Student Stratification Research
Despite recent absolute increases in the percentage of Black and Hispanic students enrolling in college (Perna, 2000), a greater share of White students than Black and Hispanic students attend college (see, e.g., Berkner & Chavez, 1997; Kane, 1994, 2004; Perna, 2000). In addition to these general enrollment gaps, Black and Hispanic students are also much less likely than White students to be enrolled in 4-year colleges in general (Bozick & Lauff, 2007; Dalton, Ingels, & Fritch, 2015) and more-selective colleges in particular (Bowen & Bok, 1998; Hearn 1991; Reardon et al., 2012). Longitudinal studies of admission to “very competitive” 4-year colleges have shown increasing underrepresentation of minority students (Alon & Tienda, 2007; Engberg, 2012; Karen, 2002; Posselt, et al., 2012). We aim to add to this literature by measuring gaps in a way that is sensitive to all college types and levels simultaneously.
Most of these earlier studies have typically drawn conclusions about the racial composition of colleges using samples of students from the National Longitudinal Survey of 1972, High School and Beyond 1980, National Educational Longitudinal Study of 1988, and Educational Longitudinal Study of 2002. This data choice is problematic for two main reasons. First, these data sources are collected from cohorts that are each almost a decade apart, limiting their precision in tracking trends over time. Second, they are sampled to be representative of high school students but not college students or college students at any particular level of selectivity. Thus, college enrollment analyses are sometimes supported by sparse observations for specific racial groups at particular levels of higher education. In contrast, we primarily use data from the Integrated Postsecondary Education Data System (IPEDS), which gives us a nearly complete census of annual postsecondary enrollment. Although it has limitations that we note below, IPEDS gives us a much more complete picture of postsecondary stratification and its evolution over time, freeing us from the pitfalls of having to extrapolate from potentially small subsamples or potentially anomalous cohorts of students. 1
We analyze these data with a variation of the V-statistic methodology developed by Ho and Reardon (2012). This method was first used to measure gaps on achievement tests in which only ordered, categorical score thresholds (e.g., fail, low pass, pass, high pass), rather than continuous scores, were available. Such data make it difficult to present easily digestible statistics that can be tracked over time (such as “White children score 10 points higher than Black children, on average”). Ho and Reardon use the V-statistic methodology to recover such test gaps by measuring the distribution of test scores implied by the percentage of students of each race group that scores above certain proficiency thresholds.
The V-statistic has also been used to describe income gaps (Reardon, Townsend, & Fox, 2017) and differences in student test engagement (Soland, in press). Here we use the method to quantify enrollment selectivity gaps using fixed, ordinal levels of selectivity rather than test thresholds. In effect, the V-statistic approach quantifies the difference in the selectivity of college enrolled in by students from different race-ethnicity groups (akin to the average difference in tests scores between groups), improving upon prior approaches that examine group differences in the percentage of students who enrolled in any one level of college (akin to difference in the percentage of students deemed proficient by a given test).
This technique is helpful because it is difficult to simultaneously track changes in enrollment differences across multiple levels of postsecondary level and selectivity. As a basic example of this challenge, consider a scenario in which 20% of college-age Black individuals enrolled in community colleges, 15% in nonselective 4-year colleges, and 3% in the most selective colleges, but 5 years later, these percentages were 22%, 11%, and 5%, respectively. In this example, what should we conclude about the relative representation of Black students relative to hypothetically unchanged White enrollment patterns? The answer is difficult to give because Black students in this example gain ground in some areas but lose it in others. Additionally, in a more realistic example, the proportion of White students enrolled in different levels would change too. The question becomes more complicated in the present study because we examine nine different levels of postsecondary enrollment per race-ethnicity over 28 years. The technique we use simplifies the enrollment selectivity gap measurement to a single number per year. To demonstrate the utility of such data simplification, consider the methods and figures in Appendix A, which illustrate the difficulty of presenting the constituent data of our analysis an easily interpretable way.
Although our primary interest is in describing overall enrollment selectivity gaps, we also look at how trends in enrollment selectivity gaps change conditional on enrollment at certain levels of college. Different trends in enrollment selectivity gaps between different conditional analyses help determine the postsecondary levels at which the change in gaps have been most dramatic.
Concurrent Trends
To the extent that we find trends in college enrollment selectivity gaps over time, it is important to understand why they change. We lay the foundation for future work in this area by considering concurrent trends that may be related to observed changes in college enrollment selectivity gaps. Although there are many possible explanations for trends in enrollment selectivity gaps, we focus on academic and familial factors.
Academic factors
Both academic achievement and high school graduation likely play a role in determining whether and where students enroll in college. Race-based academic achievement gaps have been slowly closing over time (Jencks & Phillips, 1998; Reardon, Robinson-Cimpian, & Weathers, 2015). If relative increases in academic performance by minority students are reflected in students’ postsecondary enrollment choices, the narrowing of achievement gaps would predict the closing of enrollment selectivity gaps.
Although achievement plays a large role in selective colleges, most postsecondary institutions have relatively minimal admissions criteria or accept the majority of students who apply (Klasik, Proctor, & Baker, 2015). For students considering these options, high school graduation is the major academic milestone they must reach. Although race-based high school graduation gaps have narrowed over the past few decades (Murnane, 2015), as of 1999, the closing of these gaps, as well as the shrinking of gaps in academic achievement, did not appear to be related to gaps in college enrollment (Kane, 2004).
Family factors
A student’s family plays many roles in the admissions process, but for our exploratory purposes we focus on two: a family’s income and whether a student’s parents went to college. These two factors have been found to be related to undermatching (Dillon & Smith, 2017; Smith, Pender, & Howell, 2013), in which a student enrolls in a college that is less selective than one might expect given the student’s academic background (Bowen & Bok, 1998; Roderick, Nagaoka, Coca, & Moeller, 2008) a phenomenon that itself may be related to enrollment selectivity gaps.
In the United States, postsecondary tuition/fees are positively correlated with admissions selectivity. 2 Because Hispanic and Black families, on average, earn less than White families (Fryer, 2011; Patten, 2016), some of the disparities in college destinations by race could therefore be the result of differences in (perceived or actual) ability to pay or other admissions benefits that are associated with coming from a higher-income background (Reardon, Kasman, Klasik, & Baker, 2016). There is some evidence that income gaps are slowly narrowing, especially for women (Kochhar & Fry, 2014; Patten, 2016), which may predict increasing parity in college enrollment selectivity between groups.
We also focus on gaps in whether parents of college-age children attended college themselves. Having a parent who went to college is a common indicator of social capital—sources of information and support—and, in general, students with access to more sources of social capital are more likely to enroll in college (Ellwood & Kane, 2000; Hossler, Schmit, & Vesper, 1999; McDonough, 1997; Perna, 2006; Perna & Titus, 2005). There are notable differences by race in terms of access to social capital (McDonough, 1997; Perna, 2006; Perna & Titus, 2005), so changes in access to social capital may also explain trends in enrollment selectivity gaps. Kane (1994) documented trends in Black–White gaps in whether parents graduated from high school, noting that the closing of these gaps was associated with the closing of college enrollment gaps into the late 1980s, but to our knowledge, race gaps in parental postsecondary educational attainment have not previously been documented. Because parental education strongly predicts the likelihood of college enrollment, we hypothesize that any closing of parental educational attainment gaps would lead to closing of college enrollment selectivity gaps.
Other factors
We chose to look at academic and familial factors because they are supported by theory and because they lend themselves to our primary goal of measuring and comparing nationwide enrollment selectivity gaps over time. Despite this focus, we note that these factors are not an exhaustive account of the forces that shape students’ enrollment choices. Indeed, any policy or characteristic that would lead students to make differential enrollment choices in ways that vary by race has the potential to affect enrollment selectivity gaps. State-level policy is a particularly rich area for such policies: From setting tuition to banning affirmative action, states engage in many activities that likely affect enrollment choices differentially by race. It may also be that cohort sizes or relative changes in net tuition between higher- and lower-selectivity institutions may also have a role to play, although it is unclear whether these changes would lead to different enrollment choices by race. The variation in enrollment selectivity gaps that result from this extended list of explanations—in terms of either local, in-state gaps or broader, national gaps—is not a topic we can do justice to in this study and is a limitation of our work. However, we believe that our work is a useful starting point for thinking about state-specific issues and hope our approach has value for future research in this area.
Data
The V-statistic approach requires data on the percentages of each race-ethnicity group enrolled at each of the nine categories of level/selectivity of postsecondary destination that we consider. IPEDS, our primary data source, gives the count of students by race at nearly every postsecondary institution. Non-4-year colleges are classified by their level of offering (non-degree or 2-year), and we classify 4-year colleges by their admissions competitiveness as defined by the Barron’s Profile of American Colleges. To convert the count of students enrolled at each level to percentages of the total cohort, we use U.S. Census estimates of population size by race and age to calculate the total size of each race-ethnicity group that is of college-going age (which also allows us to calculate the percentage of each cohort that is not enrolled in any postsecondary destination). We describe these data in detail below.
IPEDS
The enrollment data in the IPEDS database are collected annually by the National Center for Education Statistics (NCES) from every college, university, and technical and vocational institution that participates in federal student financial aid programs. These data give enrollment rates by race from 1986 to 2014. Although IPEDS confers many important advantages that allow us to fill gaps in prior work, it also presents notable challenges. These include determining which students to include in our enrollment counts, unstable race categories, and a changing population of schools. We outline these concerns, and our approach to addressing them, in brief below and in detail in Appendix B. In short, each of the data complications does not appear to affect the magnitude or trend of our estimated gaps in any appreciable way.
Count of students in each postsecondary destination
Our main analyses focus on full- and part-time, first-time postsecondary students using IPEDS fall enrollment counts, which count first-time degree- or certificate-seeking students enrolled in the fall term. IPEDS did not include the “degree- or certificate-seeking” qualifier in its 2000 survey, so we drop this year from our analysis. By capturing only first-time students, we avoid double-counting students over time: If students were to transfer or stop out of college and then reenter, their enrollment would count in the population proportions of two cohorts of students. 3 By focusing on full- and part-time students, we avoid undercounting students in community colleges and less selective 4-year colleges, where part-time enrollment is more common. The trade-off to using all, rather than only full-time, students is the potential to double-count students who are enrolled at multiple institutions in their first term of attendance. We believe the prevalence of double enrollment is relatively small and find little change in our results when we repeat the analysis using only full-time students.
Institutions report the number of first-time students to IPEDS only in the fall. Because of this schedule, students who enroll for the first time in the spring semester are not counted in our primary data. If race groups first enroll in fall or spring at different rates, this could affect our estimated gaps. We address this concern by reestimating our gaps using 12-month enrollment counts (which include all students, not just first-time enrollees) and find only minor changes in the magnitude, but not trend, of our gaps.
Race groups
The race categories available in IPEDS are not constant across years. Between 2008 and 2010, IPEDS disaggregated Asians and Pacific Islanders and added a reporting category for students who self-identified as being a member of two or more race groups. During the transition period, institutions used either the original seven- or revised nine-category system, so we report gaps based on total Black, Hispanic, and White students reported in either system and indicate the lack of categorical clarity by a change of formatting in our figures. In Appendix B we bound the possible implications of the race category changes by reestimating gaps after recategorizing multiracial students to different race groups.
Population of colleges
Not all colleges are present in every year of IPEDS data. This irregularity is due to two main factors. First, some schools did not exist for all years—there were many new entrants to the postsecondary sector in this time, and some schools closed. We are not concerned with this issue because the opening and closing of schools, or even the expansion and contraction of enrollment at individual institutions, represent changes in the supply of enrollment opportunities and may be an important element of changes in enrollment selectivity gaps. Indeed, we know that there was expansion in the supply of seats in most sectors of higher education but greater expansion at 2-year colleges and “competitive” 4-year colleges over this time (Hurwitz & Kumar, 2015; Kelly, 2016). However, we cannot say whether these changes happened in response to student demand or whether students altered their enrollment choices to fill these newly created seats. More importantly, it is not clear that these capacity changes should differentially impact the enrollment choices of students by race or ethnicity.
A second concern about the irregular appearance of some institutions in the IPEDS data is that reporting to IPEDS was not mandatory for all institutions that are eligible to receive federal Title IV funds (the major source of federal student aid) until 1993 (Fuller, 2011). We indicate the potential incompleteness of this population with special formatting in our figures and find in Appendix B that the use of data from only institutions present in all years of data makes our gap estimates slightly larger.
Additionally, students who attend non–Title IV institutions are undercounted by IPEDS, as data reporting for these schools is voluntary (Cellini & Goldin, 2012). Non–Title IV institutions are predominantly non-degree-granting schools, and many are for profit. Undercounting students in these schools could bias our estimates of overall enrollment selectivity gaps, as these noncounted students would be attributed to the “no-college” category. However, as this sector enrolls a relatively small proportion of students, this bias should not dramatically affect our results. Additionally, this undercounting is less of a problem at more selective colleges, so this bias will be reduced when we condition our analyses on different levels of enrollment selectivity.
Although we cannot examine this issue directly using the IPEDS data, we investigate potential implications two ways. First, we measure enrollment selectivity gaps with and without for-profit schools. The differences between these two measures can give us a sense of the direction of the bias induced by undermeasurement of non–Title IV enrollment. Second, we compare gaps computed using the longitudinal NCES longitudinal data sets popular in earlier research. These data include the postsecondary destinations of all students in the sample, so undercounting enrollment at non–Title IV schools is minimized.
Census Population Estimates
To examine the proportion of each cohort that does not enroll in a postsecondary destination, we combined the IPEDS data with annual census population estimates to determine the size of the entire cohort of potential college students of each race-ethnicity group, regardless of their postsecondary enrollment status. We use the estimated population size of 18-year-olds—the age of the traditional 1st-year college student. Because of the increasingly varied age of students at their first college entry, the decision to use 18-year-olds as the cohort denominator could affect measures of enrollment selectivity gaps. In Appendix B, we demonstrate that neither the size nor trend of our gaps qualitatively change when we instead use an average of the size of the cohort of 18- to 24-year-olds as our denominator.
Barron’s Admissions Competitiveness Data
The selectivity ratings of colleges and universities come from Barron’s Profiles of American Colleges. Barron’s classifies 4-year colleges and universities on a scale from 1 to 6, where 1 is the most selective and 6 is the least selective. 4 These ratings are based on the high school grade point averages, high school class ranks, and SAT/ACT scores of enrolled students as well as on the proportion of applicants the schools admit. Although Barron’s ratings have changed over time, the discussion of our results uses the 2008 rankings so that the group of colleges in each selectivity category is constant. 5 We create separate categories for 2-year colleges and non-degree-granting postsecondary institutions, which Barron’s does not rate. Additionally, there are some (roughly 360) 4-year colleges that are not rated by Barron’s. In our main analyses, we impute these ratings using publicly available data. In Appendix B we demonstrate that our gap estimates do not qualitatively change when we drop these 4-year institutions that do not have Barron’s ratings rather than impute their selectivity .
Other Data Sources
We draw on data from numerous other sources to compare the trends we observe in college enrollment selectivity to gap trends in high school graduation, achievement, income, and parental education.
High school graduation
To examine gaps in high school graduation rates by race, we primarily use data collected by Murnane (2015). He uses data from Census 1990, Census 2000, American Community Survey 2010, and General Education Development (GED) Testing Service. These data, in combination, address concerns in calculations of graduation rates (such as differences in coverage, categorization of recent immigrants, and treatment of students who earn a GED) that are present in a number of data sources. These data include graduation rates by race for students who were 18 in 1986 to 2006.
We add data from the American Community Survey to track gaps in graduation rates for the 2007-to-2014 cohorts (Ruggles, Genadek, Goeken, Grover, & Sobek, 2016). In doing this, we replicated the procedure described by Murnane (2015), adjusting for GED recipients and recent immigrants.
Achievement gaps
Data on achievement gaps by race come from the National Assessment of Educational Progress (NAEP). The NAEP Long-Term Trend tests are administered roughly every 4 years in mathematics and reading to a nationally representative sample of 9-, 13-, and 17-year-old students. We use data from 13-year-olds (adjusted by 5 years to match age of college enrollment) because the composition of the older cohort might be biased by differential high school dropout rates by race.
Income
Data on income gaps by race come from the Current Population Survey (CPS) as aggregated in the Integrated Public Use Data Series (Flood, King, Ruggles, & Warren, 2016). Because the CPS surveys individuals living in households, we look at the income of the parents of 14- to 17-year-olds (before students have moved out to enroll in college) from 1984 to 2012 and apply those gap estimates to cohorts 2 years later, when those children could be enrolled in college. We use the seven income categories reported in the CPS (<$15,000, $15,000–$24,999, $25,000–$34,999, $35,000–$49,999, $50,000–$74,999, $75,000–$99,999, and >$100,000).
Parental education
Data on the parental education of college-age students also come from the CPS (Flood et al., 2016). As with income, we look at the education levels of the parents of 14- to 17-year-olds and apply those gap estimates to cohorts 2 years later, when those children could be enrolled in college.
Method
The Measurement of Gaps With Ordinal Data
We quantify the disparities in enrollment by race across nine ordinal categories of postsecondary enrollment by type and selectivity. Specifically, we categorize enrollments according to whether students are not enrolled in college, enrolled in a non-degree-granting college, enrolled in a 2-year college, or enrolled in any of the six Barron’s selectivity levels of 4-year colleges.
One useful measure to capture differences in the distribution of enrollments between two groups of students using ordinal data is to look at the probability that a student from group a is enrolled at a higher level than a student from group b (pa>b). An alternative to pa>b is the V statistic, a monotonic transformation of pa>b that expresses the difference in selectivity as the standardized difference between the mean enrollment selectivity of two groups (Cohen’s d) if the selectivity of colleges were transformed into a metric in which both groups’ enrollment selectivity pattern were normally distributed (Ho & Reardon, 2012; Reardon, Kalogrides, & Shores, 2016). We use pa>b in our analysis because of its relative ease of interpretability, but our results are largely unchanged if we use V. 6
The calculation of pa>b is intuitively illustrated with a probability-probability (PP) plot, which graphs the relative cumulative distribution functions of, for example, Black and White students enrolled at a given level of education or lower. The area under the curve of a PP plot gives the probability that a randomly chosen White student is enrolled in a postsecondary destination at a higher level of selectivity than a randomly chosen Black student (pw>b; Ho & Reardon, 2012). PP plots are analogous to the well-established method for graphically displaying income inequality, the Lorenz curve.
An example of the PP plot for Black and White student college enrollment in 2010 is given in Figure 1. Each point of the plot represents the percentage of students from each of the two race groups that is enrolled in a given level of postsecondary education or lower. Note that if Black and White students were equally represented at all levels of postsecondary education, the PP plot would trace a 45-degree line and the area under the curve would be 0.5. That is, there would be a 50% chance that a randomly chosen Black student would be enrolled in a lower level of selectivity than a randomly selected White student.
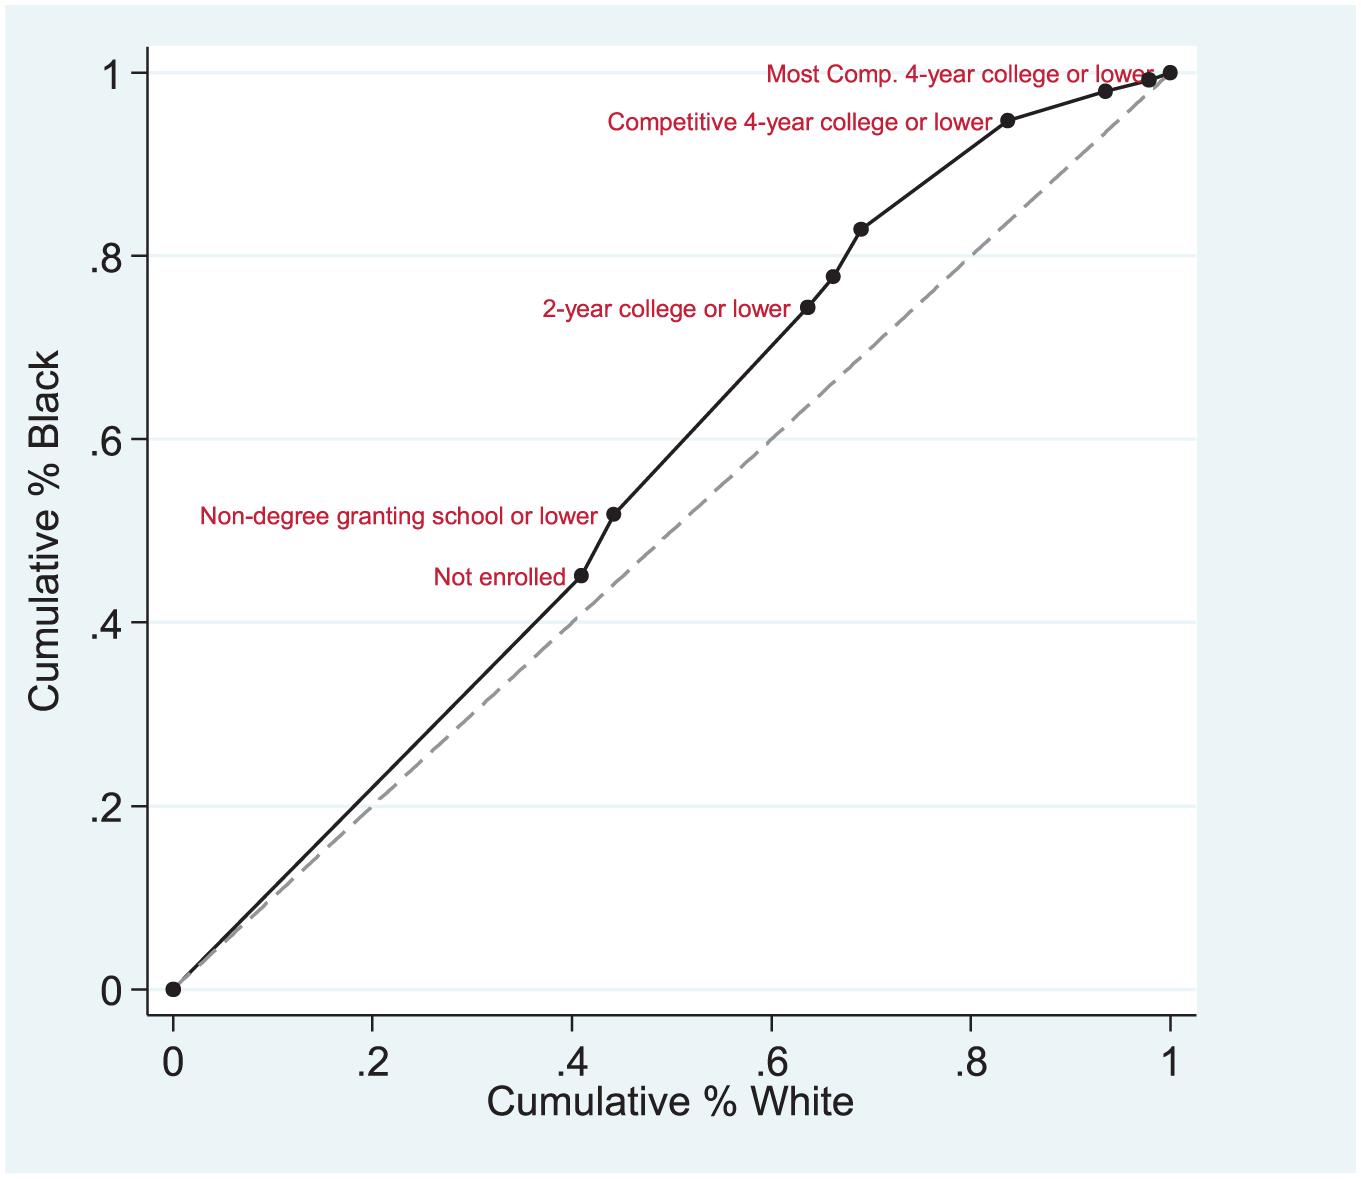
Probability-probability plot of Black–White postsecondary enrollment, 2010.
Although pa>b is equal to the area under a PP curve, and can be computed directly from these plots, in this paper we use the methods described in Ho and Reardon (2012) and Reardon and Ho (2015) to calculate V using maximum-likelihood methods and then transform V to pa>b according to the function

The calculation of V using the maximum-likelihood method fits a smooth curve through the points in the PP plot, which formalizes the assumption that there is some ordering of the two groups even within an ordinal category (which, in this case, is akin to assuming that there is some ranking of colleges even within a category). In contrast, directly computing the area under the curve from a PP plot assumes that all people in a given category are tied in the ranking of their colleges.
Thus pa>b is a single measure of college enrollment selectivity gaps between students from different race groups that accounts for differences in representation across ordinal categories of college level and selectivity. In fact, only this ordinal property is important for determining pa>b; it does not rely on any interval-scale properties of underlying college selectivity.
Conditional gaps
Additionally, we limit our analysis to students who attend a college above a given level of selectivity. Specifically, we examine enrollment selectivity gaps conditional on enrollment in (a) any postsecondary education (between 41% and 53% of all 18-year-olds in the years of study), (b) a degree-granting institution (between 41% and 50%), (c) a 4-year college (between 28% and 33%), and (d) a very competitive (Barron’s rating 3) college (between 12% and 14%). These analyses allow us to determine at which levels of college selectivity racial enrollment selectivity gaps are the largest or whether the trends differ by selectivity level. For example, small Black–White gaps for the entire population coupled with large Black–White gaps conditional on enrollment in a 4-year college would indicate that Black and White students are attending college at similar rates but that they are attending very different 4-year schools. 7
Concurrent Trends
We use three methods to compute racial gaps in concurrent trends (high school graduation, family income, parental education, and academic achievement). For data that are reported by category (e.g., income), we calculate pa>b according to the method above. For binary measures, we compute a standardized difference in means (akin to V) and then convert the result to probability units according to Equation (1), ensuring all gaps are on the same scale. We accomplish this either by direct calculation (for graduation rates) or by estimating a probit regression of the outcome variable controlling only for indicators of race, omitting the indicator for White students (for parental education). The coefficients on each race-ethnicity indicator give the gap in parental education. Finally, for continuous data (NAEP scores), we compute a standardized difference in group means, which we also convert to probability units according to Equation (1).
We calculate bivariate correlations between each of these concurrent gaps and our enrollment selectivity gaps (both the overall gap and each of the enrollment selectivity gaps conditional on given levels of enrollment). These correlations provide simple evidence of how changes in college enrollment selectivity gaps might be related to changes in gaps in precollege measures. Because of the small number of time points we observe each gap, we use α = .1 to assess statistical significance of these correlations.
Although these simple correlations provide a sense of which gaps tend to trend together, they could be misleading; they do not account for the correlation between various concurrent trends (for example, income gaps are likely related to both test score gaps and enrollment selectivity gaps), and they do not account for potentially spurious correlations because of underlying time trends (Granger & Newbold, 1974). To address these concerns, we also examine these relationships using more-robust methods that allow us to make explicit assumptions about which time series trends are related to each other. Specifically, we use structural vector autoregression (SVAR; Sims, 1980) to predict enrollment selectivity gaps using all other concurrent trends, lagged versions of these trends, and the lagged dependent variable. Our data greatly limit our ability to make robust conclusions from these analyses (namely, we have measured test gaps for only 11 of the 28 years, reducing our already limited power), so we briefly discuss where the results from these models align with our bivariate correlations in the Results section and present the full set of results in Appendix C. Whether interpreting our correlations or the SVAR analyses, the results should be taken as descriptive rather than causal.
Results
Enrollment Selectivity Gaps
Figure 2 gives the change in college enrollment selectivity gaps from 1986 to 2014 for both Black and Hispanic students relative to White students. This figure accounts for all possible postsecondary destinations, including not enrolling in any further education. With some variation, both Black and Hispanic students have seen their overall college enrollment selectivity gaps shrink relative to White students (recall that gaps closer to a probability of 0.50 indicate greater parity between race groups). The Black–White gap has shrunk from pw>b = .66 to .53. That is, in 1986 there was a 66% chance that a randomly chosen White student was in a higher selectivity postsecondary destination than a randomly chosen Black student. In 2014 this had dropped to a 53% chance, indicating that postsecondary destinations for these groups have been increasingly similar over this period. Over the same time period, the Hispanic–White gap shrunk from pw>h = .72 to .58. White students on average still attend more selective institutions, particularly relative to Hispanic students.
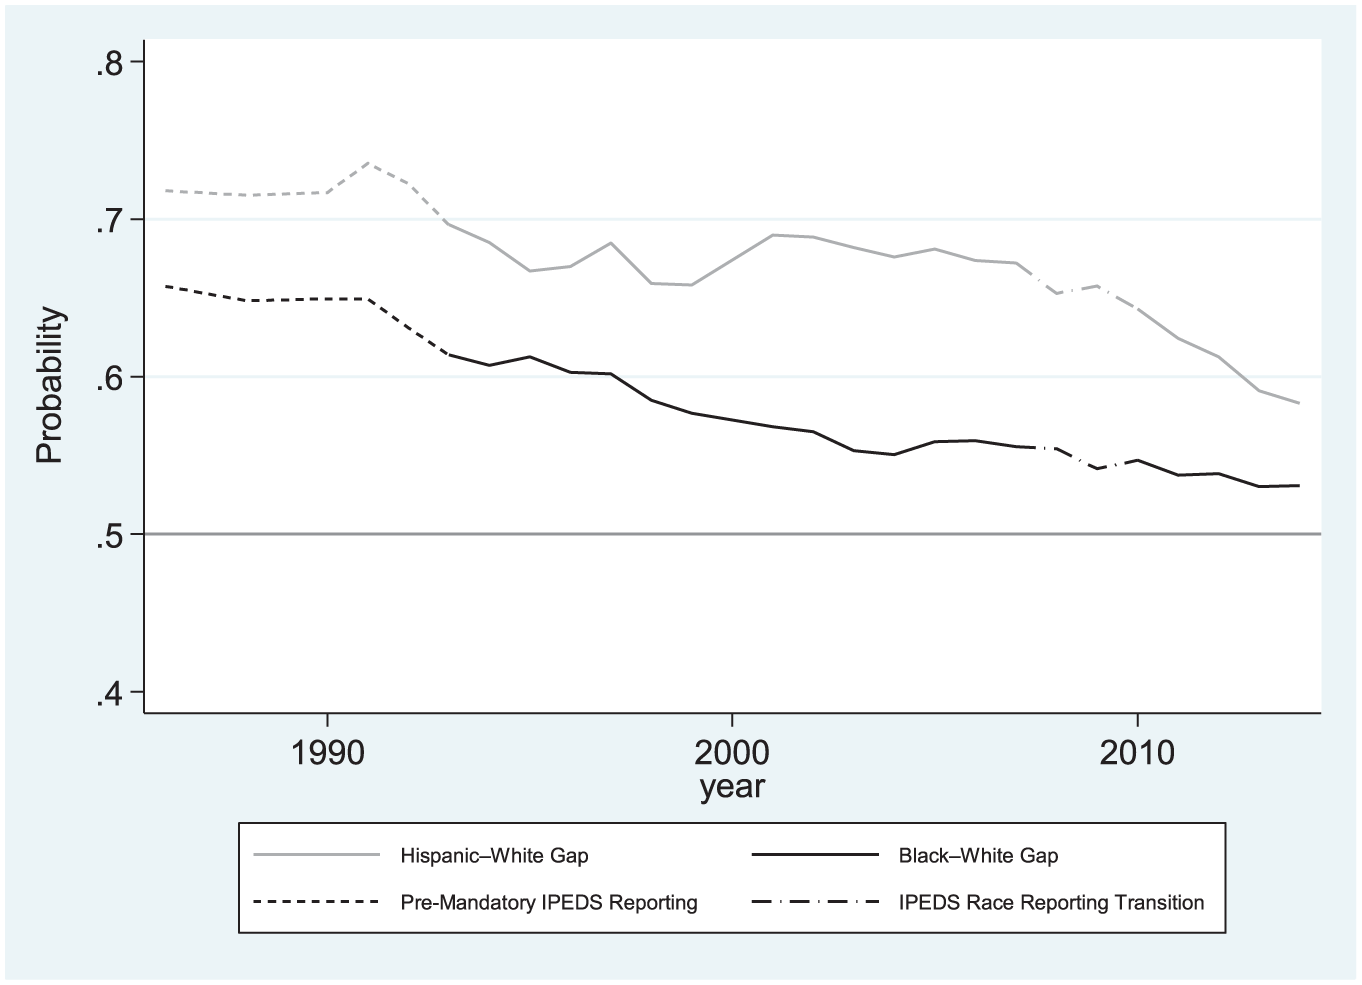
Black–White and Hispanic–White postsecondary enrollment selectivity gaps.
The story of an overall decrease in college enrollment selectivity gaps for Black and Hispanic students shifts when we examine gaps that are conditional on enrollment at specified levels (for example, gaps among students enrolled in 4-year colleges). This change is seen in Figures 3 and 4, which give, respectively, the Black–White and Hispanic–White college enrollment selectivity gaps over time using only (a) students enrolled in any postsecondary destination, (b) students enrolled in a degree-granting college, (c) students enrolled in 4-year colleges, and (d) students enrolled in very selective colleges.

Black–White postsecondary enrollment selectivity gaps, conditional enrollment at specified levels, 1986 to 2014.

Hispanic–White postsecondary enrollment selectivity gaps, conditional on enrollment at specified levels, 1986 to 2014.
First, in Figure 3 (Black–White gaps), enrollment selectivity gaps conditional on attending any postsecondary institution have grown over time; among students enrolled in any postsecondary destination, the probability that a randomly chosen White student is attending a higher-selectivity postsecondary destination than a randomly chosen Black student has increased. This contrast from the decrease in gaps seen in Figure 2 appears to be a consequence of the only population of students in Figure 2 not included in Figure 3: students not enrolled in college. In other words, it appears that nearly all the relative gains in Black postsecondary enrollment have occurred at the margin of attendance.
We see a similar marginal enrollment story when we condition on enrollment in a degree-granting institution. As recently as 1990, the enrollment selectivity gap between Black and White students in this group was essentially zero (pw>b = .50). Since then, however, this gap has grown to where pw>b is nearly .61. The fact that the Black–White gap among students attending degree-granting schools is consistently smaller than the gap among students attending any postsecondary institution (including certificate programs) is a sign that Black students are increasingly more likely than White students to enroll in non-degree-granting programs and that Black and White students are likely enroll in 2-year colleges at similar rates to each other. Indeed, in 1990, among all White students enrolled in any postsecondary institution, 3.6% attended a non-degree-granting school. This had increased to 5.6% by 2010. The corresponding increase was much sharper for Black students; in 1990, 5.6% of all Black college students attended a non-degree-granting institution, and by 2010, this had increased to over 11%. 8
Black–White enrollment selectivity gaps conditional on 4-year college attendance are the largest of the gaps we examine. This gap has hovered with pw>b around .64 for the past 30 years. Enrollment selectivity gaps have been similarly stable at the most selective colleges (Barron’s ratings 1–3) but very small, with pw>b close to .50. However, it should be emphasized that this final gap is calculated using the relatively few Black students who enroll in these schools at all.
Figure 4 gives the analogous trends for the Hispanic–White gaps. These trends tell a different story. Like Black students, Hispanic students saw a relative minimum in their enrollment selectivity gaps relative to White students in the early 1990s, but over the nearly 30 years covered by the figure, their enrollment selectivity gap with White students has remained broadly unchanged, no matter which subset of students we examine. Unlike with the Black–White gaps, the largest gaps are among the populations that include non-degree enrollment and enrollment at 2-year colleges. This consistently large gap is an indication that although Hispanic students are attending college at rates that are increasingly similar to White students, they are attending less selective schools, including non-degree-granting programs and 2-year schools, at much higher rates.
Enrollment selectivity gaps between Hispanic and White students are smallest among 4-year college enrollees. These gaps are much smaller than Black–White gaps among 4-year enrollees. This indicates that Hispanic students who enroll in 4-year colleges are distributed more like White students across levels of selectivity than Black students are.
Conditional on attendance at the most selective colleges (Barron’s ratings 1–3), Hispanic students enroll at more-selective colleges than White students, although this gap has shrunk over the past 30 years. This is in contrast to Black students enrolled in the most selective colleges, who attend schools that are of similar selectivity to White students. However, it should again be emphasized that this gap is calculated using the relatively few Hispanic students who enroll in these schools at all.
College Enrollment Selectivity Gaps and Concurrent Trends
To identify macrolevel trends in gaps of precollege measures that covary with enrollment selectivity gap trends, we compare the enrollment selectivity gap trends to concurrent trends in gaps in high school graduation, achievement, family income, and parental education using correlational analyses. The graphical presentations of these overall gaps in selectivity of enrollment, gaps in selectivity of enrollment conditional on 4-year enrollment, and concurrent gaps (all presented as pw>b/h) are found in line graphs in Figures 5 and 6 for Black–White and Hispanic–White gaps, respectively, and the bivariate correlations are found in Table 1. Note in Figures 5 and 6 that nearly all the concurrent gaps (except graduation) are larger than the enrollment selectivity gaps. This pattern suggests that despite persistent college enrollment selectivity gaps, these gaps are in fact narrower than at other points in students’ life course.

Black–White postsecondary enrollment selectivity gap compared to other gaps, 1986 to 2014.

Hispanic–White postsecondary enrollment selectivity gap compared to other gaps, 1986 to 2014.
Correlations Between Postsecondary Enrollment Selectivity Gaps and Other Concurrent Gaps, by Race-Ethnicity

p < .1.
One common pattern among these results is that estimated relationships (using both bivariate correlations and the more sophisticated SVAR models) tend to flip signs between overall gaps and conditional gaps. This is expected, given that overall gaps in enrollment selectivity are decreasing but that nearly every gap that conditions on a minimum level of enrollment is increasing.
In our bivariate correlation analysis, Black–White high school graduation gaps are significantly correlated with overall enrollment selectivity gaps (r = .449) and enrollment selectivity gaps conditional on enrollment in selective 4-year colleges (r = –.389). These correlations appear mostly driven by the shrinking graduation gaps in the late 1990s and between 2005 and 2010 (Figure 5). The SVAR analysis provides some support for the relationship between graduation gaps and enrollment selectivity gaps. As shown in Appendix Table C1, we find a significant, positive relationship between Black–White high school graduation gaps and overall selectivity gaps and a significant negative relationship between graduation gaps and enrollment selectivity gaps conditional on enrollment in a 4-year college. The estimate of this relationship is larger for enrollment selectivity gaps conditional on selective college enrollment; however, this relationship does not reach conventional levels of significance.
The correlational analysis also indicates a negative relationship between Black–White gaps in whether students’ parents went to college and enrollment selectivity gaps conditional on enrollment at a selective college. The SVAR confirms this relationship between these two variables with respect to enrollment selectivity gaps conditional on enrollment at a 4-year college; however, it suggests a positive relationship between parental education gaps and enrollment selectivity gaps conditional on enrollment at a selective college, indicating there may be a complicated relationship between gap trends that is not captured in our correlational analysis.
Trends in Hispanic–White enrollment selectivity gaps and concurrent gaps are shown in Figure 6 with the bivariate correlations between gaps in Table 1. Here we see two sets of statistically notable correlations: (a) a negative correlation between high school graduation gaps and enrollment selectivity gaps among those students who attend a 4-year college and a positive relationship between high school graduation gaps and overall Hispanic–White selectivity gaps and (b) a negative correlation between gaps in parental college enrollment and overall enrollment selectivity gaps. The graduation gap correlations are also present in both the overall and the conditional SVAR results. As with the Black–White gaps, the SVAR results also indicate a relationship between parental college gaps and enrollment selectivity gaps, but the story is more consistent—larger Hispanic–White gaps in terms of the proportion of students whose parents have a college education are associated with larger enrollment selectivity gaps both overall and conditional on enrollment in a selective college.
Estimates from the SVAR models also suggest a positive relationship between income gaps and both overall enrollment gaps (for Black students) and gaps at selective college admissions (for Hispanic students). Although not apparent in the correlation analysis, this relationship goes in expected direction in that larger income gaps are associated with larger enrollment gaps.
Conclusion
A growing body of evidence supports the fact that a student’s likelihood of graduation as well as his or her long-term economic outcomes is determined not just by whether he or she enrolls in college but where. Because of this connection between the level and selectivity of postsecondary enrollment and issues of economic equity, we present a comprehensive way of measuring college enrollment selectivity gaps that is sensitive to these important distinctions in postsecondary destinations. This approach improves on earlier methods of measuring enrollment gaps that could look at only one type of enrollment at a time.
In short, we find that overall Black–White and Hispanic–White gaps in college enrollment selectivity shrunk considerably between 1986 and 2014, but White students still attend, on average, more-selective postsecondary destinations than their Black and Hispanic peers. On their face, these narrowing gaps are encouraging, particularly since it appears that shrinking enrollment selectivity gaps are related to shrinking high school graduation gaps; efforts to improve high school graduation rates may have longer-term benefits in terms of opening access to postsecondary education.
However, this rosy view of closing enrollment selectivity gaps is tempered by our finding that the closing of gaps for both Black and Hispanic students appears to be driven entirely by more of these students making the choice to enroll in non-degree-granting postsecondary programs rather than not enroll in college at all. Indeed, once we remove these marginal postsecondary enrollees from our analysis, over the past three decades, enrollment selectivity gaps have been consistently growing for Black students and growing, albeit more gradually, for Hispanic students. Thus, although closing graduation gaps may be associated with greater access to postsecondary education for Black and Hispanic students, these gains appear to be reflected only in marginal enrollment choices, and Black and Hispanic students are still falling behind their White peers in the rate at which they are able to access more-selective levels of higher education.
Of the traditionally underrepresented students who successfully enroll at the most-selective colleges, Black students do so at selectivity levels similar to, and Hispanic students, greater than, their White peers. However, this finding obscures the fact that not many Black and Hispanic students enroll at these levels at all (Posselt et al., 2012; Reardon et al., 2012). Indeed, in 2014, 6%, 7%, and 18% of Black, Hispanic, and White students were enrolled in these colleges, respectively.
Often, successful graduation from high school is all that is needed to access the majority of postsecondary options in the United States—those institutions that are essentially open access. Thus, it seems intuitive that the closing of Black–White high school graduation gaps is associated with closing of overall enrollment selectivity gaps. However, the rest of our findings about the relationship between graduation gaps and enrollment selectivity gaps do not provide such easy explanations. Indeed, the relationship between Black–White high school graduation gaps and enrollment selectivity gaps conditional on various levels of college attendance suggests that the closing of graduation gaps has been accompanied by an increasing advantage of White students over Black students in terms of their postsecondary destinations. The same story is true for Hispanic and White students. Thus, we may be demonstrating evidence of effectively maintained inequality (Lucas, 2001)—as the competition for seats at open-access institutions has become more even, White students appear to be marshaling other resources to preserve their enrollment selectivity advantage.
This explanation may also result from another trend that we do not explicitly address in this article: The early 1990s represented a low point in the size of the college-age population, but by 2010, the college-age population reached a relative peak. This population growth means that, over the course of most of our analysis, competition for seats in college was increasing. Although the supply of enrollment options increased as well, most of this expansion happened in the 2- rather than the 4-year sector (Kelly, 2016). Our enrollment selectivity gaps are consistent with a story in which there has been an absolute increase in access to postsecondary education for all groups but little relative change in access to different levels of selectivity—privileged groups stay one step ahead.
We also want to highlight that Black and Hispanic students do not appear to be following the same path in terms of enrollment selectivity gaps, either in terms of the relative magnitude of their gaps with White students or in the rate at which the gaps are changing. Neither do the potential explanatory gaps appear to be related to enrollment selectivity gaps in the same way for these two race groups. For example, although there is alignment in terms of the general findings about the relationship between graduation gaps and enrollment selectivity gaps, the Black and Hispanic stories diverge with respect to the relationship between gaps in whether students have parents who attended college and enrollment selectivity gaps. Here, our evidence points to a minimal, and perhaps negative, relationship between these two gaps for Black students, whereas it leans positive for Hispanic students, particularly at more-selective colleges, when we add the additional controls of the SVAR models. Thus, college attendance for Black parents does not appear to convey the same field-leveling benefits in terms of their children’s higher education as it does for Hispanic parents. This perspective on the differing intergenerational returns to higher education adds more evidence to research that has described the value of parental educational attainment for Latino families (Ovink & Kalogrides, 2015) and its weakness for Black families relative to White families (D. Long, Kelly, & Gamoran, 2010).
Gaps in college enrollment selectivity have important implications for equity and career outcomes. Measuring these gaps in a way that reflects the diversity of postsecondary options creates a valuable metric that allows us to judge whether reform efforts are leading us toward greater educational parity. Our efforts to document the relationships between academic and socioeconomic gaps and enrollment selectivity gaps should support the development of new research on policies that are targeted at increasing equity in educational outcomes.
Footnotes
Appendix A
Appendix B
Appendix C
Acknowledgements
This work benefited greatly from the thoughtful feedback of the faculty and students at Stanford University’s Center for Education Policy Analysis. Rachel Baker received support from the Stanford Predoctoral Training Program in Quantitative Education Policy Research, funded by the Institute of Education Sciences (IES Award R305B090016). The opinions expressed here do not represent those of the funding agencies. All errors are our responsibility.
Notes
Authors
RACHEL BAKER is an assistant professor of education at the University of California-Irvine’s School of Education. She studies how state and institutional policies affect persistence and equity in higher education.
DANIEL KLASIK is an assistant professor of higher education policy at the Graduate School of Education and Human Development at George Washington University. His research uses a wide variety of quantitative methods to study student pathways into and through postsecondary education.
SEAN F. REARDON is a professor of poverty and inequality in education and professor (by courtesy) of sociology at Stanford University. His research focuses on the causes, patterns, trends, and consequences of social and educational inequality, the effects of educational policy on educational and social inequality, and applied statistical methods for educational research.