
Abstract
Success in the first year of higher education is important for students’ retention beyond their first year and for completion of their undergraduate degree. Institutions therefore typically front-load resources and interventions in the first year. One such intervention is the Peer Assisted Study Sessions (PASS) program. This program is known in the United States as Supplemental Instruction. It provides first-year students with an opportunity to learn study skills in the context of a particular unit of study (course/module). In this article, we consider the relationship between students’ prior academic achievement and participation in the PASS program, as well as the impact of participation on first-year students’ first-year grade point average, retention, and degree completion. The findings suggest that PASS does not just attract academically high-achieving students and that participation in it contributes to students’ academic achievement in their first year, retention beyond the first year, and completion of an undergraduate degree.
The importance of the first year in higher education has long been recognized as being vital for students’ ultimate success in attaining degree completion (Kift, Nelson, & Clarke, 2010; Krause, Hartley, James, & McInnis, 2005; Nelson, Clarke, Kift, & Creagh, 2011; Tinto, 2007; Tinto & Pusser, 2006). Many factors contribute to retention and attrition during or after the first year. These factors include issues both social and academic. For students, an academic transition is often marred by difficulty in understanding what is expected of them and what the differences are between high school and university (van der Meer, 2012; van der Meer, Jansen, & Toorenbeek, 2010). Although these differences may vary as a function of different school systems, university systems, entrance selection, or student characteristics, there is a general appreciation that most students have to orient themselves to a new environment (Jansen & Bruinsma, 2005; Jansen & van der Meer, 2007a, 2007b; van der Meer & Jansen, 2008). This is evidenced by the great variety of social and academic orientation and intervention programs that operate in most parts of the world.
Although there is a great variety of these programs, some have migrated across the world and been implemented in different countries (sometimes with minor variations) irrespective of differences in school and university systems.
Supplemental Instruction
Supplemental instruction (SI) is one of the more widely known programs that is implemented in many universities in the United States. The popularity of which is due to its proven contribution to student achievement (Arendale, 1994; Martin & Arendale, 1992a, 1992b, 1992c, 1992d, 1994). The SI program—developed in the early 1970s in the United States to combat the attrition of first-year students—was initially focused on the attrition of African American students in the health sciences (Blanc, DeBuhr, & Martin, 1983; Arendale, 1997; Martin, 1983; Martin & Arendale, 1992a, 1992d). The essence of the program is the facilitation of study sessions by upper-year students in units of study with high failure rates. These study sessions are not aimed a reteaching of content but helping first-year students to become familiar with the university learning environment. This is done through the development of study skills in the context of a particular discipline and the unit of study to which SI is attached. As the student facilitators (or SI leaders) have recently completed the same unit of study, they have a good appreciation of the challenges that students may face with the academic content as well as what it is like to be a first-year student. SI leaders typically receive substantial training to ensure that they use collaborative and active learning approaches to support students in developing new skills and habits. A major focus of the training is to ensure that facilitators refrain from reteaching content. SI facilitators as well as SI program coordinators are trained drawing on material provided by U.S. and regional SI centers. This is aimed at ensuring a degree of “fidelity” with regard to how SI is implemented. Furthermore, SI facilitators receive regular monitoring visits to ensure quality and fidelity to the program ethos and design.
SI is a voluntary program to which students typically sign up within the first 2 weeks of a semester. Marketing of the program to students typically involves emphasizing the voluntary and mainstream nature of the program that benefits all students and presenting evidence that participation typically results in better academic outcomes. As all students are encouraged to sign up in the first 2 weeks and to attend all sessions, the program is not perceived to be remedial and to serve only less capable students (at the point when they realize that they are struggling).
The theoretical framework of the SI program was conceptualized by its developers as being the opposite of a reactive “medical model” fix-it support program, whereby only failing or struggling students partake in the “intervention.” SI is a proactive nonremedial universal nonstigmatizing social and academic induction-focused program (Arendale, 1993). The emphasis is on difficult courses, not failing students; in other words, it is aimed at all students enrolled in difficult courses. Its success has been attributed to this focus on its being nonremedial and its being student led; students appreciate the absence of a power differential and the ease of being able to engage with the peer facilitator (van der Meer & Scott, 2009). Arendale (1993) provided a good overview of the theoretical foundations of SI. In surveying key aspect of the SI program, he identified the range of theoretical ideas that have informed the overall theoretical framework of the program, including constructivism (drawing on Piaget and Vygotsky), Dale’s “cone of experience,” Tinto’s model of students’ social and academic integration, and theories related to students’ development of metacognitive and collaborative learning capabilities.
Apart from benefiting academic results, it also supports students’ transition and integration into academia and development of social capital (Holland, 2010; Toews & Yazedjian, 2007). We define “social capital” as a complex of interinterpersonal networks that provide students with friendships, peer support, and information that support the development of productive information- and help-seeking behavior. We concur with Holland (2010) that intentional development of social capital is important to support the academic achievement and retention of students from ethnic minorities and low socioeconomic backgrounds and those with English as an additional language.
Before funding this program across the country, the U.S. Department of Education subjected the program to rigorous evaluation regarding its effectiveness in achieving its intended goals. This resulted in a validation of the claims that SI is effective in achieving higher academic results and pass rates irrespective of prior ability and ethnicity (Arendale, 1993, 1994). The International Center for Supplemental Instruction was set up at the University of Kansas–Missouri, where the program originated. This center plays a national role in the accreditation and training of SI coordinators and programs, as well as an international role in accrediting other national centers, as in Australasia.
Whereas the program was originally developed in the United States, the massification of higher education in the 1980s and 1990s across the Western world prompted an interest in other countries for programs that would enhance students’ transition into higher education. Massification generally resulted in more diverse student populations entering higher education, such as students from minority ethnic backgrounds and low socioeconomic backgrounds (Scott, 1995). As many students from these groups were the first in their family to go to university, they had greater challenges in making sense of what was expected of them and how to succeed. This resulted in higher attrition rates for these groups. As a consequence of universities across the world looking for programs to support diverse students and reduce attrition rates, from the mid-1990s the SI program started to be introduced in the United Kingdom, Sweden, South Africa, Australia, and New Zealand. The name “Supplemental Instruction” was considered confusing and not self-explanatory in countries other than the United States. Hence, the name Peer Assisted Study Sessions (PASS) program was coined. In Australia, PASS programs are now operating in 38 of the 40 universities. A center for PASS at the University of Wollongong was accredited by The International Center for Supplemental Instruction to organize accreditation and training for the Australasian and Pacific region. Since about 2005, a number of New Zealand universities started to explore PASS. The university in this study started its pilot in 2008 and is now providing PASS in a range of subjects. Development of the program is ongoing.
SI/PASS Research
Despite its longevity and the amount of research into this program, doubts have been expressed about the effectiveness of the intervention for all students. The authors of a recent systematic review of SI/PASS (Dawson, van der Meer, Skalicky, & Cowley, 2014) highlighted the various reasons for such skepticism. One of these is the issue of self-selection. As the essence of the program is its voluntary nature, the assumption is often made that motivated and academically able students are more likely to enroll than students who are academically less able, who might more benefit from participation.
As a consequence of critique regarding self-selection by more able students, a number of researchers into the effectiveness of PASS have sought to report on or control for high school achievement results or entry scores (Dawson et al., 2014). These results and measures, of course, vary from country to country. Most of the current research comes from the United States. To our knowledge, no study has yet sought to include New Zealand high school achievement data. This study therefore aims to contribute to the research into SI/PASS effectiveness by seeking to control for prior academic performance by using New Zealand high school achievement data. In New Zealand, students’ achievement in their final year of high school determines their direct entry into universities and, when successful, results in the New Zealand Certificate of Educational Achievement (NCEA) university entrance qualification. Throughout their last year, students accumulate credits through internal assessment tasks as well as exams (these tasks/exams are referred to as NCEA Achievement Standards).
SI/PASS research in the university of this study commenced shortly after the pilot. PASS was introduced at this university in 2008 in the School of Business. As students who were enrolled in a bachelor of commerce degree were required to complete a range of compulsory units of study, these units were considered high stakes for progression into the degree; some had high failure rates and repeat numbers. Since 2009, PASS was also introduced in a number of other compulsory high-stakes health science units of study. Not all first-year students during that period therefore had equal access to PASS as the program was in development.
Focus of this Study
To develop a greater understanding of the relationship between students’ participation in PASS and their prior academic performance, as well as their performance at university as a consequence of PASS participation, we used data from three first-year entry cohorts (2009–2011). The rationale for these three cohorts was that they would also allow us to look at degree completion figures within 6 years after students started their first year. To meaningfully consider completion data, we chose a period of 6 years so that part-time students could be included as well as students who took double degrees or studied medicine.
To contribute to the extant evidence base of SI/PASS programs across the globe in terms of controlling for self-selection, this study is based on a quasi-experimental design, with high school academic performance as proxy for academic ability. Controlling for students’ academic performance at point of entry to the university, however, does not account for self-selection based on motivation. Some studies attempted to address this as well (Dawson et al., 2014). Regarding the evolutionary stage of the program in our institution, our present concern is to provide evidence that ensures that the SI/PASS is seen as a program that serves students with a range of backgrounds and therefore deserves ongoing funding. However, we anticipate addressing this in future studies in our institution as well so that we can attract an even wider range of students into the program.
Apart from analyses for the three whole cohorts of commencing first-year students, separate analyses were performed for three different groups identified as equity groups—namely, Māori, Pacific Island, and students who do not live in a residential college. With regard to Māori and Pacific Island students, the New Zealand Ministry of Education (2014) set goals for their “participating and achieving at all levels on a par with other students in tertiary education.” This is the rationale to include in our analyses Māori and Pacific Island students’ first-year achievements in relation to the PASS program and establish whether the program contributed to their success in the first year to a similar degree or better than that for the whole cohort. With regard to the third group, in this university, between 60% and 75% of first-year students live in a residential college for their first year, which provides a living/learning environment with academic support. As such, these students receive more support than students who do not live in a residential college. For that reason, we analyzed whether the PASS program contributed to first-year achievement of nonresidential college students to the same level or better as the overall cohort.
Although the focus is on the relationship among SI/PASS participation, prior academic achievement, and academic outcomes, we are aware that other factors might influence students’ academic success and/or PASS participation. As this is not an experimental study, to explore other possible factors, we sought to include in the various regression analyses variables that could affect the outcome variables. We were limited in this by the available data that we could access. From the student administration database, we extracted various demographic variables, such as gender, age, and English as an additional language. We also accessed the data of the New Zealand schools that students attended, including type (single sex or coeducational), proxy indicator for socioeconomic status (decile of New Zealand schools), and size of the school.
Apart from addressing the issue of self-selection, another focus of the study was to assess the impact of PASS participation on students’ overall academic success, which we sought to measure in terms of PASS attendees’ academic performance in the first year (relative to other students), their retention beyond first year, and their degree completion. Concerning assessment of the impact of SI/PASS participation on first-year grade point average (GPA), for this study, we are using the total number of sessions attended by students in their first year of studies across multiple units of study/modules. In most research, the effect of PASS participation is measured by assessing the relationship between number of sessions attended and final mark for a particular unit of study. This “dose-response effect” typically shows a strong relationship (Dawson et al., 2014). Most students in this study (75%) enrolled in PASS for only one of their units and 16% for two units. Measuring the impact of the attendance level, not just on the unit of study concerned, but also on the whole of students’ first-year performance is our contribution to the research into this area, as this has not been measured in many studies. This means that it cannot be expected that the impact will be as strong as when assessed in the context of just the unit of study for which the students were enrolled. However, the purpose of SI/PASS programs is not just about absolute academic performance (as measured in marks/grades) but also about support for first-year students’ academic and social integration. This integration is considered vital for student retention and consequent degree completion, as argued by Tinto in his seminal work in the 1970s and many others since him (Braxton, Milem, & Sullivan, 2000; Draper, 2002; McGinty, 1990; Synco, 2012; Tinto, 1975, 2000, 2006; Tinto & Goodsell, 1994; Tinto & Pusser, 2006). Therefore, we consider even a modest effect of SI/PASS on first-year academic performance, in combination with an impact on retention and degree completion, to be a good overall measure of the impact of the SI/PASS program on overall students’ academic success.
In summary, the key questions that we sought to answer were as follows:
Does students’ prior academic achievement affect their decision to participate in the SI/PASS program as well as their performance in the first year?
To what degree do SI/PASS participation and prior academic achievement have an effect on overall student success, as measured by the first-year GPA, retention beyond the first year, and degree completion within 6 years?
To what degree did participation in PASS in the first year contribute to the first-year academic achievement of three equity groups relevant for the context of the university of this study: Māori students, Pacific Island students, and students who do not live in one of the residential colleges?
Even though this study reports on findings from a New Zealand university, its findings have relevance to SI/PASS programs elsewhere in the world. All universities that have implemented SI/PASS programs are linked to regional SI/PASS centers and, through those, to the U.S. International Center for Supplemental Instruction. Consequently, there is a great degree of uniformity in the application of the program across the globe. All SI/PASS coordinators receive training through those centers and ensure that the fundamental principles of the programs, as described, are adhered to.
Method
Data were extracted from the university’s student administration database for all students who enrolled for the first time at the university in the 2009–2011 period. Students were deselected for further analysis if they were not enrolled in an undergraduate bachelor program, if they had an admission status of “graduate entry,” if they entered with transfer credits from another university, or if their previous occupation was self-reported as “university student.” Also, returning students who may have repeated their first year were excluded. Deselecting these students ensured that those who were included were “true” first-year undergraduate students.
In a separate exercise, NCEA data for the 2009–2011 period were extracted for those students whose National Student Numbers matched those for first-year students for that period. The separate records for each NCEA Achievement Standard were reformatted into single records for each student enrolled at our university. The credits for each standard were multiplied by a weighting factor based on attainment: 0 for not achieved, 2 for achieved, 3 for merit 3, and 4 for excellence. All weighted credits were then summed. This measure combined quantity and attainment level in the “weighted NCEA” score, which was used in our analyses. This data file was then matched and merged with the student administration data file.
Not all students enter New Zealand universities through the NCEA pathway. Other pathways include International Baccalaureate, Cambridge, and a range of other overseas qualifications. Furthermore, New Zealand students >20 years old can be admitted under the Special Admission pathway. For most analyses, students other than those coming through NCEA were excluded. For some analyses, we did not use the weighted NCEA score but created dummy variables for different entry pathways. The use of these dummy variables allowed us to use the greater data set for some analyses.
To identify and control for other school-related characteristics, such as the type of school and decile rating (which is considered a proxy for the socioeconomic background of students and schools), we matched our data with school information data from the New Zealand Ministry of Education as recorded in 2008.
Last, attendance data collected from the PASS coordinator for each participant were merged into this file. Rather than just using a binary indicator of PASS/not PASS, the number of PASS sessions that students had attended was used; typically, students were able to attend up to 12 sessions for each subject and in some cases 13 sessions, where an extra session was added directly prior to exams. If students attended PASS for more than one unit of study, the attendance numbers were summed. For students who did not attend any sessions, this field was set to zero. For some analyses, such as regression analyses, we used the total number of PASS sessions attended (including zero). However, in an analysis of variance (ANOVA) to determine if attending PASS resulted in cumulative benefits, we banded the number of PASS sessions into 5 bands: 0, 1–3, 4–7, 8–13, and >13 sessions attended. These bands are based on data that have been gathered over the years at our institution as well as in other SI/PASS research (Dawson et al., 2014) that suggest that students who attend more sessions perform better. These bands have been reported to reflect more or less the different patterns of attendance (in one unit of study)— from minimal to regular and nearly all available sessions. However, they are not absolute and serve only the purpose of making the results easier to interpret.
We considered the impact of PASS attendance and NCEA on completion of at least one degree within 6 years in two ways: (a) through a simple comparison in percentages for PASS attendance and completion percentages and (b) through a logistic regression, including, as the binary variable, PASS attendance and NCEA with completion of at least one program within 6 years. As we wanted to include students who may have studied part-time, took a double degree, or studied medicine, we considered 6 years a good period. Although some students were still studying without having completed a degree after 6 years because of their part-time status, (n = 231, 2% of total cohort), we decided to include them because we wanted the cohort to be as complete as possible. The results are therefore not to be read as absolute figures.
Statistical analyses based on SPSS 22 (IBM, Chicago, IL) were then performed on the data, including descriptive analysis, ANOVA, multiple regression, and binary logistic regression. For all regression analyses in this study, we used the adjusted R2 measure to mitigate any overfitting of predictors; only these are reported.
Findings
Data Sources
Table 1 shows the results of the process of data extraction and matching of the different data sources.
Number of Students in the Different Data Sources by Year

Note. NCEA = New Zealand Certificate of Educational Achievement; GPA = grade point average.
Table 2 shows the number and percentages of the different groups of interest for this study.
Number (Percentages) of Students in Different Groups

Percentage within group. b8% vs. 12% college students. c11% vs. 11% non-Māori. d10% vs. 11% non–Pacific Island.
Impact of Prior Education on PASS Participation
To ascertain whether students who entered university with “better” qualification or higher scores were more likely to attend PASS sessions, we performed the following analyses: (a) an ANOVA with first-year students’ weighted NCEA credits as an independent variable and with the number of PASS sessions attended (banded in different ranges) as the dependent variable and (b) multiple regression with total number of PASS sessions attended as the outcome variable and with a number of possible predictors related to students’ former schools (i.e., before attending our university), their demographics, and their weighted NCEA scores.
There were some differences among attendance groups, F(4, 8210) = 4.20, p = .002 (see Table 3). However, Bonferroni post hoc analysis indicated that the only significant difference (p = .03) was between the group who did not attend PASS (M = 233, SD = 98.16) and the group who attended 4 to 7 sessions (M = 212, SD = 97.36). Furthermore, nonparticipants had on average higher NCEA scores than those who did attend PASS sessions.
Mean Total Weighted NCEA Scores by PASS Sessions Attended
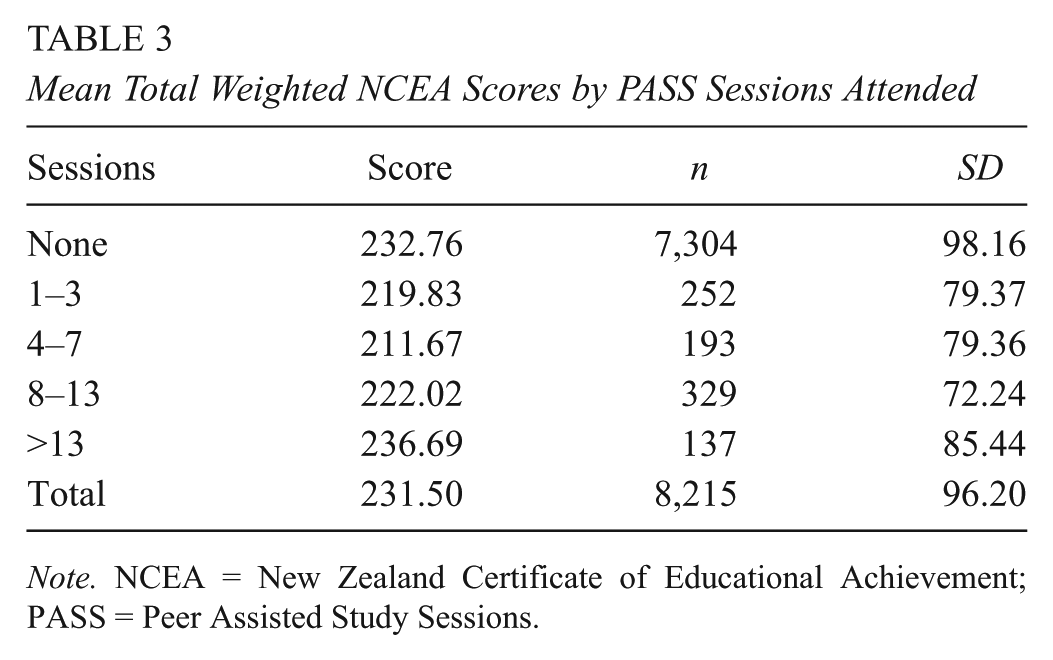
Note. NCEA = New Zealand Certificate of Educational Achievement; PASS = Peer Assisted Study Sessions.
To further test the relationship between NCEA score and PASS participation, we looked at (a) the difference in the distribution of the weighted NCEA scores between those who attended PASS and those who did not and (b) the linearity between the weighted NCEA scores and PASS sessions attended. As Figure 1 shows, there was no linearity, and the distribution between attendees and nonattendees was reasonably normal (slightly more skewed toward higher scores for nonattendees). In summary, those students who attended PASS were not just the academically more able students.

Relationship between New Zealand Certificate of Educational Achievement scores and Peer Assisted Study Sessions (PASS) attendance: Test of linearity through a scatterplot and comparison of distribution of scores between PASS attendees and nonattendees.
The multiple regression with PASS attendance as the outcome variable (including zero) clearly suggests that a very small proportion of variance in attendance is explained by the entered predictors, R2 = .003. As can be seen in Table 4, very few predictors reached significance, including the weighted NCEA score, p = .07.
Predictors for Attending PASS Sessions

Note. R2 = .003, F = 3.41, p < .001. PASS = Peer Assisted Study Sessions; NCEA = New Zealand Certificate of Educational Achievement; NZ = New Zealand.
In conclusion, from the data available at our institution for the years under investigation, it cannot be concluded that there any clear predictors for participation in PASS, including students’ prior academic ability as measured by their NCEA scores.
Prior Achievement, PASS, and First-Year GPA
We also sought to answer what impact prior educational achievement (NCEA scores) and PASS participation had on the GPA (on a 9-point scale) in students’ first year. We assessed this through correlation, ANOVA, and regression.
There was a clear relationship between the first-year GPA and both the NCEA score and number of PASS sessions attended. However, there was no significant correlation between NCEA score and PASS sessions attended, r(8213) = –.016, p = .149 (Table 5). The strong correlation between NCEA and first-year GPA may be interpreted to mean that performance in high school, as measured by the NCEA assessment framework, does matter for achievement in the first year at university; in other words, it does seem to have predictive validity.
Correlations Among NCEA Score, PASS Sessions Attended, and GPA Year 1

Note. NCEA = New Zealand Certificate of Educational Achievement; PASS = Peer Assisted Study Sessions; GPA = grade point average.
p < .01.
ANOVA showed a relationship between the number of sessions attended and a higher average GPA, F(4, 11172) = 11.95, p < .001 (see Table 6). The results by bands suggest that attending just a few sessions (one to three) in one unit of study does not have a big impact on the overall GPA, but attendance of more than four sessions does. As mentioned, 75% of students in this study were enrolled in PASS for one unit of study only and a further 16% for two units of study. A typical workload of first-year students in our institution is seven units of study per year. Considering this, the relatively modest relationship between GPA and PASS attendance could be considered an indication that PASS attendance may have some impact on the overall academic achievement in the first year through its function in students’ academic and social integration objective of PASS.
GPA Year 1 by PASS Sessions Attended
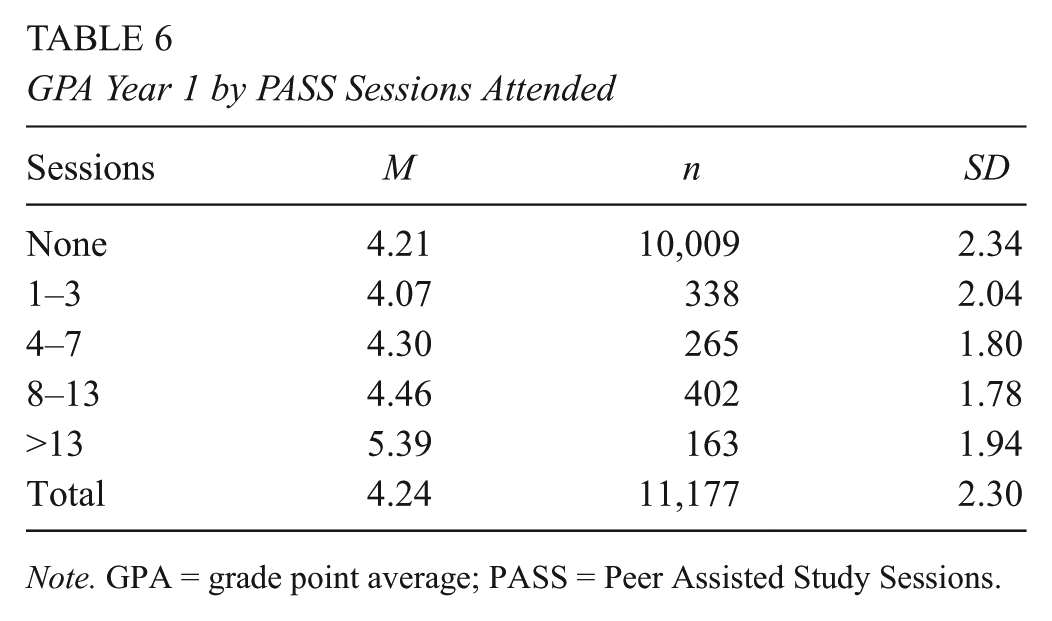
Note. GPA = grade point average; PASS = Peer Assisted Study Sessions.
Table 7 shows the results of the multiple regression with the GPA for the first year as an outcome and a range of predictors that may contribute to success or confound other variables.
Predictors of First-Year GPA
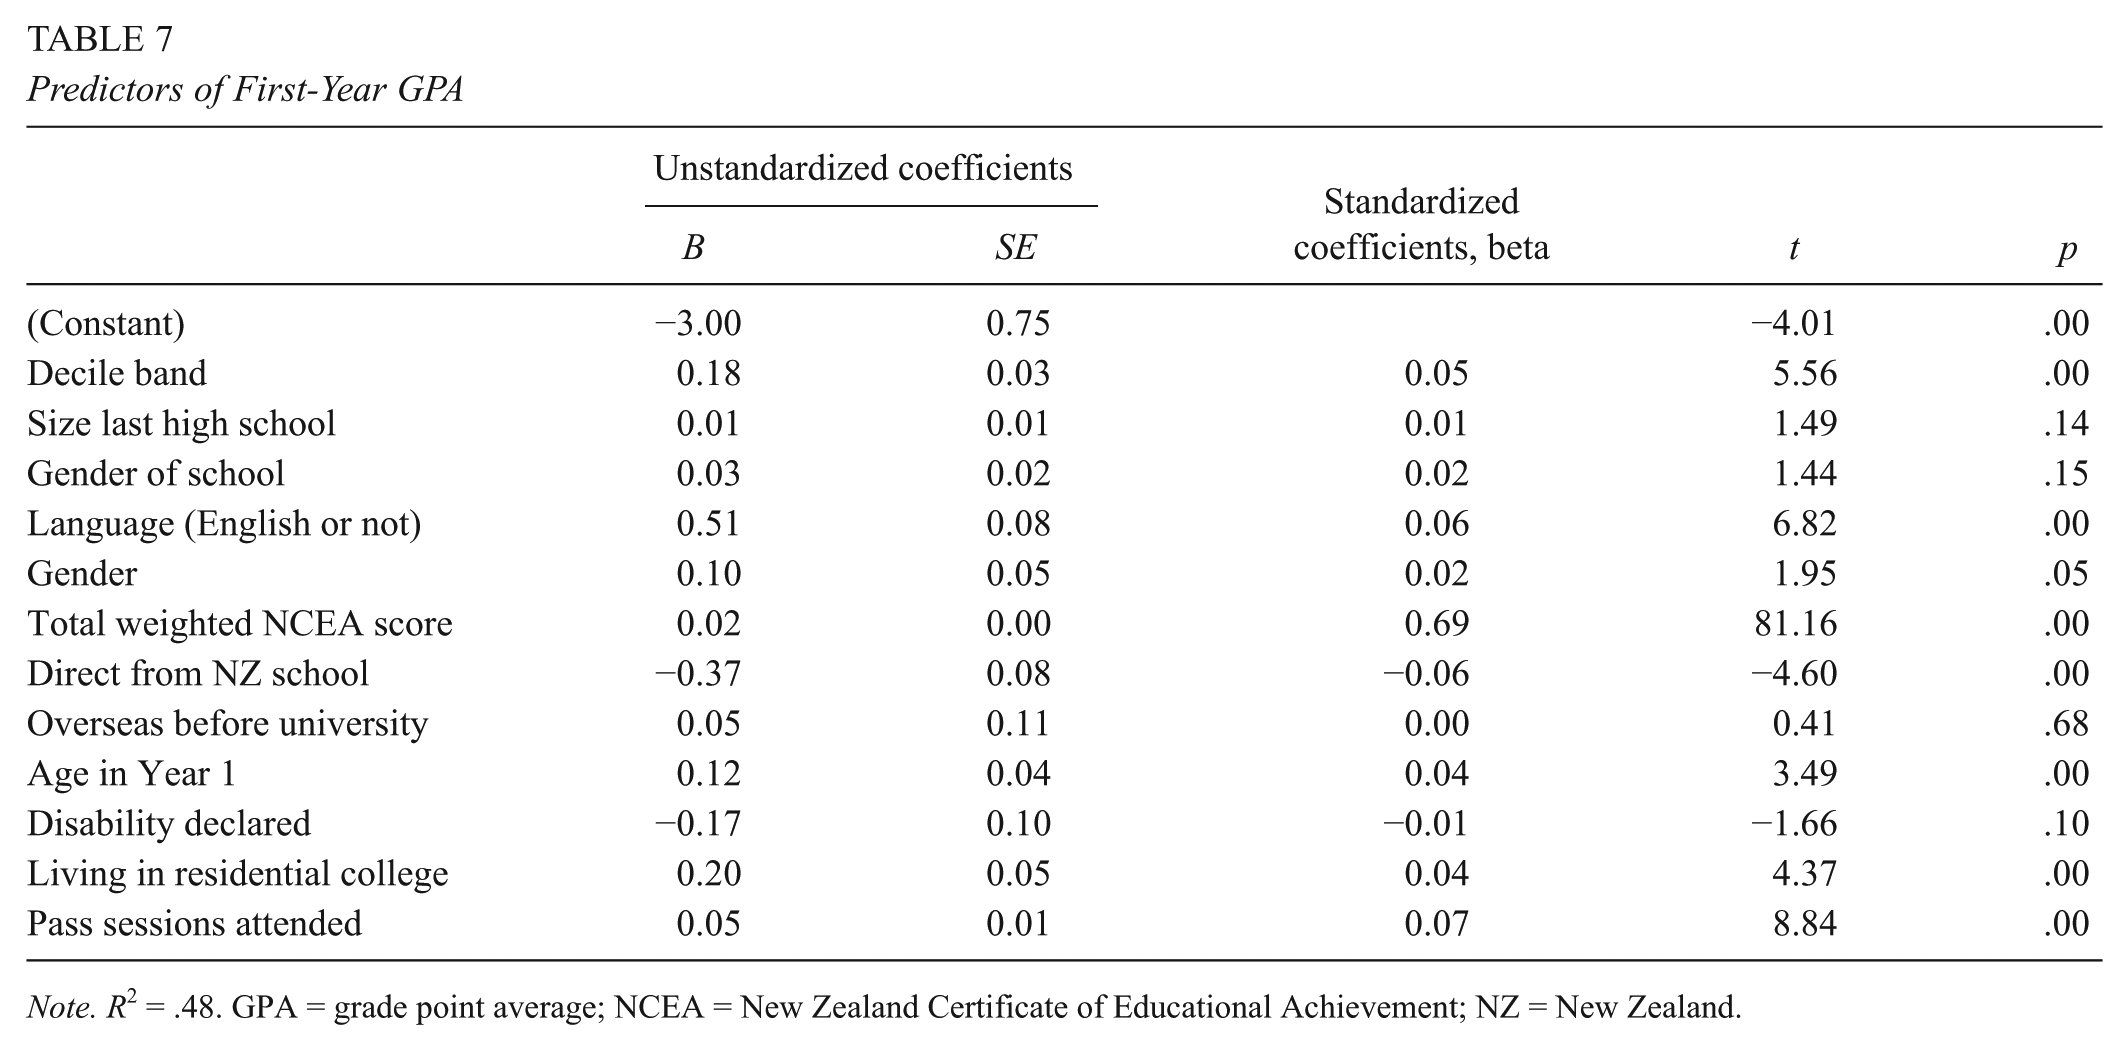
Note. R2 = .48. GPA = grade point average; NCEA = New Zealand Certificate of Educational Achievement; NZ = New Zealand.
The results suggest that this model predicts a good proportion of variance, R2 = 0.48, F(14, 8061) = 532.44, p < .001. The weighted NCEA score reached the highest beta value, followed by PASS attendance. These results suggest that for every 24 PASS sessions that students attend (i.e., if they attend 12 sessions of PASS for two units of study), it is predicted that their GPA for the whole year will on average increase by just over one whole letter grade. For some students, that could mean going from a fail to a C– or from a C+ to a B–.
To make the results easier to interpret, we chose to include the actual PASS sessions attended as a predictor rather than attended sessions banded in groups (as for the ANOVA as shown in Table 6). However, for comparison, we did run a regression using the PASS bands as well. The results of the two regression analyses indicated that both models explained 48% of the variance (R2 = .48); for the model with total sessions, F(12, 8063) = 615.64, p < .0001; and for the model with PASS bands, F(12, 8063) = 613.27. PASS totals significantly predicted the first-year GPA (β = .07, p < .001), as did PASS bands (β = .06, p < .001). The nonstandardized coefficients were B = .05 (β = .07) for actual PASS totals and B = .17 (β = .06) for actual PASS bands. In other words, 20 sessions predict an increase of 1 grade letter; a jump of 5 bands (>13 sessions), an increase of 1.02 grade letter.
Table 8 provides the data from the regression performed separately for the three equity groups: Māori students, Pacific Island students, and students who do not live in a residential college. For all three groups, PASS participation suggests a greater impact on GPA, especially for Pacific Island students. However, it needs to be noted that the number of students involved are relatively fewer.
Regression Results (GPA Year 1) for Selected Equity Groups

Note. GPA = grade point average; NCEA = New Zealand Certificate of Educational Achievement; NZ = New Zealand.
p < .05. **p < .01.
Progression Beyond the First Year
We considered the impact of PASS attendance and NCEA in two ways—through a simple comparison in percentages of students who were retained in Year 2 and had participated in PASS and through an ANOVA with those who were retained in Year 2 as the independent variable and with weighted NCEA score as the dependent variable. As can be seen in Table 9, percentage-wise, more students who participated in PASS returned after Year 1.
Retention Beyond Year 1 by PASS Sessions Attended
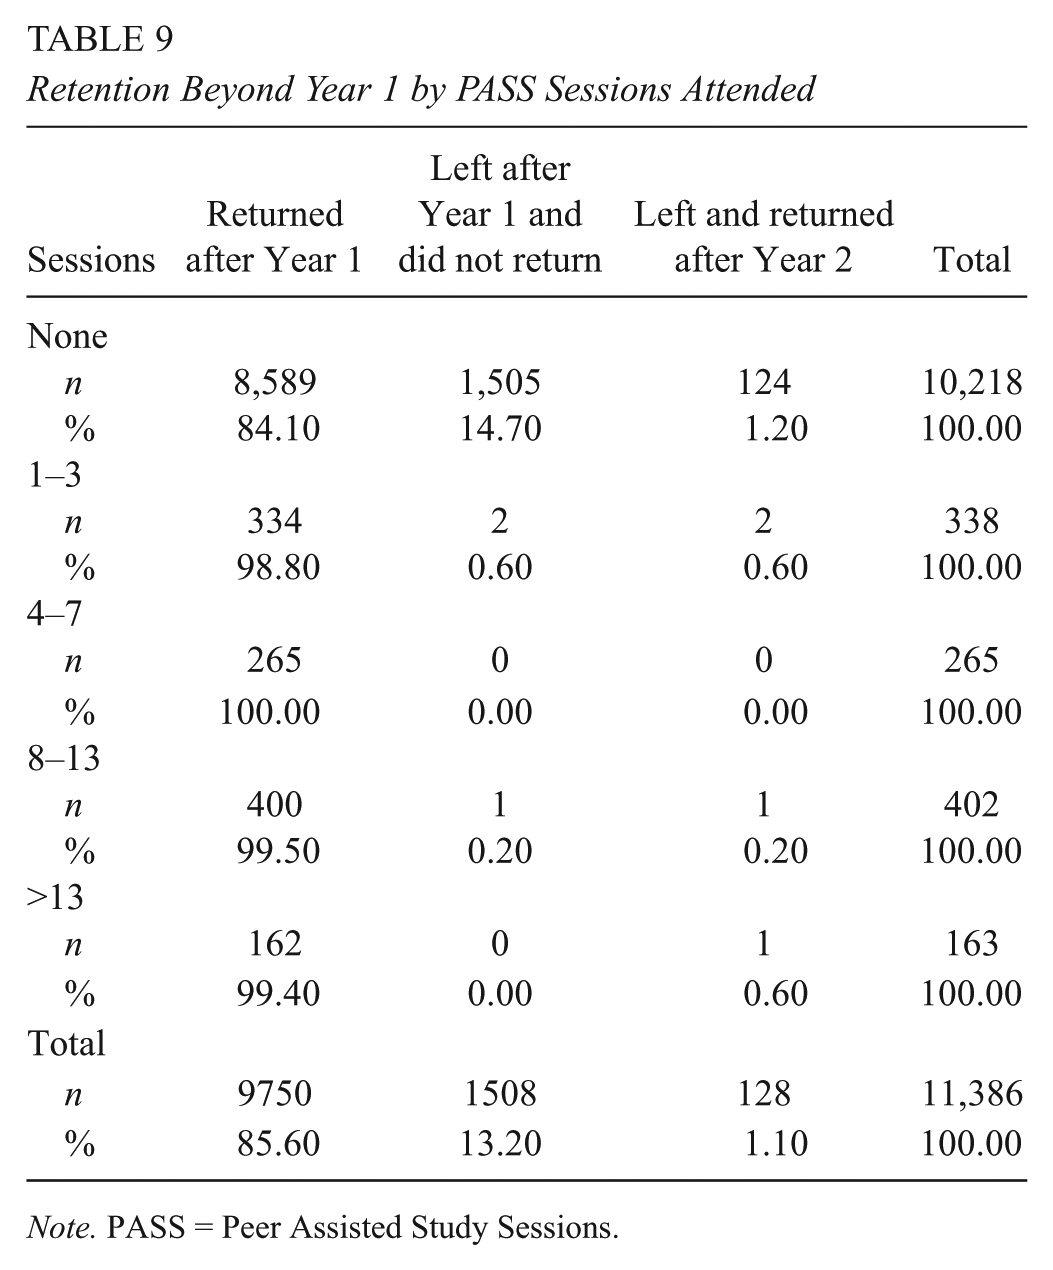
Note. PASS = Peer Assisted Study Sessions.
ANOVA revealed that students who had an average higher weighted NCEA score seemed more likely to return, F(1, 11175) = 230.69 p < .001. We then performed a logistic regression with returning in Year 2 as a binary variable with retuning as a reference. Table 10 shows that the odds ratio Exp(B) suggests that a single session of PASS attendance is associated with an a threefold increase in students’ odds of returning in year 2; in other words, students are approximately three times more likely to return with each PASS session. For the first-year GPA, a 1-point increase in GPA on the 9-point scale resulted in a 50% increase in a student’s odds of returning. Performance on NCEA, as we saw earlier, significantly predicts the first-year GPA but does not add anything further when controlled for by GPA and is not significant, p = .11. Living in a residential college increases the odds of returning to the second year by 40%. The pseudo R2 (Cox and Snell, Nagelkerke) statistics suggests that the variance explained by the model is between 10% and 19%. The significance of the Hosmer and Lemeshow goodness-of-fitness test was <0.05, which typically is considered indicative of a bad fit for the model. However, this may be a function of the sample size.
Predictors of Retention in Year 2

Note. df = 1.00 for each row. School decile is a proxy for social economic status (decile 1-3 = low, decile 4-7 = medium, decile 8-10 = high). NCEA = New Zealand Certificate of Educational Achievement; GPA = grade point average.
Completion of a Degree
Table 11 shows that we can see again a relationship between PASS and completion, with more students who attended PASS completing a program within 6 years. For students who attended four or more sessions, this was in excess of 90%, as opposed to 68% for those students who did not attend any PASS sessions.
Completion Rates by PASS Sessions Attended

The logistic regression results in Table 12 show that PASS, alongside first-year GPA scores, still has a positive effect on course completion—specifically, a 20% increase in students’ odds of completion with every PASS session attended in their first year. The pseudo R2 statistics (Cox and Snell, Nagelkerke) suggests that the variance explained by the model is between 20% and 29%.
Predictors of Completion Within 6 Years

Note. df = 1.00 for each row. School decile is a proxy for social economic status (decile 1-3 = low, decile 4-7 = medium, decile 8-10 = high). NCEA = New Zealand Certificate of Educational Achievement; GPA = grade point average.
Discussion
The first question that we sought to answer was whether a student’s prior academic achievement has an impact on her or his decision to participate in the PASS program? The results suggest that NCEA predicts students’ academic success in their first year, which in turn contributes to their chances progressing to their second year and completing their degree. Although NCEA predicts performance in Year 1, the data suggest that it is not only the academically “better” students who participate in PASS.
With regard to the second key question—to what degree do PASS participation and prior academic achievement have an impact on students’ academic success, as measured through the first-year GPA, first-year retention, and degree completion within 6 years—the data clearly suggest that PASS does seem to contribute to students’ success over and above their academic ability at point of entry. With regard to the third question, analyzed separately for the three equity groups (Māori students, Pacific Island students, and students who do not live in residential colleges), these findings hold as well. Our findings therefore seem to confirm U.S. and other international research findings that SI (the U.S. PASS equivalent) works for all students, irrespective of prior ability and ethnicity (see, e.g., Blanc et al., 1983; Bowles & Jones, 2004; Bowles, McCoy, & Bates, 2008; Couchman, 2008; Dawson et al., 2014; Gattis, 2000; Rath, Peterfreund, Xenos, Bayliss, & Carnal, 2007).
It could be argued that the beta values for the impact of PASS on the first year GPA are not that large. However, it needs to be remembered that in the years under investigation, PASS was available to only a limited number of units of study. Results, though, are encouraging. Hypothetically, if students attend 10 of 12 PASS sessions for four of their seven units of study during their first year, their GPA is predicted to increase by two letter grades. In other words, for some students who enter university with low NCEA entry scores, PASS might be the difference between passing some of their units or not. For the three equity groups, the benefits of PASS appear to be larger. Although the absolute numbers of participants in these three groups are smaller, the relative percentage of participants is similar. Further research of other years may shed more light on whether this is a recurrent theme. If so, this may suggest that PASS may be particularly suitable for addressing some of the differences in achievement between these three equity groups and the nonequity group. As articulated in other articles, it is important to identify what particular interventions reflect culturally responsive approaches and can be therefore inferred to support achievement for all students (Kokaua, Sopoaga, Zaharic, & van der Meer, 2014; Sopoaga & van der Meer, 2012; Sopoaga et al., 2013; van der Meer, 2011; van der Meer & Scott, 2013; van der Meer, Scott, & Neha, 2010). We understand “culturally responsive approaches” in this context to mean approaches that seek to reduce the discontinuity between students’ cultural background and teaching and support practices in the higher education environment. Some specific elements of the PASS program, such as its more interdependent collaborative focus, have been considered to resonate more with Māori and Pacific Island students (see, e.g., van der Meer & Scott, 2013).
Studies such as these are especially relevant in these times when many universities face a range of complex challenges. Most universities are currently operating in an environment of fiscal constraints. This means that allocation of scarce resources is of ongoing concern for university management. Where support is provided to enhance students’ academic achievement and the chance of progression and completion, it is important that there be sufficient evidence to suggest that this support is effective in achieving its objectives. This then is one of the reasons for this project: to provide evidence-based research to support the continuation and possible expansion of one particular program—PASS. We argue that a similar evidence-based approach for other existing learning support programs might be equally worthwhile. The more effective that programs are at enhancing students’ retention, completion, and academic success, the better it will be for institutions’ fiscal positions, reputations, and the well-being of their students and their future lives.
However, this does not have to mean that the outcome of this research has to result in the disestablishment of programs that may not currently be as effective as they could be. The research could inform a process of ongoing improvement and evaluation. Furthermore, it is important to broaden the research focus to assess other outcomes. For example, SI/PASS programs have major benefits for first-year students’ social integration by the virtue of students being able to connect with other students in an informal and student-centered environment. This connectedness with other students can contribute to students’ overall well-being, especially their mental well-being (Burton, Hess, & Becker, 2012; Larcombe et al., 2016). There are many other possible benefits as well—for example, students’ sense of belonging to the institution, culturally and otherwise (Dawson et al., 2014).
The benefits of programs such as SI/PASS extend to the second- or third-year students who act as PASS leaders for the study sessions. There is a growing worldwide interest in the benefits of students’ extracurricular activity in leadership positions (Grande & Srinivas, 2001; Higher Education Research Institute, 1996; Keup, 2010; Komives, 2006; Skalicky & Caney, 2010; van der Meer, Skalicky, & Rogan, 2016).
Limitations of this Study
Achieving a robust level of data integrity was a considerable challenge, given the changeover between a disestablished and new student administration system over the period of this study. We believe that after considerable efforts and data checking, we achieved a reasonably good level of data integrity, but we do not exclude the possibility that some individual data records may not be entirely correct, because of some rare combination of exceptions. We are confident, however, that these are very few and, considering the sample size, might have a very small effect, if at all.
Footnotes
Authors
JACQUES VAN DER MEER is the associate dean (academic and research) at the College of Education of the University of Otago. His research interests relate to peer learning, student retention, and achievement.
ROB WASS is a lecturer in the Higher Education Development Centre at the University of Otago. His research interests relate to constructivist approaches to learning, critical thinking, and Vygotsky’s concept of zone of proximal development.
STEPHEN SCOTT is the director of First-Year Experience at the University of Otago. His research interests relate to the first-year student experience and Māori achievement.
JESSE KOKAUA is a researcher in the Pacific Island Research and Student Support Research Unit at the University of Otago. He evaluates the programs provided by the unit and undertakes research topics about the factors that contribute to increased academic achievement by Pacific students.