
Abstract
In this article, we focus on a statewide system of interdistrict open enrollment in Michigan, known as Schools of Choice. Our previous work indicated that students who take advantage of this program are disproportionately lower performing on state exams, come from lower-income families, and are more likely to be minority students. We estimated conditional bounds on these factors, as well as within-student variation in test scores, for the effect of participation in Schools of Choice, and find little evidence that student achievement is affected overall. We find little consistent evidence that subgroups of students based on race, gender or income benefit or lose disproportionately from the program, nor do students whose resident districts vary on key demographic or achievement characteristics.
Perhaps due to the controversies surrounding charter schools and vouchers, empirical evidence on the educational effectiveness of these sectors relative to traditional public schools is substantial. The impact of charter schools in particular on student achievement is well studied (e.g., Angrist, Dynarski, Kane, Pathak, & Walters, 2012; Bifulco & Ladd, 2006; Booker, Sass, Gill, & Zimmer, 2011; Clark, Gleason, Tuttle, & Silverberg, 2014; CREDO, 2013; Dobbie & Fryer, 2011; Hoxby & Muraka, 2009; Imberman, 2011a, 2011b; Sass, 2006). Though by no means uniform, the preponderance of this evidence—especially that drawn from experimental designs which leverage lottery-based admissions—indicates modest positive effects, though with substantial state- and school-specific variation in these averages (Betts & Tang, 2014). The evidence for school vouchers is also well developed, though more limited than in the charter school context. Earlier studies in Milwaukee (Greene, Peterson, & Du, 1999; Rouse, 1998; Witte, 2000) indicated mixed results but suggested positive voucher impacts especially in math, while work in Cleveland (e.g., Plucker, Muller, Hansen, Ravert, & Makel, 2006) found little evidence overall of voucher effects. Privately funded vouchers in New York City, Dayton (Ohio), and Washington, DC, generally had positive effects (Howell & Peterson, 2006), and small but positive effects on student attainment were found in both New York City (Chingos & Peterson, 2012) and Milwaukee (Cowen, Fleming, Witte, Wolf, & Kisida, 2013) and in the first federally funded program in Washington, DC (Wolf et al., 2013). There is also evidence in Milwaukee that public accountability programs applied to the voucher sector increased student achievement (Witte, Wolf, Cowen, Carlson, & Fleming, 2014). The exception to the positive or null effects of vouchers comes from recent work in Louisiana that showed negative impacts of students being awarded vouchers and attending their first-choice school (Abdulkadiroglu, Pathak, & Walters, 2015; Mills & Wolf, 2017).
Relative to studies of charter and voucher impacts on student outcomes, evidence on the effects of participation in open enrollment systems is relatively scarce. The extant studies have been conducted generally in a variety of geographic and programmatic settings, which makes generalizability somewhat difficult due to the wide variation in open enrollment plans across the country (Cowen, Creed, & Keesler, 2015; Cowen & Toma, 2015). Evidence from Chicago’s lottery-based intradistrict open enrollment system has shown positive impacts of choice (Cullen, Jacob, & Levitt, 2005), a pattern consistent with data from Charlotte, North Carolina, (Deming, Hastings, Kane, & Staiger, 2011; Hastings & Weinstein, 2007) and evidence from magnet school lotteries in Connecticut (Bilfulco, Cobb, & Bell, 2009). Nonexperimental evidence from Colorado has been mixed, with Carlson, Lavery, and Hughes (2014) finding no immediate effects of transferring but eventual gains to achievement, particularly in reading, for students who maintained participation over several years. There is also district-level evidence from Wisconsin that indicates indirect effects of open enrollment on outcomes for students remaining in districts with high enrollment losses: These districts may be responding to competitive pressures to maintain enrollment through improved performance (Welsch & Zimmer, 2012). It is also important to note that open enrollment programs are not the only source of student transfer within the public school system. This larger literature on student mobility can inform the question of open enrollment impacts to some extent. All else equal, race, academic ability, income, and family background appear related to student school mobility and, with few exceptions, the literature has consistently demonstrated negative academic consequences for students who move between schools and students in classrooms with high rates of turnover (Alexander, Entwisle, & Dauber, 1996; Hanushek, Kain, & Rivkin, 2004; Ingersoll, Scamman, & Eckerling, 1989; Kerbow, Azcoitia, & Buell, 2003; Rumberger, Larson, Ream, & Palardy, 1999; South, Haynie, & Bose, 2007; Temple & Reynolds, 1999; Xu, Hannaway, & D’Souza, 2009).
In this article, we strengthen the literature on the relationship between open enrollment policies and student outcomes. We focus on the statewide system of interdistrict open enrollment in Michigan, known as Schools of Choice (SoC), in which local communities develop their own policies governing nonresident student entry and exit via state financial and administrative guidelines. Our previous work (Cowen et al., 2015) has indicated that students who take advantage of this program are disproportionately lower performing on state exams, come from lower income families, and are more likely to be minority students. Conditional on these factors, we estimate bounds for the effects of participating in open enrollment and find little evidence that student test scores change after transferring from one district to another. We find little consistent evidence that subgroups of students based on race, gender, and income benefit or lose disproportionately from the program, nor do students coming from districts with varying demographic or achievement characteristics, although there is evidence suggestive of small positive effects for students entering the top-performing districts in math as well as districts with fewer African American students. We conclude this study by discussing the implications of the evidence for school choice policy and discuss a number of important limitations to the work.
Background
Previous Research: Who Chooses, Where Do They Go, and What Are the Effects?
As in studies of charter or private school choice, one of the critical questions for research on open enrollment programs focuses on the characteristics of students who participate. Among the studies employing student-level data, race, academic background, and socioeconomic background have all appeared among the determinants of intra- or interdistrict choice. Studies of Colorado’s program have indicated that on some measures, open enrollment students are more advantaged—they are less likely to be eligible for free/reduced-price lunch, designated for special educational services, and English-language learning while more likely to have higher reading achievement scores prior to transferring (Carlson et al., 2014; Lavery & Carlson, 2015). However, prior math achievement may be lower for open enrollment participants, and race plays differential roles depending on student grade: Hispanics are disproportionately less likely to transfer, but African Americans in younger grades are more likely to transfer than White students (Lavery & Carlson, 2015). Descriptive statistics from one large district in the same region have found less ambiguity, with White students and those not eligible for free/reduced-price lunch more likely to participate (Phillips, Hausman, & Larsen, 2012).
Among studies focusing on district-level differences in open enrollment participation in Colorado, Minnesota, or Wisconsin, the evidence has indicated that districts with higher levels of income are considerably more likely to have high rates of choice (Carlson, Lavery, & Witte, 2011; Holme & Richards, 2009; Lavery & Carlson, 2015; Welsch, Statz, & Skidmore, 2010) and that higher levels of achievement may also be associated with higher levels of public school choice. A handful of district-level studies have also considered where students who opt into open enrollment actually attend. Generally, these studies have found that schools and districts receiving transfer students tended to be better advantaged, as measured by higher test scores, higher levels of resident income or housing value, or, in some cases, lower levels of non-White minority students (Armore & Peiser, 1998; Carlson et al., 2011; Fossey, 1994; Reback, 2008). Taken as a whole, because there is evidence that districts with higher levels of achievement send students to districts with even higher student outcomes and because students appear to be choosing within and out of comparably high-income districts, the available evidence indicates that open enrollment programs are utilized primarily in areas where socioeconomic and academic advantages are already substantial (Carlson et al., 2011).
Michigan’s SoC Program
In Michigan, various forms of modern school choice have existed since 1994. The state’s SoC program, established by the state legislature, governs interdistrict student enrollment. Michigan school districts are permitted but not required to participate in SoC. 1 Under section 105 of the State School Aid Act, nonresident parents may choose to enroll their children in a participating local district within the same regionally determined (typically county based) intermediate school district as their resident district or, under Section 105c, within a different intermediate district altogether if the choice district shares a border with the resident intermediate school district. State funding follows each pupil into the new district, implying that districts with high net rates of exit may be substantially, negatively affected, while districts with high net rates of nonresident entry may realize positive financial gains (Arsen, DeLuca, Ni, & Bates, 2015). Each participating district determines specific provisions, including caps on nonresident enrollment, which schools and grades are eligible to receive nonresidents, whether specific academic programs are available to nonresidents, and the timeline for applying for enrollment. Although most districts in the state nominally accept nonresident students, the provisions for local control imply substantial statewide variation in the extent to which school choice is realistically available to individual students. 2 In particular, there is no requirement that districts must provide transportation to nonresident students, although some do. Subject to these provisions, individual students may choose to leave their residential districts and, in areas with more than one participating district, may choose among schools in different districts. In addition to the SoC program authorized at the state level, neighboring districts may establish local cooperative agreements to permit other forms of student transfers between their borders. For the present article, we focus exclusively on students participating in interdistrict open enrollment via SoC.
Data
We utilized the Michigan Department of Education’s and Center for Educational Performance and Information’s administrative data set from the 2005–2006 school year through the 2012–2013 school year. This data set contains demographic information and enrollment history for the universe of Michigan students. The enrollment history contains information on whether a student participates in Michigan’s SoC, attends a public school academy (charter school), or attends school in the district of residency in every year. The data set also provides Michigan Educational Assessment Program (MEAP) test scores for students in Grades 3 through 8. Each student receives a unique identification code upon entry into Michigan public schools, enabling us to follow a student’s enrollment choices across years. In total, we are able create a panel spanning 7 years with unique student-year observations which exhaustively covers Michigan students attending traditional public schools and charter schools. In our primary analyses, we exclude charter school students from these comparisons in academic achievement. Furthermore, we limit our final sample to exclude those students attending alternative schooling options, such as vocational education schools. 3 After removal of duplicate entries for students, our final sample consisted of just over 13 million student-year observations for nearly 3 million individual students in schools serving traditional K–12 students. 4 See Appendix for a year-by-year breakdown of SoC and charter enrollees.
The richness of the Michigan Department of Education data set enabled us to develop a series of student, school, and district variables to use in our analysis. At the student level, we created variables from the data capturing student gender, race/ethnicity, grade of attendance, free/reduced-price lunch status, limited English proficiency status, and special-needs status. In addition to these demographic characteristics, we were able to include the MEAP scores for students in Grades 3 to 8. We used the MEAP math and reading scores to generate for each subject the student’s MEAP scores standardized in a given grade, for a given year, at the state level.
We constructed a series of enrollment dummy variables for each student-year observation, which represent our key outcome variables of interest. Using the enrollment codes provided by Michigan Department of Education, we created a series of dummy variables for use of the SoC policy: in this article, we focus on students who enrolled in SoC under either Section 105 or 105c (described earlier). As we describe later, our primary analyses rest on the ability to observe students before and after participating in SoC. This requires us to focus on switchers: students who moved into or out of the program at some point t in their academic careers (specifically, tested Grades 3–8) after having been in their residential district at t – 1 or a SoC district at t – 1, respectively.
Table 1 provides descriptive statistics of student-year observations comparing students who never participated in SoC during our panel with students who participated in at least 1 year over the duration of the panel. These indicate relative parity between the groups of students on most demographic metrics, with three important exceptions. Students who ever participated in SoC tended to be somewhat more likely to be African American and to be poorer (as measured by free/reduced-price lunch participation). In addition, SoC students are lower scoring on average than the state averages in their grade, year, and subject. These indicators seem to provide evidence contrary to the “cream-skimming” hypotheses suggested by choice critics in early years. However, it is important to note that both columns in Table 1 are statewide averages and do not compare choosers and nonchoosers within a more local context. The tables are entirely consistent with a number of other studies suggesting disproportionate initial take-up of choice, whether vouchers, charters, or interdistrict choice, among at-risk populations (see, e.g., Angrist, Cohodes, Dynarski, Pathak, & Walters, 2016; Bifulco & Ladd, 2006; Booker, Zimmer, & Buddin, 2005; Cowen, 2010; Dobbie & Fryer, 2011; Fleming, Cowen, Witte, & Wolf, 2015; Lavery & Carlson, 2015; Sass, 2006; Witte et al., 2007), although some of this work has suggested that such students are more likely to churn in and out of choice programs, especially from voucher programs (in particular see Carlson, Cowen, & Fleming, 2013; Carlson et al., 2014; Cowen, Fleming, Witte, & Wolf, 2012; Howell, 2004; Lavery & Carlson, 2015). 5
Descriptive Statistics Based on Enrollment in Schools of Choice (2005–2012)

Note. Author calculations from data provided by the Michigan Department of Education and Center for Educational Performance and Information. All cells save achievement scores are proportions; achievement scores are standardized to state averages by subject, grade and year.
As noted so far and detailed later, our analytical strategy requires us to focus on transfers into (and from) SoC program. Table 2 indicates substantial variation in this regard by focusing on two measures within the population of students who ever participated. The first panel of Table 2 indicates that, across the panel of participants, roughly 13% in a given year t are in their first year, while 15% are in their last year and 72% in any given year are in neither their first nor last year. These rates mask a considerable degree of turnover, however, as across all years, the modal group of students last for only 1 year in SoC and 60% are in SoC for no more than 3 years. This turnover rate is the subject of an entirely separate analysis (Cowen et al., 2015), but for our purposes here, we note that this variation does permit our following analytical strategy.
Dynamic Participation in SoC

Note. Author calculations from data provided by the Michigan Department of Education and Center for Educational Performance and Information. SoC = Schools of Choice.
Analytical Strategy
Ideally, we would identify the impact of participation in SoC on achievement for any student i by observing achievement Y simultaneously at time t for i under participation and nonparticipation in SoC. The difference in the two potential outcomes for i in such a scenario would represent the effect of SoC treatment (e.g., Rubin, 1974). This quantity, while unobservable, can be estimated if whatever mechanism determining assignment into participation or nonparticipation conditions is independent of potential outcomes under either condition—as is in practice achieved when participation is determined randomly via an experimental design. As noted, the literature on school choice generally has leveraged lottery-based school assignment policies in many studies to approximate experimental conditions. The chief strength of this approach is that differences between participants and nonparticipants can be interpreted as average causal effects of participation. A number of policy-relevant limitations remain, most notably pertaining to (a) external validity, in cases where oversubscribed schools or schools otherwise using lottery-determined enrollments do not represent the population of providers (especially for the large, diverse charter school sector), or (b) scale, where smaller programs do not have similar effects when broadened out to larger contexts (e.g., pilot voucher programs; see Howell & Peterson, 2006; Rouse, 1998). The literature has nevertheless generally prioritized internal over external validity and lottery-based school choice studies are practically de rigueur in the literature.
Unfortunately, no such conditions are available in this study since the Michigan Department of Education does not collect data on which students were admitted via local SoC lotteries in their applicant districts nor even, more generally, which districts employ lotteries. However, as we argue in our discussion, the approach that we do employ provides suggestive evidence of participation impacts still valuable to the literature and to policy making, particularly given that interdistrict choice programs are highly understudied.
More to the point, the lack of experimental data is still quite common in the choice literature and there is a well-developed set of techniques available in this literature to provide meaningful analyses of such nonexperimental differences. In particular, we seek here to establish bounds of an SoC effect in the spirit of Bifulco and Ladd (2006) and Sass (2006) by following, especially, Imberman (2011a, 2011b) and others in leveraging within-student differences in achievement (i.e., student fixed effects and value-added estimates) to obtain quasi-experimental estimates of the SoC effect.
We first estimate the relationship between SoC and student test scores using the following student fixed effects model, which we call the levels model:

In this model, yit is an outcome for student i at time t; Sit is an indicator variable for participation in SoC at time t;

This gains model provides the other estimated bound for the true impact of participation in SoC on student test scores; see Imberman (2011a, Appendix), who provides a proof of the bounds set by the levels and gains versions of the fixed effects model in a similar student transfer context. The insight by Imberman is that the effect of SoC participation in a fixed effects model in which the true rate of decay (the impact of past on current achievement) is known is bounded by the levels model in which there is no relationship between past and current outcomes (a decay rate of 0) and the gains version in which the rate is 1. It is not possible to account for the true rate of decay in one fixed effects model without introducing different forms of endogeneity. The estimate of the effect of choice participation in which the true rate of decay is known is therefore bounded between the two models that assume rates of 0 and 1. 6
The selection of parents and students into the SoC program may be a concern for the estimation of the effect of SoC. The student fixed effects approach that we use accounts for any time-invariant characteristics of the students, whether observed or unobserved. Furthermore, the grade-by-year dummies control for any grade and year specific effects. However, the approach assumes that the relevant student-level factors determining choice and test scores are time invariant.
For example, if there were systematic trends in outcomes prior to the use of SoC, these would bias our estimates. The school choice literature, drawing on the job-training literature (e.g., Ashenfelter, 1978), suggests the need to examine the outcome trends leading up to the decision to switch out of a school (Bifulco & Ladd, 2006; Imberman, 2011a; Sass, 2006). If families utilize SoC in response to a child’s declining performance, a key assumption (strict exogeneity) of the fixed effects is violated: that past or future outcomes are not associated with the enrollment in SoC. In the spirit of Carlson et al. (2013) and Imberman (2011a), to test this, we regressed student standardized test score gains on student and grade-by-year fixed effects. We then plotted the residuals by years pre- and post-switch to examine the trends. Figures 1 and 2 display these results. When exploring the case for an Ashenfelter-type dip, we do not find strong evidence that this is the case. For reading, student-level and gains standardized scores show a slight drop of .005 SD in the year prior to the switch. In math, there is no evidence of a concerning dip, as math gains scores trend upward prior to the switch and math-level scores trend downward in the lead-up to the switch. In any case, all point estimates in these graphs are very small.
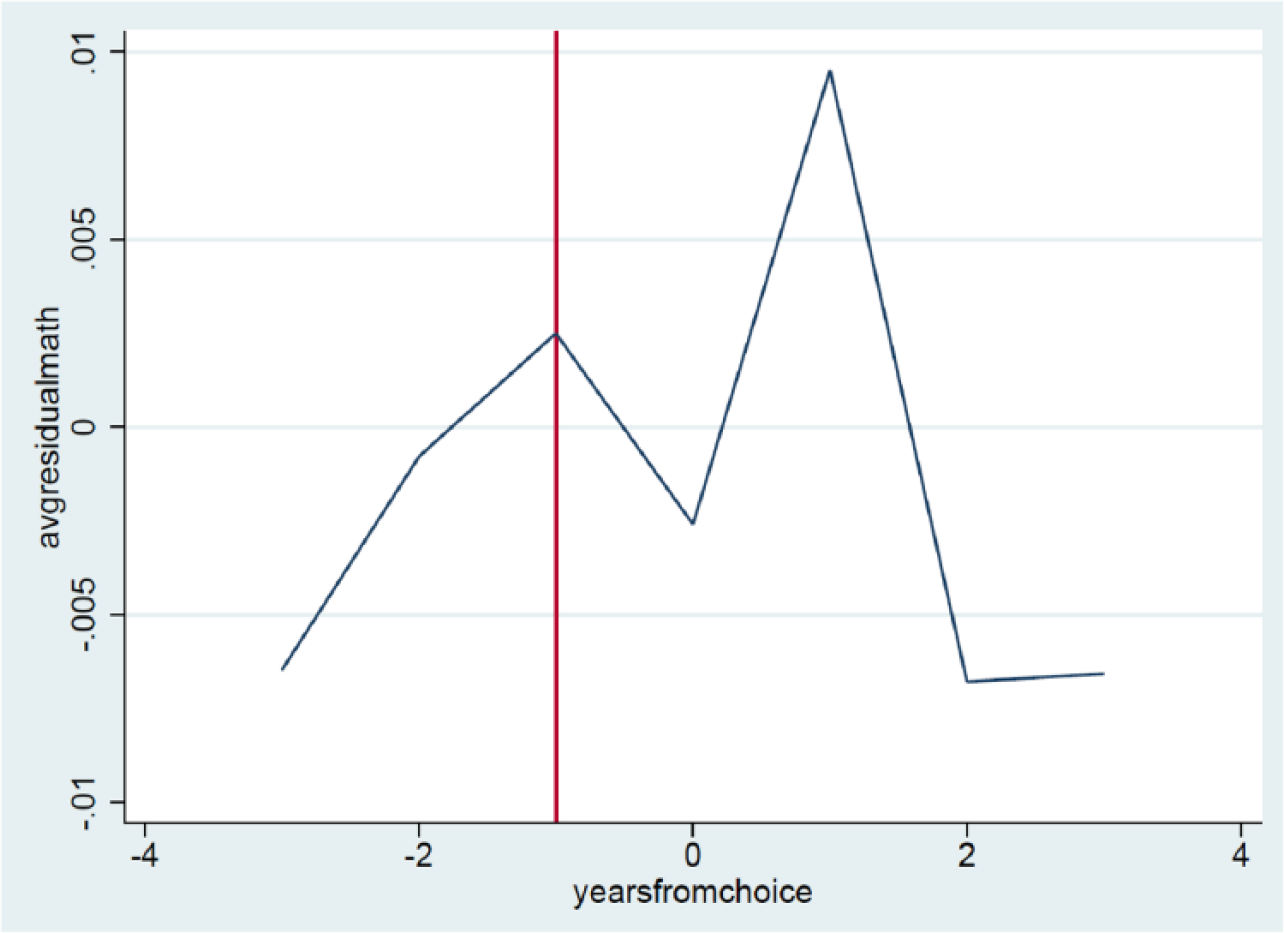
Ashenfelter dip check for standardized math scores: Michigan Educational Assessment Program. Graphs are gain scores demeaned by student and grade-by-year fixed effects. The vertical line represents the year prior to choice and, thus, the location an Ashenfelter type dip would exist.

Ashenfelter dip check for standardized reading scores: Michigan Educational Assessment Program. Graphs are gain scores demeaned by student and grade-by-year fixed effects. The vertical line represents the year prior to choice and, thus, the location an Ashenfelter type dip would exist.
For both the levels and the gains models, we explore if there are heterogeneous results for different subgroups: male/female, race/ethnicity, language status, free/reduced-price lunch status, quartiles of achievement, and the number of years participating in SoC. Previous work exploring who uses SoC in Michigan revealed differing patterns based on average resident district characteristics (Cowen et al., 2015). We estimate the levels and gains models grouping districts by quartiles of (a) mean district achievement, (b) the district’s proportion of African American students, and (c) the district’s proportion of free/reduced-price lunch students.
Results
Table 3 presents the full results of our estimates of Equations 1 and 2. As the first two columns of results indicate, there is no evidence of an impact of SoC on math, a finding also present for reading. We note that employing alternative specifications of the contextual fixed effects (i.e., district by year and a grade fixed effect separately) does not change these results. Taken together, these estimated bounds provide summary evidence that on average the overall impact of SoC is close to zero. Table 4 provides subgroup analyses for students based on race, gender, free/reduced-price lunch, and limited English proficiency status as well as achievement quartile at t – 1. As in the main analyses, the preponderance of the evidence suggests little to no difference associated with participation in SoC for most groups. The gains results in Table 4 are consistently insignificant.
Estimated Schools of Choice Impact Bounds Based on Levels and Gains
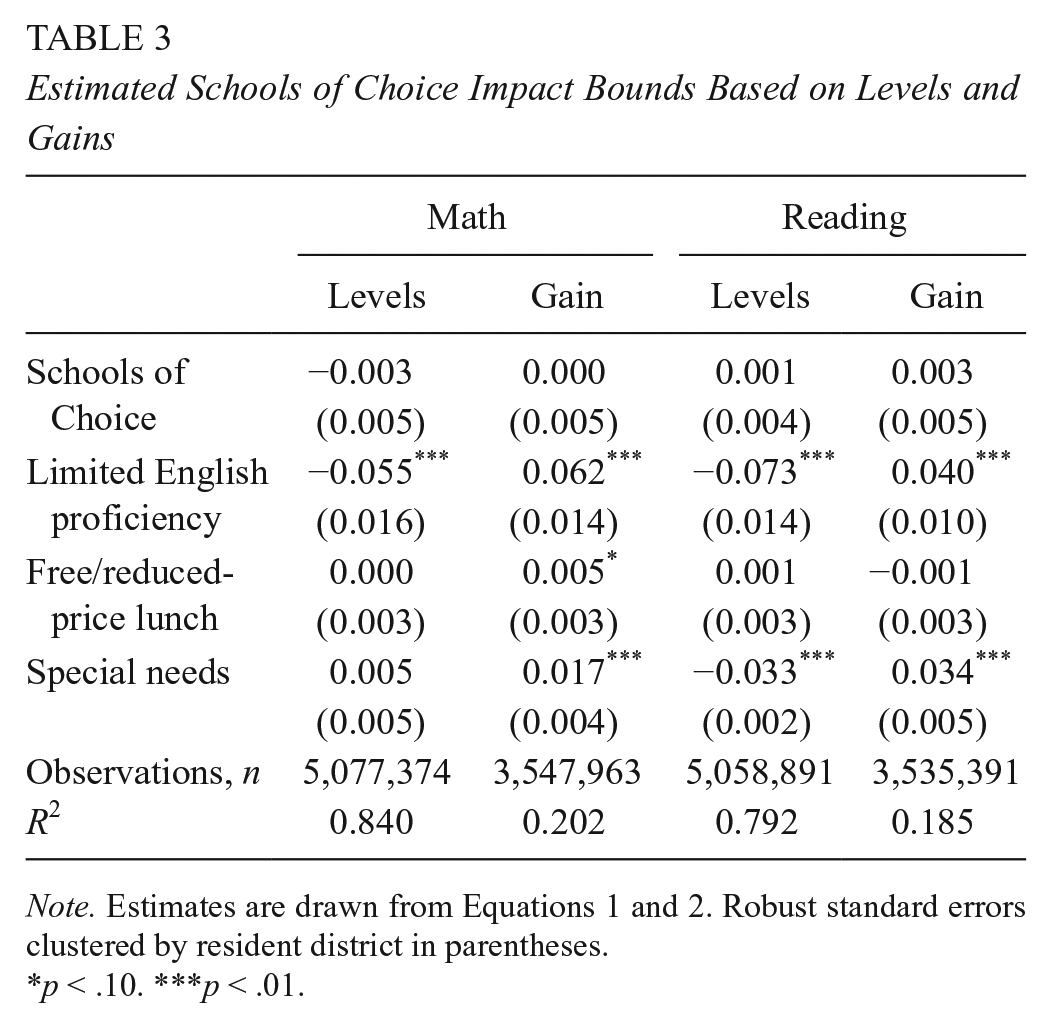
Note. Estimates are drawn from Equations 1 and 2. Robust standard errors clustered by resident district in parentheses.
p < .10. ***p < .01.
Estimated Bounds for Student Subgroups

Note. Each cell represents a separate subgroup estimate of β in Equations 1 and 2 by subgroup referenced, with robust standard errors clustered by resident district in parentheses. Each regression includes student-level controls.
p < .10. **p < .05.
Table 5 presents dosage results, which explore if there is an additive difference associated with having remained in SoC for up to 4 years in addition posttransfer. We estimated levels and gains models with a series of dummy variables for the number of years after switching into SoC. This specification allows for the possibility that students accrue positive (or negative) gains from SoC over time in the program. The results from this dosage analysis show zero or small impact of SoC on student outcomes. Given our earlier work indicating that most students transfer out of the program fairly quickly (Cowen et al., 2015) and that such students tend to be low performing relative to their new peers and tend to be minority students, we might worry that such programmatic attrition biases our estimates of longer-term gains even though prior achievement is explicitly accounted for in the gains model and race is accounted for in both. We provide estimates in Table 5 largely to indicate that even descriptive evidence suggests no consistent longer-term gain (or loss) to SoC participation.
Dosage Results

Note. Estimates are versions of Equations 1 and 2 where the indicator for Schools of Choice is replaced by multiple indicators for which year in Schools of Choice posttransfer the student entered. Robust standard errors clustered by resident district in parentheses.
p < .10. **p < .05. ***p < .01.
Table 6 displays the coefficient of SoC on the corresponding test score, as it varies by receiving district-level quartiles related to achievement, percentage African American, and percentage free/reduced-price lunch. Overall, the results from this quartile analysis show flat impacts of SoC use on achievement. There are three exceptions to null results. Based on the levels analysis, there is potentially a small positive difference in math for students who move to high-performing districts (Quartile 4) through SoC and to districts with the lowest proportion of African American students (Quartile 1). Students attending the lowest-performing districts (Quartile 1) may see a slight decline in reading scores. In earlier work (Cowen, Creed, & Keesler, 2015), we do note that average choosers are substantially lower performing and more likely to be minority students than nonchoosers and that in general all students move to a higher-performing or at least no worse set of schools than where they left. It is possible that the results in Table 6 do indicate that some students are finding better fit elsewhere. In addition, given the sheer number of significance tests across the different subgroups, we would expect to see a handful of estimates cross into statistically significant thresholds. We do not adjust these tests for multiple comparisons simply because all estimates are so small (≤0.01 SD) that their substantive significance is doubtful even in the presence of low P values. The evidence in Table 6 does provide limited evidence, however, that the impact of participation in SoC may depend on where students move.
Dosage Results

Note. Estimates are versions of Equations 1 and 2 where the indicator for Schools of Choice is replaced by multiple indicators for which year in Schools of Choice posttransfer the student entered. Robust standard errors clustered by resident district in parentheses.
Discussion
In this study, we explore the impact of participation in Michigan’s SoC program, a nonresidential public school choice program, on student math and reading achievement scores. Although our results are based on nonexperimental methods that do not allow us to rule out the possibility of a confounding relationship between SoC participation and unobservable student or family characteristics that are also related to achievement, our evidence does provide an estimate of the bounds within which such impacts are likely to fall. The preponderance of this evidence suggests little to no effect of participation in SoC.
From the perspective that guides much of the motivation for school choice policy, such results may be surprising. If parents are enrolling their children in nonresident districts in an attempt to find the best academic (or otherwise) fit, we should expect some relative gains to outcomes to the extent that parents are actually correct in their assessments of such needs. However, as we have argued in our earlier work on the program (Cowen et al., 2015), the high rate of mobility among districts coupled with a disproportionately at-risk population of choosers—high minority, low income, and relatively low achieving—more closely resembles the sort of natural student attrition among schools found in large districts. In those settings, mobility rarely if ever results in net gains and often results instead in net losses to student outcomes even when students are sorting into better schools (Alexander et al., 1996; Hanushek et al., 2004; Ingersoll et al., 1989; Kerbow et al., 2003; Rumberger et al., 1999; South et al., 2007; Temple & Reynolds, 1999; Xu et al., 2009). Deliberate, well-informed parental choice may have positive outcomes in some settings, such as charter schools, but mobility itself is otherwise not a net positive. From that perspective, the results here may not be surprising at all. From another perspective, the results may indicate a net positive development if the null effects of this study are essentially driven by the typical adverse consequences of student transfer being offset by benefits from the choice to participate in SoC. 7
It is difficult to speculate on the extent to which the particular design features of Michigan’s SoC policy mediate or even drive these apparent null effects. We noted that although state law authorizes the program and state dollars follow students who choose nonresident districts, the rules governing participation are highly decentralized. Different districts make different decisions pertaining to the availability of seats, enrollment deadlines, and even decisions that may fundamentally determine accessibility to schools, such as whether to provide transportation to nonresident students. One explanation of our results could simply be that heterogeneous effects of choice exist across many different communities in Michigan. If so, this would suggest a important avenue for qualitative case study work in some districts to identify best practices that lead to student gains in those communities. Incorporating such rules at the state level would, however, require changes to policy that promoted a more centralized, coordinated system of choice.
There are a number of other important caveats to this study. The first is that although our methodological approach includes estimated bounds for the true effect of participation in SoC, the study remains an observational rather than experimental analysis. Absent the ability to randomly assign students to different schools or observe enrollments based on lottery in oversubscribed districts, we cannot entirely rule out the possibility that our lack of positive or negative impacts overall is driven at least in part by hidden factors correlated with student achievement levels or gains and the decision to participate in the first place. This caveat applies to all such work on school choice impacts.
Second, we cannot observe, on the basis of our approach, any long-term impact of sustained participation in SoC from kindergarten onward. Cowen et al. (2015) indicated that students who begin SoC in kindergarten and stay in their nonresident schools are likely different—at least somewhat more advantaged—than those who transfer among districts over time. It is possible that such students do gain (or lose) test score advantages relative to some counterfactual scenario in which they were not able to participate from the beginning of their academic careers at all. Although some nonexperimental methods do exist in the literature to consider such students—propensity score analysis, for example—the best of these methods tend to require at least one prechoice test score to even approach an unbiased estimate of impacts (Bifulco, 2012). Thus, by definition, we are limited to the group of children who transfer at some point over time. As we have argued, our results must be interpreted as evidence of the impact of participation in SoC for those who transfer between districts at some point rather than the impact of beginning elementary school in an SoC school and continuing throughout. However, because the majority of children—especially African Americans and children receiving free/reduced-price lunch—do not spend the majority of their early elementary careers in SoC, our finding of little academic benefit or loss associated with participation is likely to reflect the experience of many participants.
What this implies is that whatever else are the implications of student mobility among Michigan school districts, the consequences do not appear to be borne out in terms of student achievement one way or the other. This presents our final caveat: As in other choice settings nationally, Michigan’s SoC program may have a strong rationale well apart from academic achievement. A number of studies have shown that parents value other features of schools, including but also apart from academic gains, especially when making a school choice (e.g., Glazerman & Dotter, in press; Harris & Larsen, 2015; Lincove, Cowen, & Imbrogno, in press), and this implies that our results here are limited in their ability to inform an overall assessment of interdistrict transfer in Michigan. If the purpose of SoC is to provide parents the flexibility to enroll their children in public schools for reasons unrelated to their residential location—as employment circumstances may require, for example, or to make use of particular extracurricular activities or for any other motivation—then our results here do nothing to suggest that such a purpose is going unmet. From that perspective, it may simply be encouraging that there does not appear to be any net loss with respect to student test scores. Taken as a whole, neither supporters nor critics of this particular interdistrict enrollment program should look to participant test scores to make their case. The strengths or weaknesses of the program as a public policy appear to lie elsewhere.
Footnotes
Appendix
Enrollment Numbers for SoC, Public School (Charter) Academies, and Traditional Public School (2005–2012)

| Year | SoC | PSA | Total K–12 Enrollment |
|---|---|---|---|
| 2005–2006 | |||
| n | 64,754 | 90,466 | 1,697,850 |
| % | 3.81 | 5.33 | 100 |
| 2006–2007 | |||
| n | 70,468 | 98,023 | 1,699,299 |
| % | 4.15 | 5.77 | 100 |
| 2007–2008 | |||
| n | 82,885 | 107,774 | 1,713,014 |
| % | 4.84 | 6.29 | 100 |
| 2008–2009 | |||
| n | 86,281 | 103,925 | 1,683,655 |
| % | 5.12 | 6.17 | 100 |
| 2009–2010 | |||
| n | 90,027 | 107,384 | 1,624,426 |
| % | 5.54 | 6.61 | 100 |
| 2010–2011 | |||
| n | 86,683 | 102,520 | 1,561,672 |
| % | 5.55 | 6.56 | 100 |
| 2011–2012 | |||
| n | 104,035 | 111,313 | 1,570,453 |
| % | 6.62 | 7.09 | 100 |
| 2012–2013 | |||
| n | 110,196 | 113,762 | 1,530,265 |
| % | 7.20 | 7.43 | 100 |
| Total sample | |||
| n | 781,610 | 939,092 | 13,080,634 |
| % | 5.98 | 7.18 | 100 |
Note. Author calculations from data provided by the Michigan Department of Education and Center for Educational Performance and Information. SoC = Schools of Choice; PSA = Public School Academy.
Acknowledgements
We are grateful for the assistance with data access and data questions provided by the Michigan Department of Education—in particular, Venessa Keesler, Erika Bolig, and Melissa Bisson at the Michigan Center for Educational Performance and Information. We are also grateful to Christina Macuza, Barbara Schneider, and the Educational Policy Center at Michigan State University for ongoing internal support for this project.
Funding
The author(s) disclosed receipt of the following financial support for the research, authorship, and/or publication of this article: Funding for this project provided in part by the Walton Family Foundation (Cowen) and the Institute of Education Sciences at the U.S Department of Education (Creed).
Disclaimer
This research result used data collected and maintained by the Michigan Department of Education and/or Michigan’s Center for Educational Performance and Information. Results, information, and opinions solely represent the analysis, information, and opinions of the authors and are not endorsed by, or reflect the views or positions of, grantors, Michigan Department of Education, and Center for Educational Performance and Information or any employee thereof.
Notes
Authors
JOSHUA COWEN is associate professor of education policy at Michigan State University. His research interests include student and teacher mobility, school choice, and teacher labor markets.
BENJAMIN CREED is an assistant professor of educational administration at Northern Illinois University. His research interests include school choice and school finance.