
Abstract
In recent years, student surveys have played an increasingly large role in educational research, policy making, and, particularly, accountability efforts. However, research on the accuracy of students’ self-reports about themselves and their education is limited to analyses of overall grade point average and ACT/SAT standardized test scores. Using a unique data set, we investigate the accuracy of students’ survey responses to questions about their course taking and grades in mathematics during high school. We then analyze which student and survey characteristics influence accuracy. We find that students are reasonably good reporters of course-taking patterns but poor reporters of more potentially sensitive questions, including when the student completed Algebra I and the grade earned in the course. We find that lack of accuracy in student survey reports is consistently related to several student characteristics.
Academic researchers and school administrators conduct surveys of students to collect information not available in administrative or other databases. Yet our heavy reliance on student survey data raises questions about their accuracy. While many student survey questions are attitudinal (e.g., “I get nervous in this class”), academic and administrative surveys ask students factual questions about themselves, their classrooms, and their schools. Factual questions are distinguished from attitudinal questions in that they have a clear and correct answer. For example, responses to questions about a student’s overall grade point average (GPA) or whether his or her teacher asks questions during class to be sure that students are following along while he or she teaching could be compared with data from administrative databases or classroom observations. While attitudinal questions query the respondents about their states of mind and thus cannot be verified, responses to factual questions have correct answers and can be independently verified.
This raises an important question: To what extent do K–12 students accurately respond to these types of questions? Despite a growing reliance on students reporting factual information about themselves and their classrooms in school practice and academic research, we know quite little about the accuracy of student self-reports, particularly related to the specific types of questions on which students tend to inaccurately report. The literature in this area is largely confined to comparing self-reports of GPA and standardized test scores with administrative databases. Yet even a cursory review of surveys such as the Tripod 7C and surveys of secondary students conducted by the National Center for Education Statistics that are often used by academic researchers reveals that we ask students many more types of factual questions: questions about themselves, actions that they have taken in schools, and when they took these actions.
The purpose of this study is to use a unique data source to understand more about the ability of students to report factual information when surveyed. We used the High School Longitudinal Study (HSLS:09) to compare student survey responses to questions about their academic records with information from their school course transcript data. To our knowledge, this data source is one of the few available in which students’ survey responses can be compared with administrative databases (which are presumed to be accurate). Prior studies have focused largely on GPA and test score reporting accuracy. This study adds course-taking and specific course grade reporting accuracy to the field’s knowledge of misreporting in student surveys. We also investigate the specific student characteristics that explain reporting accuracy. Our analyses shed light on the extent to which students can accurately report critical academic information beyond the commonly studied GPA and SAT/ACT score.
Prior Research
Accuracy of Self-Reports
It is common practice in education research to use self-reports of student grades in research studies. Since a widely cited meta-analysis by Kuncel, Credé, and Thomas (2005), many researchers have argued that self-reported grades are generally accurate (i.e., Ratelle & Duchesne, 2014) and can be safely used as measures of student performance in studies of educational outcomes and interventions. Today, the practice of using self-reports of grades and scores remains typical even among very well-known researchers writing in the top educational research journals (i.e., Guo, Marsh, Morin, Parker, & Kaur, 2015; Yeager et al., 2016). However, a review of the research over the last 15 years suggests that student self-reports, particularly of factual questions such as GPA and test scores, may suffer from systematic inaccuracy.
Studies of self-reported student data have a fairly lengthy history. Cautionary notes on students’ ability to report grades and test scores accurately were raised early on by Maxwell and Lopus (1994): They found students with below-average grades to be most likely to misreport, and this finding has been frequently replicated over the years. Cassady (2001), in a sample of undergraduate students, found the lowest-performing students (lowest quartile) to be much less accurate reporters than students in higher-performance categories. Zimmerman, Caldwell, and Bernat (2002) found widespread self-reporting inaccuracy and a tendency by lower-performing students to overreport GPA by at least two half grades. Mayer et al. (2007) found systematic overreporting in SAT scores, particularly among lower-scoring students. Cole and Gonyea (2010) investigated reporting accuracy in self-reported ACT scores, finding that when students are inaccurate in reporting their scores, a disproportionate number of them overreport their scores; again, lower-achieving students are much less accurate when reporting their scores.
Despite the issue with misreporting among lower-performing students, early studies on the use of self-reported measures of academic performance offered some hope in that they seemed to demonstrate that self-reports show acceptable accuracy. Cassady (2001) found self-reported GPA in a sample of college students to be accurate, based on correlations between self-reported GPA and official university records (r = .97). The highly influential meta-analysis by Kuncel et al. (2005) revealed that self-reported performance measurements such as GPA and SAT score are generally accurate and can be safely used when administrative data are unavailable.
Recently, researchers have taken a new look at self-reporting accuracy. Caskie, Sutton, and Eckhardt (2014) investigated reporting accuracy in a sample of undergraduates, finding that females on average overreported their actual college GPA and males underreported it but only in the lowest-performing groups. Teye and Peaslee (2015) studied grades and attendance reporting among younger students, finding student reports to be inaccurate, especially among lower-performing children. Schwartz and Beaver (2015) offer some very compelling recent data on self-reporting accuracy, using the National Longitudinal Study of Adolescent Health. The authors found that self-reported GPA was approximately one-half letter grade greater than GPA recorded in administrative databases, and again, inaccuracy was greater for lower-performing students.
One reason why many scholars erroneously conclude that student self-reports are accurate is due to an overreliance on bivariate correlations. Take, for example, the Kuncel et al. (2005) finding that the correlation between actual and self-reported GPA is .82. This relationship sounds robust, until one estimates the percentage of variance in self-reports due to actual GPA. If we regressed students’ self-reported GPA on actual GPA, an r of .82 indicates that the R2 from this regression model would be .67. In other words, actual GPA explains only two-thirds of the variance in self-reported GPA. From this perspective, self-reports appear to contain substantial error. Of course, if this were random error, we would be less concerned, but the literature is clear that this is not the case: There are substantial patterns of overreporting among lower-performing students.
The accuracy of student reports on course taking has been studied much less extensively than grades and test scores. In general, authors seem to have disseminated findings through technical reports. The ACT registration section, which includes items for students to report grades and courses taken, has been used to assess the accuracy of course-taking self-reports. It seems that students taking the ACT report their courses highly accurately: Valiga (1986) found accurate reporting for course taking to be 95%, and Sawyer, Laing, and Houston (1988) found it to be 87%. As recently as 2015 (Sanchez & Buddin, 2015), the ACT data sources have been used, again revealing very high rates (>90%) of course reporting accuracy.
Peer-reviewed articles on the accuracy of self-reporting courses taken seem to be quite rare. Niemi and Smith (2003) provide one notable analysis of course-taking accuracy, using data from the 1994 National Assessment of Educational Progress and the 1994 High School Transcript Study. They found that students dramatically overstated the number of history classes taken and failed to distinguish among different types of history classes. More peer-reviewed work on self-reports of course taking is needed.
Why Self-Reports May Be Inaccurate
Why might students be inaccurate reporters of their academic records? The survey methodology literature offers some insights. Tourangeau, Rips, and Rasinski (2000) developed a model of the survey response process consisting of four major components: comprehension (understanding what is being asked), retrieval (being able to retrieve from memory information import to forming a response), judgment (aggregating all retrieved information and coming up with an answer), and response (the actual reporting of the answer). Error is possible at any of these points during the survey response process.
Retrieval is one area where the response process for students could break down. Retrieval success for academic events will depend on their distinctiveness, when they occurred, and whether respondents are asked to report on events that occurred within specific time boundaries. More distinctive events are more likely to be encoded in memory, which results in their ability to be recalled. One issue with surveys about academic behavior is that much of what we might ask of students is not distinctive, unless it is out of the ordinary. One example is course grades: With so many courses throughout the academic career, students will face difficulties in reporting course grades unless, for example, they usually receive A’s but receive a D or vice versa. Retrieval also depends on the effort put into the retrieval process. Thus, students who have difficulty focusing or are uninterested in the survey topic will likely, on average, devote less time and effort into retrieving the requested information, with subsequent higher error rates.
At the judgment stage, students must take all of the information that they have retrieved from memory and construct an answer. Often memories are not complete, and students will infer an answer from partial memories. If students cannot recall taking a course, they may interpret the lack of memory as having not taken the course and so report a “no” rather than “don’t know” response. Because it is difficult to recall the timing of a particular event, students may guess when they have taken part in an academic activity.
Once respondents have an answer to report, they face two additional decisions: First, they must determine how to map the response onto the response scale provided by the survey; second, they must decide whether to alter the response. The first issue tends to occur with questions that use vague response scales, such as often/very often or agree/strongly agree, where the meanings of the response categories are unclear. The second can occur with any survey question that asks about potentially embarrassing information, with some respondents altering the response to give the socially desirable answer (Duckworth & Yeager, 2015.)
Two other causes of misreporting and inaccuracy could be mischievous or careless behavior among survey respondents, which may be particularly problematic among adolescents. Robinson-Cimpian (2014) defines the mischievous respondent as one who enters responses that she or he thinks are funny (i.e., reporting they are adopted when they are not) or implausibly extreme on items related to, for example, alcohol consumption. One serious issue with the mischievous respondent is the potential impact on subgroup estimates. Robinson-Cimpian shows how a relatively small number of mischievous respondents can introduce bias in subgroup estimates of characteristics such as disabilities and gender identity. By removing the mischievous respondents, he shows how estimates of some characteristics can be changed, suggesting that mischievous responses introduce systematic bias.
Carelessness (random or thoughtless answers) on the survey task can also introduce error, leading to inaccurate survey responses. One common method to identify careless respondents involves introducing survey items specifically designed to uncover carelessness. For example, a survey may introduce nonsense items or may place a series of effort-based questions at the end of the substantive content sections of the survey (Meade & Craig, 2012). These approaches have the downside of lengthening survey administration, so it may be more advisable to correct for carelessness or a lack of survey effort post hoc. An interesting post hoc approach to identifying low-effort survey respondents involves examining item nonresponse. Since it is long established that survey nonresponse is not random (Krosnick & Presser, 2010) and often reflects underlying attributes of survey respondents, Hitt, Trivitt, and Cheng (2016) argue that item missingness can be used as a proxy measure for effort on the survey task. In a study based on 6 nationally representative data sets, Hitt et al. used item missingness as a proxy for effort and conscientiousness, finding the percentage of items skipped on a survey to be a significant predictor of educational outcomes later in life. The clear implication from Hitt et al. is that effort on the survey task, as reflected in item missingness, does reflect something important about the survey respondent.
It seems fairly clear that self-reported student GPA and test scores often appear to suffer from systematic inaccuracy, yet use of self-reported grades in educational research is a fairly standard practice. Recent studies of certain socioemotional outcomes (i.e., Feldman & Kubota, 2015; Guo et al., 2015; Yeager et al., 2016), gender-based motivation in math and science (Diseth, Meland, & Breidablik, 2014; Leaper, Farkas, & Brown, 2012), the effects of working on academic performance (Darolia, 2014), and adjustment in school (Ratelle & Duchesne, 2014) all use self-reported measures of academic performance. The widespread use of self-reported grades and scores is most likely due to the ease and relative inexpensiveness of collecting these data, especially when compared with the challenges of collecting administrative records data. However, it seems necessary to not only renew old cautions about using self-reported measures but better understand why self-reporting inaccuracy on these types of questions seems so common for students. Furthermore, it seems wise to examine different types of questions (i.e., specific course grades and courses taken) commonly posed to students to determine if they, too, suffer from systematic inaccuracy.
Research Questions
Possible sources of error may be present in student self-reporting. While the literature has suggested a potential lack of accuracy in self-reports of GPA and test scores for some time, it has not offered guidance about the data quality of other types of factual questions. In addition to adding new analyses of the accuracy of self-reporting grades based on a unique data set, we seek to contribute to the literature by adding course grades and course taking to the evidence pool on student self-reporting.
Specifically, our paper seeks to answer the following research questions:
Research Question 1: How accurate are student self-reports of courses taken and academic performance?
Research Question 2: Are there systematic patterns in the direction of error? In other words, do students tend to overreport positive outcomes and underreport negative outcomes?
Research Question 3: How do student characteristics and aspects of the survey explain self-report accuracy?
The questions that we address here are critical for research and practice for two reasons. First, one alternative to student self-report data collection is collecting factual information from student transcripts or other administrative records. However, transcript collection tends to be cost prohibitive for most researchers, leaving them little recourse but to rely on self-reported information. For these users of data, more information on self-reporting accuracy would be helpful, specifically on the conditions that lead to higher rates of misreporting (i.e., characteristics of students, questions, and interview setting). Second, student self-reporting has found its way into many state and local accountability systems. It is important for researchers and practitioners to learn much more about the types of self-report information that is more or less accurate. While student surveys proliferate, the field has little evidence to address whether students can self-report accurately, beyond overall GPA and ACT/SAT scores. The results can provide guidance to states and localities considering more reliance on student self-reporting.
Methodology and Descriptive Results
The HSLS:09 is a nationally representative longitudinal study of >23,000 9th graders in U.S secondary schools. The HSLS:09 base-year data collection took place in the 2009–2010 school year and included surveys of students, parents teachers, school counselors, and school administrators. The first follow-up of HSLS:09 took place in 2012, when most sample members were in 11th grade, and it included surveys of students, parents, school counselors, and school administrators. The 2013 update (designed to collect information on the cohort’s postsecondary plans and choices) occurred in the last half of 2013 and included surveys of students and parents. Finally, high school transcripts were collected in the 2013–2014 academic year. At each wave of the study, surveys were conducted electronically (self-administered), by phone, and in person via computer-assisted interviewing methods. The content of the surveys and the transcripts is quite extensive; for further information, see Ingels et al. (2015).
We examined responses to questions about the grades that students received in Algebra I, whether they enrolled in Algebra I, and what other math courses they enrolled in. We focused on math for the following reason. In sorting through the extremely large number of courses taken by students in the HSLS:09 data set, it was clear that math course naming conventions (e.g., Algebra I, Geometry) are simple and standardized across schools. HSLS:09 does include data on science and English language arts course taking. However, science course titles were far less standardized, which we believed introduced a high risk of misidentifying inaccurate respondents. English course titles across the data set were in a very simple sequence corresponding to the student’s grade (English Language Arts I—9th grade, English Language Arts II—10th grade, etc.). We therefore felt that matching rates in English courses could reflect the simple ordering of courses rather than something systematic about students’ ability to report their actual English courses.
The questions and response options are listed in Table 1. Note that we report results using three different waves of the survey: the base year, during the 9th grade; the first follow-up, when most students were in 11th grade; and the second follow-up, when most students were in the 12th grade.
HSLS:09 Survey Questions and Response Options for Mathematics Courses
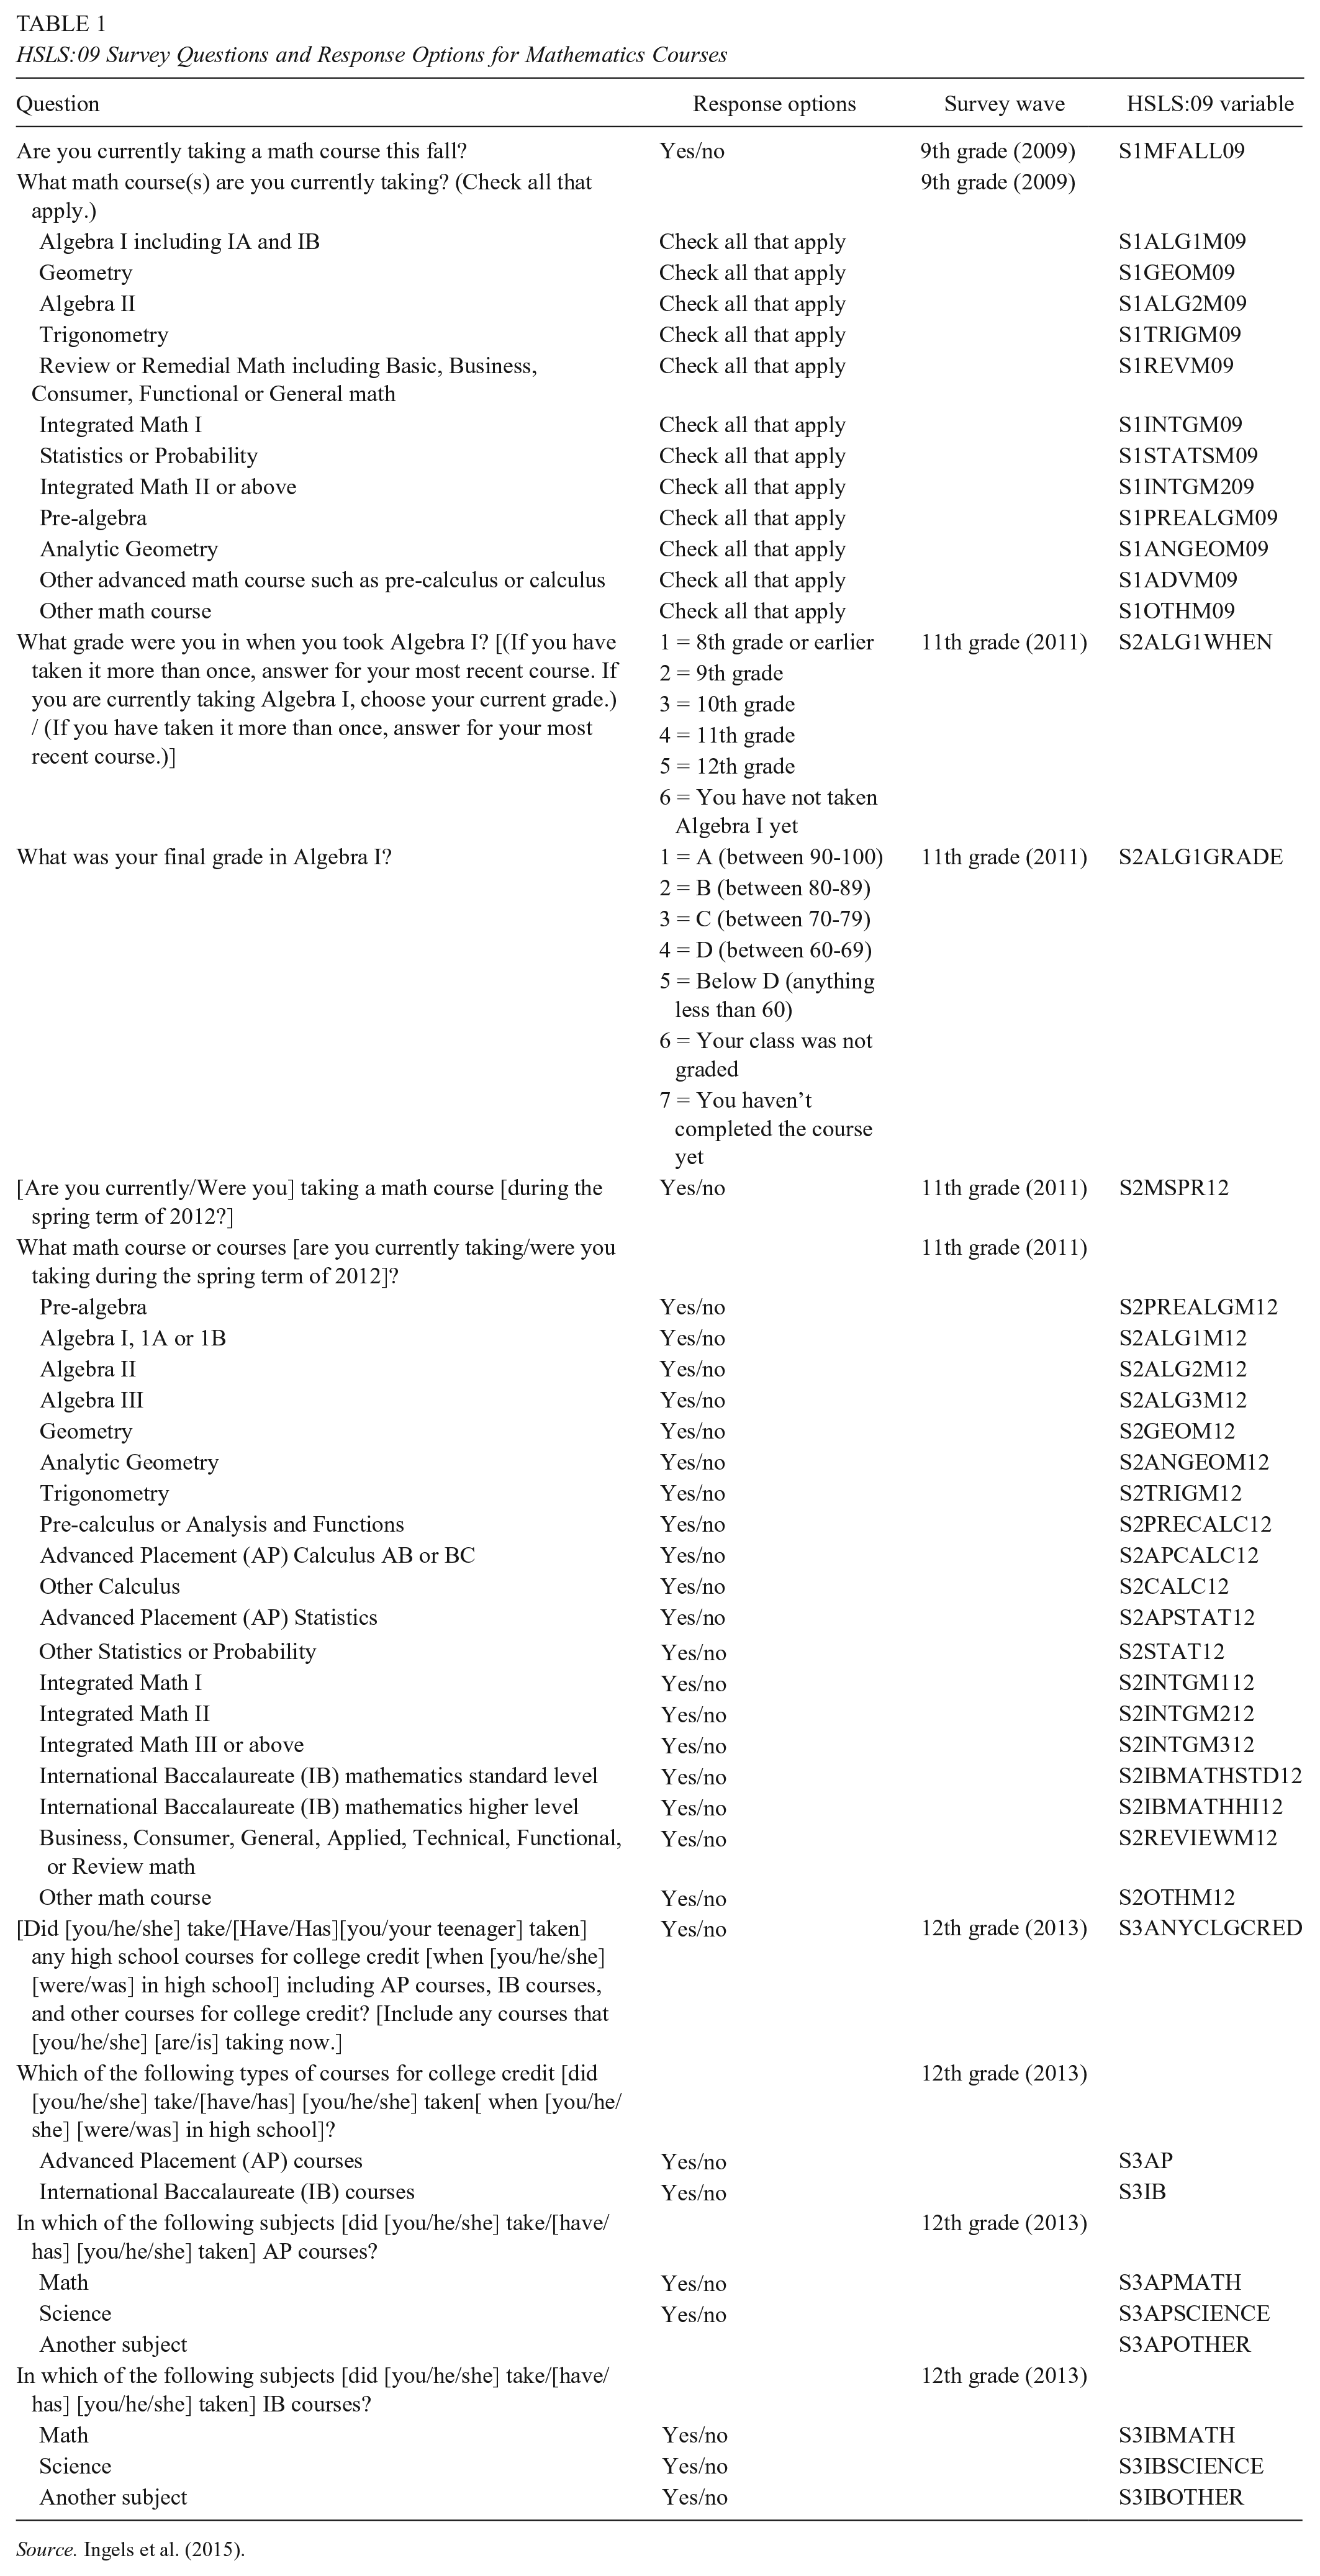
Source. Ingels et al. (2015).
Mathematics Course-Taking Accuracy
To correctly identify student responses as matches, we adopt the following approach. First, we rely on course coding as conducted by the National Center for Education Statistics, in which coders used high school transcripts and high school course catalogs to assign individual HSLS:09 courses a School Courses for the Exchange of Data (SCED) code. SCED is a common classification system for secondary school courses and is updated and maintained by a working group of state and local education agency representatives who receive suggestions and assistance from a wide network of subject matter experts at the national, state, and local levels. In any validity study, what is used for validation is assumed to be correct, and we assume that the course coding was done correctly and that it accurately reflects what courses a student actually took.
Second, we distinguish between general course titles and specific course titles as listed on the student survey. Terms for general course titles, such as “Geometry,” could refer to the specific SCED course title Geometry or to a wide number of courses listed on the SCED, such as Analytic Geometry, Informal Geometry, or Principles of Algebra and Geometry. Students could easily use “Geometry” as a shorthand reference to any of these courses. Conversely, specific course titles, such as Algebra II, refer to specific courses listed on the SCED, and students should have the ability to distinguish such courses from other courses that contain algebra content, such as Principles of Algebra and Geometry.
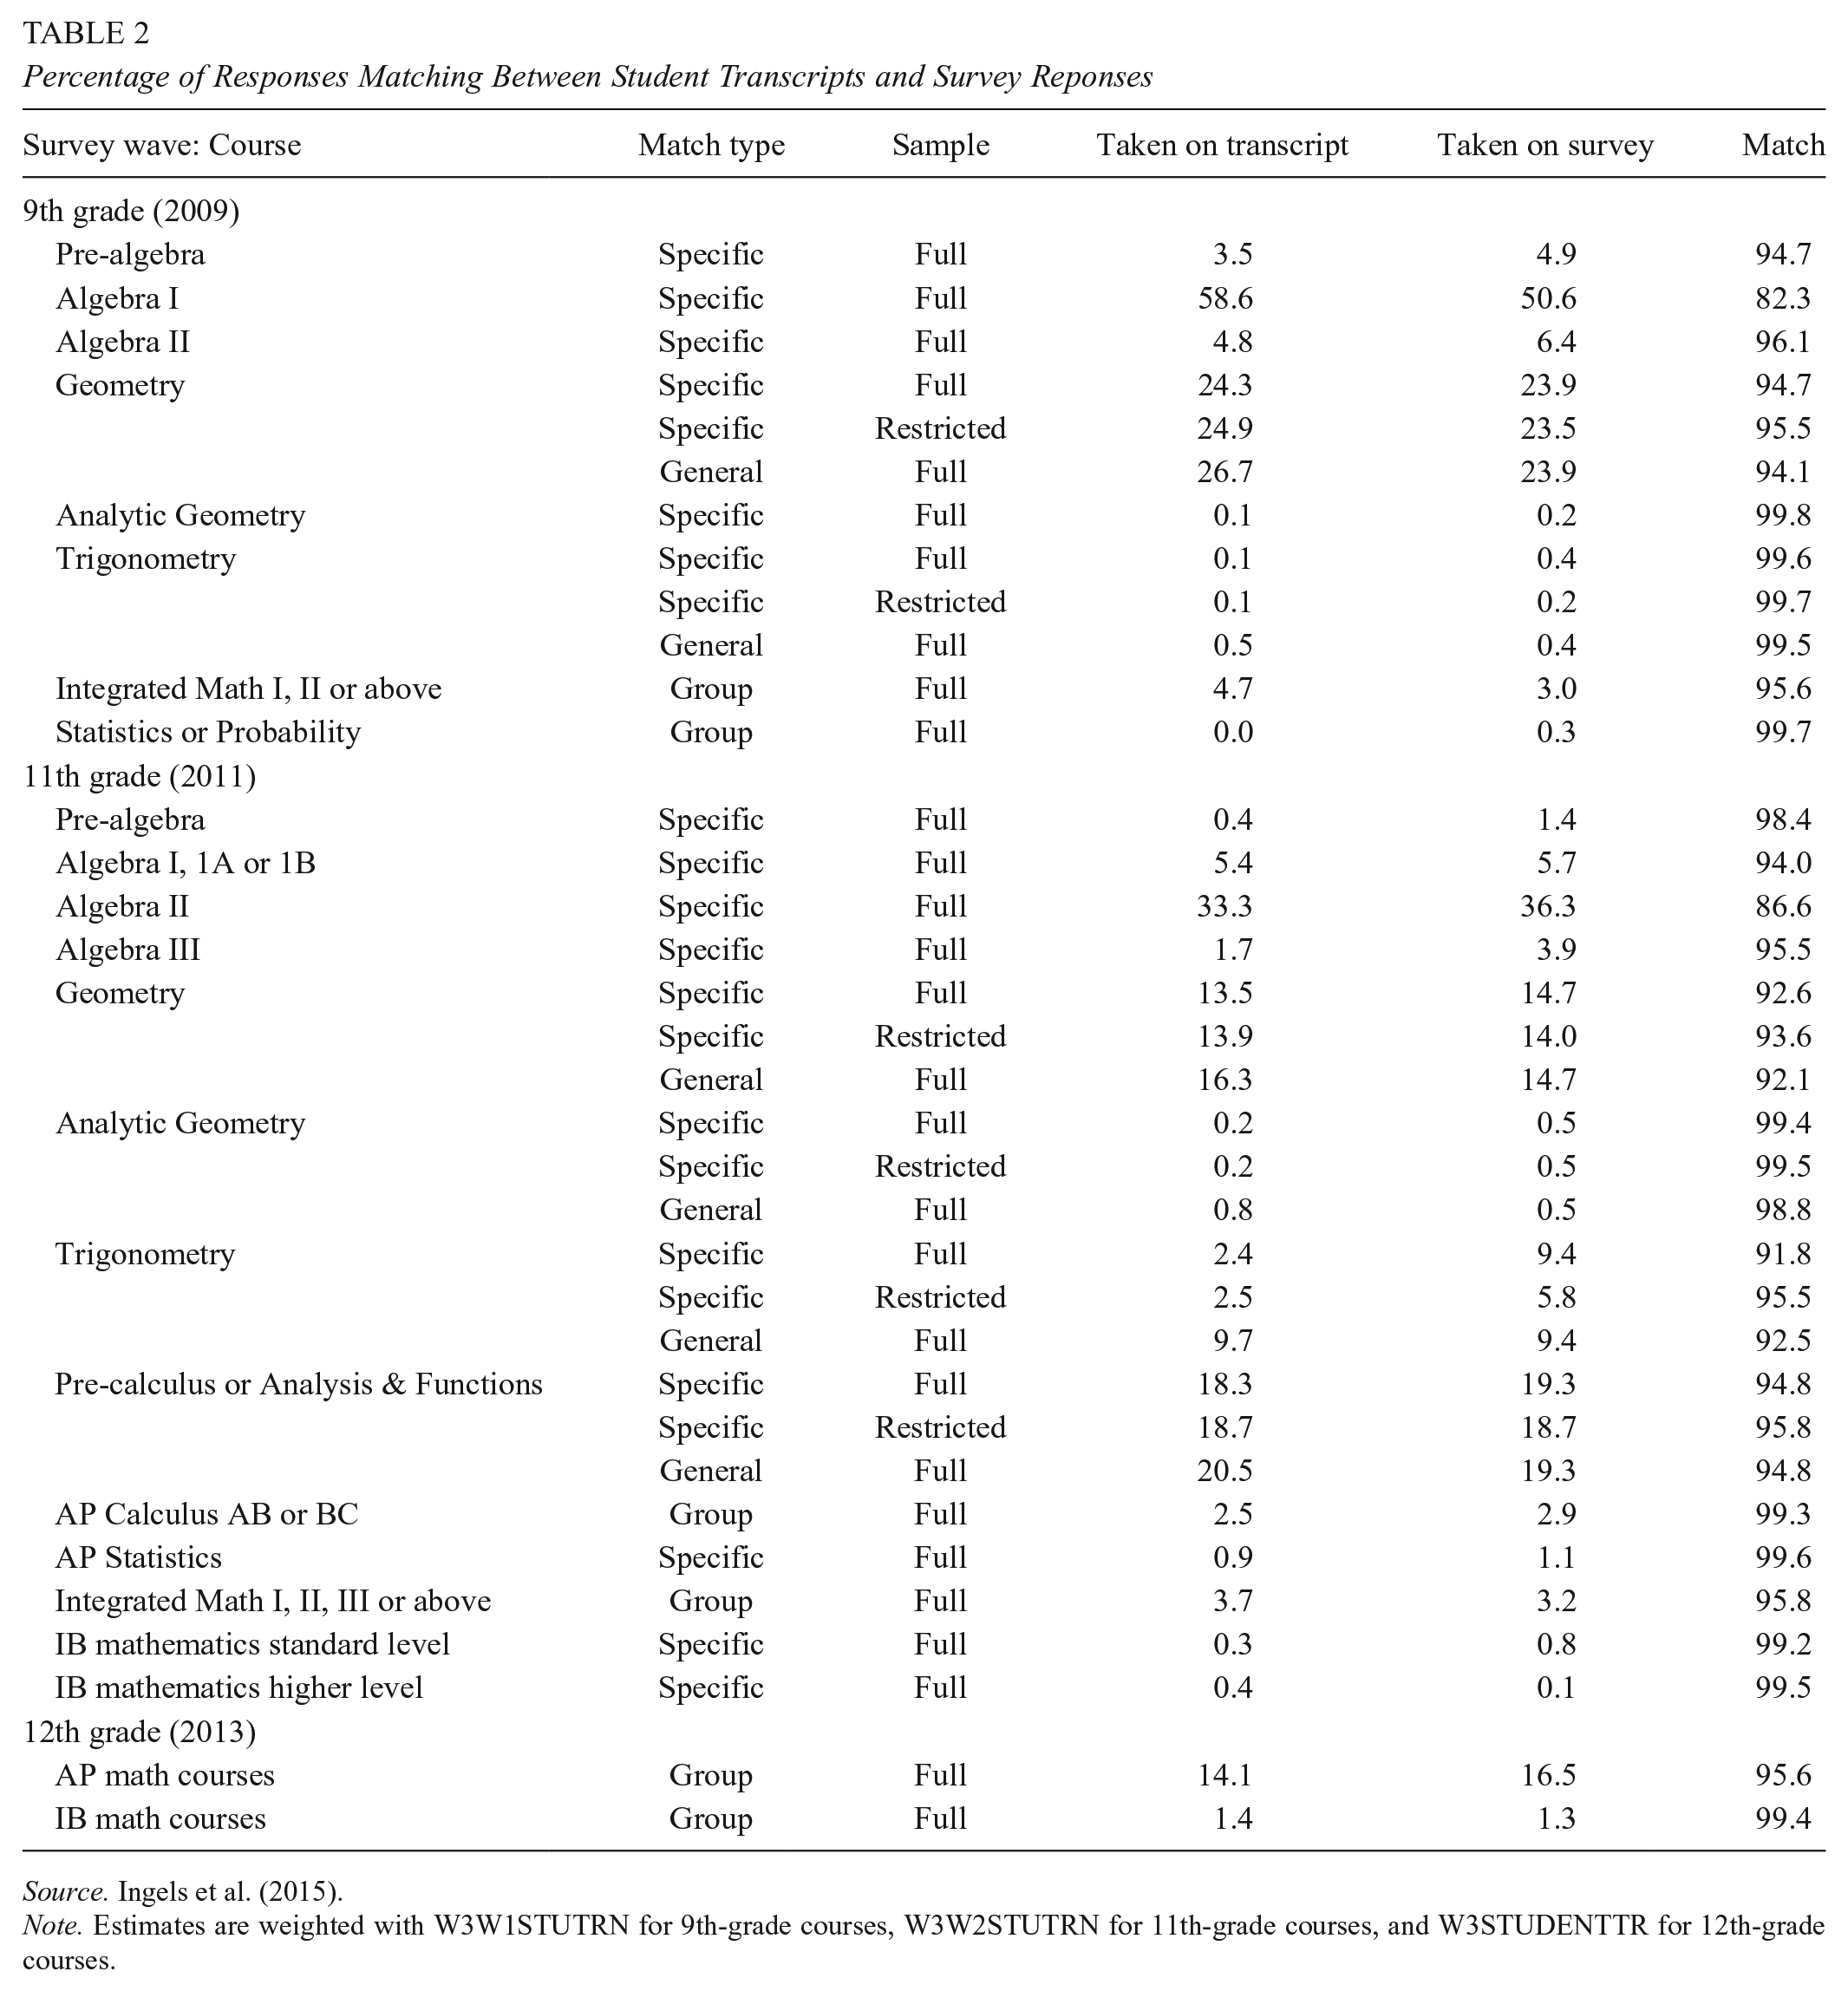
Third, we use the following set of criteria for classifying a student response as correct: (1) For courses on the student interview that have specific course titles, such as Algebra I, student responses are classified as correct only if the corresponding SCED course title appears on the transcript. (2) For responses on the student interview that refer to a group of related courses, such as Statistics or Probability, student responses are classified as correct if they have taken at least one course in the group. In this example, any course with “Statistics” or “Probability” in the SCED title would be coded as a correct response. (3) Finally, we code student responses in three ways for general course titles:
Responses are correct only for the specific course title, based on the full sample of students. For example, a student who checks Geometry on the student interview is coded as having a correct response only if he or she took a course with the specific SCED title of Geometry. In Table 2, this group is reported as a match type of “specific” and “full” sample.
Responses are correct for only the course title, after restricting the sample by removing any student from the analytic data set who took a course with a related title. For example, any student who took a course other than Geometry that contains “Geometry” in the title, such as Informal Geometry, is dropped from the analysis. This provides a measure of accuracy for students who cannot be confused about what course Geometry refers to, as these students took either no Geometry course or only the course with the specific SCED title of Geometry. In Table 2, this group is reported as a match type of “specific” and “restricted” sample.
Responses are correct for any general course title that is related to the student response. Here, any SCED course title containing “Geometry” is coded as a correct response for a student who chooses Geometry on the student interview. In Table 2, this group is reported as a match type of “general” and “full” sample.
Percentage of Responses Matching Between Student Transcripts and Survey Reponses
Source. Ingels et al. (2015).
Note. Estimates are weighted with W3W1STUTRN for 9th-grade courses, W3W2STUTRN for 11th-grade courses, and W3STUDENTTR for 12th-grade courses.
Fourth, some interview responses are so vague that coding them correctly from a student’s point of view is difficult, if not impossible. These are not included in our analysis; some examples are “Review or remedial math including basic, business, consumer, functional or general math” and “Other advanced math course such as pre-calculus or calculus.”
To get a sense of the extent of possible misreporting, we examined match rates for the math courses that students took (see Table 2). The tables show what percentage of students overall took a specific course (based on transcript data), the percentage taking a specific course (based on the student survey), and the percentage of respondents for whom the transcript and self-report response match. For example, transcript data indicate that 3.5% of the sample took pre-algebra, while the student survey data indicate that 4.9% took pre-algebra. Comparing transcripts to student self-reports of course taking reveals that the pre-algebra self-report matches the transcript record of courses taken for 94.7% of the sample.
Most courses have matching rates well above 90%, even though most of the courses enrolled very few sample members. However, for the courses that enrolled the most sample members, such as Algebra I in the 9th grade and Algebra II in the 11th grade, the match rates are somewhat lower—82% and 87%, respectively. So, while the matching rates are high across all the courses that we examined, the most commonly taken courses show somewhat higher rates of mismatch. Overall, students appear to be able to correctly report which courses they have taken in high school.
Algebra I Reporting Accuracy
Students appear to accurately report which courses they have taken, perhaps because courses taken are relatively distinct items that should be easy to recall and report accurately. We next look at two items that should be more difficult to report accurately: the year that Algebra I was taken and the final grade received in the Algebra I course.
In Table 3, the bolded numbers on the diagonal reflect the percentage of cases with matching transcript and student survey data. 4 Percentages that are not bolded reflect mismatches. For example, for students with transcripts indicating that they took Algebra I in the 9th grade, 81% accurately reported as much on the student survey. Across Table 3, for transcripts indicating that Algebra I was taken at the 10th grade or later, students reported it much less accurately, at <50%. It is also notable that students who incorrectly reported when they took Algebra I most often reported that they took the course in the 9th grade.
Weighted Percentage of Student Interviews and Transcripts Matching on Grade When Algebra I Taken, by Grade

Source. Ingels et al. (2015).
Note. Estimates are weighted with W3W2STUTR. Bold indicates the percentage of cases with matching transcript and student survey data (percentages that are not bolded reflect mismatches).
Determining whether students accurately reported their final grade in Algebra I is complicated by the lack of a final grade accounting for every term that the student took the course. Algebra I grades are reported for more than one term on 57% of student transcripts that had at least one term of Algebra I reported. Instead of reporting a single final grade, schools report grades for four quarters, three trimesters, or two semesters such that many students have multiple Algebra I grades on their transcripts. We used the final grade reported on the transcript for matching grades in Algebra I. We believe that students are most likely to accurately recall their final grades as opposed to grades that they receiving during a semester or trimester. 5
In Table 4, the bolded percentages on the diagonal again reflect the percentage of students whose survey response matches what is recorded on their transcript. Students with better grades in Algebra I tend to report more accurately. Of the students who received an A in Algebra I, 83% correctly reported receiving an A on the student survey. The accuracy rates for other transcript grades (B, C, D, below D) decline fairly dramatically, ranging from 20% to 53%. Furthermore and not surprising, students who misreport tend to inflate their grades. For example, of the students who had a transcript grade report of B in Algebra I, 38% reported receiving an A. This pattern is evident among students who received C’s on their transcripts as well. When misreporting, students tended to inflate their grades.
Weighted Percentage of Student Interviews and Transcripts Matching on Grade in Algebra I
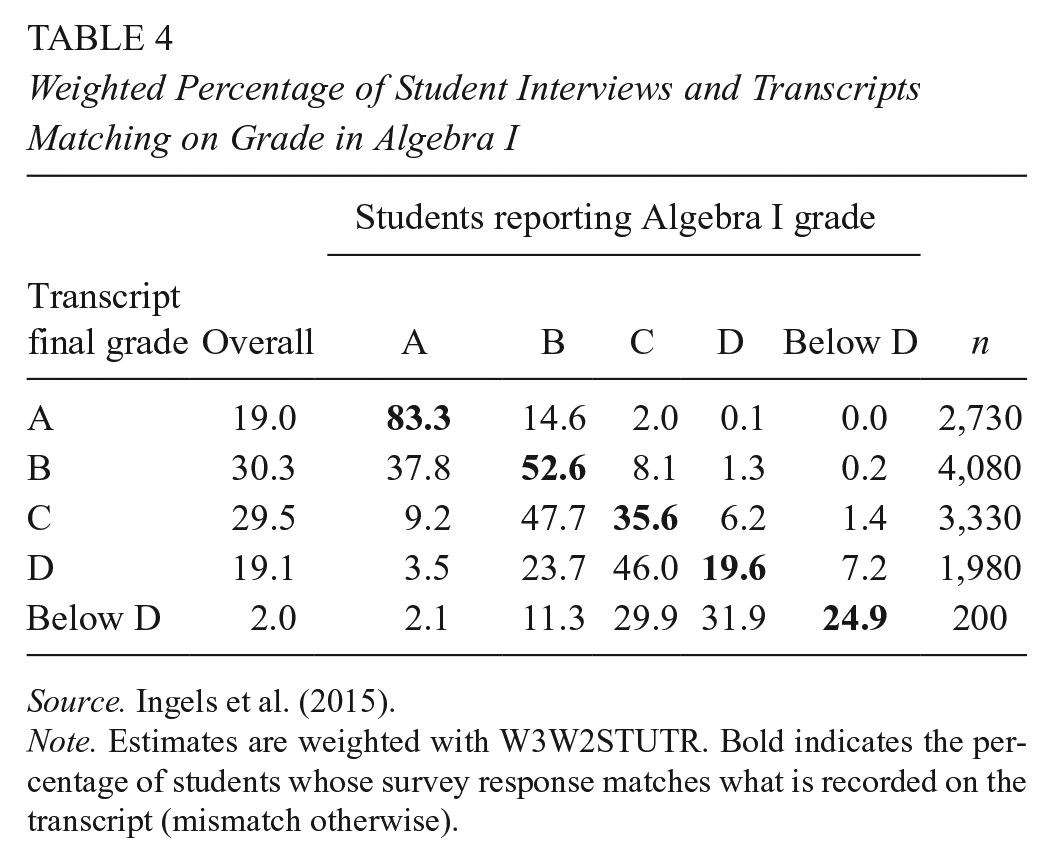
Source. Ingels et al. (2015).
Note. Estimates are weighted with W3W2STUTR. Bold indicates the percentage of students whose survey response matches what is recorded on the transcript (mismatch otherwise).
Multivariate Models
Our descriptive analyses demonstrate that (1) students are reasonably good reporters of their course taking overall, although the most commonly enrolled in courses (Algebra I and Algebra II) show higher rates of misreporting; (2) students who take Algebra I in 10th grade and beyond tend to report inaccurately on the year when they took it; and (3) students with lower grades in Algebra I tend to inaccurately report their grades and, when they do misreport, seem to inflate their academic performance. These results raise the question why misreporting occurs on student surveys. To address this question, we estimate two logistic regression models predicting correct matches between student transcripts and interviews on (1) what grade the student was in when she or he took algebra and (2) the final grade received in the Algebra I course, as reported on the transcript. We used the same set of independent variables for each model.
Independent Variables
Descriptive statistics are presented in Tables 5 and 6.
Descriptives for Independent Variables

Source. Ingels et al. (2015).
Note. Estimates are weighted with W3W2STUTR.
Correlations for Independent Variables
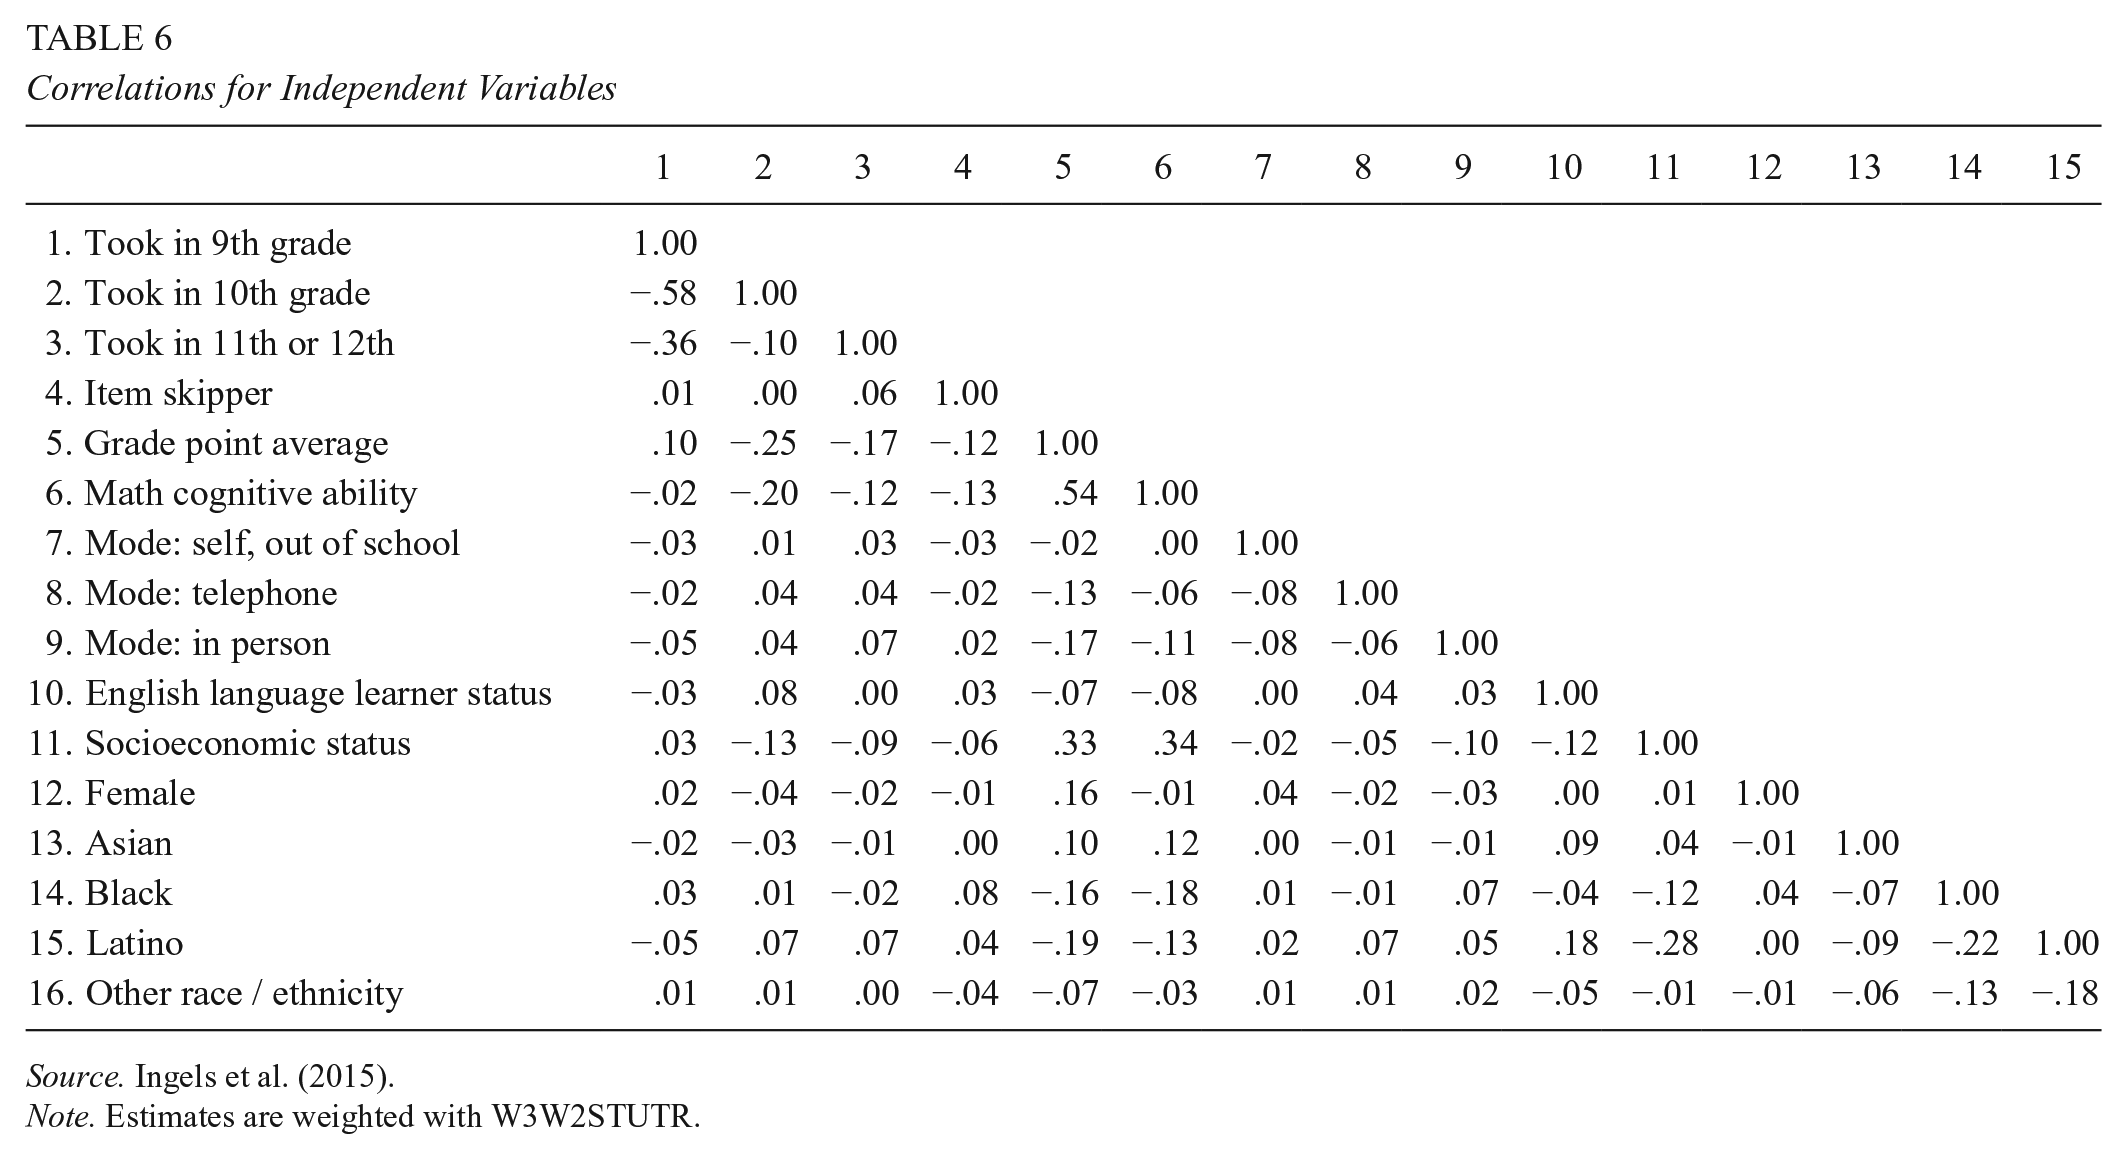
Source. Ingels et al. (2015).
Note. Estimates are weighted with W3W2STUTR.
Cognitive and academic ability
Student ability, in terms of their cognitive ability and their performance in school, could explain their reporting accuracy. We measured cognitive ability with a math assessment 6 and academic ability with the student’s overall GPA as reported on the transcript.
We also include dummy variables for the grade level in which the student took Algebra I. It may be the case that students who took the course most recently would be best able to report accurately.
Conscientiousness on the survey task
Responding to surveys is an effortful task. As discussed previously, Tourangeau et al. (2000) outline a lengthy four-step cognitive process that respondents go through before responding to a survey item. At each point, error can be introduced. Following Hitt et al. (2016), we include the percentage of items that a respondent skips as a measure of conscientiousness on the survey task, where students who answered <90% of items are coded as 1 (0, otherwise). Approximately 6.5% of students answered <90% of survey items. 7
Interview mode
Students were first surveyed in school via computer-based self-administration. If the student failed to participate in the school survey, she or he was then contacted first for a telephone interview and then for an in-person interview. Because the latter two modes introduce a human interviewer into the process, students may react to social desirability effects. Social desirability involves the interviewee providing an answer that makes one “look good.” In self-administered surveys, social desirability should be minimal (for a review, see Weisberg, 2005). The presence of an interviewer (telephone or in person), we expect, may result in social desirability–driven inaccuracy.
English language proficiency
As described by Tourangeau et al. (2000), basic comprehension is required to process survey questions and report accurately. We suspect that English language learners (ELLs) may have more difficulty understanding questions, which may influence their ability to report accurately. However, the survey questions that we examined are fairly straightforward, and status as a limited English speaker may not influence reporting accuracy as much as it would if the survey questions under examination were more complex. The ELL measure used in these models is reported on the student transcript.
Model Results
Table 7 shows the results of the two logistic regression models. For each model, we present the coefficients and the discrete change in the probability of a correct match, for the given amount of change in the independent variable, as indicated in the last column of the table.
Factors Affecting Correct Response for Algebra I Questions: Grade Received and When Taken

Source. Ingels et al. (2015).
Note. Estimates are weighted with W3W2STUTR.
Reference category is “took in 8th grade.”
Reference category is “mode: self, in school.”
Reference category is “white.”
p < .05. **p < .01.
Timing of the event is a strong predictor of accuracy for when the course was taken but not for the overall letter grade. Students who took Algebra I in later grades were 11 to 14 percentage points more accurate than students who took it in the 8th grade.
Our measure of survey engagement also showed mixed results in terms of its effect on accuracy. Item skipping had no statistically significant effect on letter grade accuracy, but item skipping did have an effect on when the course was taken. Students who skipped a large proportion of items were less accurate in reporting when they took Algebra I, by 6 percentage points.
Cognitive ability is a strong predictor of accurate reporting with the student’s transcript-reported GPA and math assessment score. The results are statistically and substantively significant. If a student’s transcript-reported GPA increases by 1 grade point, the probability of accurately reporting the Algebra I grade increases by 18 percentage points, and the probability of accurately reporting when Algebra I was taken increases by 5 percentage points. The corresponding changes for a 1-SD increase in math assessment score are 1 and 4 percentage points, respectively.
Mode effects of the interview are generally negative, as expected, given previous findings in the literature indicating that self-reports tend to be the most accurate when assessed without the presence of a human interviewer or others present. Taking the survey online out of school slightly decreases accuracy for when taken, and this could be due to the presence of family members and friends during survey administration. Conducting the survey by telephone with a human interviewer has a slight negative effect on accuracy, although not statistically significant. Conducting the interview in person reduces accurate reporting on grade received by 8 percentage points, but this is not statistically significant.
We note that these mode effects must be interpreted with caution, because the design of the HSLS:09 changed the interview mode as the number of contacts increased. That is, those students who ended up with the in-person human interviewer were surveyed via this mode because of previous failed attempts to survey them with another mode. While many of the characteristics correlated with refusal to respond, such as academic ability and socioeconomic status, are included in the models, it is possible that the mode effects are picking up unobserved characteristics of students who cooperate with surveys only after many attempts at refusal conversion.
Perhaps the most surprising finding in the table is the positive effect of ELL status, with ELLs more likely to report accurately for grade received (18 percentage points) and when taken (6 percentage points; not statistically significant). After controlling for cognitive ability and survey engagement, socioeconomic status had no effect on accurate reporting.
Discussion
It is reassuring that, in general, reports of course taking seem to contain manageable misreporting. In courses with large cross sections of students (Algebra I and II), match rates are lower, but students seem to be reasonably good reporters of their courses. The slightly lower match rate in courses with broad enrollment (Algebra I and II) is likely driven by the presence of a broader cross section of students in the sample (i.e., higher numbers of lower-ability students). Unfortunately, reports on more sensitive questions—when Algebra I was taken and what grade was received in it—contain much higher rates of error.
While misreporting can affect descriptive statistics, one major question is whether misreporting has an effect on multivariate analyses. That is, does misreporting affect the relationship between, for example, self-reported grades and student outcomes? We estimated a simple model predicting graduation from high school, using item skipping, GPA, math cognitive ability, and demographics. We also included the letter grade and grade taken for Algebra I from the transcript, as well as a variable measuring the discrepancy between the transcript report and the self-report, by subtracting the self-report response from the transcript report. A unit change on this variable indicates a one-unit discrepancy between the two sources of information (e.g., a student reporting an A while the transcript reports a B).
The results of these models are reported in Table 8. The discrepancy variable is statistically significant only in the letter grade–taken model, and it suggests that errors in self-reports are correlated with the probability of graduating from high school. Students who overreport their grades by 1 letter grade have a probability of graduation 1 percentage point lower than students who accurately report; overreporting by 2 letter grades results in a decrease in probability of graduating by almost 3 percentage points. Thus, it appears that error in student self-reports is problematic for descriptive statistics, as might be used by school districts, and for academic researchers estimating multivariate models.
Predicting High School Graduation With Algebra I Responses

Source. Ingels et al. (2015).
Note. Estimates are weighted with W3W2STUTR. Values are presented as B (SE).
Reference category is White.
p < .05. **p < .01.
Similar to previous findings in the literature, our multivariate models confirm that some student characteristics, primarily academic and cognitive ability, are major influencers of inaccurate survey reporting among students. Higher-ability students report more accurately than lower ability students, and this is consistent across both of our models. Since the survey reporting task involves a number of traits and attributes (i.e., conscientiousness, persistence, aptitude) that correlate with cognition and performance school, it is not surprising that cognitive ability and classroom performance would predict accuracy in survey reports. However, the magnitude of the effect is notable. Higher-GPA students are far more accurate reporters, as demonstrated in our multivariate model predicting accuracy in reporting Algebra I grades.
ELLs did not behave as we predicted, nor perhaps as the Tourangeau et al. (2000) model would predict. ELLs were more likely to report their grades accurately than non-ELLs but not more likely to report the grade when they took Algebra I. Theorizing from the Tourangeau et al. model, we expected ELLs to be less likely to report accurately due to potential question comprehension problems. Rather, we found the opposite. Unfortunately, our data do not allow us to investigate this further, and we do suggest that future research examine the intersection of cultural and social forces, language ability, and measurement errors on student surveys.
Inaccurate reporting by students does not appear to be random. In fact, students in our sample may even be making rational choices when they misreport. By application of the Tourangeau et al. (2000) model to the reporting of grades, the response phase gives students a chance to decide if (and how) they should report potentially embarrassing information. A low final grade might be embarrassing for a student to report. When a student erroneously reports a grade, he or she does tend to inflate that grade but perhaps only slightly. For example, C students were more likely to report receiving a B (47.7%) than an A (9.2%). D students were more likely to report a C (46.0%) than a B (23.7%) or an A (3.5%). When the student decides to misreport during the response phase, she or he may make a rational choice to misreport reasonably. Our data do not allow us to investigate this further, but it could be the case that rational decision making goes into the decision to misreport. If this is in fact the case, survey methodologists will need to develop and test methods of control. For example, prompts in the instrument indicating that answers may be cross-checked with transcripts could encourage more accuracy. If students are acting rationally, perhaps they would respond to prompts with more accurate reports.
Systematic patterns of misreporting may be evident in other ways. Students who misreported when they took Algebra I were most likely to report taking the course in 9th grade. This could reveal something systematic about misreporting, such as confusion about the survey question or mischief on behalf of the respondent. We investigated the transcript-recorded courses of students who inaccurately reported taking Algebra I in 9th grade. In 37% of these cases, Algebra I was taken in multiple years (9th and 10th grades) but reported for 9th grade, even when the survey question asked respondents to report the “most recent grade” that they took the course. This pattern may reflect respondent confusion over the question wording. In another 37% of cases that misreported taking Algebra I in 9th grade, the transcripts show the course being completed in the 8th grade and the student enrolled in Geometry or Integrated Math in 9th grade. The remaining 25% of cases have transcripts that show 9th-grade enrollment in Pre-Algebra or some other unclassified math course that may be a lower level than what is typical for 9th grade. This pattern may reflect social desirability bias.
The literature indicates that higher-performing students are fairly accurate self-reporters of distinctive and easily recalled information, such as GPA. However, lower-performing students are often inaccurate when they self-report school performance measures. We sought to determine if this pattern was evident in factual questions that should be easier to recall. As with school performance measures, we found lower-performing students to be less accurate than higher-performing students when they reported on the grade level in which they were enrolled in Algebra I. Remembering whether specific courses were taken should be relatively easy, as opposed to other information about a specific course. Our data show that students can accurately recall and report whether they took Algebra I, but they are much less able to accurately report when they took the course or, especially, how they performed in it. This pattern of results reflects the major obstacle to researchers and administrators seeking to use student self-reported data in their work. Relatively distinctive and easily recalled information lends itself to accurate reporting. But more frequent and mundane events are less likely to be encoded in memory, withdrawn from memory, and accurately reported. Yet it is often these more frequent and mundane behaviors that we wish to have to use in our work.
These results lead us to question the use of many types of questions in student surveys. Many of these questions ask students about frequent mundane events, sometime asking them to report over periods of a year or more. It is vital that, as a field, we establish a firmer research base for the use of these questions before we can begin to use them in our research and accountability efforts.
Footnotes
Notes
Authors
JEFFREY A. ROSEN is a researcher at RTI International. His research interests include data quality in sample surveys, social and emotional learning, and educational interventions for traditionally disadvantaged students.
STEPHEN R. PORTER is professor of higher education in the Department of Educational Leadership, Policy, and Human Development at North Carolina State University, where he teaches courses in educational statistics and causal inference with observational data. His current research focuses on student success, with an emphasis on quasi-experimental methods and survey methods, particularly the validity of college student survey questions.
JIM ROGERS is a senior manager of systems analysis and programming at RTI International. His interests are in probability surveys and data management.