
Abstract
Every-grade, every-year testing plays a prominent part in U.S. education policy and research, but the rise of standardized testing has been met with frustration and opposition. In response, policymakers have proposed legislation designed to curb the amount of standardized testing. There is little empirical evidence, however, about the potential impact of these alternate approaches on current evaluation systems. Using data from a large, urban school district, we compare value-added (VA) estimates from every-year, every-grade testing to those from two reduced-testing scenarios. We find marginal changes in the value-added estimates in both approaches relative to more traditional VA estimates. Estimates from annual testing in alternating subjects are slightly less precise but have lower associations with prior student achievement than biennial testing in both subjects. Further, there is significant decrease in the number of teachers for whom scores can be estimated in both approaches, exacerbating long-standing concerns with VA methodology.
As a side effect, policy changes associated with systematic reduction in standardized testing would have implications for accountability measures based on test scores and the use of those measures for both teacher evaluation and education research. Thus, a relevant question is whether current accountability measures can still function for these purposes if there were to be a reduction in standardized testing.
In this study, we consider two reduced-testing scenarios and examine their effects on value-added (VA) teacher evaluation scores, a common method of using student test score data in current teacher evaluation systems and education research more broadly (Collins & Amrein-Beardsley, 2014). We use empirical data from a large, urban school district to compare VA estimates under the reduced-testing scenarios to VA estimates under the current testing framework. Specifically, we evaluate the impact of the different types of structural missingness induced in each scenario on the relative bias and precision of the estimates compared with estimates using full testing data. This investigation contributes to practical discussions about the impact of policies seeking to reduce testing within the current U.S. teacher evaluation framework and provides guidance on which testing reduction strategies may be the most promising from the perspective of yielding effective VA measures for accountability systems and education research.
We begin by discussing the historical context of testing in the U.S. before turning to a review of the relevant literature on value-added models. Then we discuss our data and methods, followed by a presentation of our results. We conclude with a discussion of the relevant results, limitations of the current study, and the potential implications of our results in light of current accountability policies.
Background
In 1965, President Lyndon B. Johnson signed the Elementary and Secondary Education Act (ESEA) to assist schools serving high concentrations of low-income families. ESEA established $1 billion in Title I funds to increase per-pupil expenditures for disadvantaged students (McGuinn, 2006). Since the original establishment of ESEA, reauthorization bills have passed that reflect the changing education needs of the nation and the political concerns of the time. The two most recent reauthorizations are the No Child Left Behind (NCLB) Act and the Every Student Succeeds Act (ESSA). These reauthorizations along with the federally sponsored Race to the Top (RttT) competition largely shaped modern education accountability systems.
The Incorporation of Student Test Scores Into Teacher Accountability
In 2002, president George W. Bush signed NCLB. The legislation required all states to adopt challenging math and reading content standards and to test all students in Grades 3 through 8 on their mastery of those standards annually. NCLB required that test scores be not only reported for overall school populations but also disaggregated by poverty, race-ethnicity, disability, and limited-English-proficiency subgroups. The purpose of the subgroup reporting was to ensure that each of these groups made progress toward 100% proficiency on state standards by the 2014–2015 school year (USDOE, 2004). The emphasis on closing achievement gaps that exist between groups of students within a school was in pursuit of educational equity for all students at the school level, and the passage of NCLB served as a catalyst for a host of new state accountability frameworks over the next several years. However, these frameworks focused on the use of test data for school-level accountability.
In 2009, the federal government launched the RttT competition. This competition encouraged states to (a) adopt standards that prepare students for college, the workplace, and the global economy as opposed to minimum proficiency standards that were widely being used; (b) build data systems that link student assessment scores to teachers and principals; (c) recruit, develop, and retain effective teachers and principals; and (d) turn around the lowest-achieving schools (USDOE, 2009). States submitted plans that addressed these four areas in an attempt to win part of the $4.35 billion allocated to RttT for implementation of reform programs. One of the requirements for RttT was that measures of student growth be a significant factor in teacher evaluation systems (USDOE, 2009). Although it was an optional competition rather than federal legislation, RttT shifted the focus from school-level accountability to the teacher level in many states. States that applied had to pass legislation requiring student growth be a part of teacher evaluations. For example, Colorado passed Senate Bill 10-191, which requires that half of a teacher’s evaluation rely on measures of student learning over time (Colorado Department of Education, 2013). Such legislative moves effectively tied measures of student growth in teacher evaluation systems to the receipt of federal monies and, according to a report from the National Council on Teacher Quality, as of 2015, forty-three states require that evidence of growth in student achievement play a part in teacher evaluation systems (Doherty & Jacobs, 2015).
President Obama signed ESSA, the most recent reauthorization of ESEA, in 2015. This bill maintains the same NCLB testing requirements but returns authority to the states to design accountability systems for teacher evaluation (Darling-Hammond et al., 2016). Specifically, how states define the methods for teacher evaluation systems will no longer be a condition for receiving federal funding as it was with RttT. Although there is no longer federal incentive to tie teacher evaluations to test score outcomes, many existing teacher evaluation systems rely on test scores as part of teacher evaluations and may continue to do so as substantial time and money was spent designing these systems.
Irrespective of the extent to which states and districts use VA scores for teacher evaluation, the measures are still invaluable for education research. For example, evaluations of professional development programs, teacher preparation programs, and intervention programs have relied on VA scores as important measures of program quality (e.g., Andrabi, Das, Khwaja, & Zajonc, 2011; Biancarosa, Bryk, & Dexter, 2010). Reduced testing scenarios may, therefore, have implications not only for teacher evaluation but also for the evaluation of and research about other educational programs.
Proposed Reduced Testing Policies
In 2014, leaders in New Hampshire proposed a pilot program allowing a small number of districts to administer the state standardized tests only in certain grades (e.g., Grades 4, 6, and 8), which we call “biennial testing,” as long as those districts gave local assessments to students who did not take the state tests (e.g., those in Grades 3, 5, and 7) and “mapped” the results back to the state standards (Klein, 2014). Similarly, in March of 2014, state representatives from New York and Arizona proposed a bill that would test only in certain grades and reduce the number of federally mandated tests from 14 to six. Another bill proposed by a representative from New York calls for students in Grades 3 through 8 to take only one test per year (Klein, 2014). This paradigm, referred to as “staggered testing,” is supported by teachers’ unions and suggests reading tests in Grades, 3, 5, and 7 and math tests in Grades 4, 6, and 8 (Camera, 2014).
Reduced testing bills such as these are under consideration with little to no empirical evidence as to the implications that biennial and staggered testing have for states’ current teacher evaluation frameworks. A reduction in testing may require substantial restructuring of the mechanisms presently used for connecting teacher effectiveness to student outcomes, as it is not clear that the existing systems can function as designed with more limited student testing data. The current study aims to fill this knowledge gap by providing information about the viability of using one existing measure of teacher effectiveness, VA scores, in the context of reducing testing as suggested by these prior bills.
VA Estimates
VA estimates use students’ standardized test scores to provide information about a teacher’s effectiveness. They are interpreted as the average change in student achievement a particular teacher adds or subtracts relative to the achievement that would have been observed had those students instead been assigned to an average teacher in the district (Ehlert, Koedel, Parsons, & Podgursky, 2014; McCaffrey, Lockwood, Koretz, & Hamilton, 2003). There has been considerable debate regarding the use of VA estimates for teacher accountability purposes. We focus here on the impact of missing data in VA models and cover common empirical findings regarding potential bias in VA estimates.
The Impact of Missing Data
From an analytical perspective, testing reduction becomes a missing-data problem—specifically, nonrandom missingness that is predetermined, systematic, and not related to student characteristics. A small body of literature examines the influence of missing data on VA estimates. McCaffrey and Lockwood (2011) investigate the extent to which student absence (i.e., no available scores for a student) affects the recovery of VA estimates for elementary mathematics teachers. They find that missing data seems to have minimal impact on estimated teacher effects despite the fact that missingness is not at random (e.g., missing students tend to be lower achieving). That is, teacher effectiveness estimates in which data are missing at random compared to those in which data are not missing at random correlate at or above 0.98. In another study, Karl, Yang, and Lohr (2013) used flexible correlated random-effects models to jointly model student responses and missing data indicators. Their findings suggest that teacher rankings are sensitive to missing data under some models. However, these observations occurred in evaluations of college calculus classes; evaluations of elementary teachers were similar in nature to the results of McCaffrey and Lockwood. These studies suggest that student-level nonrandom missingness in elementary schools does not greatly change VA estimates.
Bias in VA Estimates
Detecting bias has been one of the main themes of the early VA literature. A major concern with VA scores is that they systematically punish or reward teachers based on the kinds of students they serve. Controlling for prior test scores in VA estimation attempts to remove systematic, preexisting differences between groups of students taught by different teachers that might unfairly influence VA scores. Experimental and quasiexperimental results suggest that VA estimates are largely unbiased after controlling for prior achievement (Chetty, Friedman, & Rockoff, 2014; Kane & Staiger, 2008). Although there is substantial debate on this point (Ehlert et al., 2014; Rothstein, 2010, 2014), Koedel, Mihaly, and Rockoff (2015) argue that those studies with the strongest designs suggest that VA scores are not meaningfully biased.
Controlling for prior achievement is the crux of the argument that VA estimates do not penalize or reward teachers based on the students they serve. In the current study, however, we do not concern ourselves with whether the baseline estimates are biased or not (true teacher effects are unknown in our study). Instead, we focus on whether reduced testing introduces bias in the VA estimates relative to the estimates using the baseline data. Specifically, reduced testing scenarios may severely limit the availability of prior test score data. These weaker prior achievement control variables may not be as effective as protecting against bias as full prior achievement data. Thus, a key concern in the current study is whether structural missingness will have differential implications for teachers serving different types of students.
One measure of bias used in prior literature is the association between VA estimates and other indicators of status (e.g., prior-year means), which are known to be sensitive to VA specifications (Ehlert et al., 2014). Although the true associations between teacher effect and prior-year means are typically unknown, these associations are salient for policy because they have implications for the types of teachers that are ranked as effective by the VA model (Briggs & Domingue, 2011). We, therefore, focus on changes in these associations as a way to characterize the policy-relevant effects of reduced testing scenarios compared to the baseline scenario.
Stability of VA Estimates
A key practical concern for the use of VA estimates in teacher evaluation is the potential for misclassification of teachers. The central issue is that VA estimates are potentially unstable across contexts or model specifications, which would reduce our confidence in the estimates’ ability to differentiate among teachers. For example, Guarino, Reckase, and Wooldridge (2015) compare the misclassification rates between contexts with different amounts of sorting used to assign students to teachers and different model specifications. They found that from 5% to 35% of teachers are misclassified depending on the amount of sorting and VA model specification.
Reduced testing scenarios have the potential to impact VA estimate stability negatively given that they are based on reduced amounts of data. One method for assessing the stability/misclassification of VA estimates is to compare the implied relative ranks of teachers. This has been used extensively to assess the temporal stability of VA estimates (Aaronson, Barrow, & Sander, 2007; McCaffrey, Sass, Lockwood, & Mihaly, 2009). We leverage this type of analysis to identify to what extent reduced testing scenarios might worsen misclassification rates.
Data and Methods
In this section, we present the data used in this analysis, the models used to estimate teacher VA in each scenario, and metrics for evaluating the recovery of VA estimates in both reduced testing scenarios. We performed all analyses using R statistical software, and we use the lme4 package to estimate the relevant models (Bates, Machler, Bolker, & Walker, 2014).
Data
Data for this project come from second- through fifth-grade students in the Los Angeles Unified School District (LAUSD) during the school years from 2006-2007 to 2008-2009. The data include approximately 300,000 students, 11,000 teachers, and just under 500 schools. Test scores come from the California Standards Test and are standardized within grade and year. LAUSD is the second largest school district in the United States; the student population used in this analysis is about 40% English language learners (ELLs), and about 90% are in Title I schools. Student-level demographic variables include sex, ELL status, if the student attends a Title I school, and if the student joined the school after kindergarten (cf. Briggs & Domingue, 2011, for more information regarding the data).
Methods
For our analysis, we specify three models corresponding to each scenario: the baseline scenario, the biennial scenario, and the staggered scenario. We first estimate VA scores for a baseline scenario that represents “business as usual” under current policies and then investigate the effects of the reduced testing scenarios motivated by prior legislative proposals on VA estimates. Relative to the amount of testing required in this baseline approach, each of our alternate testing scenarios (see Figure 1) would reduce the testing burden by half either by the number of years of required testing (biennial) or by the number of tests within each year (staggered).

Tests taken by a prototypical student in each testing scenario.
Baseline scenario: Every-grade every-year testing framework
Under the current testing system mandated by federal policy, we observe test scores in both math and English language arts (ELA) for Grades 2 through 5 for student i. We estimate teacher VA using the random-effects model shown in Equation (1),
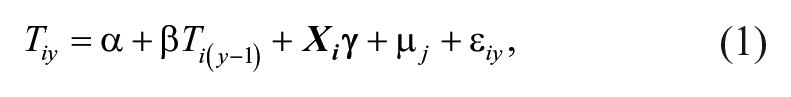
where the outcome variable is student i’s test score (T) in year y.
1
We consider µ
j
from Equation (1) using data in the baseline scenario to be the “true” teacher effect. Note that this is not the unobserved true teacher effect but, rather, what we would estimate given the current testing system within which the VA techniques were developed. Ti(y – 1) indicates student i’s test score in the previous year.
We estimate the baseline model using the six specifications shown in Table 1. First, we analyze data separately by subject and then using scores from both subjects. Second, we estimate models with and without a control for classroom prior means. Note that in the combined data case where we include both ELA and math scores in a single model, we additionally include a subject fixed effect. This model estimates a separate VA score for both subjects for each teacher. The first four models control for student prior achievement in the relevant subject, and the last two models control for prior achievement in both subjects.
Model Specifications

Scenario 1: Biennial testing
In this scenario, testing occurs only every other year (see Figure 1). Thus, we would witness scores for student i in (say) Grades 2 and 4 in elementary school and then again in Grades 6 and 8 in middle school. In this scenario, prior scores from the immediate year are unavailable. Instead, we rely upon scores available from 2 years prior. Note that the correlation between prior achievement from 1 year prior and 2 years prior is about 0.8, suggesting that the twice-lagged score may be a reasonable substitute for the lagged score given the fact that it cuts the testing burden in half. To estimate teacher VA in Scenario 1, we modify Equation (1) as follows:

Specifically, we now include student prior achievement from two years prior to the testing year. Note that although we can estimate teacher effects for the current-year teacher (which we denote µ j to remain consistent with Equation [1]), there are no estimates for the effectiveness for the teachers in the nontested year. 2 We again use the six specifications outlined in Table 1 (where class prior means are now from 2 years prior).
Scenario 2: Staggered testing
We finally consider a scenario in which testing occurs annually for all students in alternating subjects. For example, as depicted in Figure 1, we might observe math scores for student i in Grades 2 and 4 and reading scores for student i in Grades 3 and 5. Similar to the current system, we have a test score in Grades 2 through 5 for every student i but only from a single subject in each grade. Consequently, we now allow the prior achievement to come from the alternate subject (which we emphasize as s′ in Equation [3]) in the prior year. The correlation between prior achievement in reading and prior achievement in math is roughly 0.8. This relatively high correlation again suggests that it may be a reasonable proxy for in-subject prior score given that it allows for a reduction by half of the testing burden. Scenario 2 is modeled with Equation (3):

We consider only two specifications of this model—one with and one without classroom prior means (constructed from data in the opposite subject)—because Equation (3) uses both subjects.
Metrics
To understand the recovery of VA estimates under reduced testing scenarios, we use four metrics:
Correlation between estimated teacher effects in each reduced testing scenario and the baseline scenario. Previous research used this metric as an estimate of the intertemporal reliability of the measures (McCaffrey et al., 2009). These correlations should be relatively high given the strong correlations (~0.8) between the control variables in the reduced and baseline scenarios and because the models have the same outcome variable.
Correlation between estimated teacher effects in each testing scenario and prior student achievement. This provides information regarding exacerbations in the relationship between VA estimates and the types of students a teacher serves and has been used as a measure of bias in previous literature describe above (Ehlert et al., 2014; Lockwood & McCaffrey, 2014). As in prior research, we do not expect to see large shifts in these correlations.
Ratio of the standard deviations of the teacher effects (reduced testing scenario / baseline scenario). We hypothesize that these ratios will generally be greater than 1 given that we are using slightly weaker control variables (thus leaving additional variance in the outcome to be explained by teacher effects).
Ratio of the mean standard errors of the estimates (reduced testing scenario / baseline scenario). Given that each teacher effect is estimated on the basis of fewer data, we expect a ratio greater than 1 for each reduced testing scenario (thus indicating lower precision of the reduced testing scenario estimates).
To focus on practical consequence, we also examine transition tables of teacher classifications based on VA estimates. In operational accountability systems, teachers are often placed into one of several effectiveness categories using their VA scores (Diaz-Bilello & Briggs, 2014). We create three categories, one of the more common approaches to teacher classifications (Diaz-Bilello & Briggs, 2014), using the 95% confidence interval of the teacher estimates. The lowest category contains those teachers whose confidence intervals lie entirely below the 35th percentile of the observed effect distribution, and the highest category contains those teachers whose confidence intervals lie entirely above the 65th percentile of the observed effect distribution. Along with these transition tables, we identify the mean prior achievement of students for those teachers whose classifications change in reduced testing scenarios. This metric provides insight into the extent to which VA estimates calculated with reduced prior achievement information might lead to systematic bias.
Results
Model Parameters
We first consider parameter estimates from all models. Table 2 contains the estimates that are most salient to the specific questions of this study (all estimates reported in the online supplementary information [SI] of this article). Consider first the baseline model estimates. The baseline parameter estimates for prior achievement here are consistent with those observed in earlier work using this data (Briggs & Domingue, 2011), roughly 0.7. In both the alternate testing scenarios, we see the same parameter, with a magnitude ranging from 0.6 to 0.7. This attenuation, although not huge, may have implications as a larger amount of the variation in student achievement is now available to be attributed to teachers. 3 Going from the baseline to the reduced testing scenarios, the reduction in the parameter associated with the prior score leads to inflation in both residual variance as well as the variance in teacher effects. The lower predictive ability of prior achievement is expected given the weaker prior achievement variables. We further investigate the implications of these alternate predictor variables through the metrics defined above.
Key Model Parameters

Comparison of VA Estimates
Pearson correlations between the current-year teacher estimate in the biennial testing scenario and the baseline scenario are about 0.8 (Figure 2). 4 In the staggered testing scenario, we see VA correlations to the baseline model slightly higher, at nearly 0.9. These correlations suggest that the inferences drawn about individual teacher ability will be largely similar in the reduced testing scenarios as compared to baseline. However, there may yet be structural differences in terms of how the VA estimates relate to other variables. We examine this issue via correlations with prior achievement.

Comparison of correlations to baseline across models.
Correlations between VA estimates and classroom mean prior achievement in the baseline scenario range from about 0.2 to 0.3 for math, reading, and both subjects combined both with and without the controls for classroom mean prior achievement, often referred to as “peer effects” (Raudenbush & Willms, 1995; see Figure 3). These are similar to those found in prior research. Ehlert et al. (2014) found correlations between VA scores and prior achievement to range from about 0.2 to 0.4 with every-year, every-grade testing. We obtain qualitatively similar results from the biennial and staggered approaches, with correlations ranging from 0.19 to 0.36. As expected, the correlations are larger in the models without the prior class mean. Figure 3 also indicates that these correlations are consistently larger in the biennial scenario compared to the staggered scenario. 5

Comparison of correlations to prior achievement across models.
Next, we consider the ratio of the standard deviation of the teacher effects. These ratios are approximately 1.1 to 1.2 for the biennial scenario and approximately 1.4 to 1.5 for the staggered approach (see Figure 4). Although we see an increase in standard deviations in both reduced testing scenarios, the standard deviation in the biennial approach is more comparable to the baseline scenario. These findings suggest that controlling for prior achievement from the alternate subject leaves more variability to the teacher effects than controlling for the same subject 2 years prior, albeit the difference is modest. In other words, as opposed to the correlational evidence above, the biennial approach is more similar to the baseline than the staggered approach with respect to teacher effect variances.
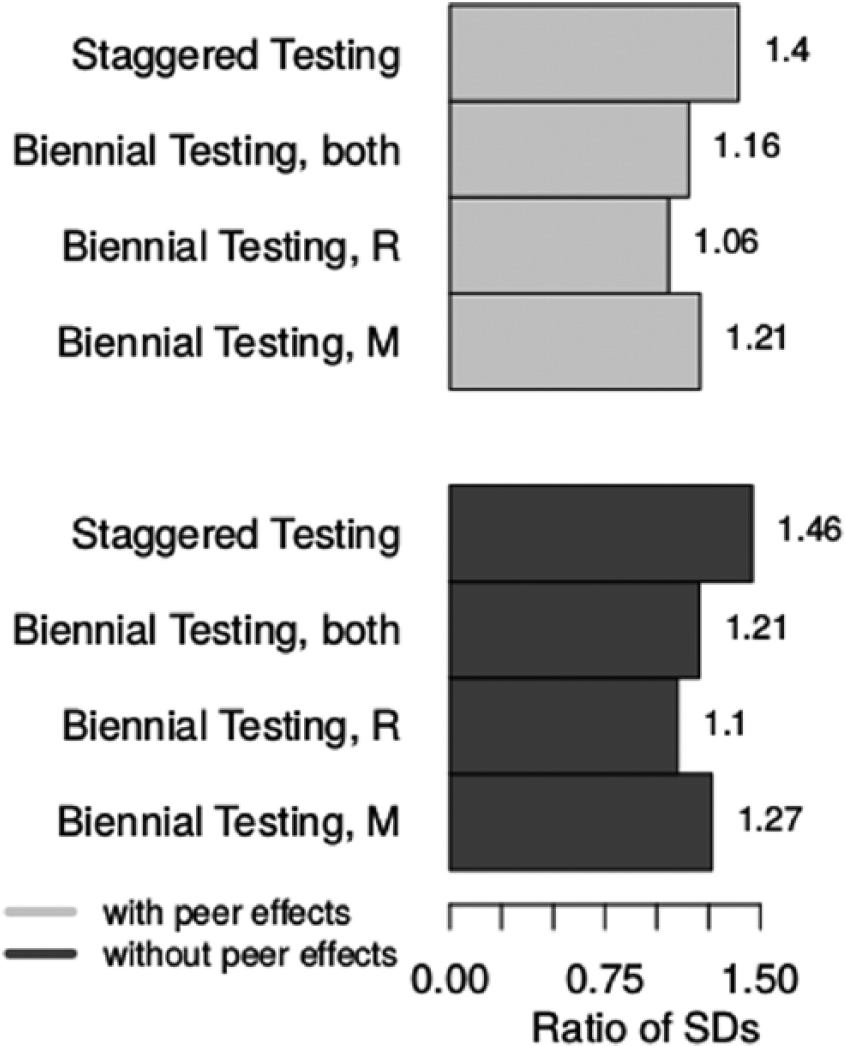
Comparison of standard deviation ratios across models.
The reduced testing scenarios had relatively small effects on the variance of the teacher effects, but the data reduction has a clear impact on the precision of our estimates. Figure 5 illustrates the substantially inflated standard errors in the reduced testing scenarios compared to baseline. In the biennial approach, standard errors are approximately twice as large as in the baseline. This inflation is even more dramatic in the staggered approach, with standard errors closer to two-and-a-half times as large. The substantially higher standard errors suggest that the VA scores recovered under the reduced testing scenarios are far less precise than the baseline. This has consequences for administrative uses of VA scores, such as placing teachers in effectiveness categories, discussed in more detail below.
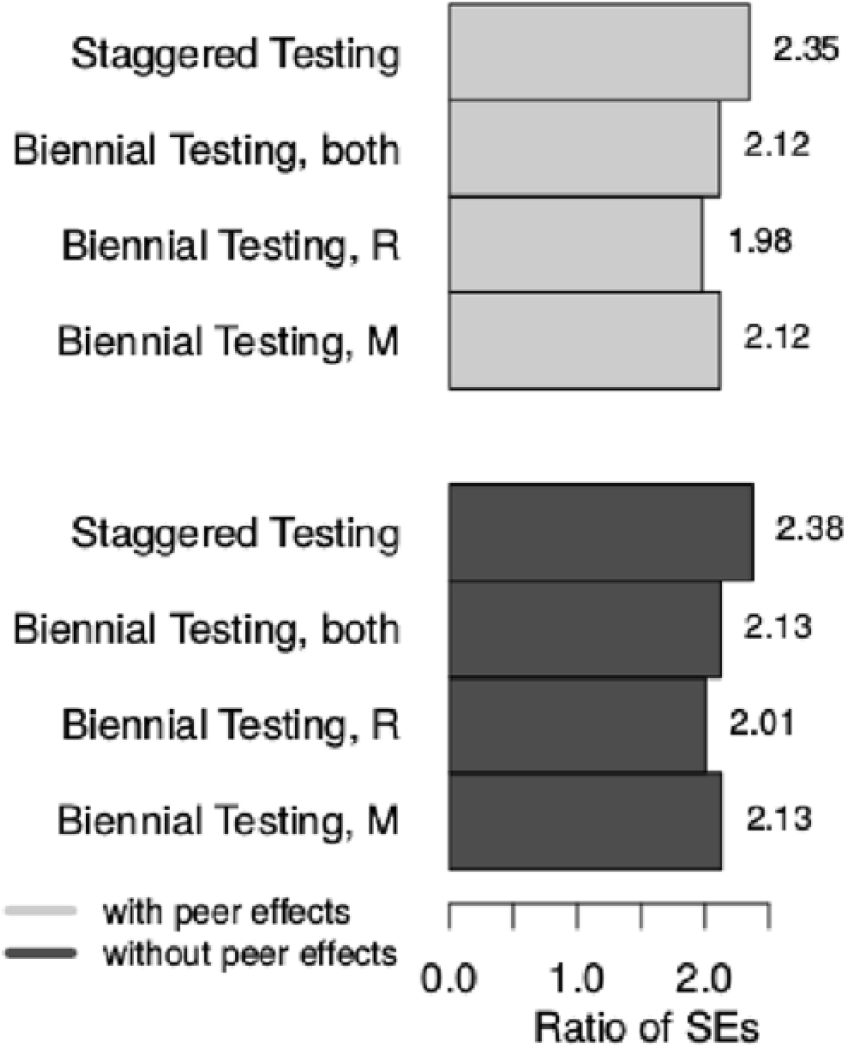
Comparison of standard error ratios across models.
Comparison of Teacher Classifications
We now consider the practical implications of the decreased precision resulting from estimating VA scores with reduced data. Specifically, we identify teacher classifications into performance categories. Recall that placement into the highest and lowest categories happens if and only if the confidence interval around VA scores lies entirely above or below the 65th and 35th percentiles, respectively. In this scenario, inflated standard errors from the reduced testing scenarios may have practical ramifications. When confidence intervals around an estimate are larger, it is likely that a larger number of teachers will fall into the middle category, as it may become harder to identify which teachers truly belong in the more extreme categories.
Cross-tabulations of scores from reduced scenarios as compared to baseline appear in Table 3. Despite the larger increase in the size of the standard errors in the staggered approach, the classifications across both reduced testing scenarios are comparable relative to baseline. Approximately 70% of teachers kept their same categorization under biennial and baseline testing, whereas that figure is slightly higher, 73%, under the staggered approach. We also see that <1% of teachers shift two categorizations in the staggered approach, whereas about 2% make this large of a shift in the biennial approach. (We also consider a five-categorization approach in the SI. Results are roughly comparable.) These results are not unlike those of prior researchers who investigated shifts in teacher classifications either across years or between VA model specifications (e.g., Aaronson et al., 2007; Guarino et al., 2015).
Comparative Percentage of Teacher Classifications (Three Category)

Although the rates of teachers changing categories relative to baseline are fairly similar under the two reduced testing scenarios, we do observe small differences in which kinds of teachers move categories. In the biennial approach, we find that teachers who move up one or more classification bins have an average mean classroom prior achievement of 0.12, and those teachers who move down one or more classification bins have an average mean classroom prior achievement of –0.08. In contrast, we find that those teachers who move up at least one category in the staggered testing scenario have an average mean prior achievement of about 0.10, and those teachers who move down have an average mean prior achievement of about 0.05. Under the biennial approach, teachers with students who have lower prior ability are more likely to move down in category, whereas those with higher prior ability are more likely to move up. This is consistent with our findings presented in Figure 3 indicating that the staggered testing approach has lower correlations with prior achievement than the biennial approach. Despite the small magnitude of these mean prior achievement values, this is a concern as it is evidence that the biennial approach to reduced testing might reintroduce bias into the ways VA scores are used for evaluative purposes. 6
Discussion
Although reduced testing scenarios have been suggested in various forums, there is no extant empirical evidence regarding the implications of reduced testing scenarios for current accountability systems or research studies designed around every-year every-grade testing. In this paper, we analyze effects on accountability systems of two approaches to reduce standardized testing: biennial testing and staggered testing. Each of the alternate scenarios yields a lightened testing burden, but at the cost of various forms of missing data.
Traditional VA scores control for prior-year achievement as a way of protecting against bias due to the types of students assigned to a teacher. The reduced testing scenarios still control for prior achievement, but those controls are compromised relative to the every-subject, every-year prior-achievement data that are currently available (at least in some grades). A VA model with no prior achievement effectually estimates VA scores based on the average current-year score of a teacher’s students. Such estimates are obviously biased, as VA scores will tend to unfairly reward teachers who are assigned to high-achieving students and similarly penalize those assigned to teach low-achieving students. Under reduced testing scenarios, the VA is closer to this null model because the prior-achievement variables are inferior relative to the status quo. Additionally, the missing data have a clear impact on the precision of teacher effects, as both reduced testing scenarios lead to estimates with much larger model standard errors relative to estimates from the baseline scenario. This results in less ability to place teachers into the most extreme effectiveness categories with confidence. Under the biennial approach, those teachers who move up in classifications have classrooms with higher mean prior achievement, and those who move down have lower mean prior achievement, on average. The magnitude of these relationships is modest, but it is possible that this type of reduced testing scenario may reintroduce some systematic bias of practical importance due to the degradation of the prior student achievement controls. However, the staggered scenario does not appear to suffer from the same potential systematic relationships. Although the staggered approach produced the least precise estimates, these estimates also had higher correlations with the baseline model and more consistent teacher classifications. We think this is a case where trading some precision for reduced bias may be appropriate.
Another important consideration of reduced testing scenarios is the number of teachers for which VA estimates would apply. A common critique of current evaluation systems based on test scores is that the proportion of teachers for whom the policies apply is small (Baker et al., 2010). The biennial and staggered approaches considered in this analysis worsen an already pressing issue with test-based accountability systems. The biennial approach adds half of the elementary teachers who currently have accountability data to the ranks of teachers in nontested grades; staggering subjects also limits the number of teachers for which accountability data will be available—particularly at the secondary level, when teachers more often tend to be subject matter specialists. However, at the elementary level, where teachers traditionally provide instruction in multiple subjects to the same group of students, the impact on the number of teachers for which test data are available is relatively the same as in every-grade, every-year testing.
Limitations and Further Considerations
The absence of discussion regarding student growth percentiles (SGPs) in this analysis is obvious given the widespread use of this method of test-based accountability (Betebenner, 2009). The main difference in terms of data usage between VA and SGP estimates is that SGPs typically use all available student test scores, not just a single prior year as in most VA models. Our reduced testing scenarios restrict the number of previous test scores that would be available. As a result, we expect that the reduction in the number of tests would leave SGPs potentially looking more similar to VA estimates. Furthermore, research suggests that differences between SGP and VA estimates are less important than other issues—the choice of mean- or median-based aggregates (Castellano & Ho, 2015) or the degree of observed sorting (Guarino, Reckase, Stacy, & Wooldridge, 2015)—and the differences between estimators that do exist seem largely unrelated to student characteristics (Walsh & Isenberg, 2015). There may be additional concerns for the use of SGPs in the context of substantially reduced testing; we leave such questions to future researchers.
Further, we do not consider the influence of the opt-out movement on teacher accountability efforts. At present, there is a dearth of knowledge currently available on the types of students who tend to opt out. At present, the most extensive information exists at a broad school level rather than at the student level (Chingos, 2015). The limited intersection of the information publicly available about the types of students who opt out and our current data set precludes any sensible analysis regarding the relationship between the opt-out movement and VA scores. The structural missingness considered in this analysis may interact with the nonrandom missingness caused by the opt-out movement or other factors. For example, if students who opt out of testing are predominantly in certain grades or subjects, then either approach here would include a systematically biased group of students. Careful attention must be paid to who opts out of standardized assessments in each local context and whether the quantities and characteristics of these individuals change over time. Analyses such as ours should be applied to data in which rich information is available about opt-out participants so that the interaction between these sources of missingness can be analyzed and further understood.
Finally, there is an important technical consideration in the estimation of VA models not directly addressed here. Measurement error in the right-hand-side test scores from Equations (1) through (3) can lead to attenuation bias. Prior research shows such bias may have implications for both VA estimates (Lockwood & McCaffrey, 2014) as well as alternative approaches to using achievement data for teacher accountability (Shang, 2012). Potential approaches for correcting the relevant estimates for measurement error do exist (e.g., Lockwood & McCaffrey, 2014), but they are computationally intensive and require estimates of the measurement error in student test scores. We do not consider such adjustments, as many existing accountability systems do not currently correct for measurement error. As such, our estimates are more reflective of what districts and states might expect to see when implementing a reduced testing scenario.
Conclusion
Should states and districts decide to reallocate time from testing to teaching, students will likely be the beneficiaries, and such a shift will potentially assuage the concerns of those currently leading movements to reduce the testing burden. However, transitioning to a reduced testing framework has implications for the bias and precision of VA estimates that policymakers should take in to account if the estimates would still be used for teacher accountability or education evaluation purposes. Encouragingly, the testing burden is significantly lifted for students in these reduced testing scenarios, and the results are not substantively different from prior research regarding VA estimates with full samples. Specifically, the recovery of VA estimates is reasonably accurate, and their relationship with student-level variables is similar to that found in prior literature. However, reduced testing exacerbates three key concerns regarding the use of VA. First, we are less certain about our estimates of teacher effectiveness. Second, the number of teachers for whom scores can be estimated is halved in one approach. Finally, teachers assigned to higher-performing students have more favorable categorizations under one approach.
With these results in hand, the question then becomes, do the benefits outweigh the costs of reducing testing? We argue that any answer should be context dependent. Costs, relative to the benefit of reducing the testing burden, may not be worthwhile in high-stakes teacher evaluations. The impact of teacher misclassification would be too consequential if rewards or sanctions were tied to these estimates. However, in other contexts where VA is only a small part of teacher evaluation, these issues may not drastically change its use and contribution to teacher evaluations.
We discuss two considerations that policymakers could draw from this research. First, districts should consider analyses similar to ours to gain insight into how these approaches might play out in their specific local context. For example, we present teacher categorizations with both three and five classifications and find reasonable consistency in teacher classifications and little evidence of strong bias against teachers who serve lower-achieving students. There might be more or less stability in a local context based on the covariates included in the VA model for a district. Information such as this will be important for implementing a reduced testing approach.
Second, the application of reduced testing environments, such as those suggested here, to teacher accountability systems should be used with careful consideration. As shown in this analysis, some reduced testing scenarios may yield VA estimates that are relatively close to those found with full testing data. However, differences—in noise, in bias, and in the teachers for whom VA can be estimated—have practical consequences that should be considered when planning the uses of testing data.
It may be the case that data from reduced testing scenarios may be insufficient in quality to continue as the basis for teacher accountability systems, but that does not preclude the use of such data for education evaluation research and perhaps even school-level accountability measures, such as those in place prior to RttT. However, if the choice is made to enact a reduced testing scenario, we suggest using reduced-testing VA scores in conjunction with other evidence of teacher effectiveness, especially when high-stakes decisions are under consideration. For example, in the staggered subjects approach, teachers who provide instruction on multiple subjects would have testing information for only one subject. In this case, the VA estimate may be misleading, particularly if a teacher is stronger in one area of instruction. In situations such as this, districts should consider pairing VA estimates with other information, such as observation scores and student surveys, to ensure appropriate representation of teacher effectiveness. This has been suggested by other researchers in prior contexts (e.g., Kane, McCaffrey, Miller, & Staiger, 2013; McCaffrey et al., 2003), but we emphasize the need for such checks and balances when reduced testing scenarios are the basis of the VA scores.
Beyond the practical considerations of the impact of reduced testing to teacher evaluations, we also suggest that policymakers consider unintended consequences. One unfortunate aspect of NCLB accountability policies was the focus on “bubble kids” (Booher-Jennings, 2005; Ho, 2008). Because, from certain accountability perspectives, the only thing that mattered was whether a student was “proficient” or not, schools and teachers were incentivized to focus on those students most easily moved from not proficient to proficient. In the context of reduced testing, biennial testing may simply lead to a shuffling of resources so that schools focus on tested grades. Similarly, staggered testing might lead to math or ELA being pushed out of the curriculum in nontested years, as is seen with science and history in many contexts under current testing systems. Recent changes to standards may help to protect against these perverse incentives, as they focus more on development of sophisticated understanding of concepts over time (Briggs, 2016). However, policymakers should still be cautious when considering reduced testing scenarios. Reducing testing will impact how state accountability systems and education program evaluations function, and if all are to coexist, further work must be done to investigate how best to reduce testing. It is important for policymakers to consider any available information regarding reduced testing scenarios prior to enacting them within accountability frameworks or evaluation contexts in which personnel or policy decisions are made, at least in part, based on testing outcomes.
Footnotes
Acknowledgements
The research reported here was supported by the Institute of Education Sciences, U.S. Department of Education, through Grant R305B090016 to the Board of Trustees of the Leland Stanford Junior University. The opinions expressed are those of the authors and do not represent views of the Institute or the U.S. Department of Education.
1.
Although much of the literature focuses on fixed effects, a variety of studies have modeled teacher effects as random (Corcoran, Jennings, & Beveridge, 2011; Konstantopoulos & Chung, 2011; Nye, Konstantopoulos, & Hedges, 2004; Papay, 2011). A consideration of the differences between the two can be found elsewhere (McCaffrey, Lockwood, Koretz, & Hamilton, 2003, p. 63). Fixed-effect estimates of teacher effects were correlated at 0.99 with random-effect estimates for the baseline model in the math data.
2.
Under the biennial testing approach, nontested grades preclude estimation of the value-added (VA) effects for the nontested teachers under standard conditions. In order to test the need for the lagged-year teacher effect in Equation (2), we also estimated ![]() , which includes a control variable for lagged teacher effect (τj′[y – 1]). Primarily, inclusion of the prior-year teacher effects is to protect against bias that may be imposed in the model. In practice, we do not suggest that the VA estimates recovered from the nontested years be used for evaluative purposes. Their inclusion in the model is only for the purpose of potentially strengthening the estimates for the current-year teacher.
, which includes a control variable for lagged teacher effect (τj′[y – 1]). Primarily, inclusion of the prior-year teacher effects is to protect against bias that may be imposed in the model. In practice, we do not suggest that the VA estimates recovered from the nontested years be used for evaluative purposes. Their inclusion in the model is only for the purpose of potentially strengthening the estimates for the current-year teacher.
The results from this equation indicated that there is little bias introduced into the estimates for the biennial testing approach when the lag-year teacher is excluded from the model. The model parameters were nearly identical across all subjects with and without the control for the lag-year teacher, but there was slightly more teacher and residual variance. These results indicate that our original specification of the biennial approach presented in Equation (2) does not need the τj′(y – 1) control variable to protect against bias, but the results are less precise. As we would never suggest that estimates for teachers whose students were nontested be used for evaluation purposes, we eliminate findings from ![]() from our analysis.
from our analysis.
3.
We find prior achievement to be the largest positive predictor of student achievement in the current year, with a parameter estimate of about 0.7, which is comparable to the estimate of 0.8 found in Briggs and Domingue (2011). We suppose that the weaker relationship between prior achievement and current achievement to be due to the fact that Briggs and Domingue used a nonstandard (and potentially problematic; see Briggs & Domingue, 2011, pp. 23–24) instrumental variables approach for the purposes of replicating prior work (Buddin, 2010).
4.
We also consider rank correlations and found similar relationships. Rank correlations were consistently 0.01 to 0.02 lower than Pearson correlations.
5.
We also investigated the relationship between VA scores and the proportion of English language learner (ELL) students in the class. The correlations across all testing approaches and all models were <|0.10|.
6.
We also considered the mean proportion of ELLs in classes for teachers who moved up or down in classification bins as evidence of potential bias. The means for both groups were within 0.05 of each other with both reduced testing scenarios, indicating little evidence of potential bias.
Authors
JESSICA L. ALZEN is a doctoral candidate at University of Colorado Boulder. Her research interests include program evaluation, methods of teacher evaluation, education accountability, and education policy.
ERIN M. FAHLE is a doctoral candidate at Stanford University affiliated with the Stanford Center for Education Policy Analysis. Her research interests are education policy, gender inequality in education, state accountability testing, and quasi-experimental methods.
BENJAMIN W. DOMINGUE is an assistant professor at the Stanford Graduate School of Education. He is interested in psychometrics and sociogenomics.
References
Supplementary Material
Please find the following supplemental material available below.
For Open Access articles published under a Creative Commons License, all supplemental material carries the same license as the article it is associated with.
For non-Open Access articles published, all supplemental material carries a non-exclusive license, and permission requests for re-use of supplemental material or any part of supplemental material shall be sent directly to the copyright owner as specified in the copyright notice associated with the article.